Zip Codes with the Highest Percentage of Households Without a Vehicle in Moultrie, GA
RELATED REPORTS & OPTIONS
Households without a Cars
Moultrie
Compare Zip Codes
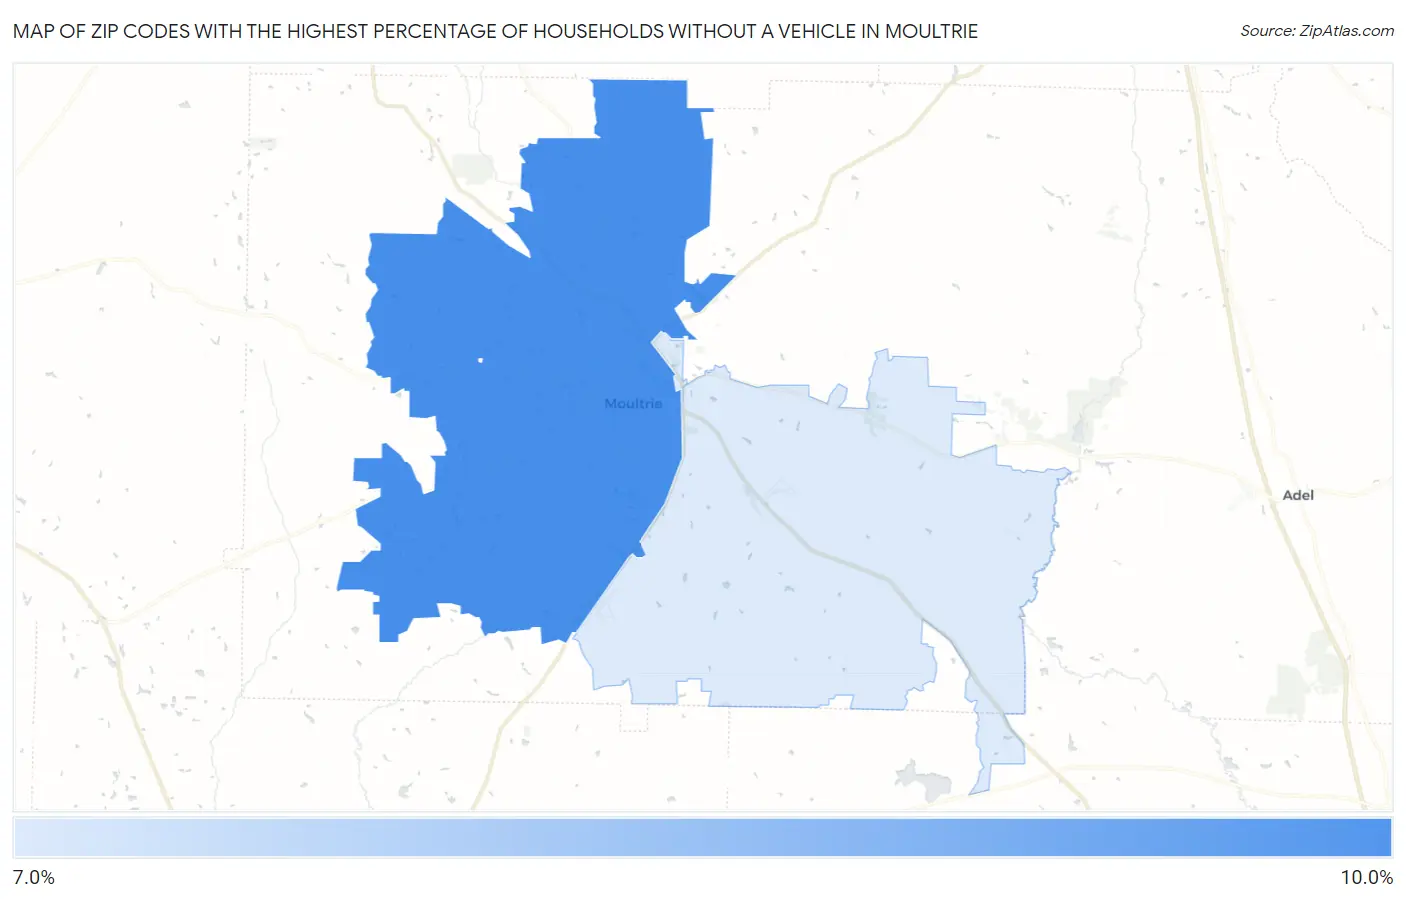
Map of Zip Codes with the Highest Percentage of Households Without a Vehicle in Moultrie
7.2%
9.7%
Zip Codes with the Highest Percentage of Households Without a Vehicle in Moultrie, GA
| Zip Code | Housholds Without a Car | vs State | vs National | |
| 1. | 31768 | 9.7% | 6.0%(+3.70)#123 | 8.3%(+1.40)#5,111 |
| 2. | 31788 | 7.2% | 6.0%(+1.20)#211 | 8.3%(-1.10)#8,248 |
1
Common Questions
What are the Top Zip Codes with the Highest Percentage of Households Without a Vehicle in Moultrie, GA?
Top Zip Codes with the Highest Percentage of Households Without a Vehicle in Moultrie, GA are:
What zip code has the Highest Percentage of Households Without a Vehicle in Moultrie, GA?
31768 has the Highest Percentage of Households Without a Vehicle in Moultrie, GA with 9.7%.
What is the Percentage of Households Without a Vehicle in Moultrie, GA?
Percentage of Households Without a Vehicle in Moultrie is 14.5%.
What is the Percentage of Households Without a Vehicle in Georgia?
Percentage of Households Without a Vehicle in Georgia is 6.0%.
What is the Percentage of Households Without a Vehicle in the United States?
Percentage of Households Without a Vehicle in the United States is 8.3%.