Zip Codes with the Most Immigrants from Eastern Asia in Bella Vista, AR
RELATED REPORTS & OPTIONS
Eastern Asia
Bella Vista
Compare Zip Codes
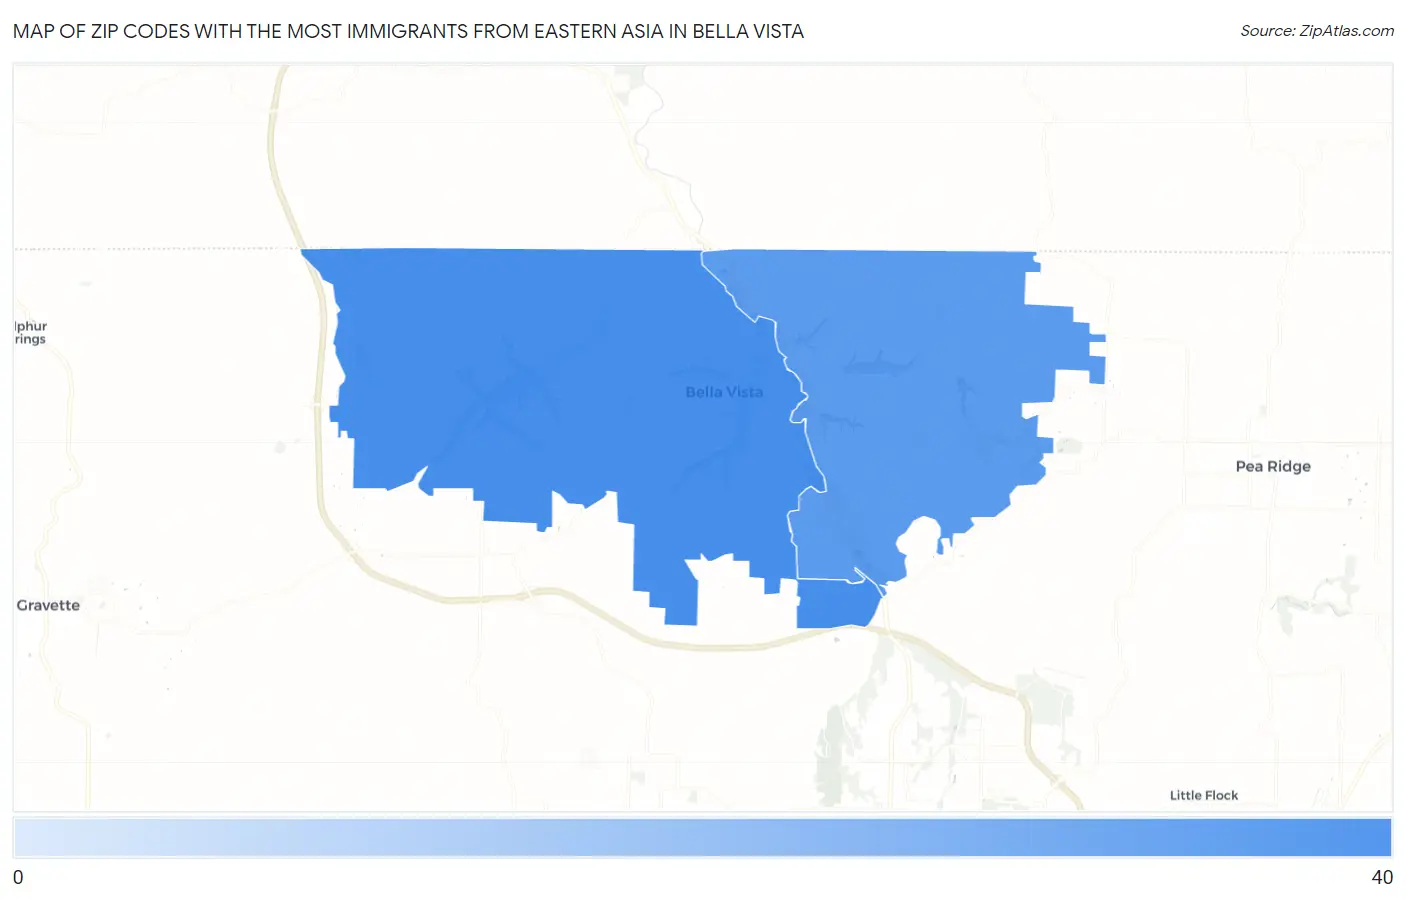
Map of Zip Codes with the Most Immigrants from Eastern Asia in Bella Vista
22
37
Zip Codes with the Most Immigrants from Eastern Asia in Bella Vista, AR
| Zip Code | Eastern Asia | vs State | vs National | |
| 1. | 72715 | 37 | 6,517(0.57%)#47 | 4,223,726(0.00%)#8,010 |
| 2. | 72714 | 22 | 6,517(0.34%)#63 | 4,223,726(0.00%)#9,297 |
1
Common Questions
What are the Top Zip Codes with the Most Immigrants from Eastern Asia in Bella Vista, AR?
Top Zip Codes with the Most Immigrants from Eastern Asia in Bella Vista, AR are:
What zip code has the Most Immigrants from Eastern Asia in Bella Vista, AR?
72715 has the Most Immigrants from Eastern Asia in Bella Vista, AR with 37.
What is the Total Immigrants from Eastern Asia in Bella Vista, AR?
Total Immigrants from Eastern Asia in Bella Vista is 59.
What is the Total Immigrants from Eastern Asia in Arkansas?
Total Immigrants from Eastern Asia in Arkansas is 6,517.
What is the Total Immigrants from Eastern Asia in the United States?
Total Immigrants from Eastern Asia in the United States is 4,223,726.