Chester, VA Map & Demographics
Chester Map
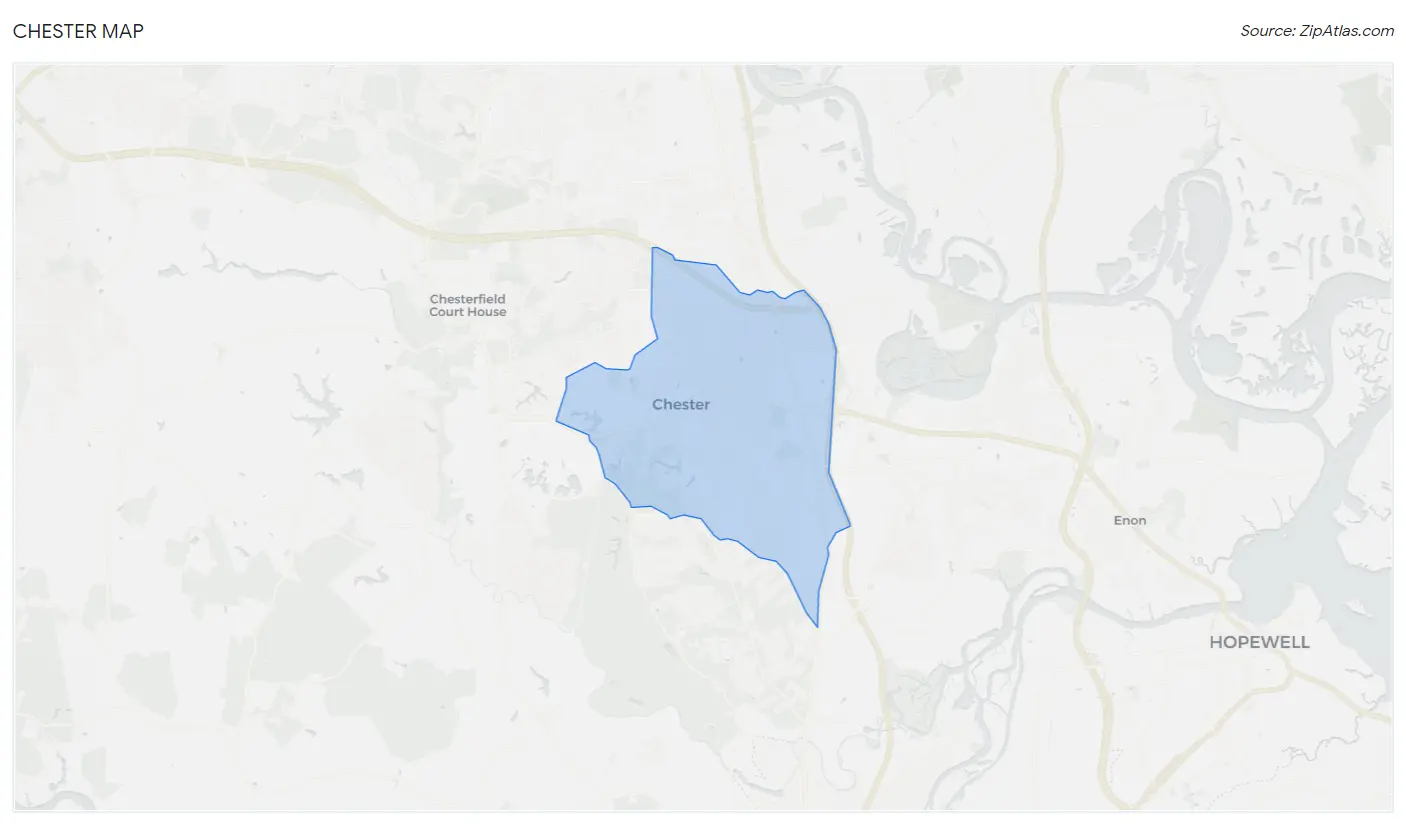
Chester Overview
$43,510
PER CAPITA INCOME
$106,545
AVG FAMILY INCOME
$87,242
AVG HOUSEHOLD INCOME
24.7%
WAGE / INCOME GAP [ % ]
75.3¢/ $1
WAGE / INCOME GAP [ $ ]
0.43
INEQUALITY / GINI INDEX
23,068
TOTAL POPULATION
11,554
MALE POPULATION
11,514
FEMALE POPULATION
100.35
MALES / 100 FEMALES
99.65
FEMALES / 100 MALES
40.6
MEDIAN AGE
3.0
AVG FAMILY SIZE
2.6
AVG HOUSEHOLD SIZE
12,406
LABOR FORCE [ PEOPLE ]
66.6%
PERCENT IN LABOR FORCE
3.5%
UNEMPLOYMENT RATE
Chester Area Codes
Income in Chester
Income Overview in Chester
Per Capita Income in Chester is $43,510, while median incomes of families and households are $106,545 and $87,242 respectively.
| Characteristic | Number | Measure |
| Per Capita Income | 23,068 | $43,510 |
| Median Family Income | 6,421 | $106,545 |
| Mean Family Income | 6,421 | $121,631 |
| Median Household Income | 8,989 | $87,242 |
| Mean Household Income | 8,989 | $106,144 |
| Income Deficit | 6,421 | $0 |
| Wage / Income Gap (%) | 23,068 | 24.69% |
| Wage / Income Gap ($) | 23,068 | 75.31¢ per $1 |
| Gini / Inequality Index | 23,068 | 0.43 |
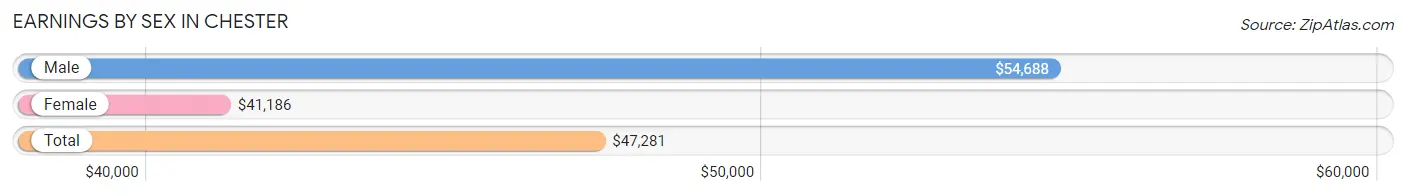
Earnings by Sex in Chester
Average Earnings in Chester are $47,281, $54,688 for men and $41,186 for women, a difference of 24.7%.
| Sex | Number | Average Earnings |
| Male | 6,608 (52.2%) | $54,688 |
| Female | 6,047 (47.8%) | $41,186 |
| Total | 12,655 (100.0%) | $47,281 |
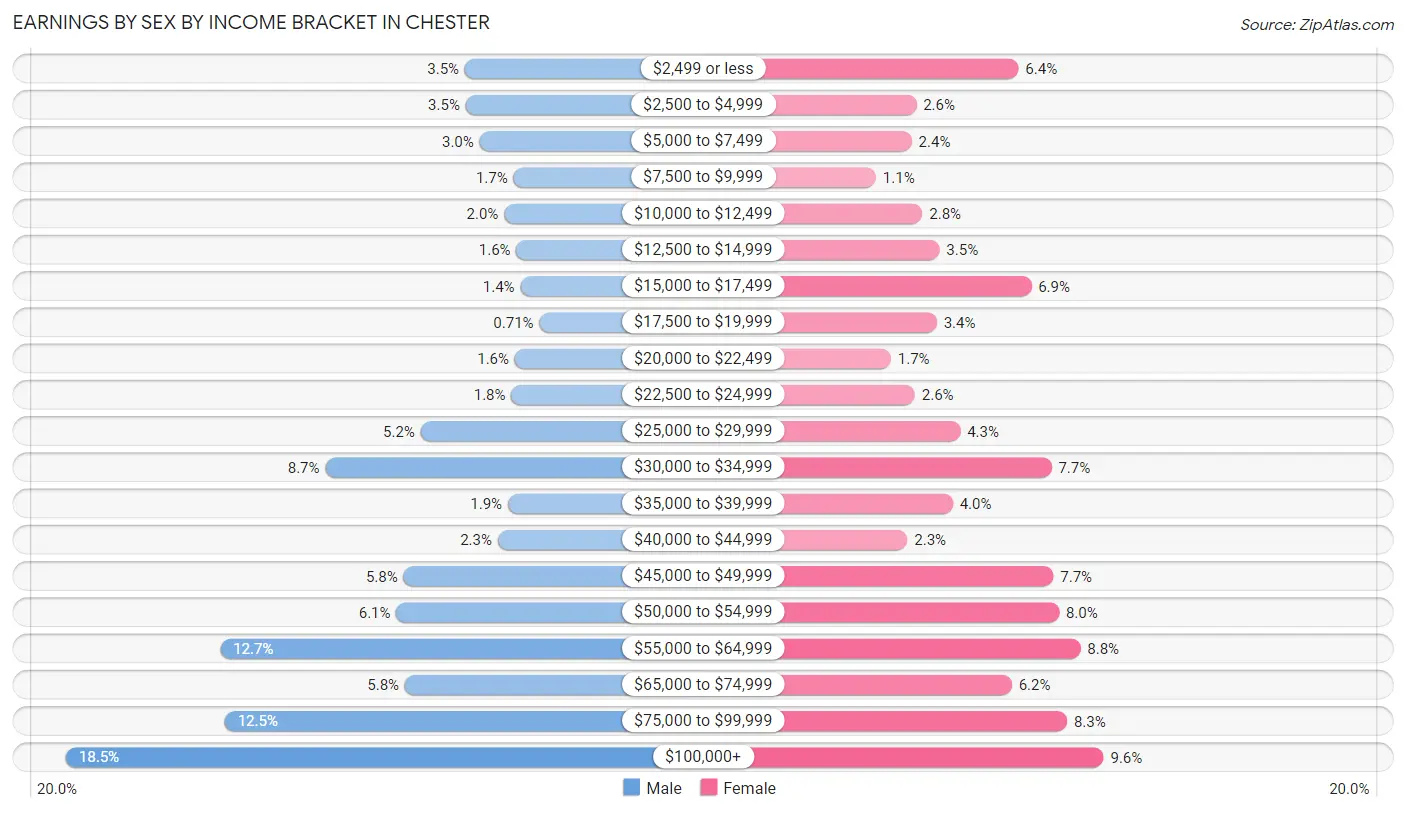
Earnings by Sex by Income Bracket in Chester
The most common earnings brackets in Chester are $100,000+ for men (1,219 | 18.4%) and $100,000+ for women (582 | 9.6%).
| Income | Male | Female |
| $2,499 or less | 231 (3.5%) | 389 (6.4%) |
| $2,500 to $4,999 | 229 (3.5%) | 157 (2.6%) |
| $5,000 to $7,499 | 195 (2.9%) | 147 (2.4%) |
| $7,500 to $9,999 | 111 (1.7%) | 66 (1.1%) |
| $10,000 to $12,499 | 134 (2.0%) | 171 (2.8%) |
| $12,500 to $14,999 | 104 (1.6%) | 210 (3.5%) |
| $15,000 to $17,499 | 94 (1.4%) | 418 (6.9%) |
| $17,500 to $19,999 | 47 (0.7%) | 204 (3.4%) |
| $20,000 to $22,499 | 108 (1.6%) | 100 (1.7%) |
| $22,500 to $24,999 | 116 (1.8%) | 154 (2.5%) |
| $25,000 to $29,999 | 341 (5.2%) | 257 (4.3%) |
| $30,000 to $34,999 | 577 (8.7%) | 464 (7.7%) |
| $35,000 to $39,999 | 125 (1.9%) | 240 (4.0%) |
| $40,000 to $44,999 | 150 (2.3%) | 137 (2.3%) |
| $45,000 to $49,999 | 383 (5.8%) | 468 (7.7%) |
| $50,000 to $54,999 | 401 (6.1%) | 481 (8.0%) |
| $55,000 to $64,999 | 837 (12.7%) | 529 (8.7%) |
| $65,000 to $74,999 | 380 (5.8%) | 374 (6.2%) |
| $75,000 to $99,999 | 826 (12.5%) | 499 (8.3%) |
| $100,000+ | 1,219 (18.4%) | 582 (9.6%) |
| Total | 6,608 (100.0%) | 6,047 (100.0%) |
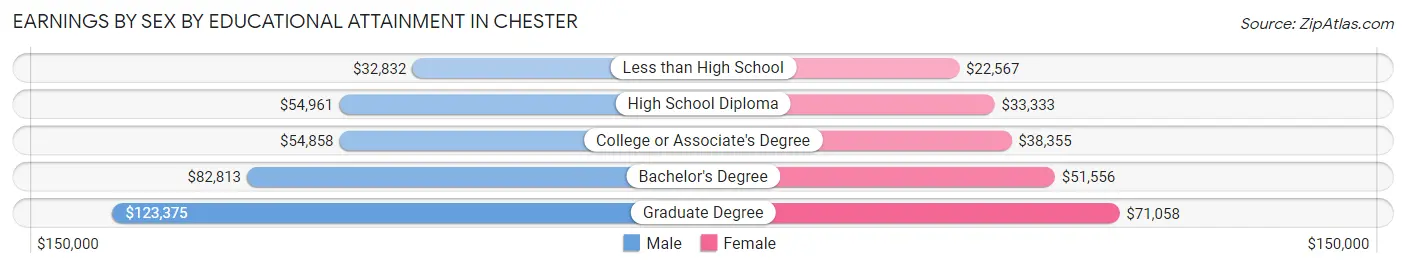
Earnings by Sex by Educational Attainment in Chester
Average earnings in Chester are $59,849 for men and $46,156 for women, a difference of 22.9%. Men with an educational attainment of graduate degree enjoy the highest average annual earnings of $123,375, while those with less than high school education earn the least with $32,832. Women with an educational attainment of graduate degree earn the most with the average annual earnings of $71,058, while those with less than high school education have the smallest earnings of $22,567.
| Educational Attainment | Male Income | Female Income |
| Less than High School | $32,832 | $22,567 |
| High School Diploma | $54,961 | $33,333 |
| College or Associate's Degree | $54,858 | $38,355 |
| Bachelor's Degree | $82,813 | $51,556 |
| Graduate Degree | $123,375 | $71,058 |
| Total | $59,849 | $46,156 |
Family Income in Chester
Family Income Brackets in Chester
According to the Chester family income data, there are 1,734 families falling into the $100,000 to $149,999 income range, which is the most common income bracket and makes up 27.0% of all families. Conversely, the $15,000 to $24,999 income bracket is the least frequent group with only 32 families (0.5%) belonging to this category.
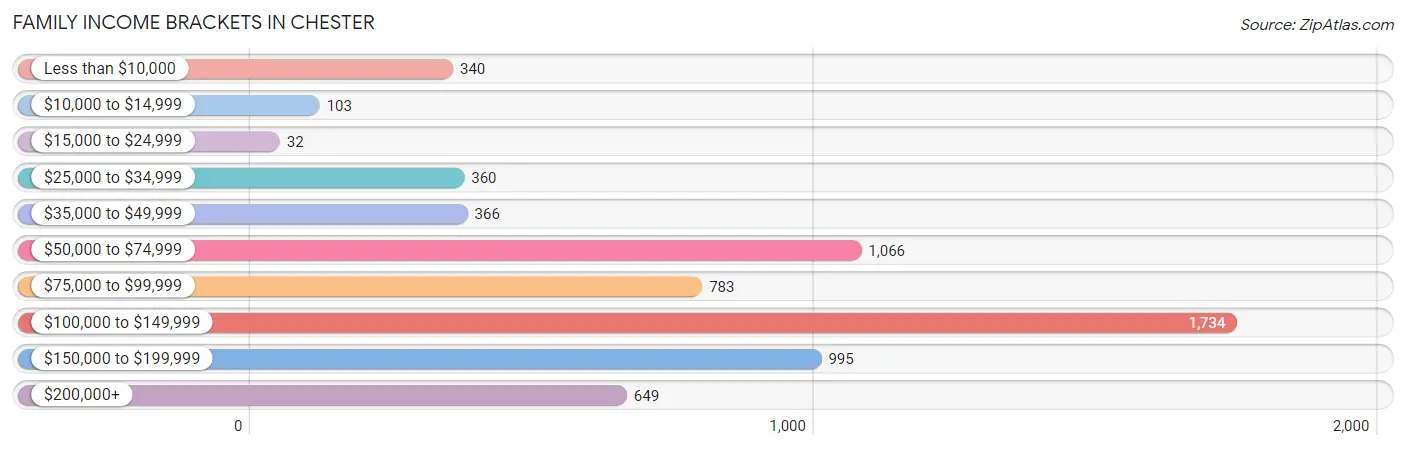
| Income Bracket | # Families | % Families |
| Less than $10,000 | 340 | 5.3% |
| $10,000 to $14,999 | 103 | 1.6% |
| $15,000 to $24,999 | 32 | 0.5% |
| $25,000 to $34,999 | 360 | 5.6% |
| $35,000 to $49,999 | 366 | 5.7% |
| $50,000 to $74,999 | 1,066 | 16.6% |
| $75,000 to $99,999 | 783 | 12.2% |
| $100,000 to $149,999 | 1,734 | 27.0% |
| $150,000 to $199,999 | 995 | 15.5% |
| $200,000+ | 649 | 10.1% |
Family Income by Famaliy Size in Chester
3-person families (1,455 | 22.7%) account for the highest median family income in Chester with $122,644 per family, while 2-person families (3,267 | 50.9%) have the highest median income of $52,003 per family member.
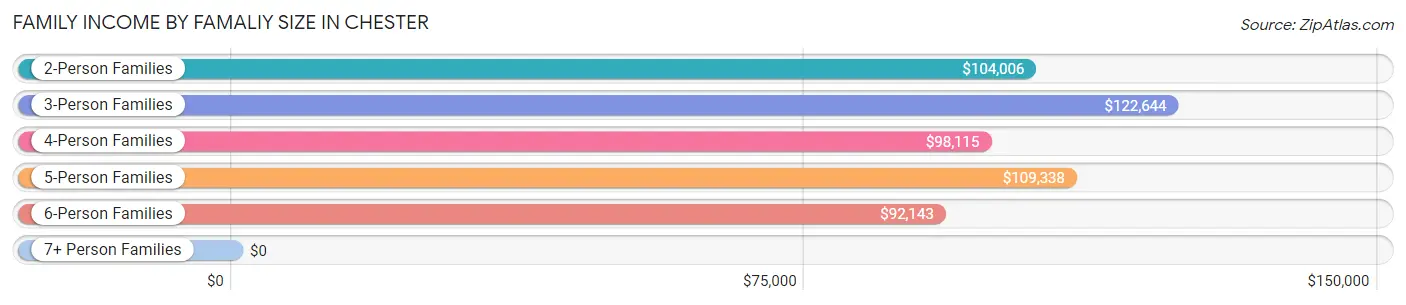
| Income Bracket | # Families | Median Income |
| 2-Person Families | 3,267 (50.9%) | $104,006 |
| 3-Person Families | 1,455 (22.7%) | $122,644 |
| 4-Person Families | 1,008 (15.7%) | $98,115 |
| 5-Person Families | 465 (7.2%) | $109,338 |
| 6-Person Families | 136 (2.1%) | $92,143 |
| 7+ Person Families | 90 (1.4%) | $0 |
| Total | 6,421 (100.0%) | $106,545 |
Family Income by Number of Earners in Chester
The median family income in Chester is $106,545, with families comprising 3+ earners (872) having the highest median family income of $134,739, while families with 1 earner (2,023) have the lowest median family income of $64,800, accounting for 13.6% and 31.5% of families, respectively.
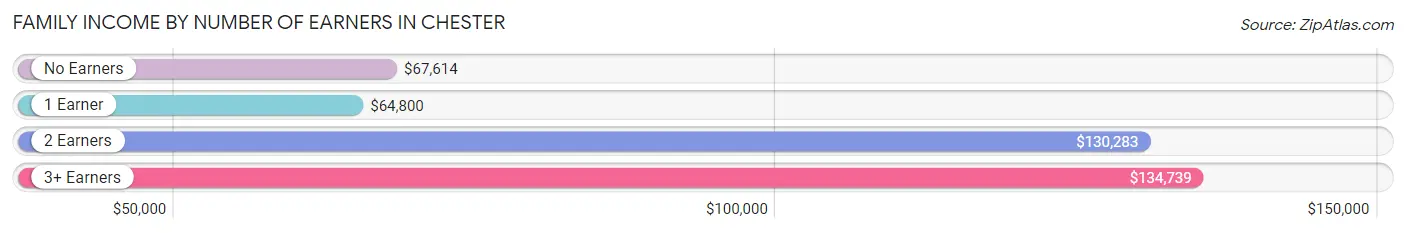
| Number of Earners | # Families | Median Income |
| No Earners | 921 (14.3%) | $67,614 |
| 1 Earner | 2,023 (31.5%) | $64,800 |
| 2 Earners | 2,605 (40.6%) | $130,283 |
| 3+ Earners | 872 (13.6%) | $134,739 |
| Total | 6,421 (100.0%) | $106,545 |
Household Income in Chester
Household Income Brackets in Chester
With 2,085 households falling in the category, the $100,000 to $149,999 income range is the most frequent in Chester, accounting for 23.2% of all households. In contrast, only 243 households (2.7%) fall into the $10,000 to $14,999 income bracket, making it the least populous group.
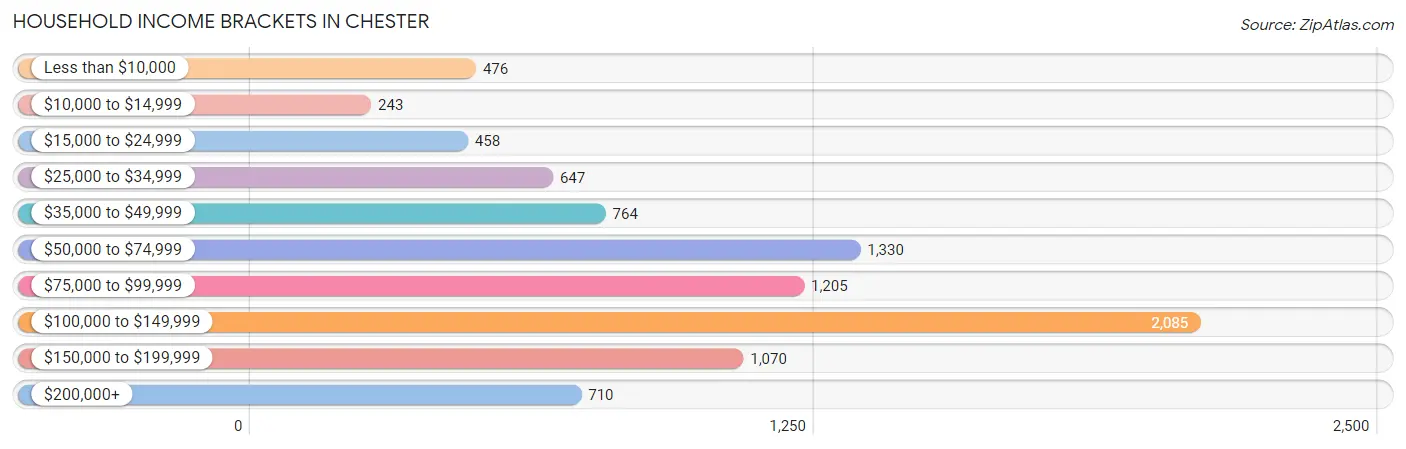
| Income Bracket | # Households | % Households |
| Less than $10,000 | 476 | 5.3% |
| $10,000 to $14,999 | 243 | 2.7% |
| $15,000 to $24,999 | 458 | 5.1% |
| $25,000 to $34,999 | 647 | 7.2% |
| $35,000 to $49,999 | 764 | 8.5% |
| $50,000 to $74,999 | 1,330 | 14.8% |
| $75,000 to $99,999 | 1,205 | 13.4% |
| $100,000 to $149,999 | 2,085 | 23.2% |
| $150,000 to $199,999 | 1,070 | 11.9% |
| $200,000+ | 710 | 7.9% |
Household Income by Householder Age in Chester
The median household income in Chester is $87,242, with the highest median household income of $116,522 found in the 45 to 64 years age bracket for the primary householder. A total of 3,974 households (44.2%) fall into this category. Meanwhile, the 15 to 24 years age bracket for the primary householder has the lowest median household income of $40,455, with 128 households (1.4%) in this group.
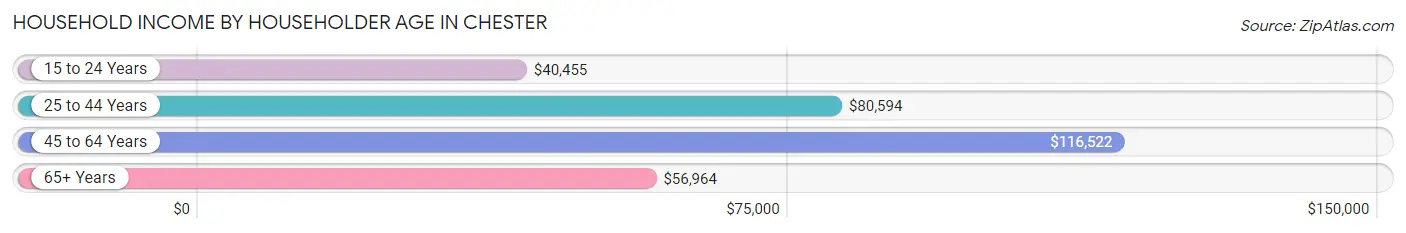
| Income Bracket | # Households | Median Income |
| 15 to 24 Years | 128 (1.4%) | $40,455 |
| 25 to 44 Years | 2,529 (28.1%) | $80,594 |
| 45 to 64 Years | 3,974 (44.2%) | $116,522 |
| 65+ Years | 2,358 (26.2%) | $56,964 |
| Total | 8,989 (100.0%) | $87,242 |
Poverty in Chester
Income Below Poverty by Sex and Age in Chester
With 7.7% poverty level for males and 11.2% for females among the residents of Chester, 5 year old males and under 5 year old females are the most vulnerable to poverty, with 33 males (30.8%) and 104 females (22.8%) in their respective age groups living below the poverty level.
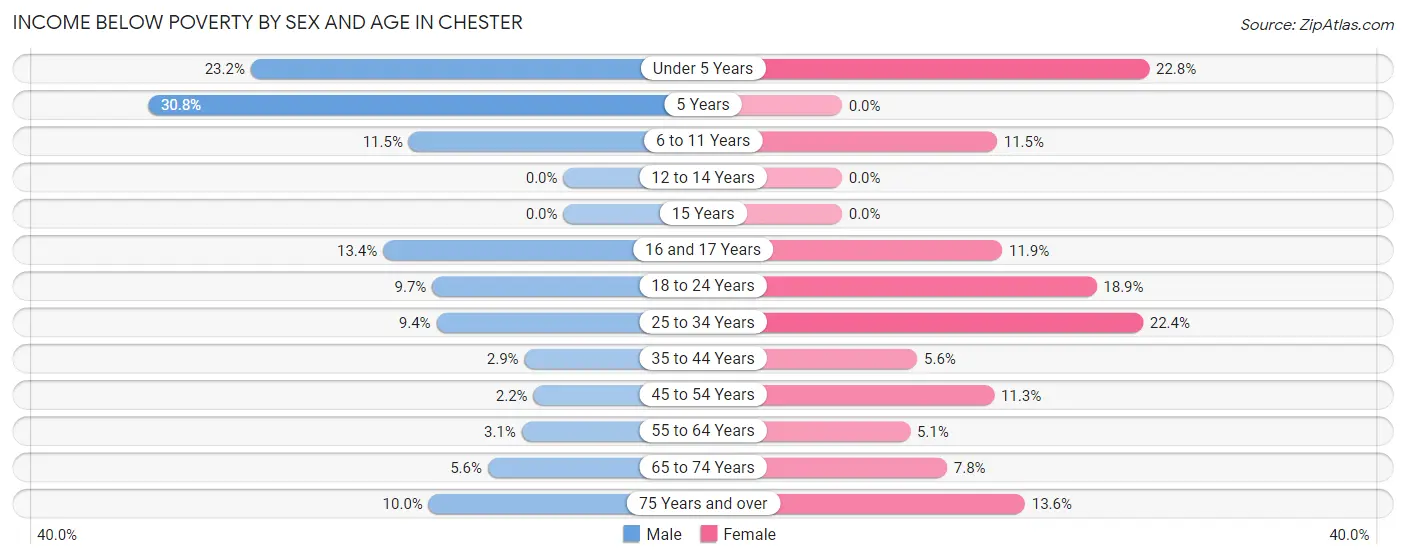
| Age Bracket | Male | Female |
| Under 5 Years | 195 (23.2%) | 104 (22.8%) |
| 5 Years | 33 (30.8%) | 0 (0.0%) |
| 6 to 11 Years | 151 (11.5%) | 58 (11.5%) |
| 12 to 14 Years | 0 (0.0%) | 0 (0.0%) |
| 15 Years | 0 (0.0%) | 0 (0.0%) |
| 16 and 17 Years | 47 (13.4%) | 37 (11.9%) |
| 18 to 24 Years | 103 (9.7%) | 131 (18.9%) |
| 25 to 34 Years | 131 (9.4%) | 342 (22.4%) |
| 35 to 44 Years | 40 (2.9%) | 81 (5.6%) |
| 45 to 54 Years | 37 (2.2%) | 220 (11.3%) |
| 55 to 64 Years | 48 (3.1%) | 86 (5.1%) |
| 65 to 74 Years | 47 (5.6%) | 98 (7.8%) |
| 75 Years and over | 58 (10.0%) | 125 (13.6%) |
| Total | 890 (7.7%) | 1,282 (11.2%) |
Income Above Poverty by Sex and Age in Chester
According to the poverty statistics in Chester, males aged 12 to 14 years and females aged 5 years are the age groups that are most secure financially, with 100.0% of males and 100.0% of females in these age groups living above the poverty line.
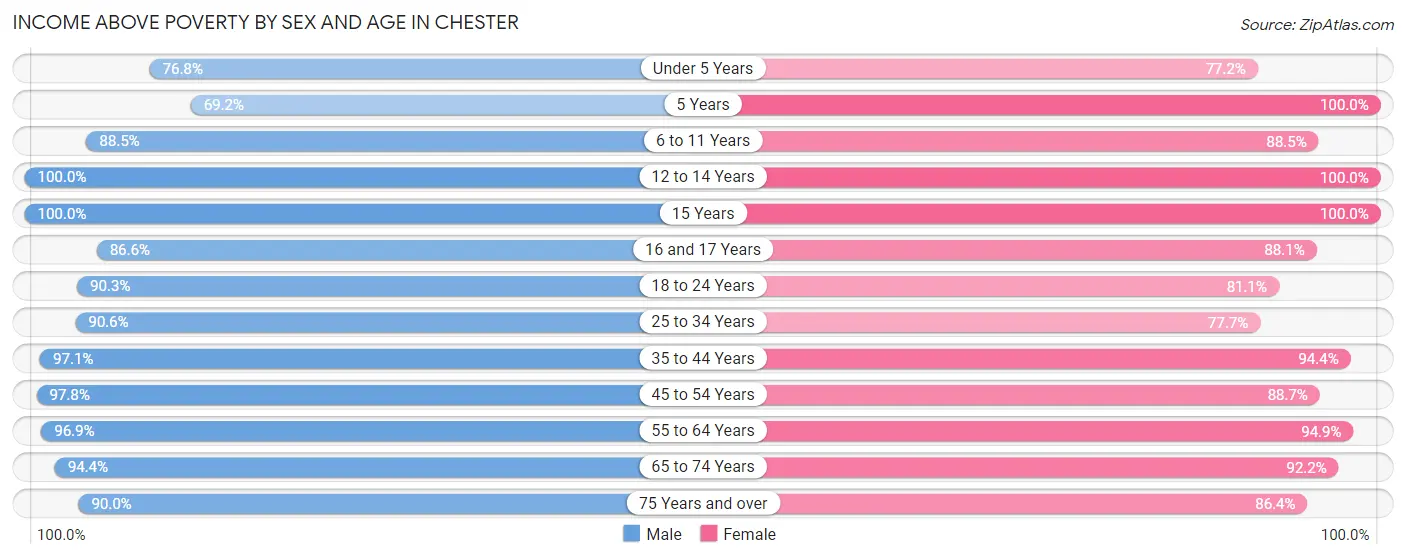
| Age Bracket | Male | Female |
| Under 5 Years | 645 (76.8%) | 352 (77.2%) |
| 5 Years | 74 (69.2%) | 55 (100.0%) |
| 6 to 11 Years | 1,164 (88.5%) | 446 (88.5%) |
| 12 to 14 Years | 312 (100.0%) | 471 (100.0%) |
| 15 Years | 160 (100.0%) | 128 (100.0%) |
| 16 and 17 Years | 304 (86.6%) | 274 (88.1%) |
| 18 to 24 Years | 954 (90.3%) | 562 (81.1%) |
| 25 to 34 Years | 1,259 (90.6%) | 1,188 (77.6%) |
| 35 to 44 Years | 1,346 (97.1%) | 1,368 (94.4%) |
| 45 to 54 Years | 1,633 (97.8%) | 1,727 (88.7%) |
| 55 to 64 Years | 1,500 (96.9%) | 1,615 (94.9%) |
| 65 to 74 Years | 791 (94.4%) | 1,158 (92.2%) |
| 75 Years and over | 522 (90.0%) | 795 (86.4%) |
| Total | 10,664 (92.3%) | 10,139 (88.8%) |
Income Below Poverty Among Married-Couple Families in Chester
The poverty statistics for married-couple families in Chester show that 3.5% or 154 of the total 4,453 families live below the poverty line. Families with 5 or more children have the highest poverty rate of 34.4%, comprising of 31 families. On the other hand, families with 3 or 4 children have the lowest poverty rate of 0.0%, which includes 0 families.
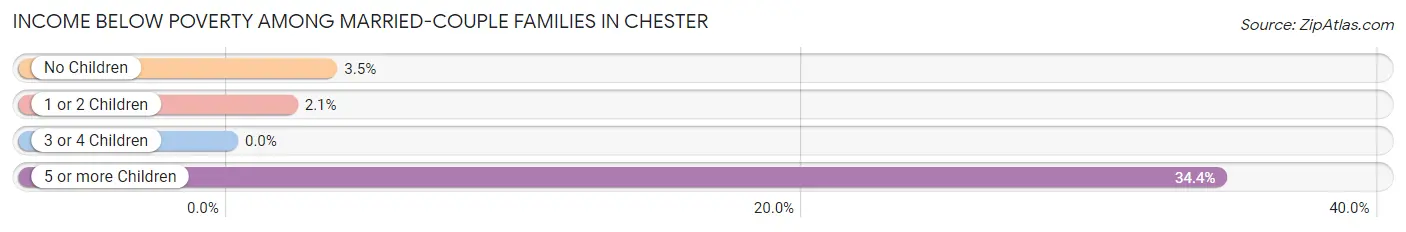
| Children | Above Poverty | Below Poverty |
| No Children | 2,789 (96.5%) | 100 (3.5%) |
| 1 or 2 Children | 1,085 (97.9%) | 23 (2.1%) |
| 3 or 4 Children | 366 (100.0%) | 0 (0.0%) |
| 5 or more Children | 59 (65.6%) | 31 (34.4%) |
| Total | 4,299 (96.5%) | 154 (3.5%) |
Income Below Poverty Among Single-Parent Households in Chester
According to the poverty data in Chester, 1.5% or 8 single-father households and 22.3% or 321 single-mother households are living below the poverty line. Among single-father households, those with no children have the highest poverty rate, with 8 households (4.7%) experiencing poverty. Likewise, among single-mother households, those with 3 or 4 children have the highest poverty rate, with 19 households (54.3%) falling below the poverty line.
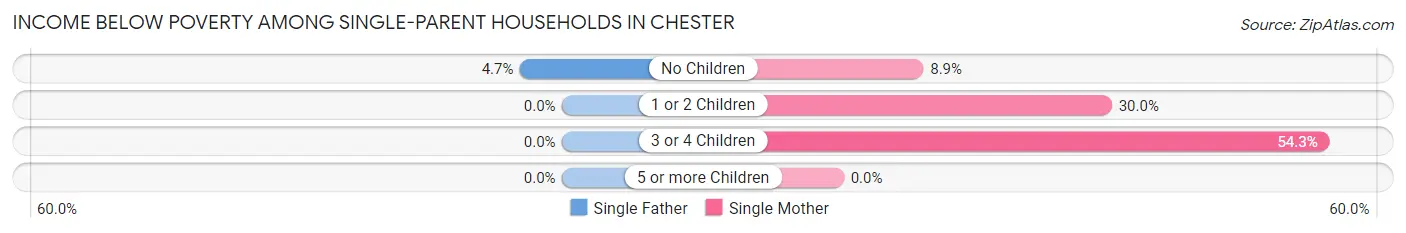
| Children | Single Father | Single Mother |
| No Children | 8 (4.7%) | 50 (8.9%) |
| 1 or 2 Children | 0 (0.0%) | 252 (30.0%) |
| 3 or 4 Children | 0 (0.0%) | 19 (54.3%) |
| 5 or more Children | 0 (0.0%) | 0 (0.0%) |
| Total | 8 (1.5%) | 321 (22.3%) |
Income Below Poverty Among Married-Couple vs Single-Parent Households in Chester
The poverty data for Chester shows that 154 of the married-couple family households (3.5%) and 329 of the single-parent households (16.7%) are living below the poverty level. Within the married-couple family households, those with 5 or more children have the highest poverty rate, with 31 households (34.4%) falling below the poverty line. Among the single-parent households, those with 1 or 2 children have the highest poverty rate, with 252 household (22.1%) living below poverty.
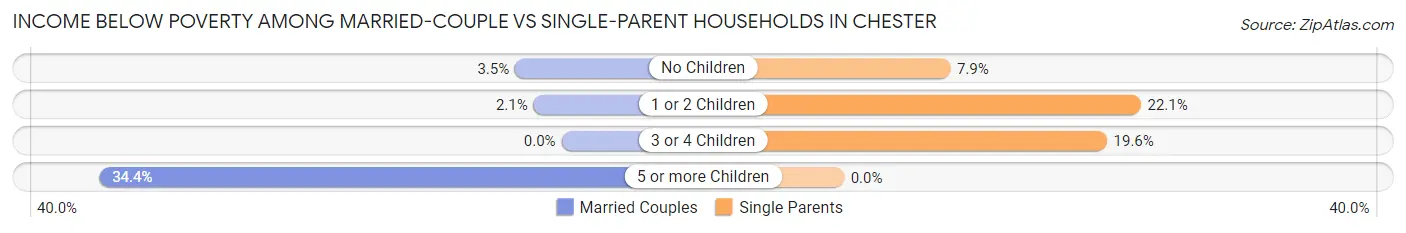
| Children | Married-Couple Families | Single-Parent Households |
| No Children | 100 (3.5%) | 58 (7.9%) |
| 1 or 2 Children | 23 (2.1%) | 252 (22.1%) |
| 3 or 4 Children | 0 (0.0%) | 19 (19.6%) |
| 5 or more Children | 31 (34.4%) | 0 (0.0%) |
| Total | 154 (3.5%) | 329 (16.7%) |
Race in Chester
The most populous races in Chester are White / Caucasian (13,811 | 59.9%), Black / African American (5,866 | 25.4%), and Hispanic or Latino (2,622 | 11.4%).
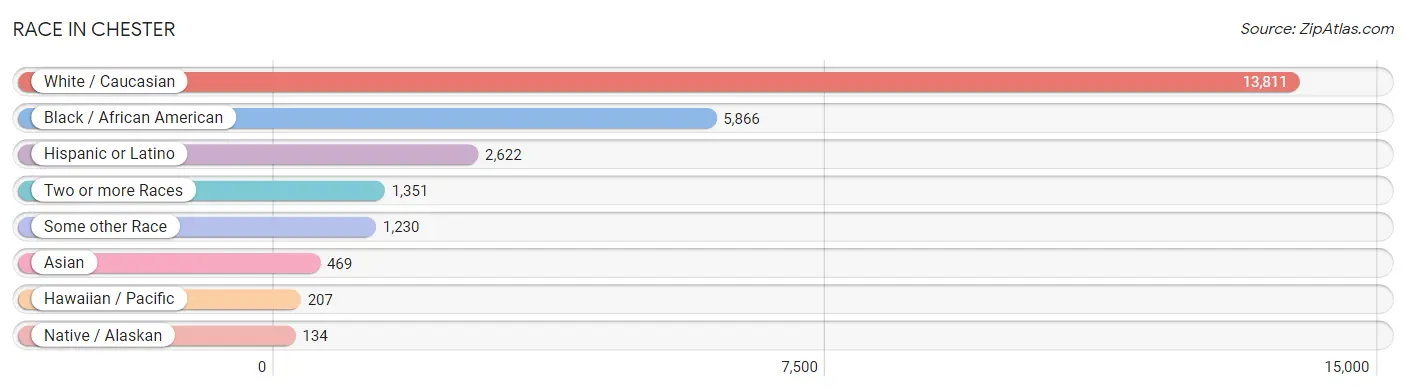
| Race | # Population | % Population |
| Asian | 469 | 2.0% |
| Black / African American | 5,866 | 25.4% |
| Hawaiian / Pacific | 207 | 0.9% |
| Hispanic or Latino | 2,622 | 11.4% |
| Native / Alaskan | 134 | 0.6% |
| White / Caucasian | 13,811 | 59.9% |
| Two or more Races | 1,351 | 5.9% |
| Some other Race | 1,230 | 5.3% |
| Total | 23,068 | 100.0% |
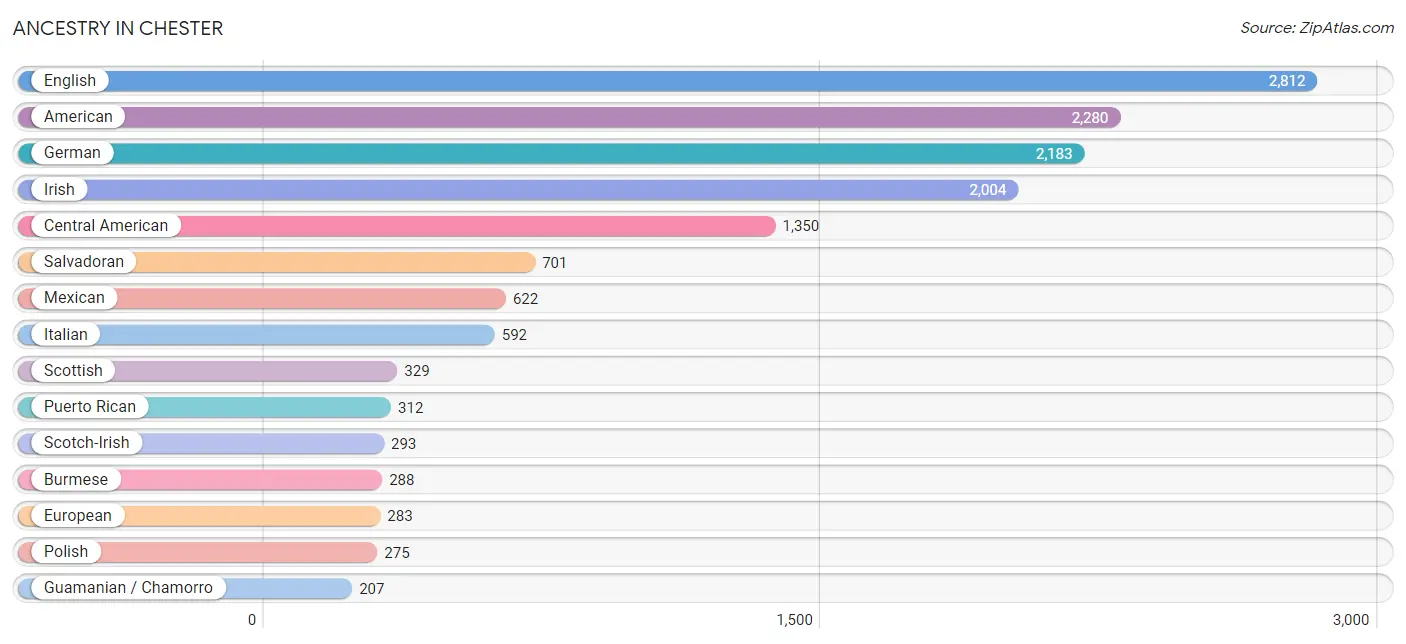
Ancestry in Chester
The most populous ancestries reported in Chester are English (2,812 | 12.2%), American (2,280 | 9.9%), German (2,183 | 9.5%), Irish (2,004 | 8.7%), and Central American (1,350 | 5.9%), together accounting for 46.1% of all Chester residents.
| Ancestry | # Population | % Population |
| African | 134 | 0.6% |
| Alsatian | 12 | 0.1% |
| American | 2,280 | 9.9% |
| Apache | 121 | 0.5% |
| Arab | 3 | 0.0% |
| Austrian | 42 | 0.2% |
| Belgian | 34 | 0.2% |
| Bhutanese | 52 | 0.2% |
| British | 70 | 0.3% |
| Burmese | 288 | 1.3% |
| Canadian | 35 | 0.2% |
| Central American | 1,350 | 5.9% |
| Central American Indian | 97 | 0.4% |
| Cherokee | 69 | 0.3% |
| Czech | 38 | 0.2% |
| Czechoslovakian | 8 | 0.0% |
| Danish | 28 | 0.1% |
| Dominican | 151 | 0.6% |
| Dutch | 114 | 0.5% |
| Eastern European | 9 | 0.0% |
| Ecuadorian | 22 | 0.1% |
| English | 2,812 | 12.2% |
| European | 283 | 1.2% |
| Finnish | 9 | 0.0% |
| French | 199 | 0.9% |
| French Canadian | 47 | 0.2% |
| German | 2,183 | 9.5% |
| Greek | 20 | 0.1% |
| Guamanian / Chamorro | 207 | 0.9% |
| Guatemalan | 193 | 0.8% |
| Honduran | 48 | 0.2% |
| Hungarian | 51 | 0.2% |
| Indian (Asian) | 70 | 0.3% |
| Iranian | 6 | 0.0% |
| Irish | 2,004 | 8.7% |
| Israeli | 44 | 0.2% |
| Italian | 592 | 2.6% |
| Jamaican | 136 | 0.6% |
| Korean | 116 | 0.5% |
| Lebanese | 3 | 0.0% |
| Lithuanian | 41 | 0.2% |
| Mexican | 622 | 2.7% |
| Nigerian | 50 | 0.2% |
| Norwegian | 47 | 0.2% |
| Osage | 9 | 0.0% |
| Panamanian | 192 | 0.8% |
| Pennsylvania German | 21 | 0.1% |
| Peruvian | 43 | 0.2% |
| Polish | 275 | 1.2% |
| Portuguese | 150 | 0.6% |
| Puerto Rican | 312 | 1.3% |
| Romanian | 45 | 0.2% |
| Russian | 28 | 0.1% |
| Salvadoran | 701 | 3.0% |
| Scandinavian | 25 | 0.1% |
| Scotch-Irish | 293 | 1.3% |
| Scottish | 329 | 1.4% |
| Slovak | 83 | 0.4% |
| South American | 100 | 0.4% |
| Spaniard | 59 | 0.3% |
| Spanish | 28 | 0.1% |
| Subsaharan African | 184 | 0.8% |
| Swedish | 90 | 0.4% |
| Swiss | 11 | 0.1% |
| Thai | 138 | 0.6% |
| Trinidadian and Tobagonian | 72 | 0.3% |
| Venezuelan | 35 | 0.2% |
| Welsh | 146 | 0.6% |
| West Indian | 22 | 0.1% | View All 69 Rows |
Immigrants in Chester
The most numerous immigrant groups reported in Chester came from Latin America (1,247 | 5.4%), Central America (1,135 | 4.9%), El Salvador (453 | 2.0%), Guatemala (362 | 1.6%), and Asia (293 | 1.3%), together accounting for 15.1% of all Chester residents.
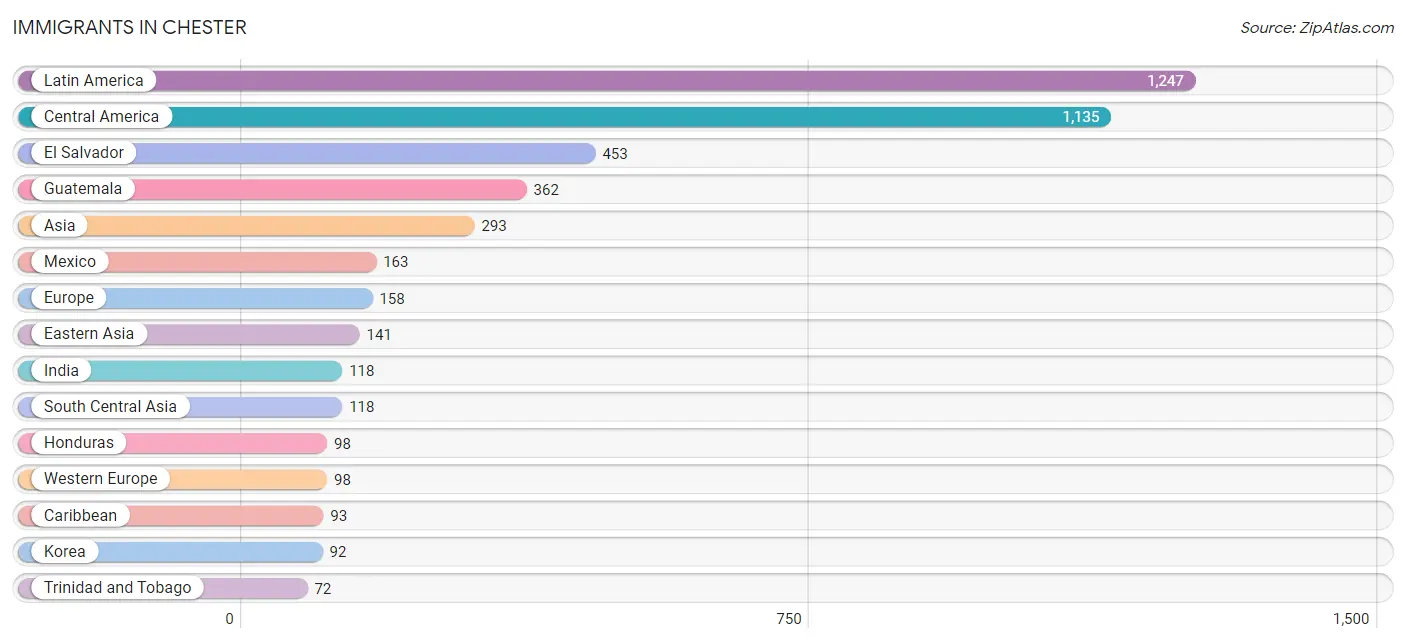
| Immigration Origin | # Population | % Population |
| Africa | 51 | 0.2% |
| Asia | 293 | 1.3% |
| Belgium | 15 | 0.1% |
| Belize | 59 | 0.3% |
| Caribbean | 93 | 0.4% |
| Central America | 1,135 | 4.9% |
| China | 40 | 0.2% |
| Eastern Asia | 141 | 0.6% |
| Eastern Europe | 51 | 0.2% |
| El Salvador | 453 | 2.0% |
| Europe | 158 | 0.7% |
| France | 19 | 0.1% |
| Germany | 64 | 0.3% |
| Guatemala | 362 | 1.6% |
| Honduras | 98 | 0.4% |
| India | 118 | 0.5% |
| Israel | 12 | 0.1% |
| Italy | 9 | 0.0% |
| Jamaica | 21 | 0.1% |
| Japan | 9 | 0.0% |
| Korea | 92 | 0.4% |
| Latin America | 1,247 | 5.4% |
| Mexico | 163 | 0.7% |
| Nigeria | 50 | 0.2% |
| Peru | 19 | 0.1% |
| Philippines | 22 | 0.1% |
| Poland | 51 | 0.2% |
| Sierra Leone | 1 | 0.0% |
| South America | 19 | 0.1% |
| South Central Asia | 118 | 0.5% |
| South Eastern Asia | 22 | 0.1% |
| Southern Europe | 9 | 0.0% |
| Trinidad and Tobago | 72 | 0.3% |
| Western Africa | 51 | 0.2% |
| Western Asia | 12 | 0.1% |
| Western Europe | 98 | 0.4% | View All 36 Rows |
Sex and Age in Chester
Sex and Age in Chester
The most populous age groups in Chester are 5 to 9 Years (1,160 | 10.0%) for men and 45 to 49 Years (1,127 | 9.8%) for women.
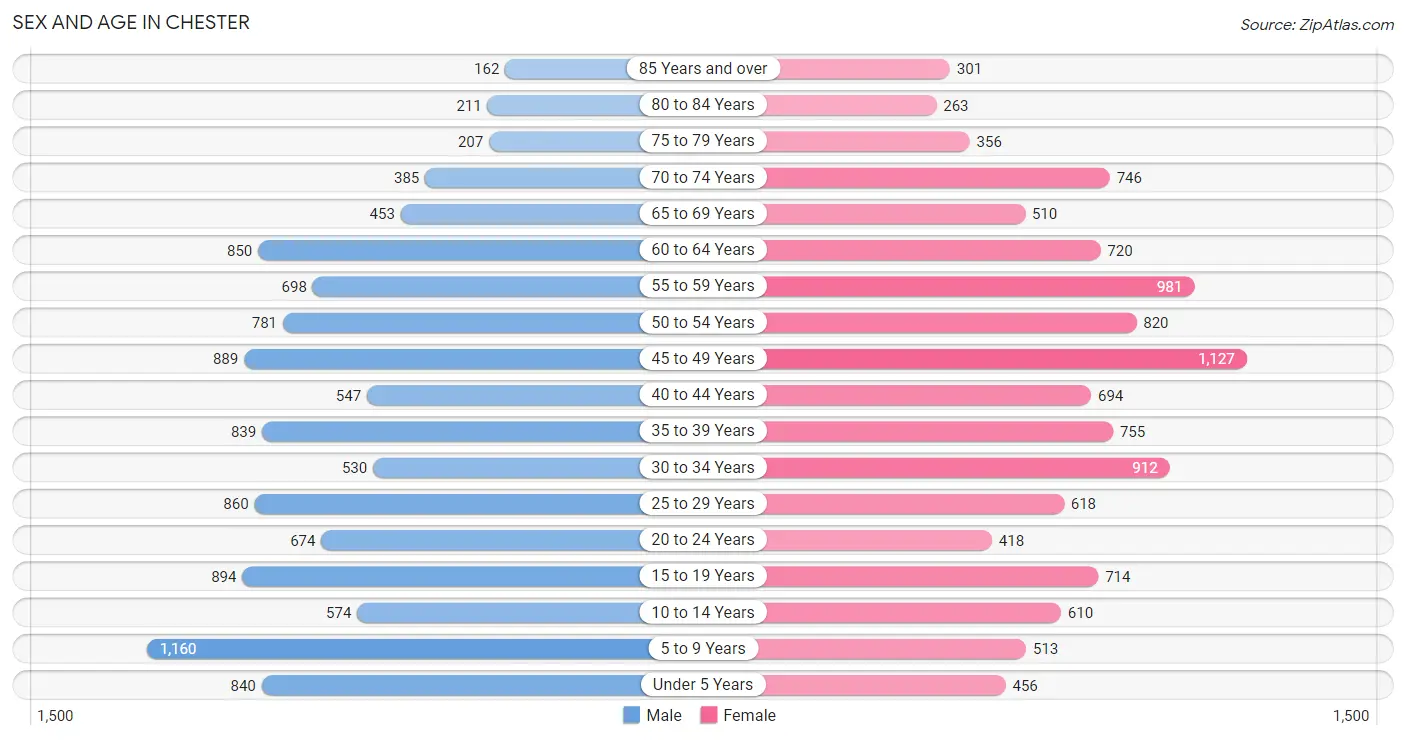
| Age Bracket | Male | Female |
| Under 5 Years | 840 (7.3%) | 456 (4.0%) |
| 5 to 9 Years | 1,160 (10.0%) | 513 (4.5%) |
| 10 to 14 Years | 574 (5.0%) | 610 (5.3%) |
| 15 to 19 Years | 894 (7.7%) | 714 (6.2%) |
| 20 to 24 Years | 674 (5.8%) | 418 (3.6%) |
| 25 to 29 Years | 860 (7.4%) | 618 (5.4%) |
| 30 to 34 Years | 530 (4.6%) | 912 (7.9%) |
| 35 to 39 Years | 839 (7.3%) | 755 (6.6%) |
| 40 to 44 Years | 547 (4.7%) | 694 (6.0%) |
| 45 to 49 Years | 889 (7.7%) | 1,127 (9.8%) |
| 50 to 54 Years | 781 (6.8%) | 820 (7.1%) |
| 55 to 59 Years | 698 (6.0%) | 981 (8.5%) |
| 60 to 64 Years | 850 (7.4%) | 720 (6.2%) |
| 65 to 69 Years | 453 (3.9%) | 510 (4.4%) |
| 70 to 74 Years | 385 (3.3%) | 746 (6.5%) |
| 75 to 79 Years | 207 (1.8%) | 356 (3.1%) |
| 80 to 84 Years | 211 (1.8%) | 263 (2.3%) |
| 85 Years and over | 162 (1.4%) | 301 (2.6%) |
| Total | 11,554 (100.0%) | 11,514 (100.0%) |
Families and Households in Chester
Median Family Size in Chester
The median family size in Chester is 3.00 persons per family, with married-couple families (4,453 | 69.4%) accounting for the largest median family size of 3.04 persons per family. On the other hand, single male/father families (530 | 8.3%) represent the smallest median family size with 2.58 persons per family.
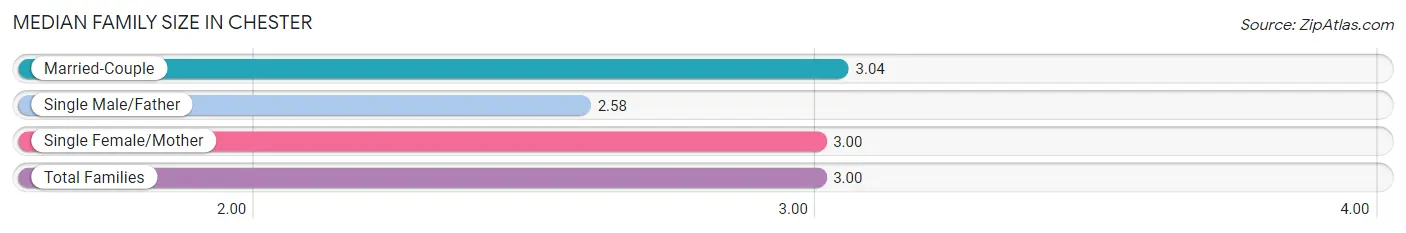
| Family Type | # Families | Family Size |
| Married-Couple | 4,453 (69.4%) | 3.04 |
| Single Male/Father | 530 (8.3%) | 2.58 |
| Single Female/Mother | 1,438 (22.4%) | 3.00 |
| Total Families | 6,421 (100.0%) | 3.00 |
Median Household Size in Chester
The median household size in Chester is 2.57 persons per household, with single female/mother households (1,438 | 16.0%) accounting for the largest median household size of 3.35 persons per household. non-family households (2,568 | 28.6%) represent the smallest median household size with 1.18 persons per household.
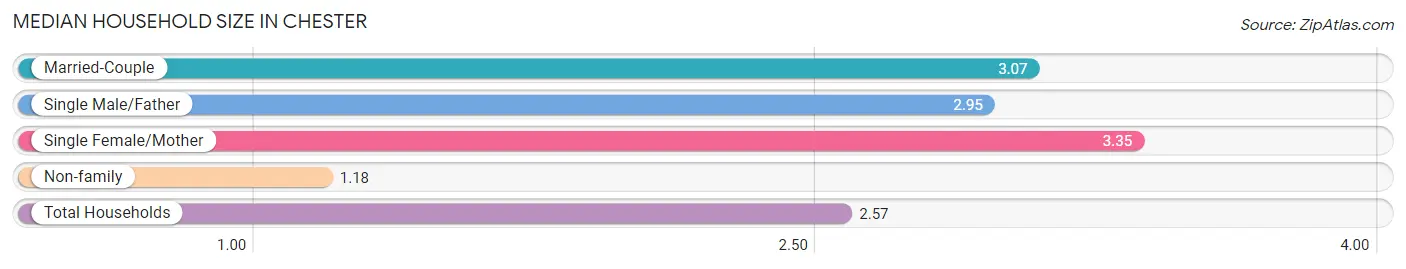
| Household Type | # Households | Household Size |
| Married-Couple | 4,453 (49.5%) | 3.07 |
| Single Male/Father | 530 (5.9%) | 2.95 |
| Single Female/Mother | 1,438 (16.0%) | 3.35 |
| Non-family | 2,568 (28.6%) | 1.18 |
| Total Households | 8,989 (100.0%) | 2.57 |
Household Size by Marriage Status in Chester
Out of a total of 8,989 households in Chester, 6,421 (71.4%) are family households, while 2,568 (28.6%) are nonfamily households. The most numerous type of family households are 2-person households, comprising 2,938, and the most common type of nonfamily households are 1-person households, comprising 2,183.
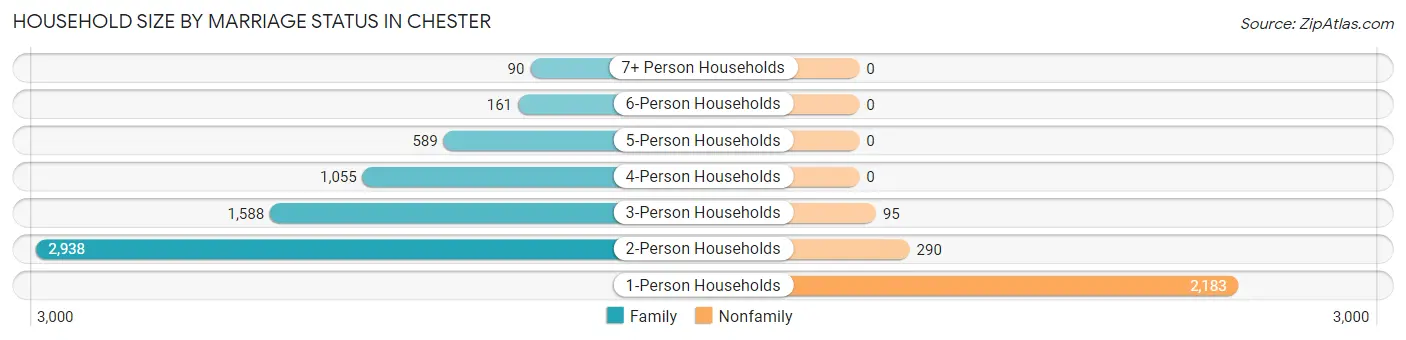
| Household Size | Family Households | Nonfamily Households |
| 1-Person Households | - | 2,183 (24.3%) |
| 2-Person Households | 2,938 (32.7%) | 290 (3.2%) |
| 3-Person Households | 1,588 (17.7%) | 95 (1.1%) |
| 4-Person Households | 1,055 (11.7%) | 0 (0.0%) |
| 5-Person Households | 589 (6.6%) | 0 (0.0%) |
| 6-Person Households | 161 (1.8%) | 0 (0.0%) |
| 7+ Person Households | 90 (1.0%) | 0 (0.0%) |
| Total | 6,421 (71.4%) | 2,568 (28.6%) |
Female Fertility in Chester
Fertility by Age in Chester
Average fertility rate in Chester is 70.0 births per 1,000 women. Women in the age bracket of 20 to 34 years have the highest fertility rate with 141.0 births per 1,000 women. Women in the age bracket of 20 to 34 years acount for 72.9% of all women with births.
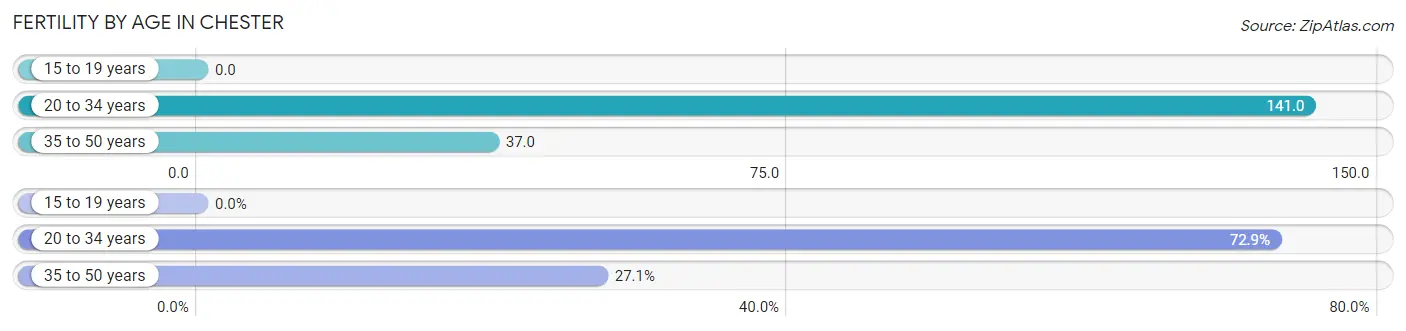
| Age Bracket | Women with Births | Births / 1,000 Women |
| 15 to 19 years | 0 (0.0%) | 0.0 |
| 20 to 34 years | 274 (72.9%) | 141.0 |
| 35 to 50 years | 102 (27.1%) | 37.0 |
| Total | 376 (100.0%) | 70.0 |
Fertility by Age by Marriage Status in Chester
48.1% of women with births (376) in Chester are married. The highest percentage of unmarried women with births falls into 35 to 50 years age bracket with 72.6% of them unmarried at the time of birth, while the lowest percentage of unmarried women with births belong to 20 to 34 years age bracket with 44.2% of them unmarried.
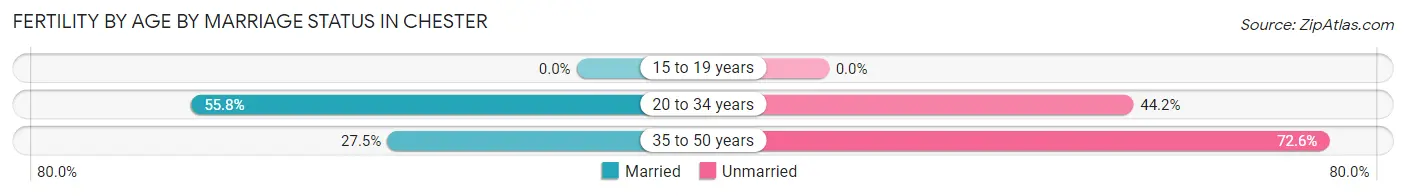
| Age Bracket | Married | Unmarried |
| 15 to 19 years | 0 (0.0%) | 0 (0.0%) |
| 20 to 34 years | 153 (55.8%) | 121 (44.2%) |
| 35 to 50 years | 28 (27.5%) | 74 (72.6%) |
| Total | 181 (48.1%) | 195 (51.9%) |
Fertility by Education in Chester
Average fertility rate in Chester is 70.0 births per 1,000 women. Women with the education attainment of bachelor's degree have the highest fertility rate of 172.0 births per 1,000 women, while women with the education attainment of college or associate's degree have the lowest fertility at 36.0 births per 1,000 women. Women with the education attainment of bachelor's degree represent 46.8% of all women with births.
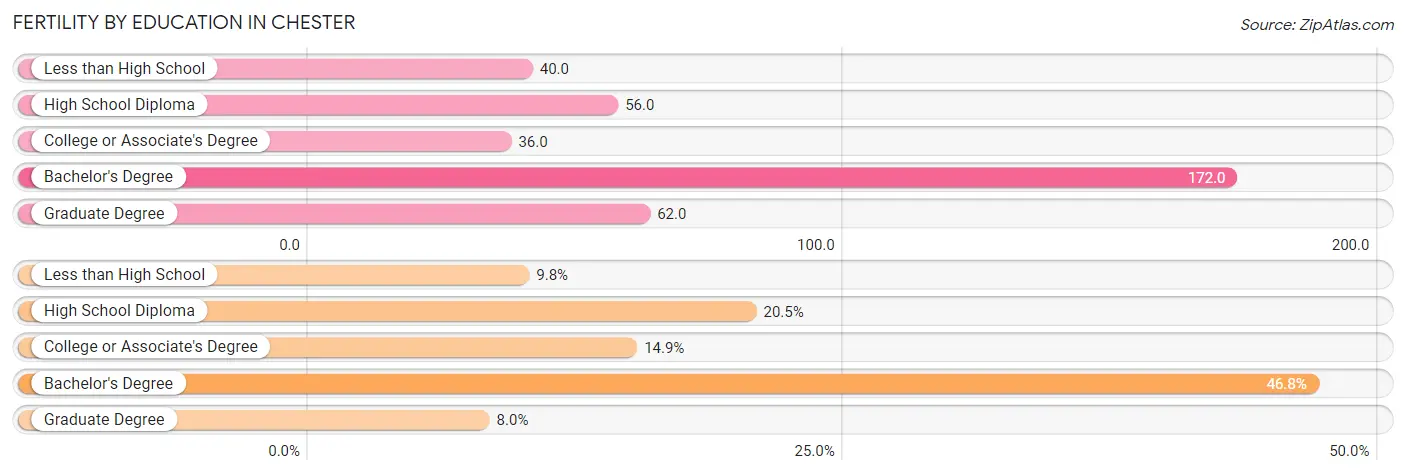
| Educational Attainment | Women with Births | Births / 1,000 Women |
| Less than High School | 37 (9.8%) | 40.0 |
| High School Diploma | 77 (20.5%) | 56.0 |
| College or Associate's Degree | 56 (14.9%) | 36.0 |
| Bachelor's Degree | 176 (46.8%) | 172.0 |
| Graduate Degree | 30 (8.0%) | 62.0 |
| Total | 376 (100.0%) | 70.0 |
Fertility by Education by Marriage Status in Chester
51.9% of women with births in Chester are unmarried. Women with the educational attainment of college or associate's degree are most likely to be married with 100.0% of them married at childbirth, while women with the educational attainment of less than high school are least likely to be married with 100.0% of them unmarried at childbirth.
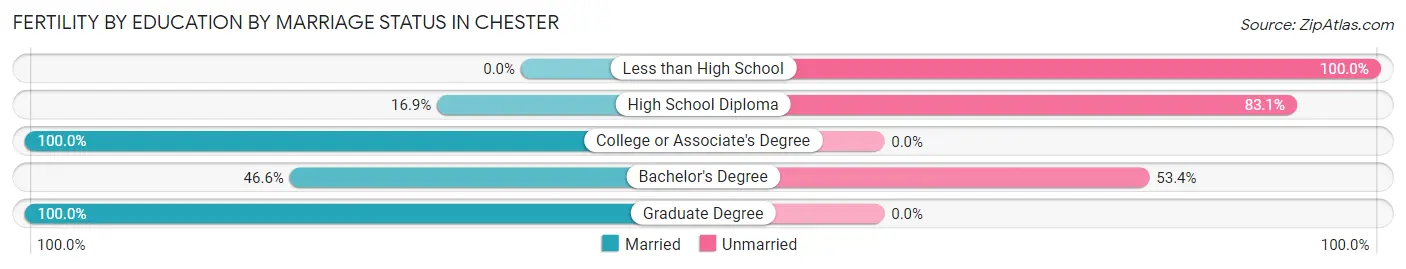
| Educational Attainment | Married | Unmarried |
| Less than High School | 0 (0.0%) | 37 (100.0%) |
| High School Diploma | 13 (16.9%) | 64 (83.1%) |
| College or Associate's Degree | 56 (100.0%) | 0 (0.0%) |
| Bachelor's Degree | 82 (46.6%) | 94 (53.4%) |
| Graduate Degree | 30 (100.0%) | 0 (0.0%) |
| Total | 181 (48.1%) | 195 (51.9%) |
Employment Characteristics in Chester
Employment by Class of Employer in Chester
Among the 11,834 employed individuals in Chester, private company employees (7,964 | 67.3%), federal government employees (1,222 | 10.3%), and local government employees (876 | 7.4%) make up the most common classes of employment.
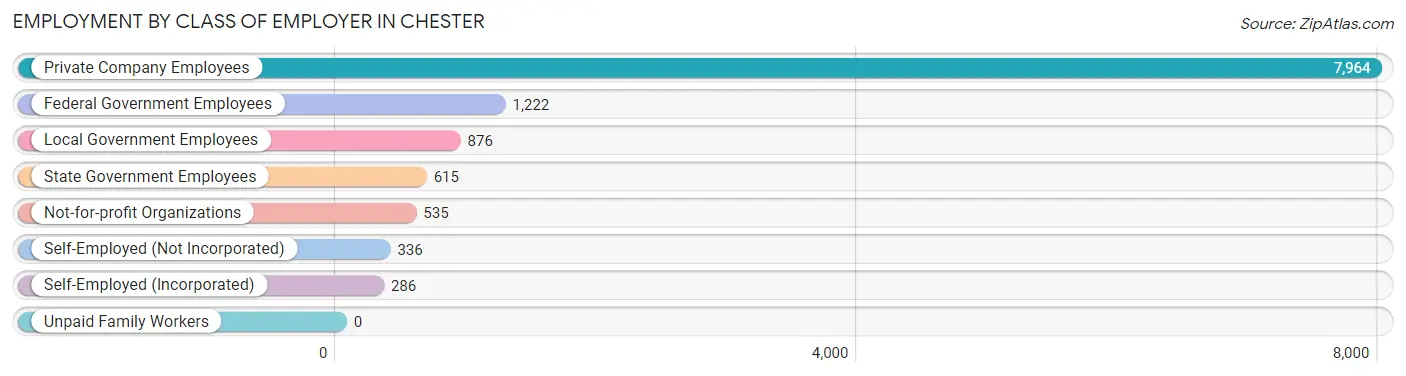
| Employer Class | # Employees | % Employees |
| Private Company Employees | 7,964 | 67.3% |
| Self-Employed (Incorporated) | 286 | 2.4% |
| Self-Employed (Not Incorporated) | 336 | 2.8% |
| Not-for-profit Organizations | 535 | 4.5% |
| Local Government Employees | 876 | 7.4% |
| State Government Employees | 615 | 5.2% |
| Federal Government Employees | 1,222 | 10.3% |
| Unpaid Family Workers | 0 | 0.0% |
| Total | 11,834 | 100.0% |
Employment Status by Age in Chester
According to the labor force statistics for Chester, out of the total population over 16 years of age (18,627), 66.6% or 12,406 individuals are in the labor force, with 3.5% or 434 of them unemployed. The age group with the highest labor force participation rate is 30 to 34 years, with 90.5% or 1,305 individuals in the labor force. Within the labor force, the 16 to 19 years age range has the highest percentage of unemployed individuals, with 28.2% or 229 of them being unemployed.
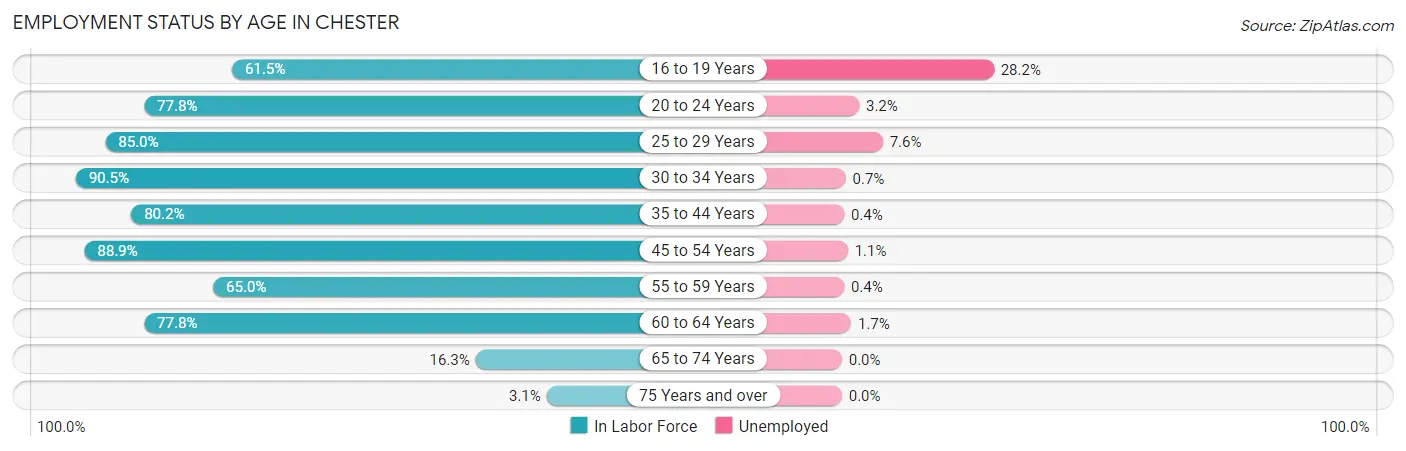
| Age Bracket | In Labor Force | Unemployed |
| 16 to 19 Years | 812 (61.5%) | 229 (28.2%) |
| 20 to 24 Years | 850 (77.8%) | 27 (3.2%) |
| 25 to 29 Years | 1,256 (85.0%) | 95 (7.6%) |
| 30 to 34 Years | 1,305 (90.5%) | 9 (0.7%) |
| 35 to 44 Years | 2,274 (80.2%) | 9 (0.4%) |
| 45 to 54 Years | 3,216 (88.9%) | 35 (1.1%) |
| 55 to 59 Years | 1,091 (65.0%) | 4 (0.4%) |
| 60 to 64 Years | 1,221 (77.8%) | 21 (1.7%) |
| 65 to 74 Years | 341 (16.3%) | 0 (0.0%) |
| 75 Years and over | 46 (3.1%) | 0 (0.0%) |
| Total | 12,406 (66.6%) | 434 (3.5%) |
Employment Status by Educational Attainment in Chester
According to labor force statistics for Chester, 82.1% of individuals (10,362) out of the total population between 25 and 64 years of age (12,621) are in the labor force, with 1.7% or 176 of them being unemployed. The group with the highest labor force participation rate are those with the educational attainment of bachelor's degree or higher, with 90.0% or 3,509 individuals in the labor force. Within the labor force, individuals with less than high school education have the highest percentage of unemployment, with 5.2% or 48 of them being unemployed.
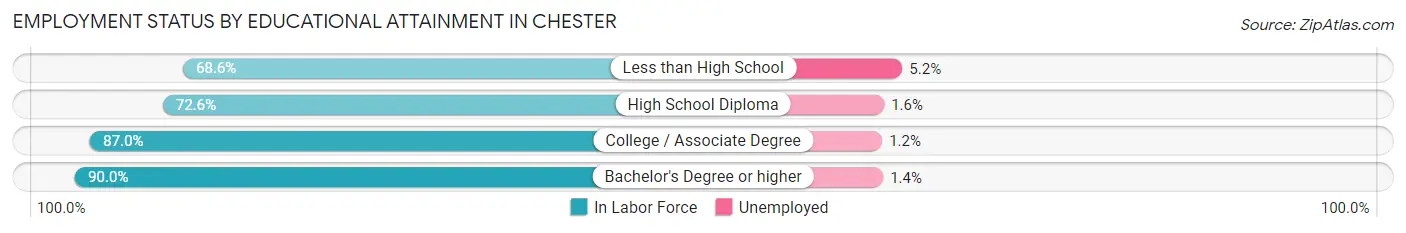
| Educational Attainment | In Labor Force | Unemployed |
| Less than High School | 923 (68.6%) | 70 (5.2%) |
| High School Diploma | 2,452 (72.6%) | 54 (1.6%) |
| College / Associate Degree | 3,480 (87.0%) | 48 (1.2%) |
| Bachelor's Degree or higher | 3,509 (90.0%) | 55 (1.4%) |
| Total | 10,362 (82.1%) | 215 (1.7%) |
Employment Occupations by Sex in Chester
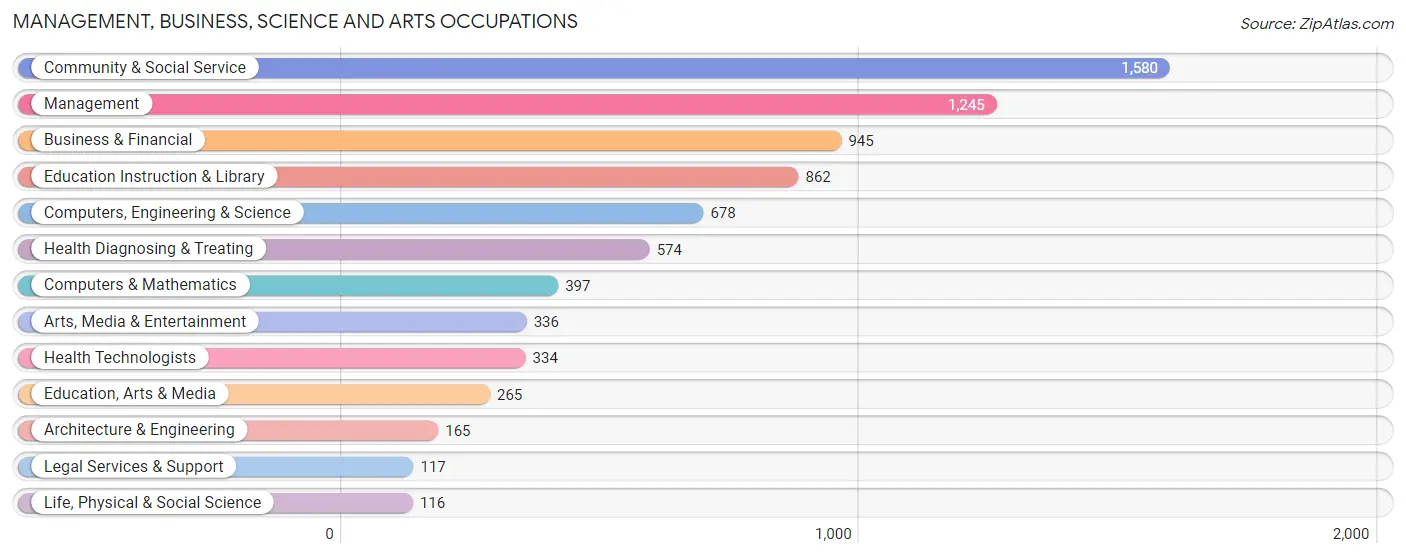
Management, Business, Science and Arts Occupations
The most common Management, Business, Science and Arts occupations in Chester are Community & Social Service (1,580 | 13.4%), Management (1,245 | 10.6%), Business & Financial (945 | 8.0%), Education Instruction & Library (862 | 7.3%), and Computers, Engineering & Science (678 | 5.8%).
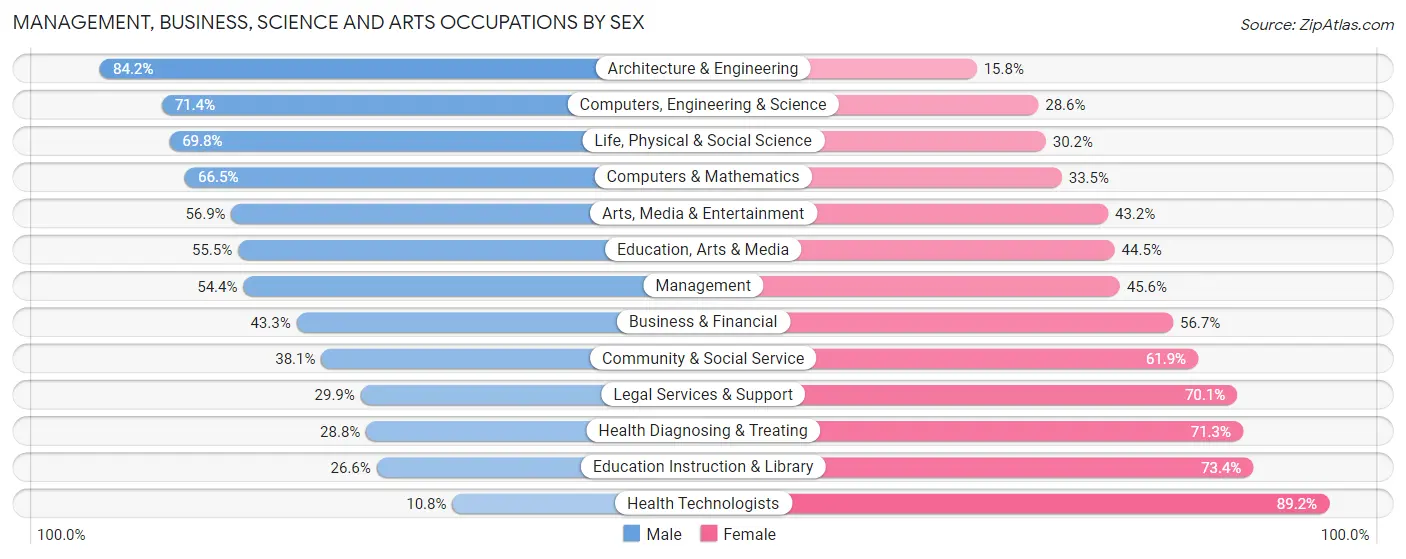
Management, Business, Science and Arts Occupations by Sex
Within the Management, Business, Science and Arts occupations in Chester, the most male-oriented occupations are Architecture & Engineering (84.2%), Computers, Engineering & Science (71.4%), and Life, Physical & Social Science (69.8%), while the most female-oriented occupations are Health Technologists (89.2%), Education Instruction & Library (73.4%), and Health Diagnosing & Treating (71.3%).
| Occupation | Male | Female |
| Management | 677 (54.4%) | 568 (45.6%) |
| Business & Financial | 409 (43.3%) | 536 (56.7%) |
| Computers, Engineering & Science | 484 (71.4%) | 194 (28.6%) |
| Computers & Mathematics | 264 (66.5%) | 133 (33.5%) |
| Architecture & Engineering | 139 (84.2%) | 26 (15.8%) |
| Life, Physical & Social Science | 81 (69.8%) | 35 (30.2%) |
| Community & Social Service | 602 (38.1%) | 978 (61.9%) |
| Education, Arts & Media | 147 (55.5%) | 118 (44.5%) |
| Legal Services & Support | 35 (29.9%) | 82 (70.1%) |
| Education Instruction & Library | 229 (26.6%) | 633 (73.4%) |
| Arts, Media & Entertainment | 191 (56.9%) | 145 (43.1%) |
| Health Diagnosing & Treating | 165 (28.7%) | 409 (71.3%) |
| Health Technologists | 36 (10.8%) | 298 (89.2%) |
| Total (Category) | 2,337 (46.5%) | 2,685 (53.5%) |
| Total (Overall) | 6,207 (52.7%) | 5,564 (47.3%) |
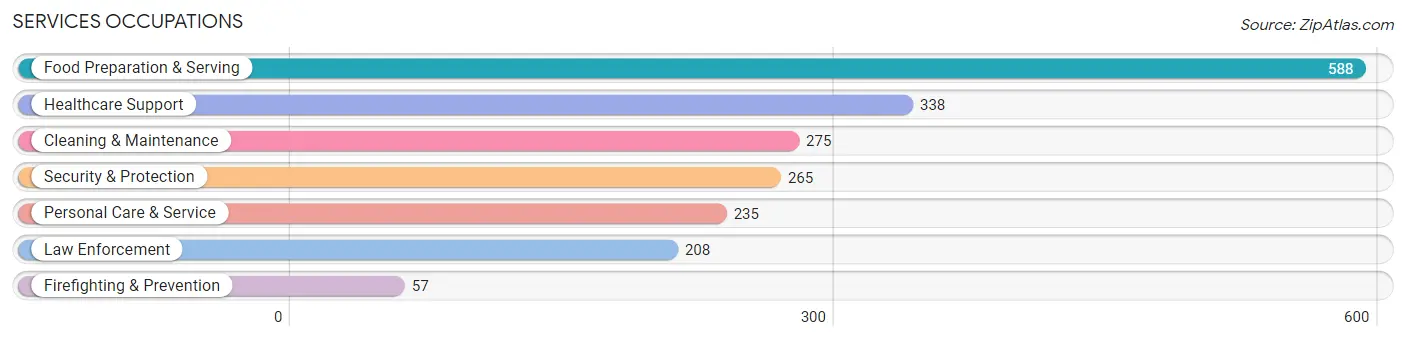
Services Occupations
The most common Services occupations in Chester are Food Preparation & Serving (588 | 5.0%), Healthcare Support (338 | 2.9%), Cleaning & Maintenance (275 | 2.3%), Security & Protection (265 | 2.2%), and Personal Care & Service (235 | 2.0%).
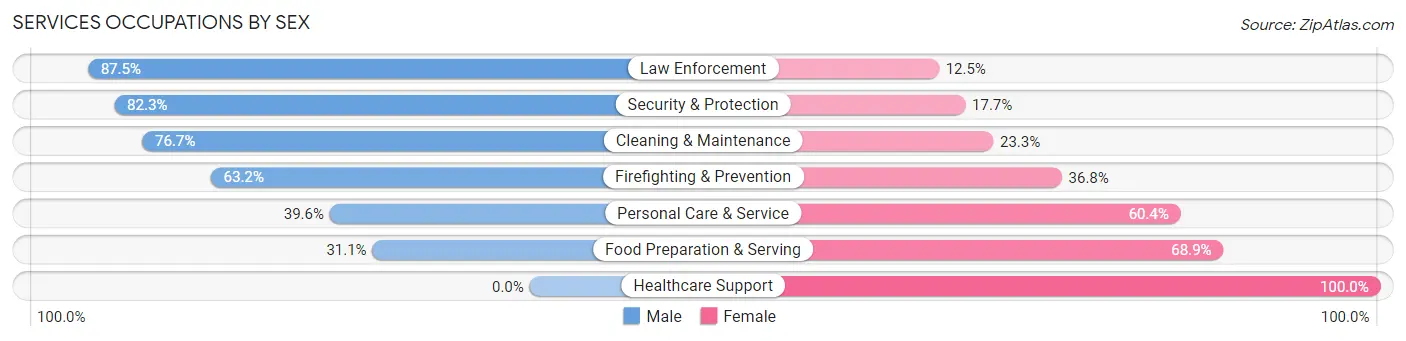
Services Occupations by Sex
Within the Services occupations in Chester, the most male-oriented occupations are Law Enforcement (87.5%), Security & Protection (82.3%), and Cleaning & Maintenance (76.7%), while the most female-oriented occupations are Healthcare Support (100.0%), Food Preparation & Serving (68.9%), and Personal Care & Service (60.4%).
| Occupation | Male | Female |
| Healthcare Support | 0 (0.0%) | 338 (100.0%) |
| Security & Protection | 218 (82.3%) | 47 (17.7%) |
| Firefighting & Prevention | 36 (63.2%) | 21 (36.8%) |
| Law Enforcement | 182 (87.5%) | 26 (12.5%) |
| Food Preparation & Serving | 183 (31.1%) | 405 (68.9%) |
| Cleaning & Maintenance | 211 (76.7%) | 64 (23.3%) |
| Personal Care & Service | 93 (39.6%) | 142 (60.4%) |
| Total (Category) | 705 (41.4%) | 996 (58.6%) |
| Total (Overall) | 6,207 (52.7%) | 5,564 (47.3%) |
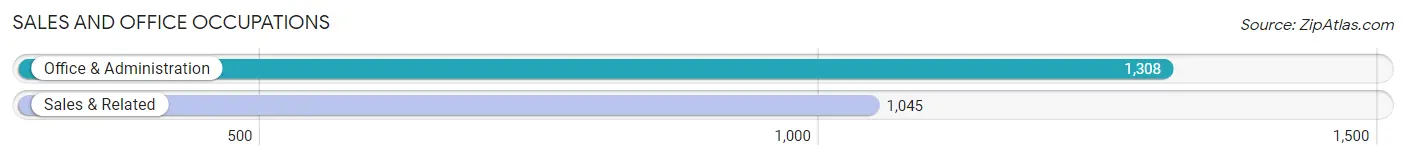
Sales and Office Occupations
The most common Sales and Office occupations in Chester are Office & Administration (1,308 | 11.1%), and Sales & Related (1,045 | 8.9%).
Sales and Office Occupations by Sex
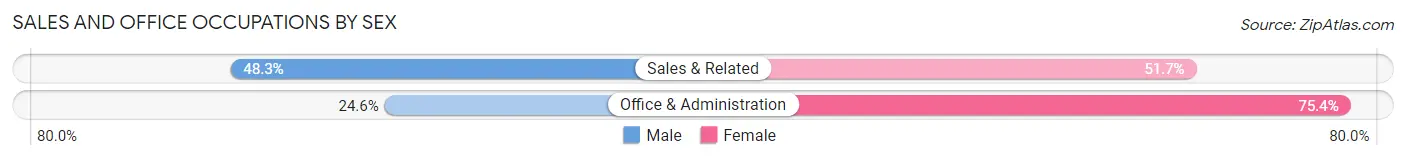
| Occupation | Male | Female |
| Sales & Related | 505 (48.3%) | 540 (51.7%) |
| Office & Administration | 322 (24.6%) | 986 (75.4%) |
| Total (Category) | 827 (35.1%) | 1,526 (64.8%) |
| Total (Overall) | 6,207 (52.7%) | 5,564 (47.3%) |
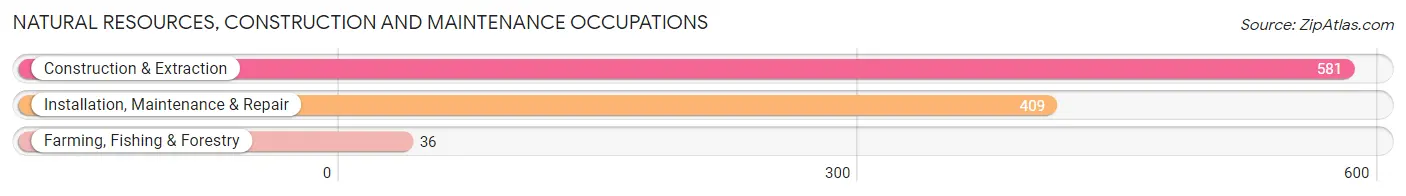
Natural Resources, Construction and Maintenance Occupations
The most common Natural Resources, Construction and Maintenance occupations in Chester are Construction & Extraction (581 | 4.9%), Installation, Maintenance & Repair (409 | 3.5%), and Farming, Fishing & Forestry (36 | 0.3%).
Natural Resources, Construction and Maintenance Occupations by Sex
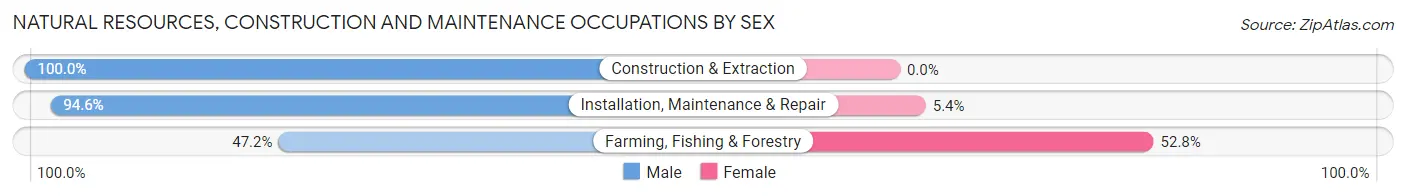
| Occupation | Male | Female |
| Farming, Fishing & Forestry | 17 (47.2%) | 19 (52.8%) |
| Construction & Extraction | 581 (100.0%) | 0 (0.0%) |
| Installation, Maintenance & Repair | 387 (94.6%) | 22 (5.4%) |
| Total (Category) | 985 (96.0%) | 41 (4.0%) |
| Total (Overall) | 6,207 (52.7%) | 5,564 (47.3%) |
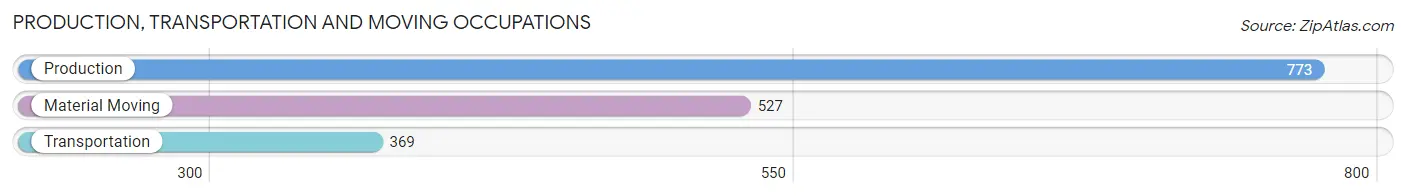
Production, Transportation and Moving Occupations
The most common Production, Transportation and Moving occupations in Chester are Production (773 | 6.6%), Material Moving (527 | 4.5%), and Transportation (369 | 3.1%).
Production, Transportation and Moving Occupations by Sex
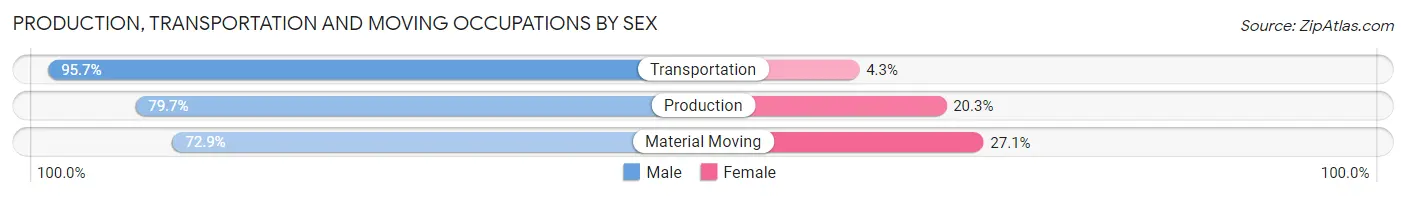
| Occupation | Male | Female |
| Production | 616 (79.7%) | 157 (20.3%) |
| Transportation | 353 (95.7%) | 16 (4.3%) |
| Material Moving | 384 (72.9%) | 143 (27.1%) |
| Total (Category) | 1,353 (81.1%) | 316 (18.9%) |
| Total (Overall) | 6,207 (52.7%) | 5,564 (47.3%) |
Employment Industries by Sex in Chester
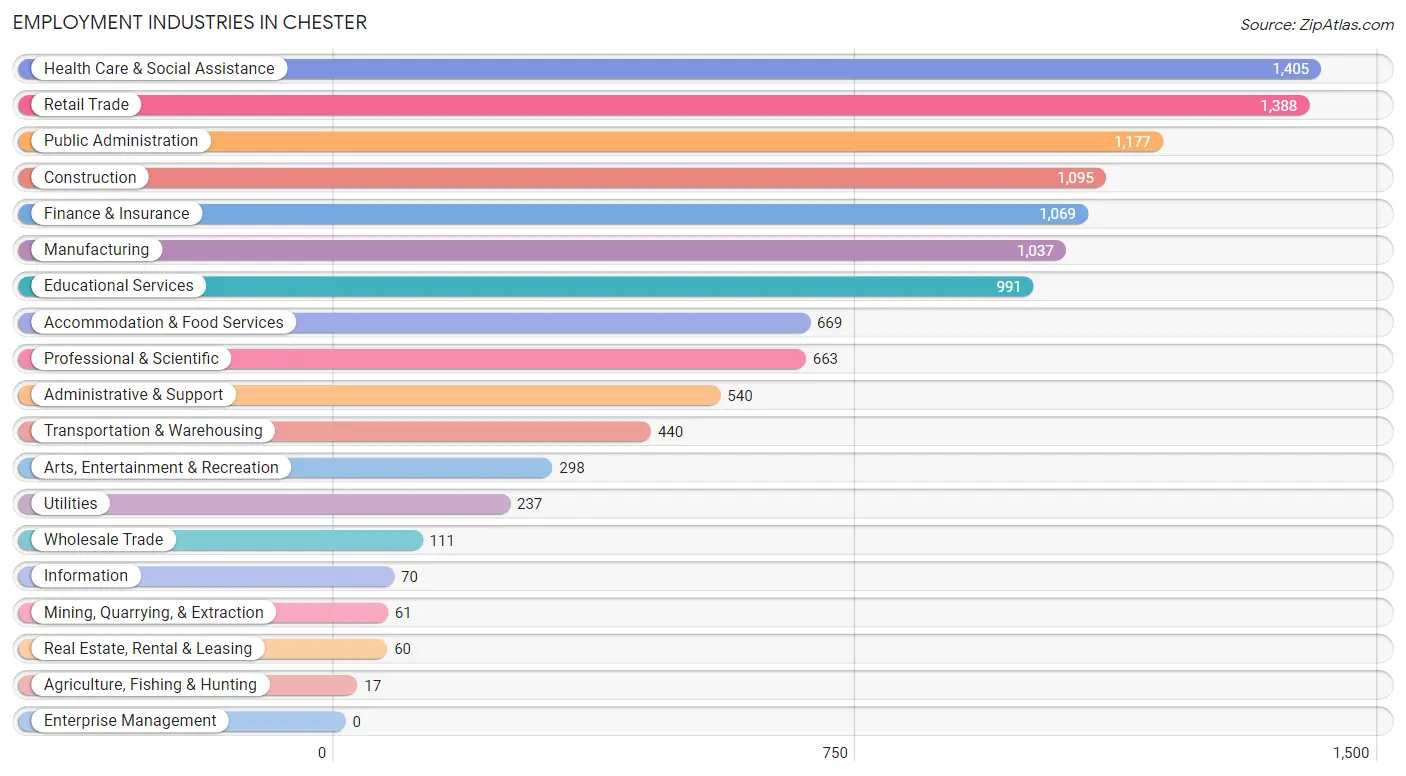
Employment Industries in Chester
The major employment industries in Chester include Health Care & Social Assistance (1,405 | 11.9%), Retail Trade (1,388 | 11.8%), Public Administration (1,177 | 10.0%), Construction (1,095 | 9.3%), and Finance & Insurance (1,069 | 9.1%).
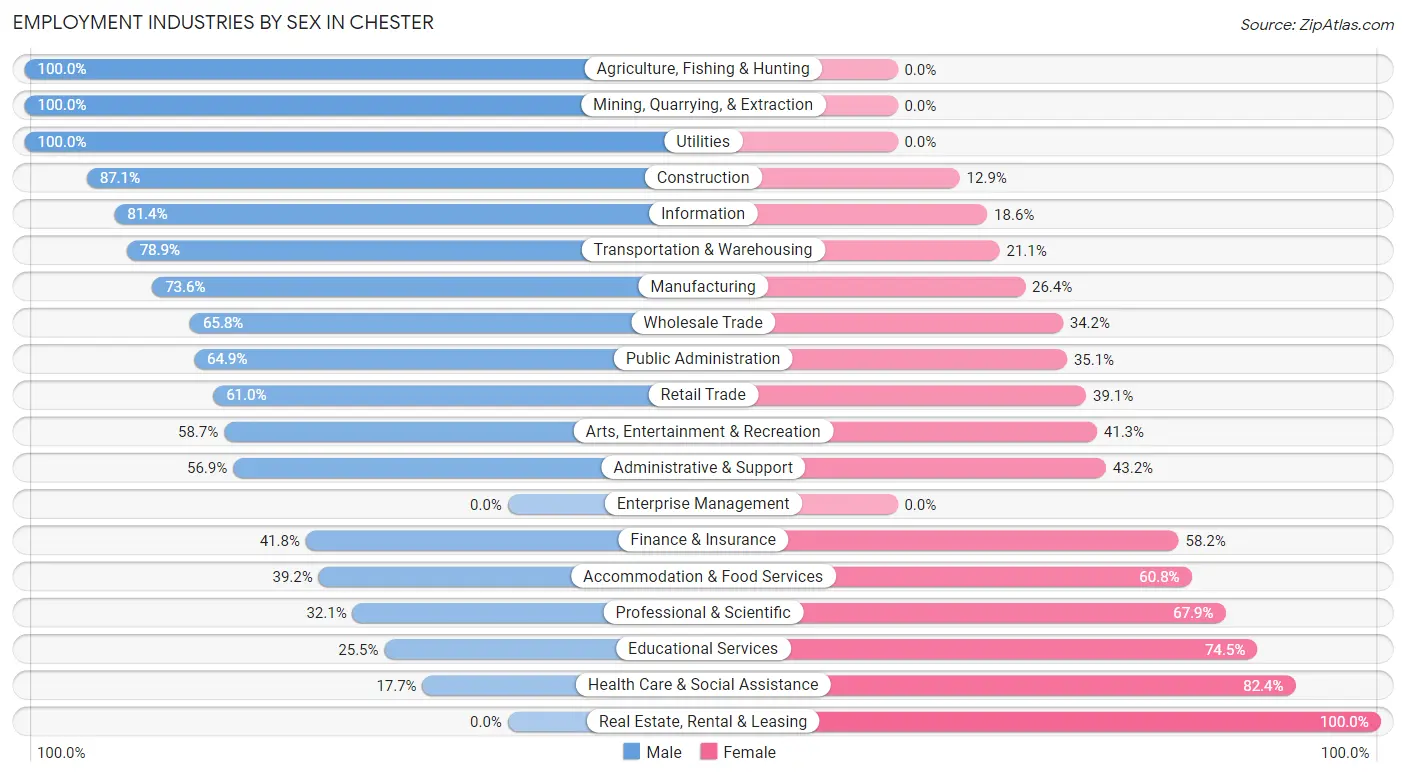
Employment Industries by Sex in Chester
The Chester industries that see more men than women are Agriculture, Fishing & Hunting (100.0%), Mining, Quarrying, & Extraction (100.0%), and Utilities (100.0%), whereas the industries that tend to have a higher number of women are Real Estate, Rental & Leasing (100.0%), Health Care & Social Assistance (82.4%), and Educational Services (74.5%).
| Industry | Male | Female |
| Agriculture, Fishing & Hunting | 17 (100.0%) | 0 (0.0%) |
| Mining, Quarrying, & Extraction | 61 (100.0%) | 0 (0.0%) |
| Construction | 954 (87.1%) | 141 (12.9%) |
| Manufacturing | 763 (73.6%) | 274 (26.4%) |
| Wholesale Trade | 73 (65.8%) | 38 (34.2%) |
| Retail Trade | 846 (61.0%) | 542 (39.1%) |
| Transportation & Warehousing | 347 (78.9%) | 93 (21.1%) |
| Utilities | 237 (100.0%) | 0 (0.0%) |
| Information | 57 (81.4%) | 13 (18.6%) |
| Finance & Insurance | 447 (41.8%) | 622 (58.2%) |
| Real Estate, Rental & Leasing | 0 (0.0%) | 60 (100.0%) |
| Professional & Scientific | 213 (32.1%) | 450 (67.9%) |
| Enterprise Management | 0 (0.0%) | 0 (0.0%) |
| Administrative & Support | 307 (56.9%) | 233 (43.1%) |
| Educational Services | 253 (25.5%) | 738 (74.5%) |
| Health Care & Social Assistance | 248 (17.6%) | 1,157 (82.4%) |
| Arts, Entertainment & Recreation | 175 (58.7%) | 123 (41.3%) |
| Accommodation & Food Services | 262 (39.2%) | 407 (60.8%) |
| Public Administration | 764 (64.9%) | 413 (35.1%) |
| Total | 6,207 (52.7%) | 5,564 (47.3%) |
Education in Chester
School Enrollment in Chester
The most common levels of schooling among the 5,165 students in Chester are elementary school (1,502 | 29.1%), high school (1,285 | 24.9%), and middle school (1,012 | 19.6%).
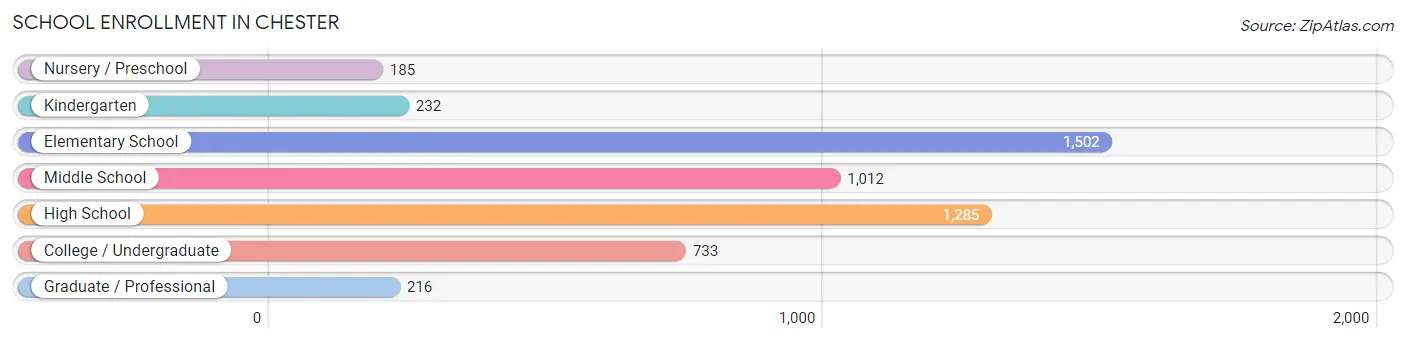
| School Level | # Students | % Students |
| Nursery / Preschool | 185 | 3.6% |
| Kindergarten | 232 | 4.5% |
| Elementary School | 1,502 | 29.1% |
| Middle School | 1,012 | 19.6% |
| High School | 1,285 | 24.9% |
| College / Undergraduate | 733 | 14.2% |
| Graduate / Professional | 216 | 4.2% |
| Total | 5,165 | 100.0% |
School Enrollment by Age by Funding Source in Chester
Out of a total of 5,165 students who are enrolled in schools in Chester, 558 (10.8%) attend a private institution, while the remaining 4,607 (89.2%) are enrolled in public schools. The age group of 3 to 4 year olds has the highest likelihood of being enrolled in private schools, with 91 (56.5% in the age bracket) enrolled. Conversely, the age group of 25 to 34 year olds has the lowest likelihood of being enrolled in a private school, with 156 (100.0% in the age bracket) attending a public institution.
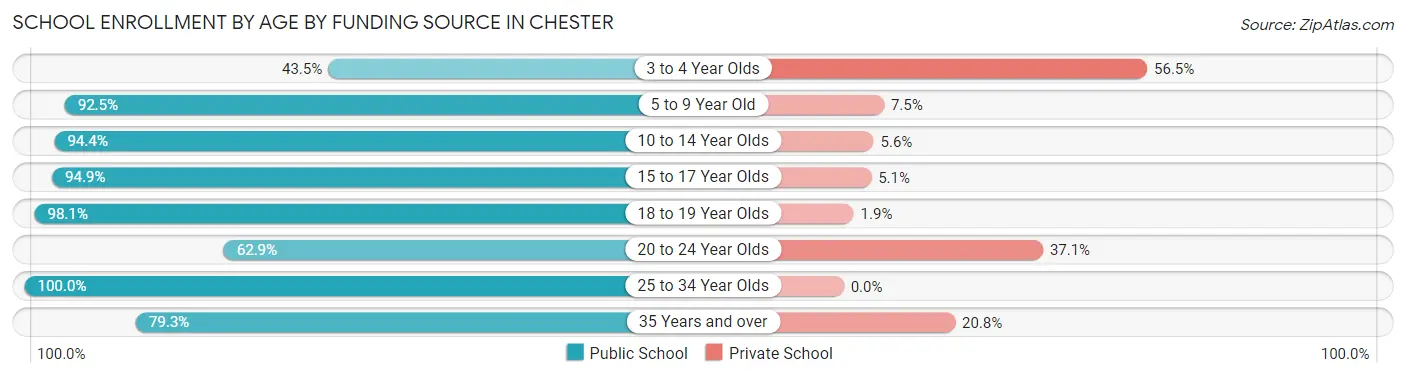
| Age Bracket | Public School | Private School |
| 3 to 4 Year Olds | 70 (43.5%) | 91 (56.5%) |
| 5 to 9 Year Old | 1,517 (92.5%) | 123 (7.5%) |
| 10 to 14 Year Olds | 1,103 (94.4%) | 65 (5.6%) |
| 15 to 17 Year Olds | 851 (94.9%) | 46 (5.1%) |
| 18 to 19 Year Olds | 369 (98.1%) | 7 (1.9%) |
| 20 to 24 Year Olds | 249 (62.9%) | 147 (37.1%) |
| 25 to 34 Year Olds | 156 (100.0%) | 0 (0.0%) |
| 35 Years and over | 294 (79.2%) | 77 (20.7%) |
| Total | 4,607 (89.2%) | 558 (10.8%) |
Educational Attainment by Field of Study in Chester
Business (1,379 | 25.2%), science & technology (505 | 9.2%), arts & humanities (491 | 8.9%), education (423 | 7.7%), and computers & mathematics (407 | 7.4%) are the most common fields of study among 5,484 individuals in Chester who have obtained a bachelor's degree or higher.
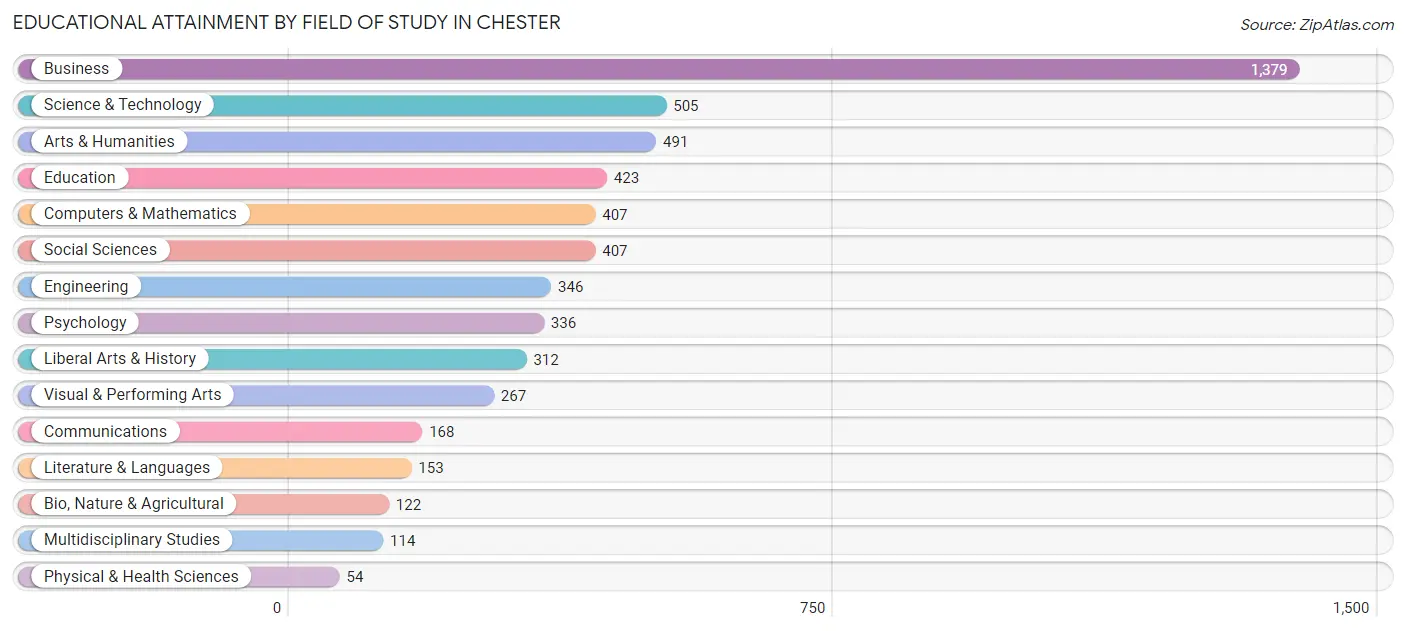
| Field of Study | # Graduates | % Graduates |
| Computers & Mathematics | 407 | 7.4% |
| Bio, Nature & Agricultural | 122 | 2.2% |
| Physical & Health Sciences | 54 | 1.0% |
| Psychology | 336 | 6.1% |
| Social Sciences | 407 | 7.4% |
| Engineering | 346 | 6.3% |
| Multidisciplinary Studies | 114 | 2.1% |
| Science & Technology | 505 | 9.2% |
| Business | 1,379 | 25.2% |
| Education | 423 | 7.7% |
| Literature & Languages | 153 | 2.8% |
| Liberal Arts & History | 312 | 5.7% |
| Visual & Performing Arts | 267 | 4.9% |
| Communications | 168 | 3.1% |
| Arts & Humanities | 491 | 8.9% |
| Total | 5,484 | 100.0% |
Transportation & Commute in Chester
Vehicle Availability by Sex in Chester
The most prevalent vehicle ownership categories in Chester are males with 2 vehicles (2,148, accounting for 34.1%) and females with 2 vehicles (1,746, making up 38.8%).
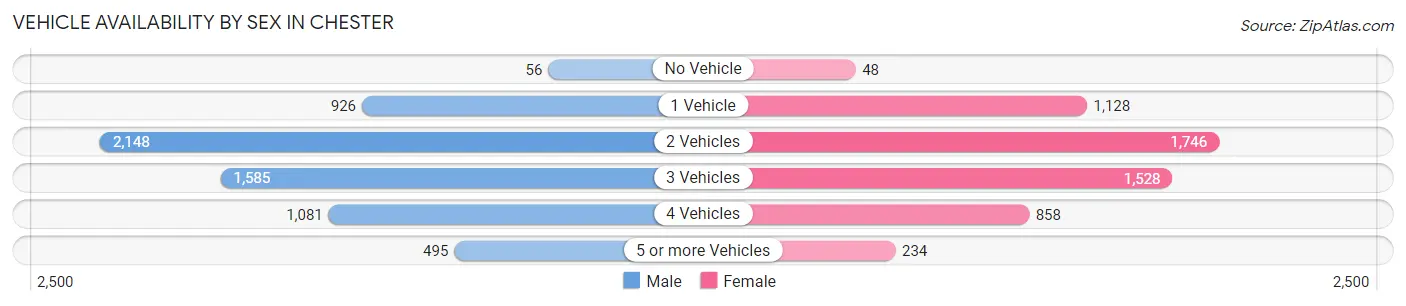
| Vehicles Available | Male | Female |
| No Vehicle | 56 (0.9%) | 48 (0.9%) |
| 1 Vehicle | 926 (14.7%) | 1,128 (20.3%) |
| 2 Vehicles | 2,148 (34.1%) | 1,746 (31.5%) |
| 3 Vehicles | 1,585 (25.2%) | 1,528 (27.6%) |
| 4 Vehicles | 1,081 (17.2%) | 858 (15.5%) |
| 5 or more Vehicles | 495 (7.9%) | 234 (4.2%) |
| Total | 6,291 (100.0%) | 5,542 (100.0%) |
Commute Time in Chester
The most frequently occuring commute durations in Chester are 20 to 24 minutes (2,155 commuters, 20.8%), 30 to 34 minutes (2,061 commuters, 19.9%), and 15 to 19 minutes (1,877 commuters, 18.1%).
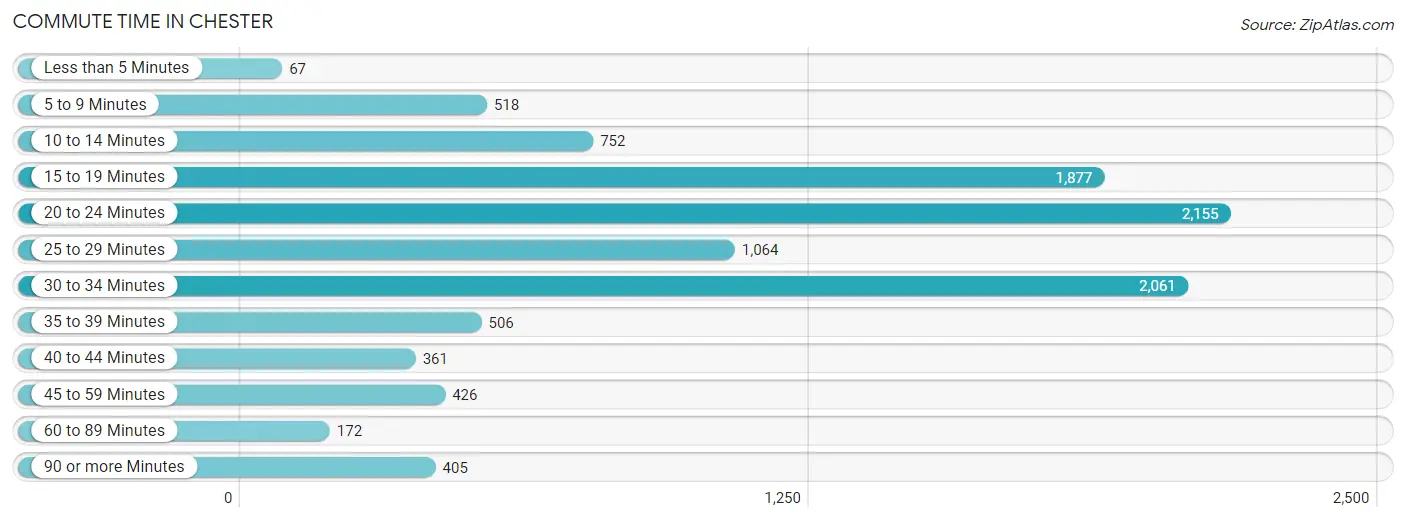
| Commute Time | # Commuters | % Commuters |
| Less than 5 Minutes | 67 | 0.6% |
| 5 to 9 Minutes | 518 | 5.0% |
| 10 to 14 Minutes | 752 | 7.3% |
| 15 to 19 Minutes | 1,877 | 18.1% |
| 20 to 24 Minutes | 2,155 | 20.8% |
| 25 to 29 Minutes | 1,064 | 10.3% |
| 30 to 34 Minutes | 2,061 | 19.9% |
| 35 to 39 Minutes | 506 | 4.9% |
| 40 to 44 Minutes | 361 | 3.5% |
| 45 to 59 Minutes | 426 | 4.1% |
| 60 to 89 Minutes | 172 | 1.7% |
| 90 or more Minutes | 405 | 3.9% |
Commute Time by Sex in Chester
The most common commute times in Chester are 30 to 34 minutes (1,393 commuters, 24.4%) for males and 20 to 24 minutes (1,169 commuters, 25.1%) for females.
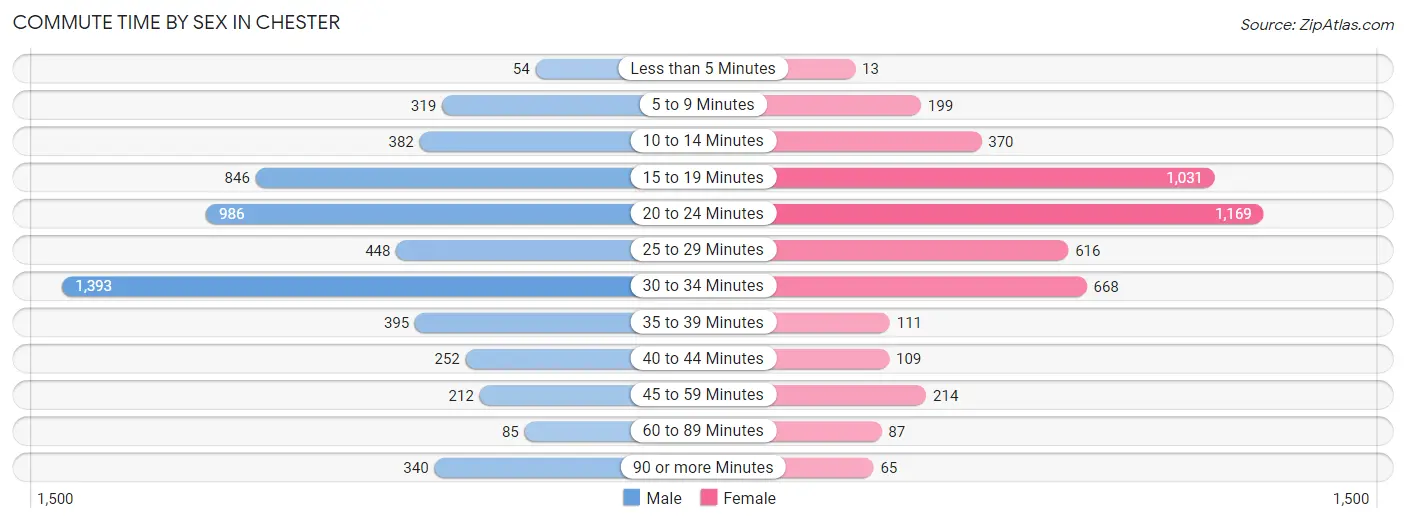
| Commute Time | Male | Female |
| Less than 5 Minutes | 54 (0.9%) | 13 (0.3%) |
| 5 to 9 Minutes | 319 (5.6%) | 199 (4.3%) |
| 10 to 14 Minutes | 382 (6.7%) | 370 (8.0%) |
| 15 to 19 Minutes | 846 (14.8%) | 1,031 (22.2%) |
| 20 to 24 Minutes | 986 (17.3%) | 1,169 (25.1%) |
| 25 to 29 Minutes | 448 (7.8%) | 616 (13.2%) |
| 30 to 34 Minutes | 1,393 (24.4%) | 668 (14.4%) |
| 35 to 39 Minutes | 395 (6.9%) | 111 (2.4%) |
| 40 to 44 Minutes | 252 (4.4%) | 109 (2.3%) |
| 45 to 59 Minutes | 212 (3.7%) | 214 (4.6%) |
| 60 to 89 Minutes | 85 (1.5%) | 87 (1.9%) |
| 90 or more Minutes | 340 (5.9%) | 65 (1.4%) |
Time of Departure to Work by Sex in Chester
The most frequent times of departure to work in Chester are 7:00 AM to 7:29 AM (801, 14.0%) for males and 7:00 AM to 7:29 AM (1,293, 27.8%) for females.
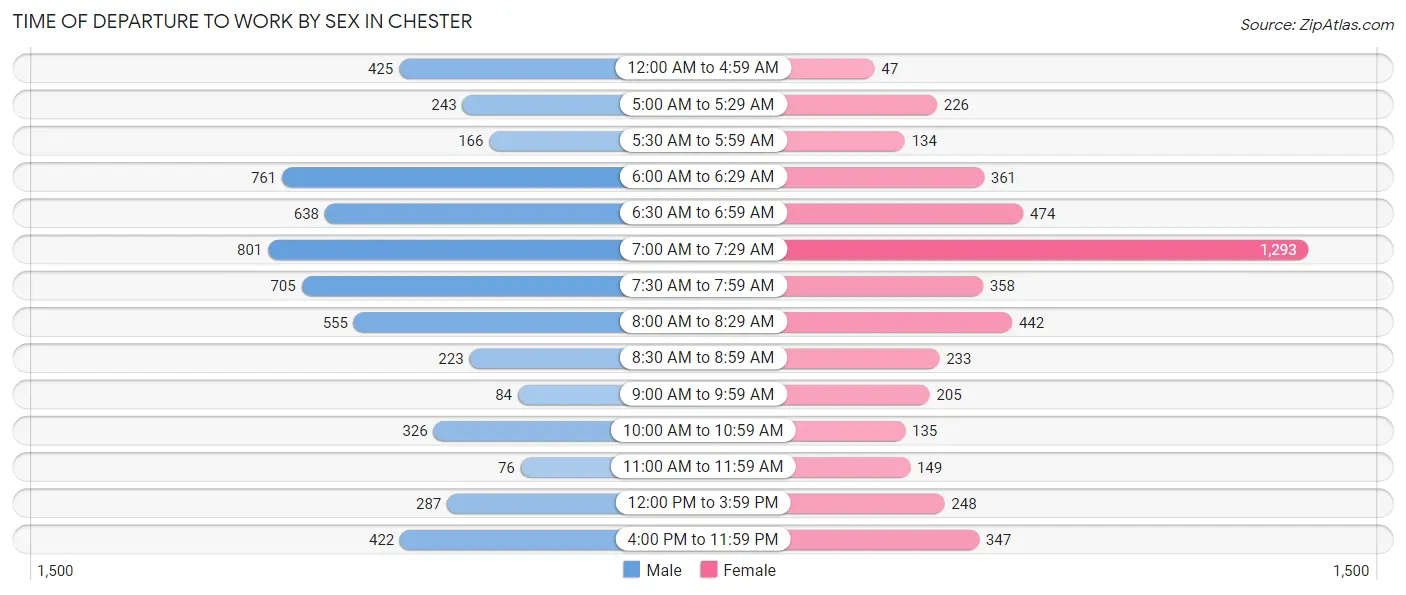
| Time of Departure | Male | Female |
| 12:00 AM to 4:59 AM | 425 (7.4%) | 47 (1.0%) |
| 5:00 AM to 5:29 AM | 243 (4.3%) | 226 (4.9%) |
| 5:30 AM to 5:59 AM | 166 (2.9%) | 134 (2.9%) |
| 6:00 AM to 6:29 AM | 761 (13.3%) | 361 (7.8%) |
| 6:30 AM to 6:59 AM | 638 (11.2%) | 474 (10.2%) |
| 7:00 AM to 7:29 AM | 801 (14.0%) | 1,293 (27.8%) |
| 7:30 AM to 7:59 AM | 705 (12.3%) | 358 (7.7%) |
| 8:00 AM to 8:29 AM | 555 (9.7%) | 442 (9.5%) |
| 8:30 AM to 8:59 AM | 223 (3.9%) | 233 (5.0%) |
| 9:00 AM to 9:59 AM | 84 (1.5%) | 205 (4.4%) |
| 10:00 AM to 10:59 AM | 326 (5.7%) | 135 (2.9%) |
| 11:00 AM to 11:59 AM | 76 (1.3%) | 149 (3.2%) |
| 12:00 PM to 3:59 PM | 287 (5.0%) | 248 (5.3%) |
| 4:00 PM to 11:59 PM | 422 (7.4%) | 347 (7.5%) |
| Total | 5,712 (100.0%) | 4,652 (100.0%) |
Housing Occupancy in Chester
Occupancy by Ownership in Chester
Of the total 8,989 dwellings in Chester, owner-occupied units account for 6,572 (73.1%), while renter-occupied units make up 2,417 (26.9%).
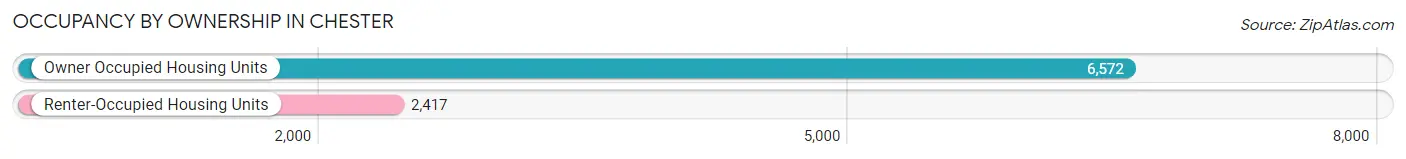
| Occupancy | # Housing Units | % Housing Units |
| Owner Occupied Housing Units | 6,572 | 73.1% |
| Renter-Occupied Housing Units | 2,417 | 26.9% |
| Total Occupied Housing Units | 8,989 | 100.0% |
Occupancy by Household Size in Chester
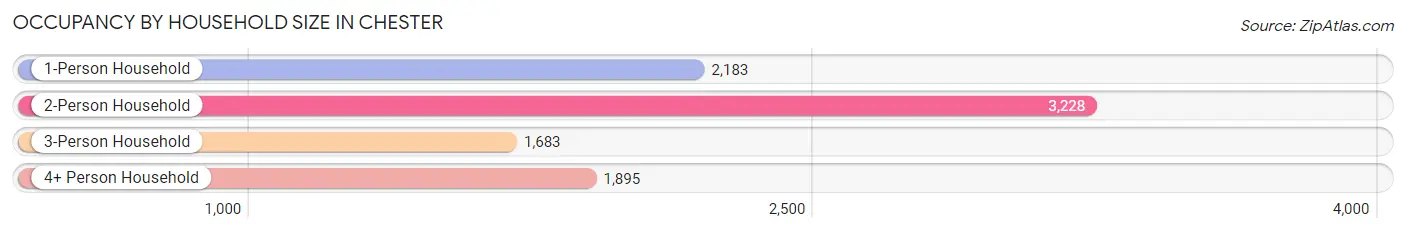
| Household Size | # Housing Units | % Housing Units |
| 1-Person Household | 2,183 | 24.3% |
| 2-Person Household | 3,228 | 35.9% |
| 3-Person Household | 1,683 | 18.7% |
| 4+ Person Household | 1,895 | 21.1% |
| Total Housing Units | 8,989 | 100.0% |
Occupancy by Ownership by Household Size in Chester
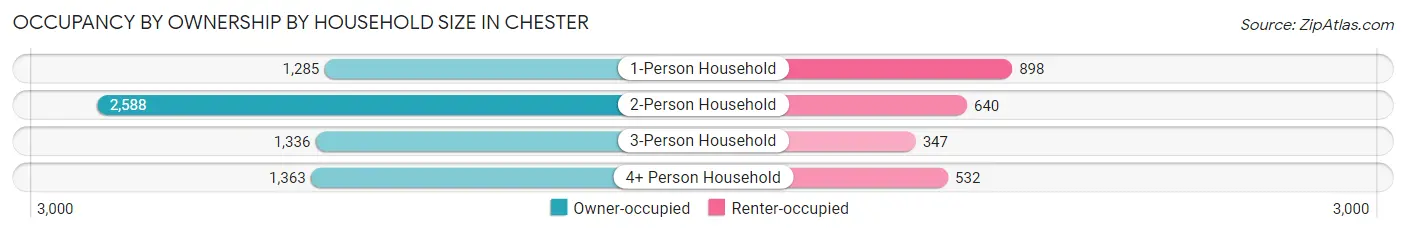
| Household Size | Owner-occupied | Renter-occupied |
| 1-Person Household | 1,285 (58.9%) | 898 (41.1%) |
| 2-Person Household | 2,588 (80.2%) | 640 (19.8%) |
| 3-Person Household | 1,336 (79.4%) | 347 (20.6%) |
| 4+ Person Household | 1,363 (71.9%) | 532 (28.1%) |
| Total Housing Units | 6,572 (73.1%) | 2,417 (26.9%) |
Occupancy by Educational Attainment in Chester
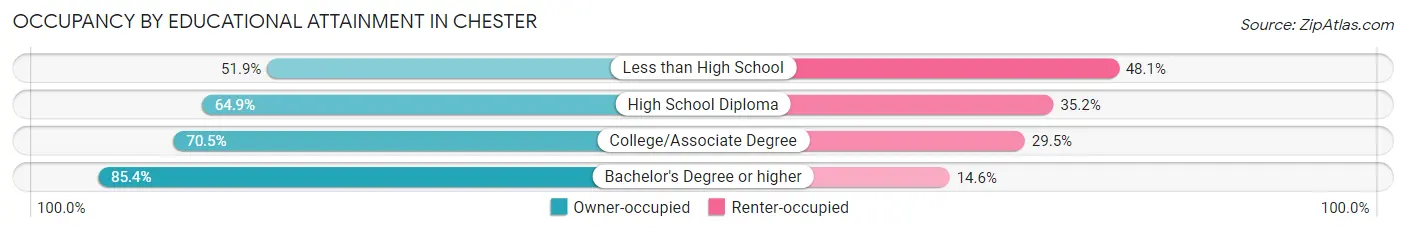
| Household Size | Owner-occupied | Renter-occupied |
| Less than High School | 448 (51.9%) | 415 (48.1%) |
| High School Diploma | 1,216 (64.8%) | 659 (35.1%) |
| College/Associate Degree | 2,042 (70.5%) | 854 (29.5%) |
| Bachelor's Degree or higher | 2,866 (85.4%) | 489 (14.6%) |
Occupancy by Age of Householder in Chester
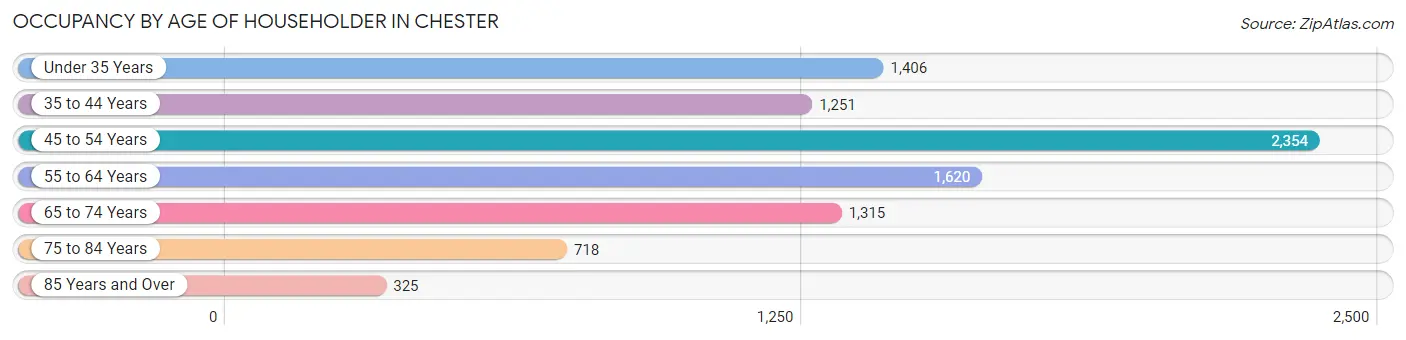
| Age Bracket | # Households | % Households |
| Under 35 Years | 1,406 | 15.6% |
| 35 to 44 Years | 1,251 | 13.9% |
| 45 to 54 Years | 2,354 | 26.2% |
| 55 to 64 Years | 1,620 | 18.0% |
| 65 to 74 Years | 1,315 | 14.6% |
| 75 to 84 Years | 718 | 8.0% |
| 85 Years and Over | 325 | 3.6% |
| Total | 8,989 | 100.0% |
Housing Finances in Chester
Median Income by Occupancy in Chester
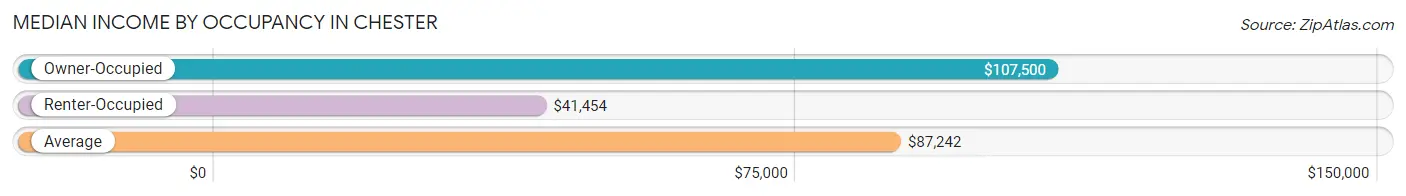
| Occupancy Type | # Households | Median Income |
| Owner-Occupied | 6,572 (73.1%) | $107,500 |
| Renter-Occupied | 2,417 (26.9%) | $41,454 |
| Average | 8,989 (100.0%) | $87,242 |
Occupancy by Householder Income Bracket in Chester
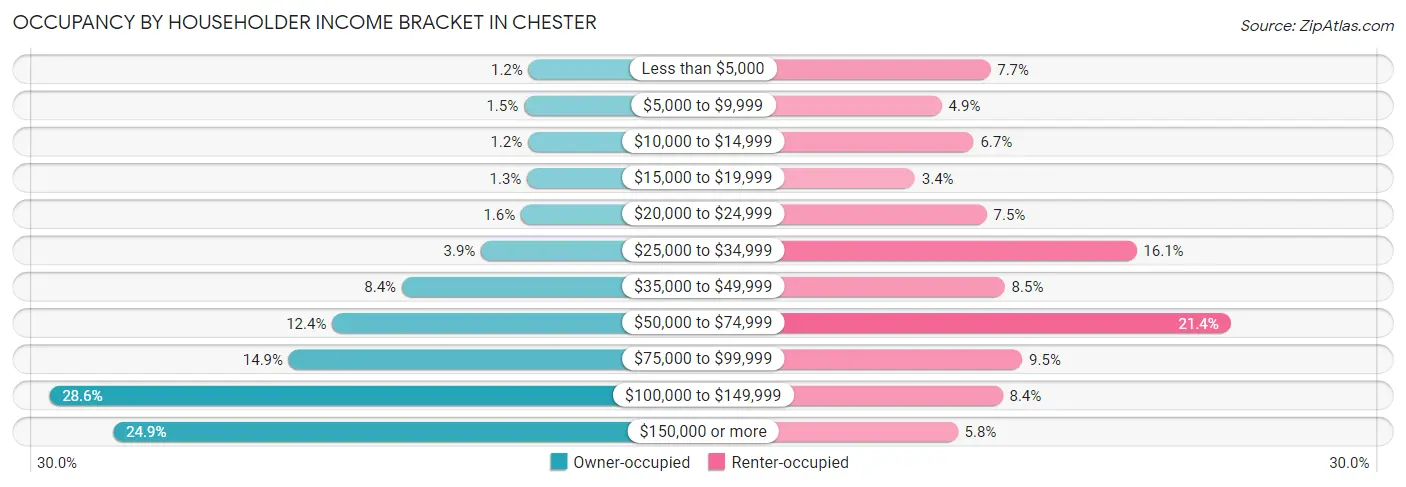
| Income Bracket | Owner-occupied | Renter-occupied |
| Less than $5,000 | 79 (1.2%) | 186 (7.7%) |
| $5,000 to $9,999 | 96 (1.5%) | 119 (4.9%) |
| $10,000 to $14,999 | 81 (1.2%) | 163 (6.7%) |
| $15,000 to $19,999 | 84 (1.3%) | 82 (3.4%) |
| $20,000 to $24,999 | 107 (1.6%) | 181 (7.5%) |
| $25,000 to $34,999 | 257 (3.9%) | 388 (16.1%) |
| $35,000 to $49,999 | 555 (8.4%) | 206 (8.5%) |
| $50,000 to $74,999 | 816 (12.4%) | 518 (21.4%) |
| $75,000 to $99,999 | 979 (14.9%) | 230 (9.5%) |
| $100,000 to $149,999 | 1,879 (28.6%) | 203 (8.4%) |
| $150,000 or more | 1,639 (24.9%) | 141 (5.8%) |
| Total | 6,572 (100.0%) | 2,417 (100.0%) |
Monthly Housing Cost Tiers in Chester
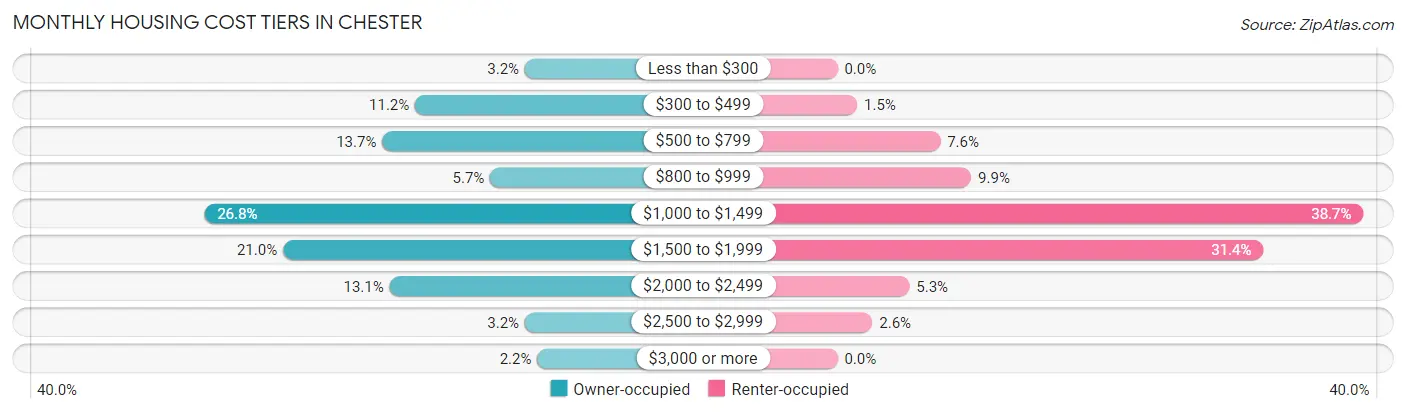
| Monthly Cost | Owner-occupied | Renter-occupied |
| Less than $300 | 207 (3.2%) | 0 (0.0%) |
| $300 to $499 | 739 (11.2%) | 35 (1.5%) |
| $500 to $799 | 898 (13.7%) | 183 (7.6%) |
| $800 to $999 | 375 (5.7%) | 238 (9.9%) |
| $1,000 to $1,499 | 1,759 (26.8%) | 936 (38.7%) |
| $1,500 to $1,999 | 1,378 (21.0%) | 758 (31.4%) |
| $2,000 to $2,499 | 862 (13.1%) | 128 (5.3%) |
| $2,500 to $2,999 | 207 (3.2%) | 62 (2.6%) |
| $3,000 or more | 147 (2.2%) | 0 (0.0%) |
| Total | 6,572 (100.0%) | 2,417 (100.0%) |
Physical Housing Characteristics in Chester
Housing Structures in Chester
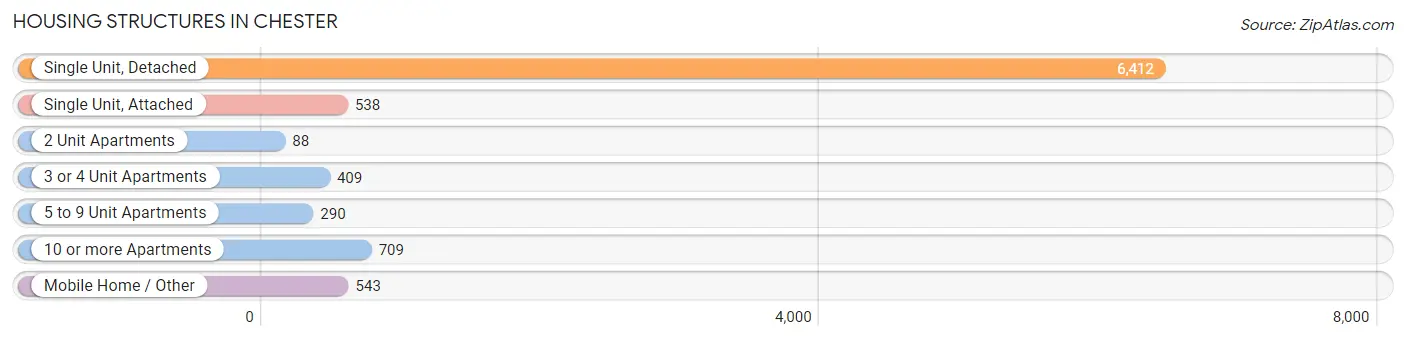
| Structure Type | # Housing Units | % Housing Units |
| Single Unit, Detached | 6,412 | 71.3% |
| Single Unit, Attached | 538 | 6.0% |
| 2 Unit Apartments | 88 | 1.0% |
| 3 or 4 Unit Apartments | 409 | 4.5% |
| 5 to 9 Unit Apartments | 290 | 3.2% |
| 10 or more Apartments | 709 | 7.9% |
| Mobile Home / Other | 543 | 6.0% |
| Total | 8,989 | 100.0% |
Housing Structures by Occupancy in Chester
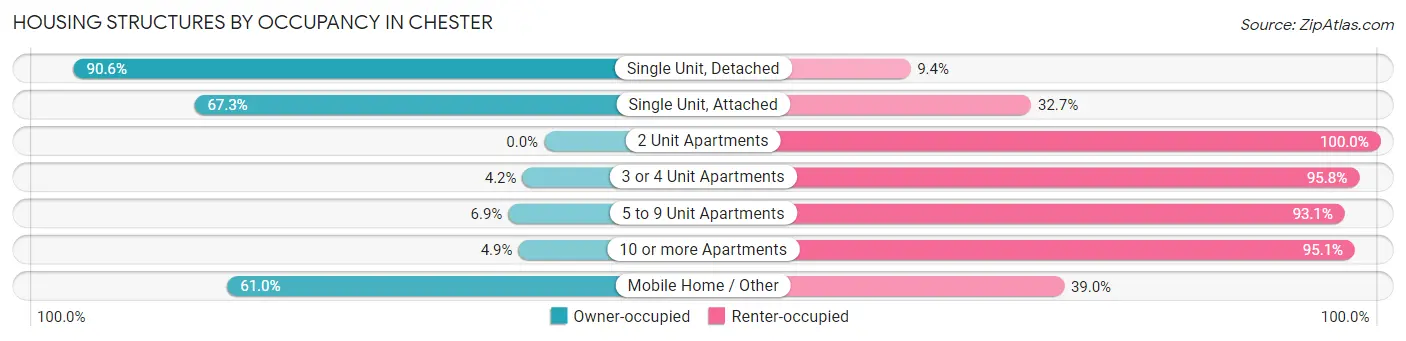
| Structure Type | Owner-occupied | Renter-occupied |
| Single Unit, Detached | 5,807 (90.6%) | 605 (9.4%) |
| Single Unit, Attached | 362 (67.3%) | 176 (32.7%) |
| 2 Unit Apartments | 0 (0.0%) | 88 (100.0%) |
| 3 or 4 Unit Apartments | 17 (4.2%) | 392 (95.8%) |
| 5 to 9 Unit Apartments | 20 (6.9%) | 270 (93.1%) |
| 10 or more Apartments | 35 (4.9%) | 674 (95.1%) |
| Mobile Home / Other | 331 (61.0%) | 212 (39.0%) |
| Total | 6,572 (73.1%) | 2,417 (26.9%) |
Housing Structures by Number of Rooms in Chester
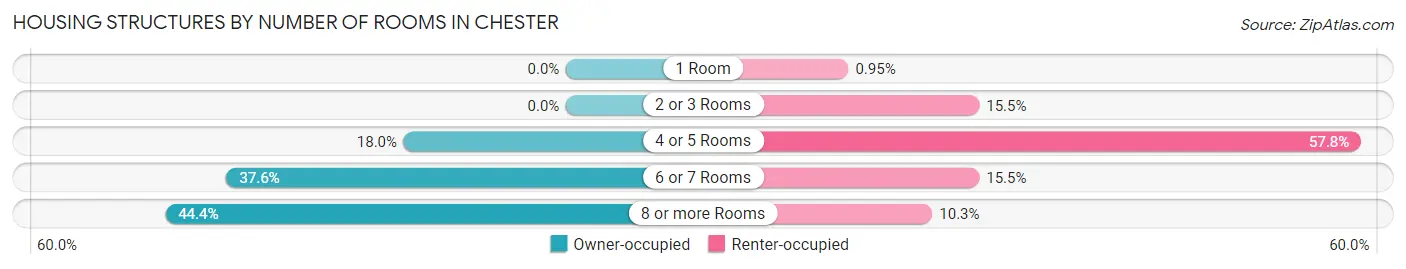
| Number of Rooms | Owner-occupied | Renter-occupied |
| 1 Room | 0 (0.0%) | 23 (0.9%) |
| 2 or 3 Rooms | 0 (0.0%) | 374 (15.5%) |
| 4 or 5 Rooms | 1,184 (18.0%) | 1,398 (57.8%) |
| 6 or 7 Rooms | 2,471 (37.6%) | 374 (15.5%) |
| 8 or more Rooms | 2,917 (44.4%) | 248 (10.3%) |
| Total | 6,572 (100.0%) | 2,417 (100.0%) |
Housing Structure by Heating Type in Chester
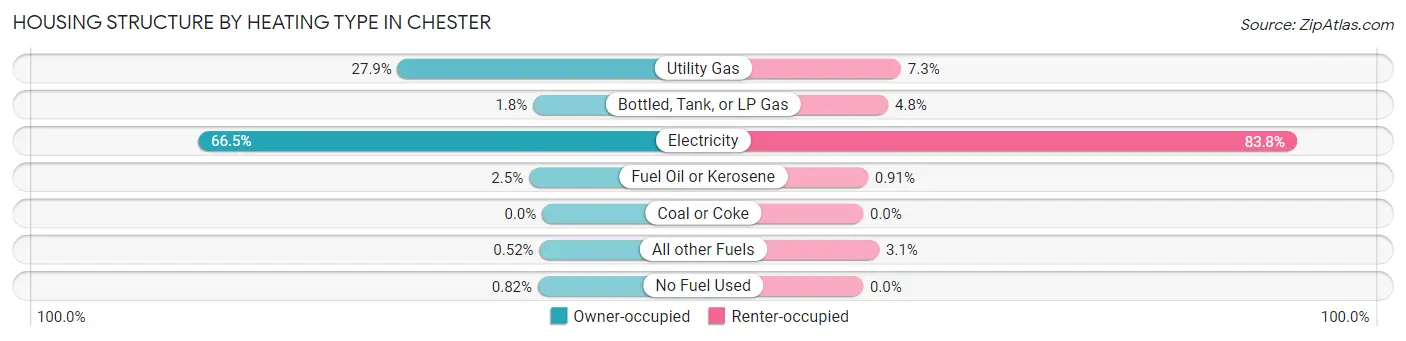
| Heating Type | Owner-occupied | Renter-occupied |
| Utility Gas | 1,835 (27.9%) | 177 (7.3%) |
| Bottled, Tank, or LP Gas | 115 (1.8%) | 117 (4.8%) |
| Electricity | 4,368 (66.5%) | 2,026 (83.8%) |
| Fuel Oil or Kerosene | 166 (2.5%) | 22 (0.9%) |
| Coal or Coke | 0 (0.0%) | 0 (0.0%) |
| All other Fuels | 34 (0.5%) | 75 (3.1%) |
| No Fuel Used | 54 (0.8%) | 0 (0.0%) |
| Total | 6,572 (100.0%) | 2,417 (100.0%) |
Household Vehicle Usage in Chester
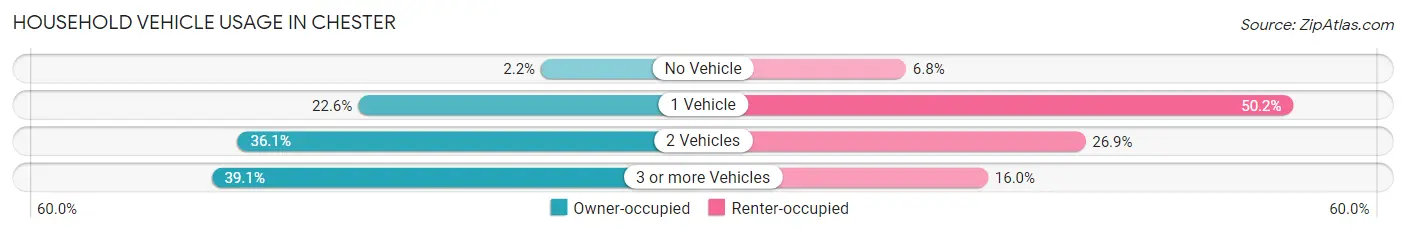
| Vehicles per Household | Owner-occupied | Renter-occupied |
| No Vehicle | 142 (2.2%) | 165 (6.8%) |
| 1 Vehicle | 1,488 (22.6%) | 1,214 (50.2%) |
| 2 Vehicles | 2,375 (36.1%) | 651 (26.9%) |
| 3 or more Vehicles | 2,567 (39.1%) | 387 (16.0%) |
| Total | 6,572 (100.0%) | 2,417 (100.0%) |
Real Estate & Mortgages in Chester
Real Estate and Mortgage Overview in Chester
| Characteristic | Without Mortgage | With Mortgage |
| Housing Units | 2,058 | 4,514 |
| Median Property Value | $274,700 | $274,300 |
| Median Household Income | $61,033 | $1,336 |
| Monthly Housing Costs | $542 | $147 |
| Real Estate Taxes | $2,173 | $153 |
Property Value by Mortgage Status in Chester
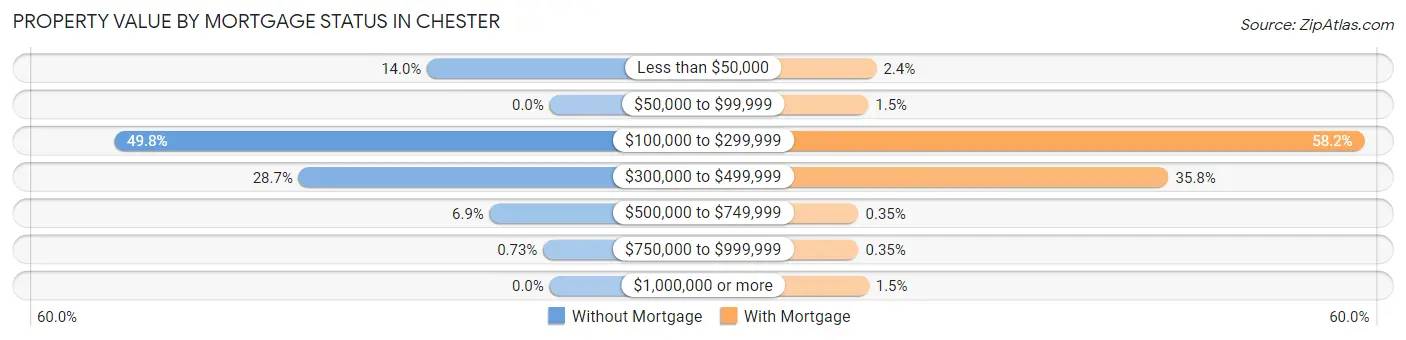
| Property Value | Without Mortgage | With Mortgage |
| Less than $50,000 | 288 (14.0%) | 108 (2.4%) |
| $50,000 to $99,999 | 0 (0.0%) | 66 (1.5%) |
| $100,000 to $299,999 | 1,024 (49.8%) | 2,625 (58.2%) |
| $300,000 to $499,999 | 590 (28.7%) | 1,615 (35.8%) |
| $500,000 to $749,999 | 141 (6.9%) | 16 (0.4%) |
| $750,000 to $999,999 | 15 (0.7%) | 16 (0.4%) |
| $1,000,000 or more | 0 (0.0%) | 68 (1.5%) |
| Total | 2,058 (100.0%) | 4,514 (100.0%) |
Household Income by Mortgage Status in Chester
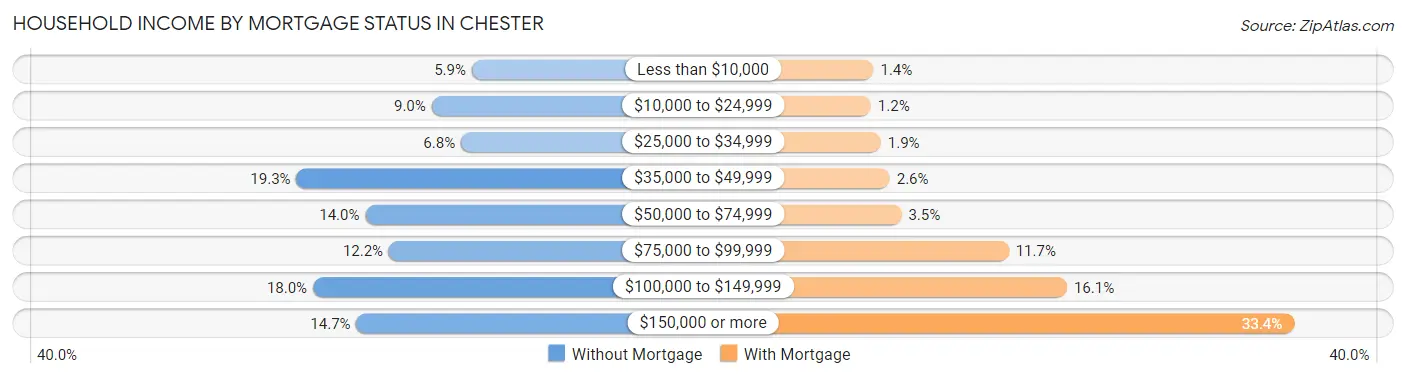
| Household Income | Without Mortgage | With Mortgage |
| Less than $10,000 | 122 (5.9%) | 62 (1.4%) |
| $10,000 to $24,999 | 185 (9.0%) | 53 (1.2%) |
| $25,000 to $34,999 | 139 (6.8%) | 87 (1.9%) |
| $35,000 to $49,999 | 397 (19.3%) | 118 (2.6%) |
| $50,000 to $74,999 | 289 (14.0%) | 158 (3.5%) |
| $75,000 to $99,999 | 252 (12.2%) | 527 (11.7%) |
| $100,000 to $149,999 | 371 (18.0%) | 727 (16.1%) |
| $150,000 or more | 303 (14.7%) | 1,508 (33.4%) |
| Total | 2,058 (100.0%) | 4,514 (100.0%) |
Property Value to Household Income Ratio in Chester
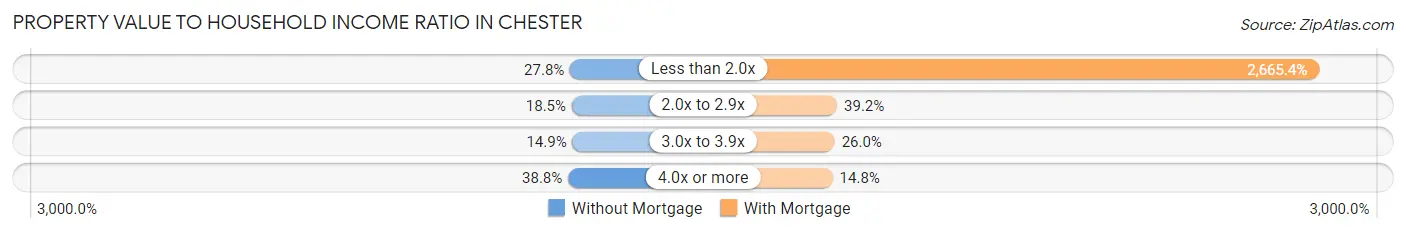
| Value-to-Income Ratio | Without Mortgage | With Mortgage |
| Less than 2.0x | 571 (27.8%) | 120,316 (2,665.4%) |
| 2.0x to 2.9x | 381 (18.5%) | 1,771 (39.2%) |
| 3.0x to 3.9x | 307 (14.9%) | 1,173 (26.0%) |
| 4.0x or more | 799 (38.8%) | 668 (14.8%) |
| Total | 2,058 (100.0%) | 4,514 (100.0%) |
Real Estate Taxes by Mortgage Status in Chester
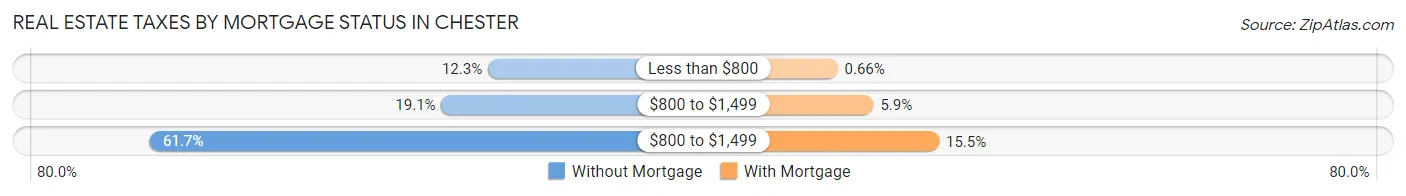
| Property Taxes | Without Mortgage | With Mortgage |
| Less than $800 | 253 (12.3%) | 30 (0.7%) |
| $800 to $1,499 | 393 (19.1%) | 267 (5.9%) |
| $800 to $1,499 | 1,269 (61.7%) | 699 (15.5%) |
| Total | 2,058 (100.0%) | 4,514 (100.0%) |
Health & Disability in Chester
Health Insurance Coverage by Age in Chester
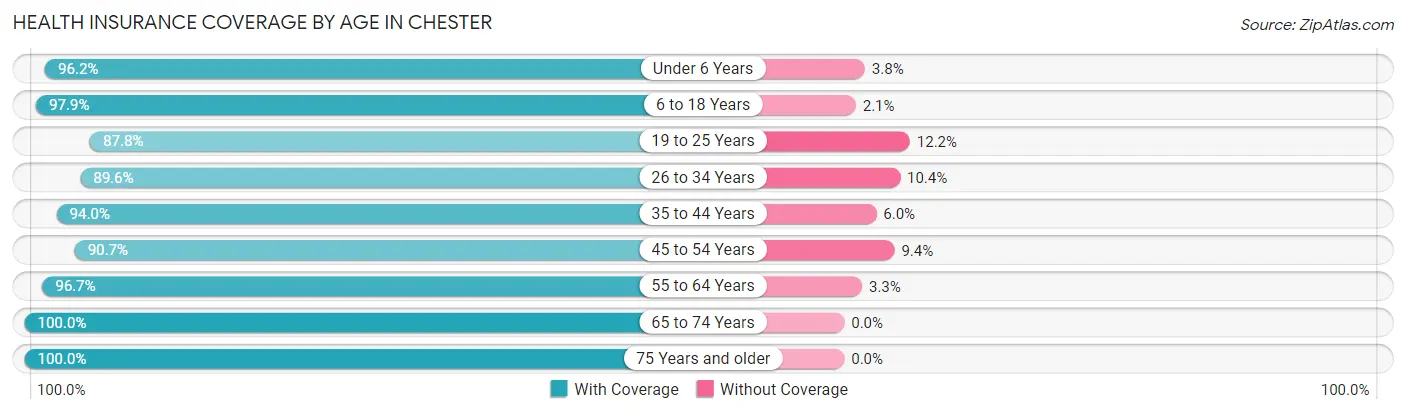
| Age Bracket | With Coverage | Without Coverage |
| Under 6 Years | 1,402 (96.2%) | 56 (3.8%) |
| 6 to 18 Years | 3,802 (97.9%) | 83 (2.1%) |
| 19 to 25 Years | 1,593 (87.8%) | 222 (12.2%) |
| 26 to 34 Years | 2,337 (89.6%) | 271 (10.4%) |
| 35 to 44 Years | 2,600 (94.0%) | 165 (6.0%) |
| 45 to 54 Years | 3,201 (90.6%) | 330 (9.3%) |
| 55 to 64 Years | 3,092 (96.7%) | 106 (3.3%) |
| 65 to 74 Years | 2,094 (100.0%) | 0 (0.0%) |
| 75 Years and older | 1,500 (100.0%) | 0 (0.0%) |
| Total | 21,621 (94.6%) | 1,233 (5.4%) |
Health Insurance Coverage by Citizenship Status in Chester
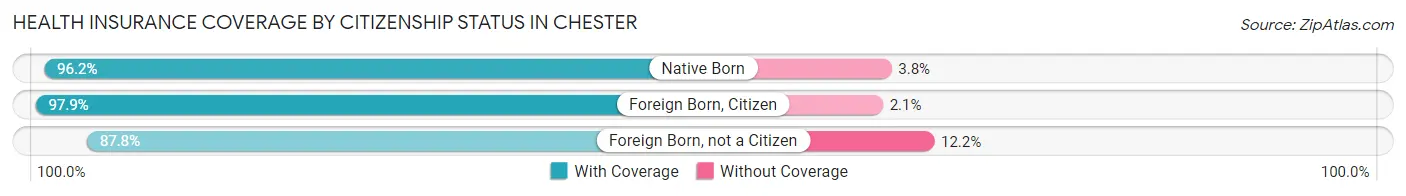
| Citizenship Status | With Coverage | Without Coverage |
| Native Born | 1,402 (96.2%) | 56 (3.8%) |
| Foreign Born, Citizen | 3,802 (97.9%) | 83 (2.1%) |
| Foreign Born, not a Citizen | 1,593 (87.8%) | 222 (12.2%) |
Health Insurance Coverage by Household Income in Chester
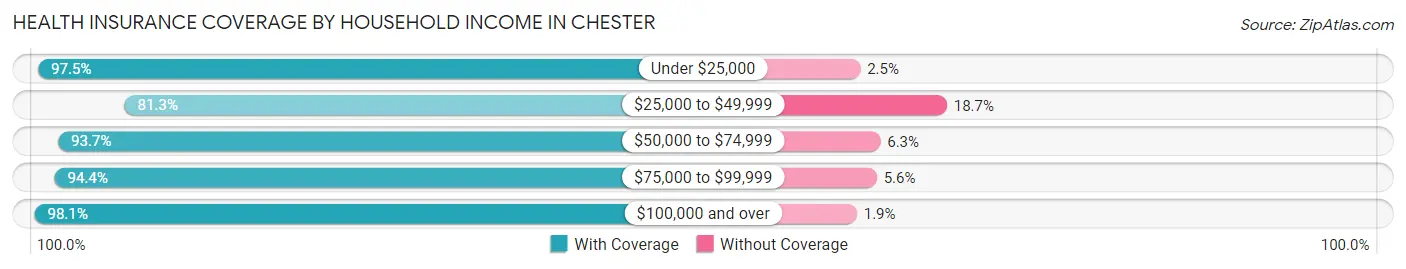
| Household Income | With Coverage | Without Coverage |
| Under $25,000 | 2,047 (97.5%) | 53 (2.5%) |
| $25,000 to $49,999 | 2,421 (81.3%) | 558 (18.7%) |
| $50,000 to $74,999 | 3,305 (93.7%) | 221 (6.3%) |
| $75,000 to $99,999 | 3,383 (94.4%) | 201 (5.6%) |
| $100,000 and over | 10,461 (98.1%) | 199 (1.9%) |
Public vs Private Health Insurance Coverage by Age in Chester
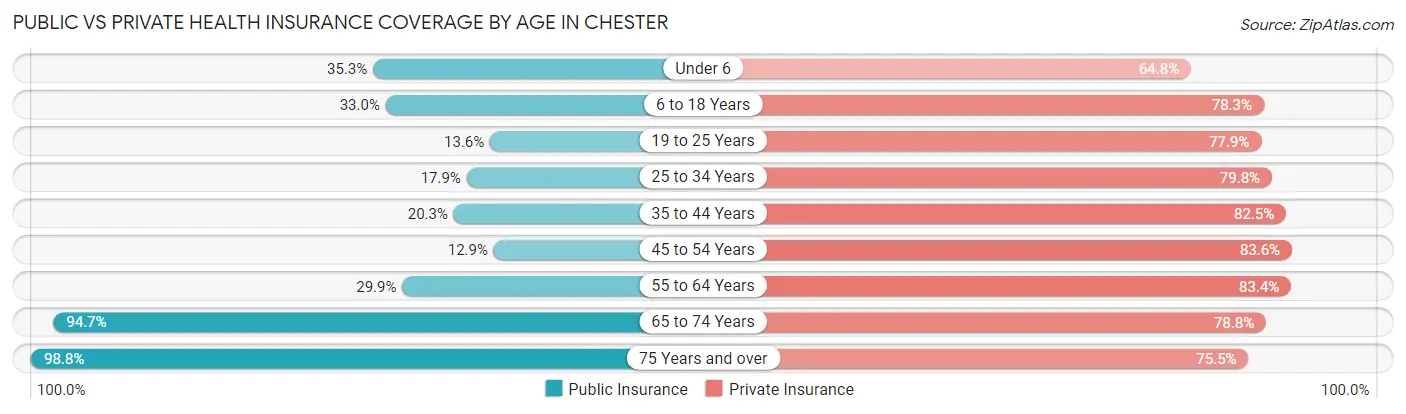
| Age Bracket | Public Insurance | Private Insurance |
| Under 6 | 515 (35.3%) | 945 (64.8%) |
| 6 to 18 Years | 1,281 (33.0%) | 3,043 (78.3%) |
| 19 to 25 Years | 247 (13.6%) | 1,413 (77.8%) |
| 25 to 34 Years | 468 (17.9%) | 2,082 (79.8%) |
| 35 to 44 Years | 562 (20.3%) | 2,280 (82.5%) |
| 45 to 54 Years | 456 (12.9%) | 2,950 (83.6%) |
| 55 to 64 Years | 956 (29.9%) | 2,667 (83.4%) |
| 65 to 74 Years | 1,982 (94.7%) | 1,649 (78.7%) |
| 75 Years and over | 1,482 (98.8%) | 1,132 (75.5%) |
| Total | 7,949 (34.8%) | 18,161 (79.5%) |
Disability Status by Sex by Age in Chester
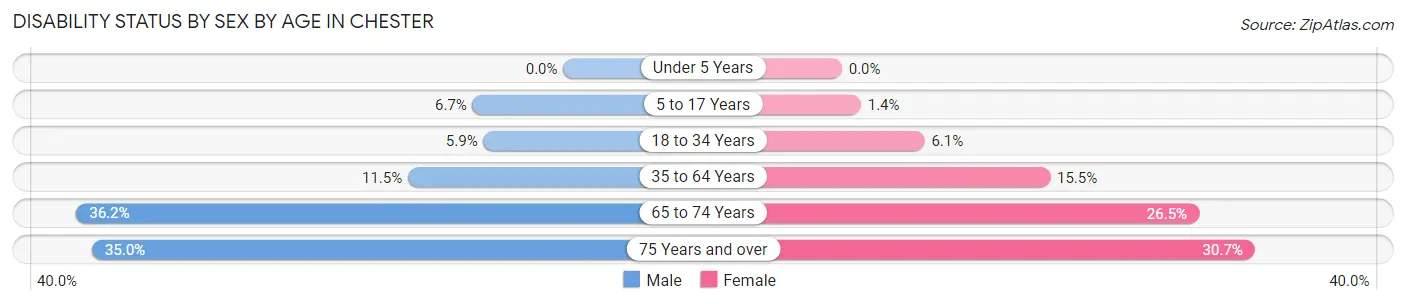
| Age Bracket | Male | Female |
| Under 5 Years | 0 (0.0%) | 0 (0.0%) |
| 5 to 17 Years | 151 (6.7%) | 22 (1.4%) |
| 18 to 34 Years | 145 (5.9%) | 136 (6.1%) |
| 35 to 64 Years | 513 (11.5%) | 780 (15.5%) |
| 65 to 74 Years | 303 (36.2%) | 333 (26.5%) |
| 75 Years and over | 203 (35.0%) | 282 (30.6%) |
Disability Class by Sex by Age in Chester
Disability Class: Hearing Difficulty
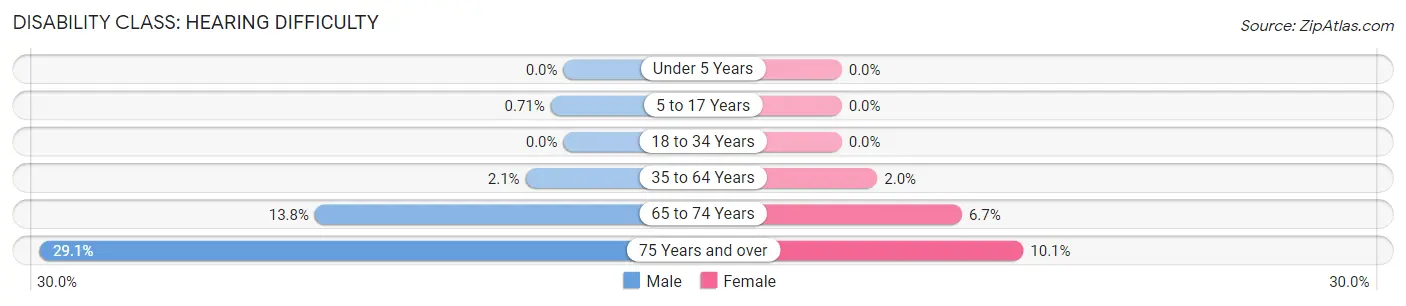
| Age Bracket | Male | Female |
| Under 5 Years | 0 (0.0%) | 0 (0.0%) |
| 5 to 17 Years | 16 (0.7%) | 0 (0.0%) |
| 18 to 34 Years | 0 (0.0%) | 0 (0.0%) |
| 35 to 64 Years | 94 (2.1%) | 100 (2.0%) |
| 65 to 74 Years | 116 (13.8%) | 84 (6.7%) |
| 75 Years and over | 169 (29.1%) | 93 (10.1%) |
Disability Class: Vision Difficulty
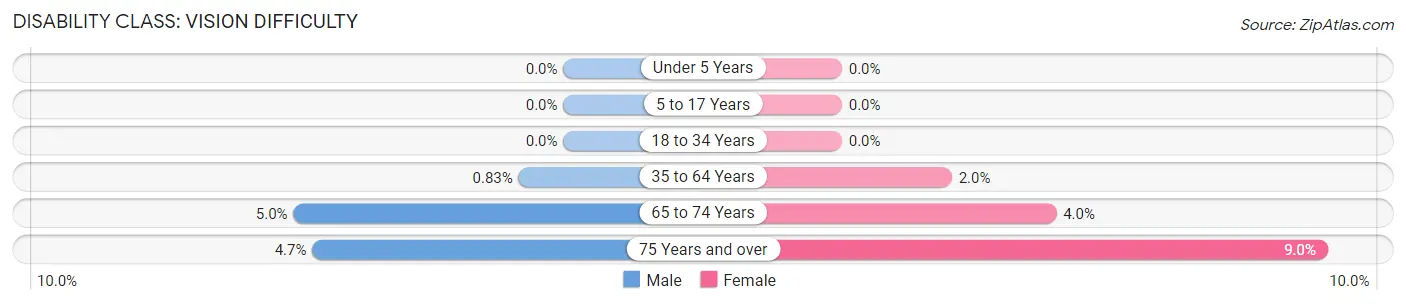
| Age Bracket | Male | Female |
| Under 5 Years | 0 (0.0%) | 0 (0.0%) |
| 5 to 17 Years | 0 (0.0%) | 0 (0.0%) |
| 18 to 34 Years | 0 (0.0%) | 0 (0.0%) |
| 35 to 64 Years | 37 (0.8%) | 103 (2.0%) |
| 65 to 74 Years | 42 (5.0%) | 50 (4.0%) |
| 75 Years and over | 27 (4.7%) | 83 (9.0%) |
Disability Class: Cognitive Difficulty
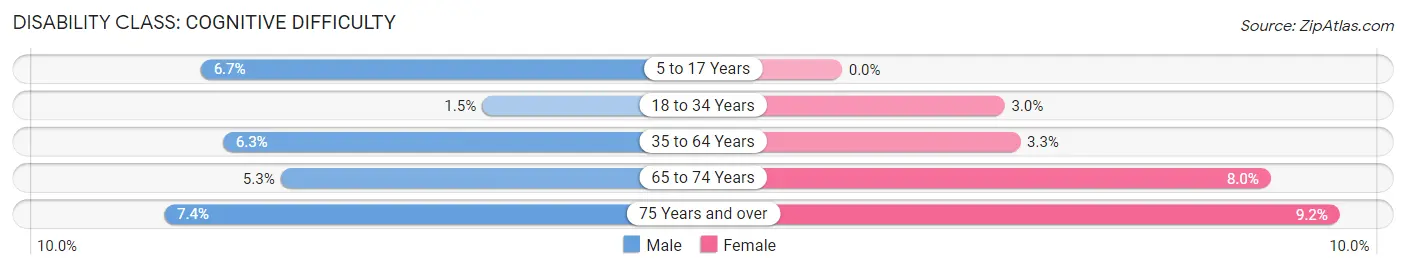
| Age Bracket | Male | Female |
| 5 to 17 Years | 151 (6.7%) | 0 (0.0%) |
| 18 to 34 Years | 37 (1.5%) | 67 (3.0%) |
| 35 to 64 Years | 281 (6.3%) | 167 (3.3%) |
| 65 to 74 Years | 44 (5.2%) | 100 (8.0%) |
| 75 Years and over | 43 (7.4%) | 85 (9.2%) |
Disability Class: Ambulatory Difficulty
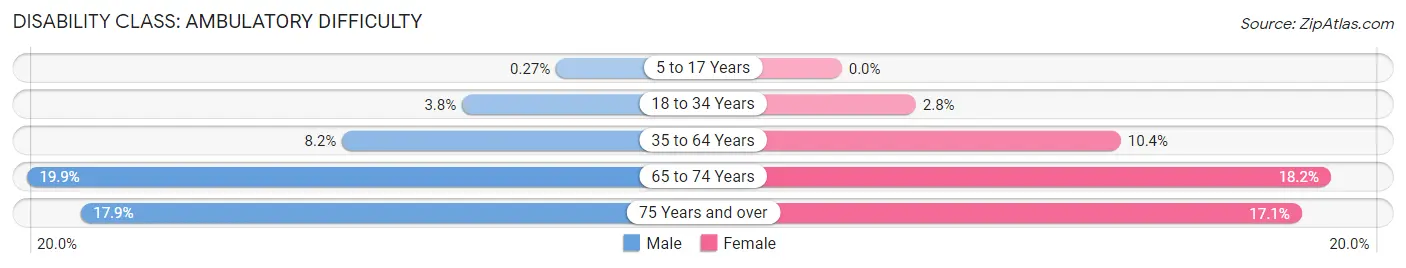
| Age Bracket | Male | Female |
| 5 to 17 Years | 6 (0.3%) | 0 (0.0%) |
| 18 to 34 Years | 92 (3.8%) | 61 (2.8%) |
| 35 to 64 Years | 365 (8.2%) | 523 (10.4%) |
| 65 to 74 Years | 167 (19.9%) | 228 (18.1%) |
| 75 Years and over | 104 (17.9%) | 157 (17.1%) |
Disability Class: Self-Care Difficulty
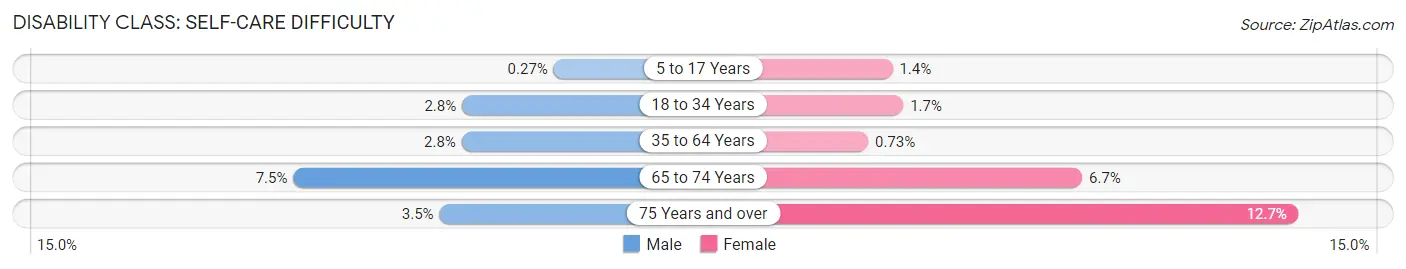
| Age Bracket | Male | Female |
| 5 to 17 Years | 6 (0.3%) | 22 (1.4%) |
| 18 to 34 Years | 69 (2.8%) | 38 (1.7%) |
| 35 to 64 Years | 126 (2.8%) | 37 (0.7%) |
| 65 to 74 Years | 63 (7.5%) | 84 (6.7%) |
| 75 Years and over | 20 (3.5%) | 117 (12.7%) |
Technology Access in Chester
Computing Device Access in Chester
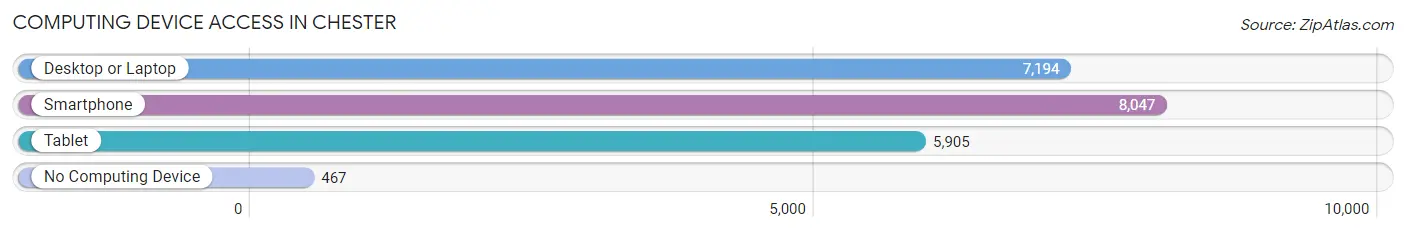
| Device Type | # Households | % Households |
| Desktop or Laptop | 7,194 | 80.0% |
| Smartphone | 8,047 | 89.5% |
| Tablet | 5,905 | 65.7% |
| No Computing Device | 467 | 5.2% |
| Total | 8,989 | 100.0% |
Internet Access in Chester
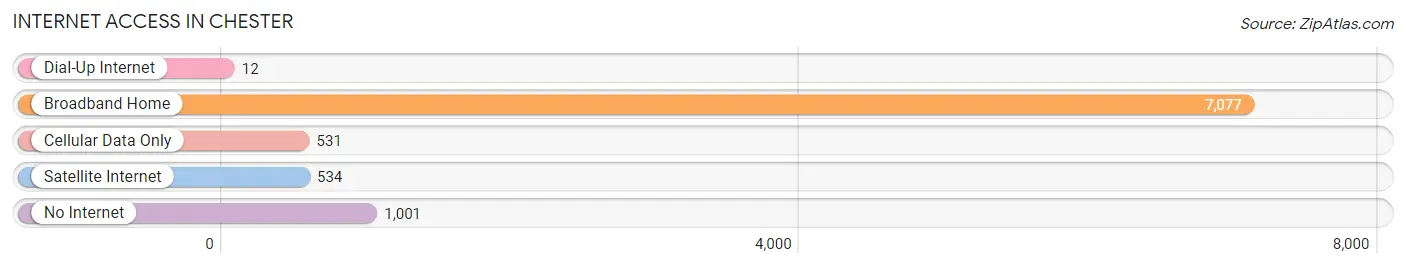
| Internet Type | # Households | % Households |
| Dial-Up Internet | 12 | 0.1% |
| Broadband Home | 7,077 | 78.7% |
| Cellular Data Only | 531 | 5.9% |
| Satellite Internet | 534 | 5.9% |
| No Internet | 1,001 | 11.1% |
| Total | 8,989 | 100.0% |
Chester Summary
Chester, Virginia is a small city located in the Richmond metropolitan area of Virginia. It is situated on the Appomattox River, about 20 miles south of Richmond. The city has a population of about 22,000 people and is part of Chesterfield County.
History
Chester was first settled in the early 1700s by English colonists. The town was originally known as “Chesterfield” and was named after the Earl of Chesterfield. The town was incorporated in 1749 and was the first town in Chesterfield County. During the American Revolution, Chester was a major supply center for the Continental Army. After the war, the town grew rapidly and became a major port for the export of tobacco and other goods.
In the 19th century, Chester became a major railroad hub and was the site of the first railroad bridge across the Appomattox River. The town was also the site of the first Confederate victory of the Civil War, the Battle of Chester Station. After the war, the town continued to grow and by the early 20th century, it was a major industrial center.
Geography
Chester is located in the Richmond metropolitan area of Virginia. It is situated on the Appomattox River, about 20 miles south of Richmond. The city has a total area of 8.3 square miles, of which 8.2 square miles is land and 0.1 square miles is water. The city is located in the Piedmont region of Virginia and is characterized by rolling hills and wooded areas.
Economy
Chester’s economy is largely based on manufacturing and retail. The city is home to several large manufacturing companies, including Philip Morris USA, which produces cigarettes, and the DuPont Company, which produces chemicals. The city is also home to several large retail stores, including Walmart, Target, and Lowe’s.
Demographics
As of the 2010 census, Chester had a population of 22,096 people. The racial makeup of the city was 68.3% White, 24.2% African American, 0.4% Native American, 2.2% Asian, 0.1% Pacific Islander, and 4.8% from other races. The median household income was $50,945 and the median family income was $60,945. The per capita income was $25,945.
Chester is a diverse city with a rich history and a vibrant economy. The city is home to a variety of businesses and industries, and is a great place to live and work. With its convenient location and strong economy, Chester is an ideal place to call home.
Common Questions
What is Per Capita Income in Chester?
Per Capita income in Chester is $43,510.
What is the Median Family Income in Chester?
Median Family Income in Chester is $106,545.
What is the Median Household income in Chester?
Median Household Income in Chester is $87,242.
What is Income or Wage Gap in Chester?
Income or Wage Gap in Chester is 24.7%.
Women in Chester earn 75.3 cents for every dollar earned by a man.
What is Inequality or Gini Index in Chester?
Inequality or Gini Index in Chester is 0.43.
What is the Total Population of Chester?
Total Population of Chester is 23,068.
What is the Total Male Population of Chester?
Total Male Population of Chester is 11,554.
What is the Total Female Population of Chester?
Total Female Population of Chester is 11,514.
What is the Ratio of Males per 100 Females in Chester?
There are 100.35 Males per 100 Females in Chester.
What is the Ratio of Females per 100 Males in Chester?
There are 99.65 Females per 100 Males in Chester.
What is the Median Population Age in Chester?
Median Population Age in Chester is 40.6 Years.
What is the Average Family Size in Chester
Average Family Size in Chester is 3.0 People.
What is the Average Household Size in Chester
Average Household Size in Chester is 2.6 People.
How Large is the Labor Force in Chester?
There are 12,406 People in the Labor Forcein in Chester.
What is the Percentage of People in the Labor Force in Chester?
66.6% of People are in the Labor Force in Chester.
What is the Unemployment Rate in Chester?
Unemployment Rate in Chester is 3.5%.