Ettrick, VA Map & Demographics
Ettrick Map
Ettrick Overview
$20,486
PER CAPITA INCOME
$66,573
AVG FAMILY INCOME
$53,555
AVG HOUSEHOLD INCOME
6.5%
WAGE / INCOME GAP [ % ]
93.5¢/ $1
WAGE / INCOME GAP [ $ ]
0.39
INEQUALITY / GINI INDEX
5,632
TOTAL POPULATION
2,647
MALE POPULATION
2,985
FEMALE POPULATION
88.68
MALES / 100 FEMALES
112.77
FEMALES / 100 MALES
25.3
MEDIAN AGE
2.8
AVG FAMILY SIZE
2.3
AVG HOUSEHOLD SIZE
2,947
LABOR FORCE [ PEOPLE ]
58.7%
PERCENT IN LABOR FORCE
15.1%
UNEMPLOYMENT RATE
Income in Ettrick
Income Overview in Ettrick
Per Capita Income in Ettrick is $20,486, while median incomes of families and households are $66,573 and $53,555 respectively.
| Characteristic | Number | Measure |
| Per Capita Income | 5,632 | $20,486 |
| Median Family Income | 1,137 | $66,573 |
| Mean Family Income | 1,137 | $70,471 |
| Median Household Income | 1,624 | $53,555 |
| Mean Household Income | 1,624 | $63,745 |
| Income Deficit | 1,137 | $0 |
| Wage / Income Gap (%) | 5,632 | 6.52% |
| Wage / Income Gap ($) | 5,632 | 93.48¢ per $1 |
| Gini / Inequality Index | 5,632 | 0.39 |
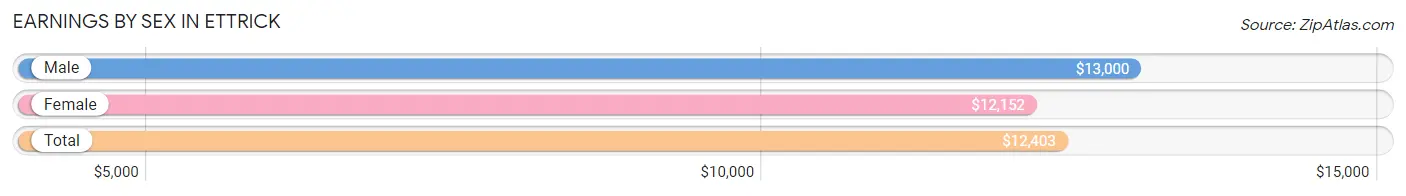
Earnings by Sex in Ettrick
Average Earnings in Ettrick are $12,403, $13,000 for men and $12,152 for women, a difference of 6.5%.
| Sex | Number | Average Earnings |
| Male | 1,630 (43.7%) | $13,000 |
| Female | 2,102 (56.3%) | $12,152 |
| Total | 3,732 (100.0%) | $12,403 |
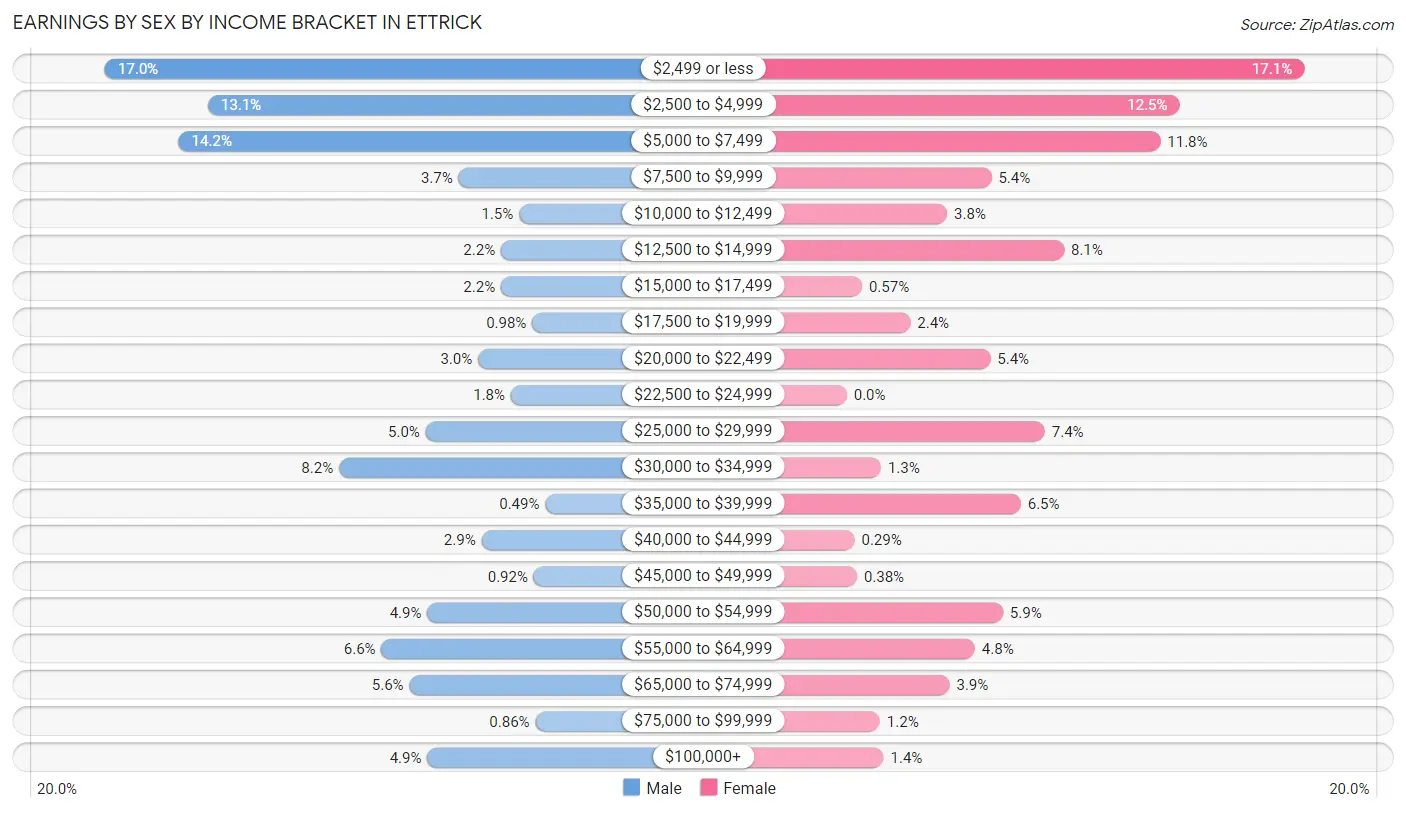
Earnings by Sex by Income Bracket in Ettrick
The most common earnings brackets in Ettrick are $2,499 or less for men (277 | 17.0%) and $2,499 or less for women (360 | 17.1%).
| Income | Male | Female |
| $2,499 or less | 277 (17.0%) | 360 (17.1%) |
| $2,500 to $4,999 | 214 (13.1%) | 262 (12.5%) |
| $5,000 to $7,499 | 232 (14.2%) | 247 (11.7%) |
| $7,500 to $9,999 | 61 (3.7%) | 114 (5.4%) |
| $10,000 to $12,499 | 24 (1.5%) | 79 (3.8%) |
| $12,500 to $14,999 | 35 (2.1%) | 171 (8.1%) |
| $15,000 to $17,499 | 35 (2.1%) | 12 (0.6%) |
| $17,500 to $19,999 | 16 (1.0%) | 50 (2.4%) |
| $20,000 to $22,499 | 49 (3.0%) | 113 (5.4%) |
| $22,500 to $24,999 | 29 (1.8%) | 0 (0.0%) |
| $25,000 to $29,999 | 81 (5.0%) | 156 (7.4%) |
| $30,000 to $34,999 | 134 (8.2%) | 27 (1.3%) |
| $35,000 to $39,999 | 8 (0.5%) | 137 (6.5%) |
| $40,000 to $44,999 | 47 (2.9%) | 6 (0.3%) |
| $45,000 to $49,999 | 15 (0.9%) | 8 (0.4%) |
| $50,000 to $54,999 | 80 (4.9%) | 123 (5.9%) |
| $55,000 to $64,999 | 108 (6.6%) | 101 (4.8%) |
| $65,000 to $74,999 | 91 (5.6%) | 81 (3.8%) |
| $75,000 to $99,999 | 14 (0.9%) | 26 (1.2%) |
| $100,000+ | 80 (4.9%) | 29 (1.4%) |
| Total | 1,630 (100.0%) | 2,102 (100.0%) |
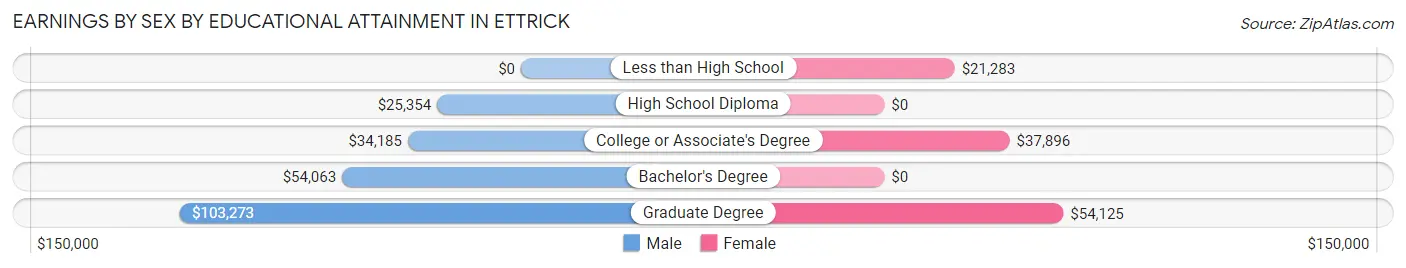
Earnings by Sex by Educational Attainment in Ettrick
Average earnings in Ettrick are $34,414 for men and $29,963 for women, a difference of 12.9%. Men with an educational attainment of graduate degree enjoy the highest average annual earnings of $103,273, while those with high school diploma education earn the least with $25,354. Women with an educational attainment of graduate degree earn the most with the average annual earnings of $54,125, while those with less than high school education have the smallest earnings of $21,283.
| Educational Attainment | Male Income | Female Income |
| Less than High School | - | - |
| High School Diploma | $25,354 | $0 |
| College or Associate's Degree | $34,185 | $37,896 |
| Bachelor's Degree | $54,063 | $0 |
| Graduate Degree | $103,273 | $54,125 |
| Total | $34,414 | $29,963 |
Family Income in Ettrick
Family Income Brackets in Ettrick
According to the Ettrick family income data, there are 363 families falling into the $50,000 to $74,999 income range, which is the most common income bracket and makes up 31.9% of all families.
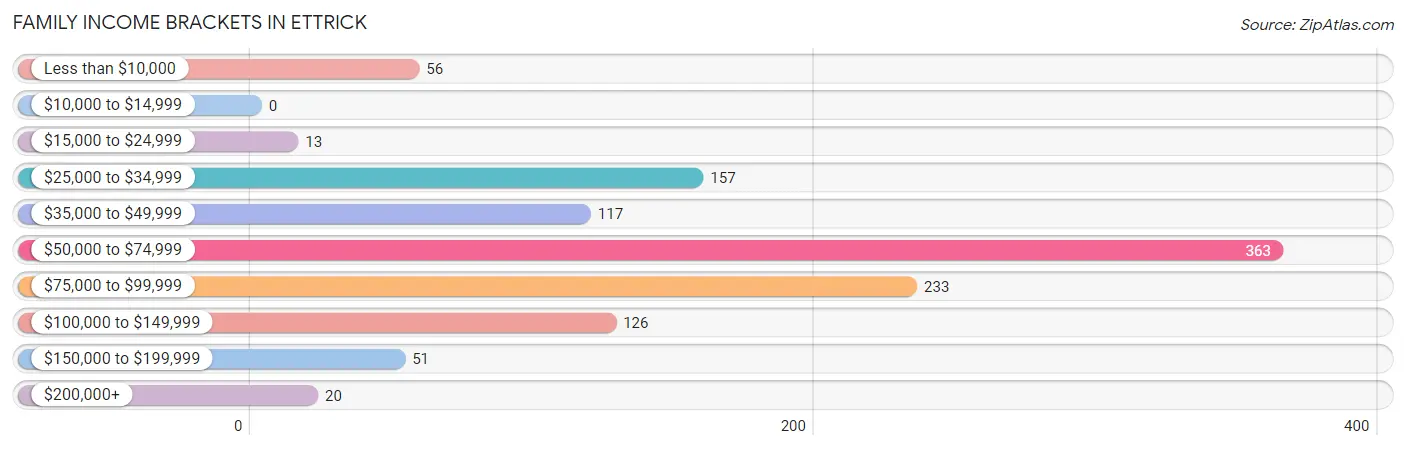
| Income Bracket | # Families | % Families |
| Less than $10,000 | 56 | 4.9% |
| $10,000 to $14,999 | 0 | 0.0% |
| $15,000 to $24,999 | 13 | 1.1% |
| $25,000 to $34,999 | 157 | 13.8% |
| $35,000 to $49,999 | 117 | 10.3% |
| $50,000 to $74,999 | 363 | 31.9% |
| $75,000 to $99,999 | 233 | 20.5% |
| $100,000 to $149,999 | 126 | 11.1% |
| $150,000 to $199,999 | 51 | 4.5% |
| $200,000+ | 20 | 1.8% |
Family Income by Famaliy Size in Ettrick
4-person families (165 | 14.5%) account for the highest median family income in Ettrick with $85,787 per family, while 2-person families (668 | 58.8%) have the highest median income of $32,737 per family member.
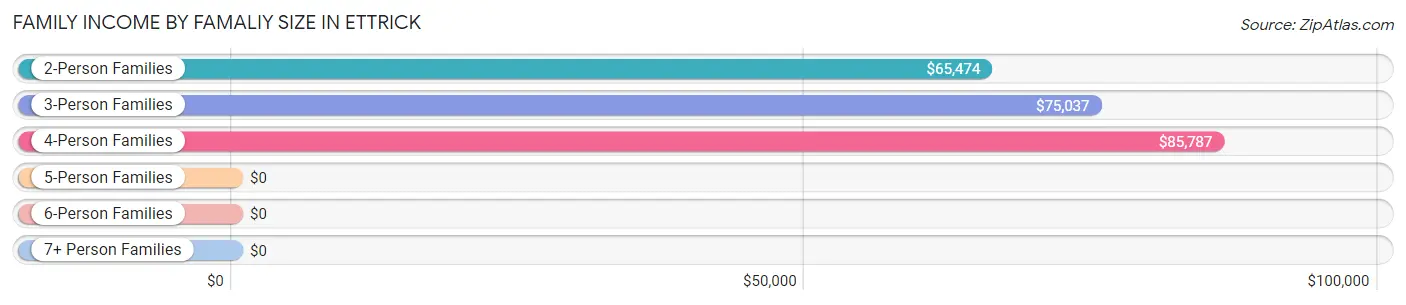
| Income Bracket | # Families | Median Income |
| 2-Person Families | 668 (58.8%) | $65,474 |
| 3-Person Families | 252 (22.2%) | $75,037 |
| 4-Person Families | 165 (14.5%) | $85,787 |
| 5-Person Families | 25 (2.2%) | $0 |
| 6-Person Families | 15 (1.3%) | $0 |
| 7+ Person Families | 12 (1.1%) | $0 |
| Total | 1,137 (100.0%) | $66,573 |
Family Income by Number of Earners in Ettrick
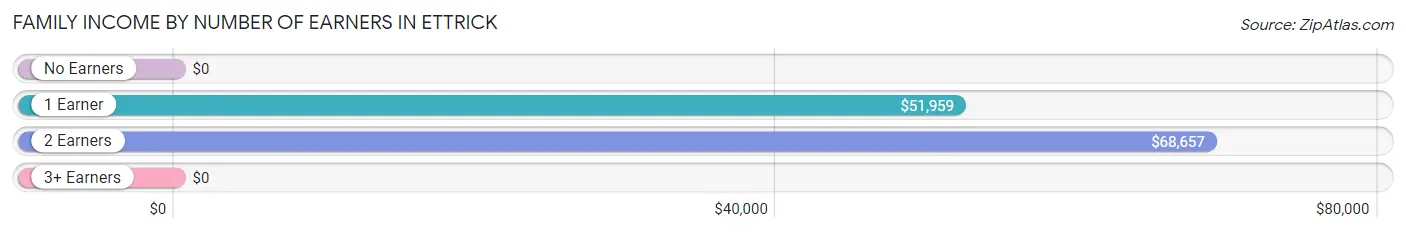
| Number of Earners | # Families | Median Income |
| No Earners | 96 (8.4%) | $0 |
| 1 Earner | 330 (29.0%) | $51,959 |
| 2 Earners | 647 (56.9%) | $68,657 |
| 3+ Earners | 64 (5.6%) | $0 |
| Total | 1,137 (100.0%) | $66,573 |
Household Income in Ettrick
Household Income Brackets in Ettrick
With 393 households falling in the category, the $50,000 to $74,999 income range is the most frequent in Ettrick, accounting for 24.2% of all households. In contrast, only 10 households (0.6%) fall into the $10,000 to $14,999 income bracket, making it the least populous group.
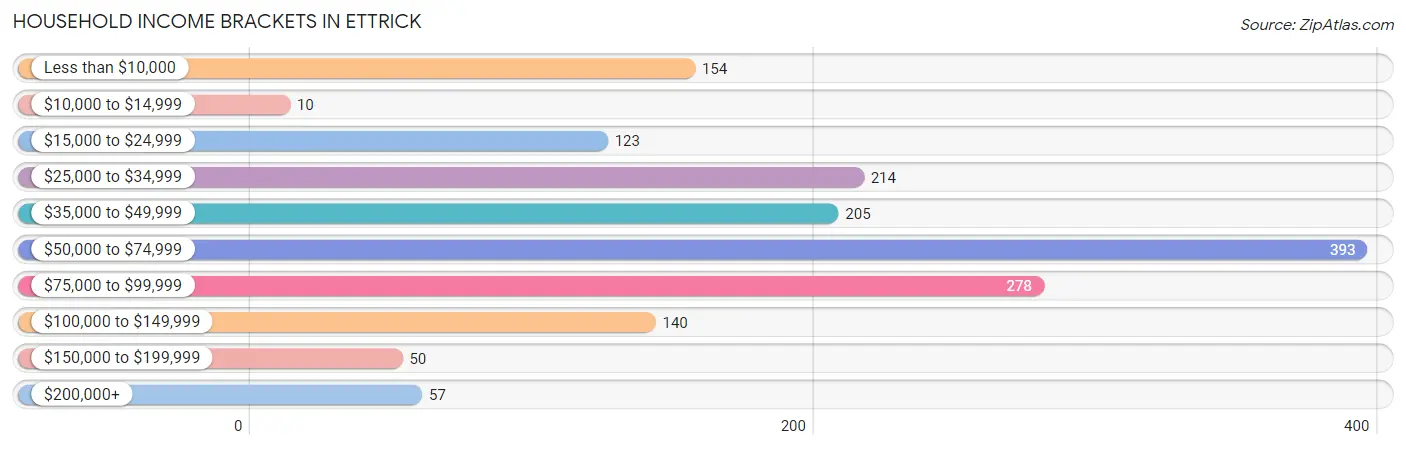
| Income Bracket | # Households | % Households |
| Less than $10,000 | 154 | 9.5% |
| $10,000 to $14,999 | 10 | 0.6% |
| $15,000 to $24,999 | 123 | 7.6% |
| $25,000 to $34,999 | 214 | 13.2% |
| $35,000 to $49,999 | 205 | 12.6% |
| $50,000 to $74,999 | 393 | 24.2% |
| $75,000 to $99,999 | 278 | 17.1% |
| $100,000 to $149,999 | 140 | 8.6% |
| $150,000 to $199,999 | 50 | 3.1% |
| $200,000+ | 57 | 3.5% |
Household Income by Householder Age in Ettrick
The median household income in Ettrick is $53,555, with the highest median household income of $70,321 found in the 25 to 44 years age bracket for the primary householder. A total of 538 households (33.1%) fall into this category.
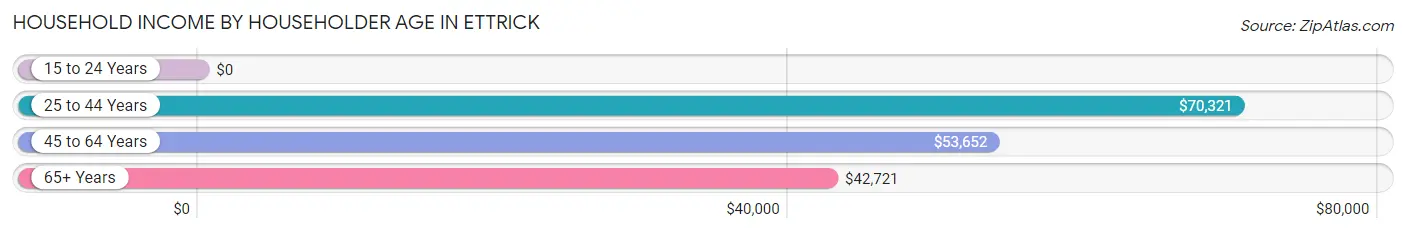
| Income Bracket | # Households | Median Income |
| 15 to 24 Years | 0 (0.0%) | $0 |
| 25 to 44 Years | 538 (33.1%) | $70,321 |
| 45 to 64 Years | 561 (34.5%) | $53,652 |
| 65+ Years | 525 (32.3%) | $42,721 |
| Total | 1,624 (100.0%) | $53,555 |
Poverty in Ettrick
Income Below Poverty by Sex and Age in Ettrick
With 3.9% poverty level for males and 10.5% for females among the residents of Ettrick, 55 to 64 year old males and 75 year old and over females are the most vulnerable to poverty, with 59 males (20.4%) and 30 females (27.0%) in their respective age groups living below the poverty level.
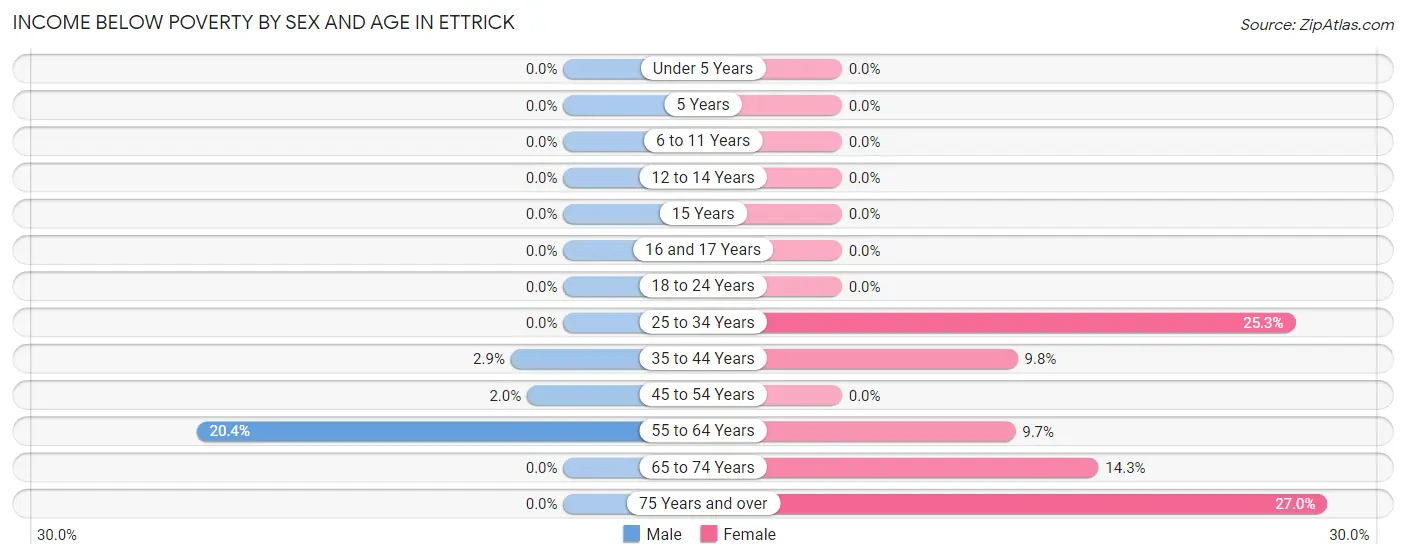
| Age Bracket | Male | Female |
| Under 5 Years | 0 (0.0%) | 0 (0.0%) |
| 5 Years | 0 (0.0%) | 0 (0.0%) |
| 6 to 11 Years | 0 (0.0%) | 0 (0.0%) |
| 12 to 14 Years | 0 (0.0%) | 0 (0.0%) |
| 15 Years | 0 (0.0%) | 0 (0.0%) |
| 16 and 17 Years | 0 (0.0%) | 0 (0.0%) |
| 18 to 24 Years | 0 (0.0%) | 0 (0.0%) |
| 25 to 34 Years | 0 (0.0%) | 75 (25.3%) |
| 35 to 44 Years | 6 (2.9%) | 19 (9.8%) |
| 45 to 54 Years | 2 (2.0%) | 0 (0.0%) |
| 55 to 64 Years | 59 (20.4%) | 48 (9.7%) |
| 65 to 74 Years | 0 (0.0%) | 40 (14.3%) |
| 75 Years and over | 0 (0.0%) | 30 (27.0%) |
| Total | 67 (3.9%) | 212 (10.5%) |
Income Above Poverty by Sex and Age in Ettrick
According to the poverty statistics in Ettrick, males aged under 5 years and females aged under 5 years are the age groups that are most secure financially, with 100.0% of males and 100.0% of females in these age groups living above the poverty line.
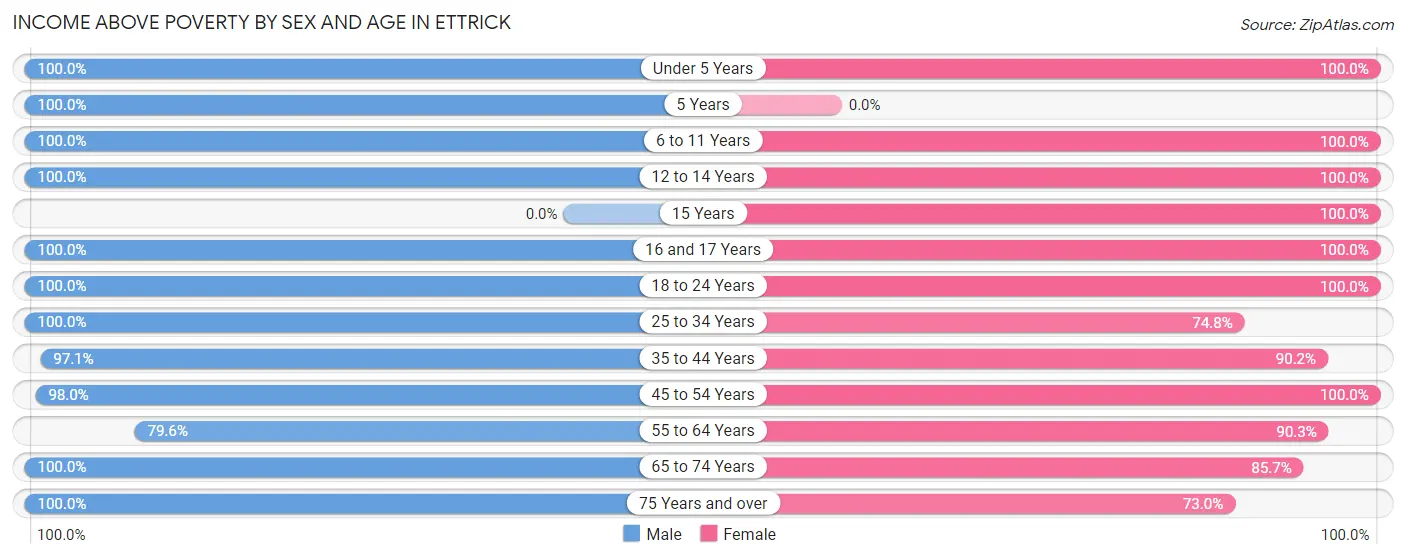
| Age Bracket | Male | Female |
| Under 5 Years | 92 (100.0%) | 145 (100.0%) |
| 5 Years | 30 (100.0%) | 0 (0.0%) |
| 6 to 11 Years | 160 (100.0%) | 91 (100.0%) |
| 12 to 14 Years | 66 (100.0%) | 5 (100.0%) |
| 15 Years | 0 (0.0%) | 17 (100.0%) |
| 16 and 17 Years | 12 (100.0%) | 80 (100.0%) |
| 18 to 24 Years | 90 (100.0%) | 171 (100.0%) |
| 25 to 34 Years | 336 (100.0%) | 222 (74.8%) |
| 35 to 44 Years | 199 (97.1%) | 175 (90.2%) |
| 45 to 54 Years | 97 (98.0%) | 131 (100.0%) |
| 55 to 64 Years | 230 (79.6%) | 449 (90.3%) |
| 65 to 74 Years | 301 (100.0%) | 240 (85.7%) |
| 75 Years and over | 47 (100.0%) | 81 (73.0%) |
| Total | 1,660 (96.1%) | 1,807 (89.5%) |
Income Below Poverty Among Married-Couple Families in Ettrick
The poverty statistics for married-couple families in Ettrick show that 7.3% or 48 of the total 655 families live below the poverty line. Families with no children have the highest poverty rate of 10.1%, comprising of 48 families. On the other hand, families with 1 or 2 children have the lowest poverty rate of 0.0%, which includes 0 families.
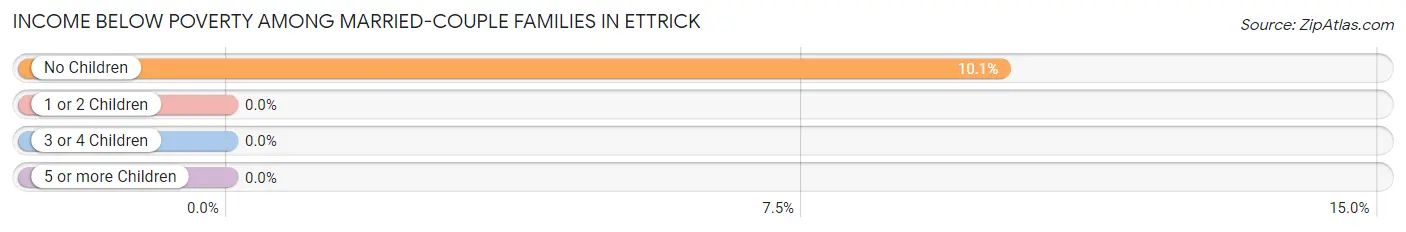
| Children | Above Poverty | Below Poverty |
| No Children | 428 (89.9%) | 48 (10.1%) |
| 1 or 2 Children | 164 (100.0%) | 0 (0.0%) |
| 3 or 4 Children | 15 (100.0%) | 0 (0.0%) |
| 5 or more Children | 0 (0.0%) | 0 (0.0%) |
| Total | 607 (92.7%) | 48 (7.3%) |
Income Below Poverty Among Single-Parent Households in Ettrick
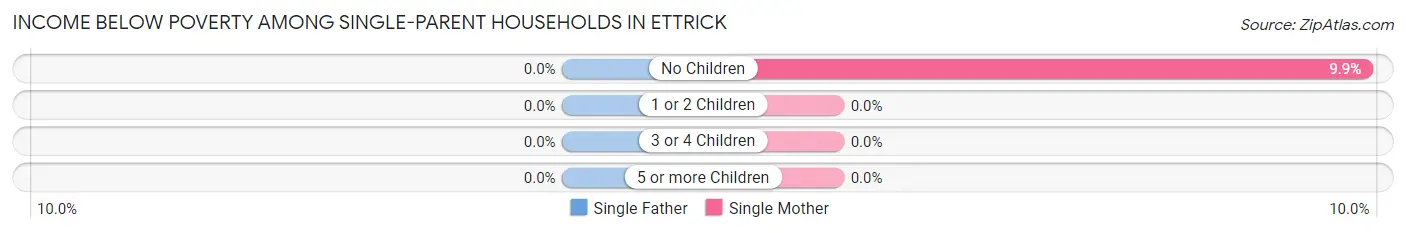
| Children | Single Father | Single Mother |
| No Children | 0 (0.0%) | 21 (9.9%) |
| 1 or 2 Children | 0 (0.0%) | 0 (0.0%) |
| 3 or 4 Children | 0 (0.0%) | 0 (0.0%) |
| 5 or more Children | 0 (0.0%) | 0 (0.0%) |
| Total | 0 (0.0%) | 21 (6.1%) |
Income Below Poverty Among Married-Couple vs Single-Parent Households in Ettrick
The poverty data for Ettrick shows that 48 of the married-couple family households (7.3%) and 21 of the single-parent households (4.4%) are living below the poverty level. Within the married-couple family households, those with no children have the highest poverty rate, with 48 households (10.1%) falling below the poverty line. Among the single-parent households, those with no children have the highest poverty rate, with 21 household (8.6%) living below poverty.
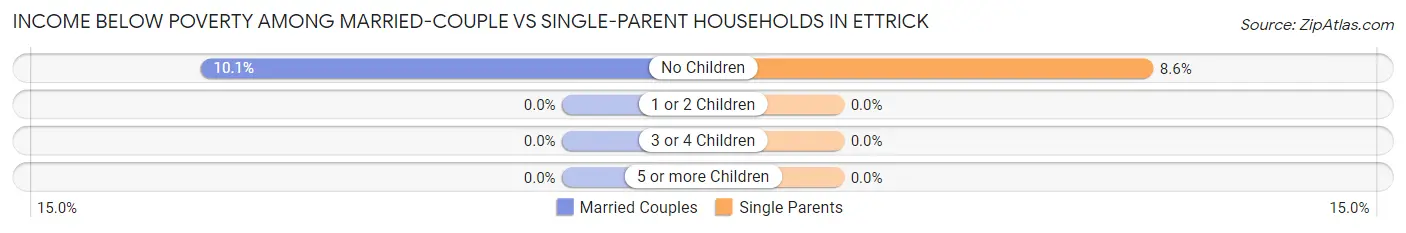
| Children | Married-Couple Families | Single-Parent Households |
| No Children | 48 (10.1%) | 21 (8.6%) |
| 1 or 2 Children | 0 (0.0%) | 0 (0.0%) |
| 3 or 4 Children | 0 (0.0%) | 0 (0.0%) |
| 5 or more Children | 0 (0.0%) | 0 (0.0%) |
| Total | 48 (7.3%) | 21 (4.4%) |
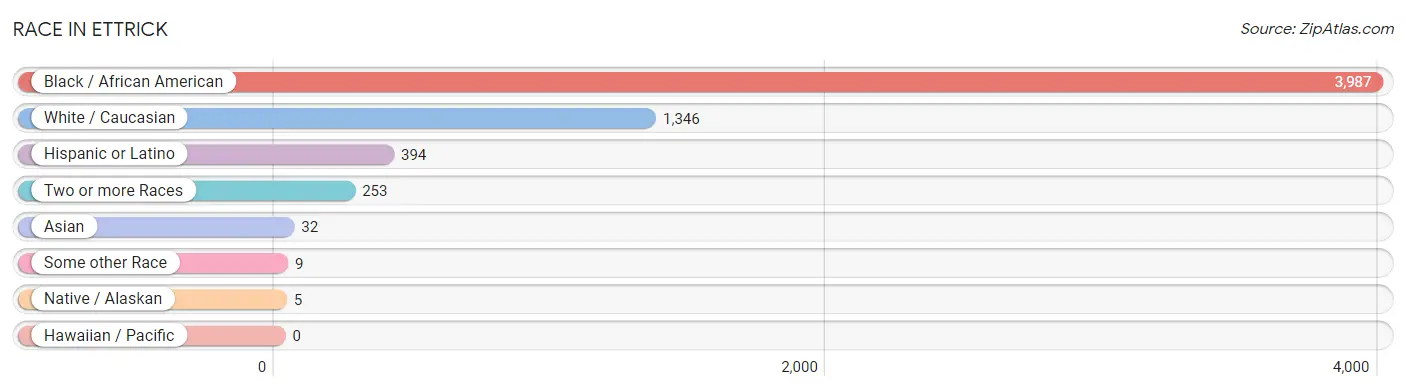
Race in Ettrick
The most populous races in Ettrick are Black / African American (3,987 | 70.8%), White / Caucasian (1,346 | 23.9%), and Hispanic or Latino (394 | 7.0%).
| Race | # Population | % Population |
| Asian | 32 | 0.6% |
| Black / African American | 3,987 | 70.8% |
| Hawaiian / Pacific | 0 | 0.0% |
| Hispanic or Latino | 394 | 7.0% |
| Native / Alaskan | 5 | 0.1% |
| White / Caucasian | 1,346 | 23.9% |
| Two or more Races | 253 | 4.5% |
| Some other Race | 9 | 0.2% |
| Total | 5,632 | 100.0% |
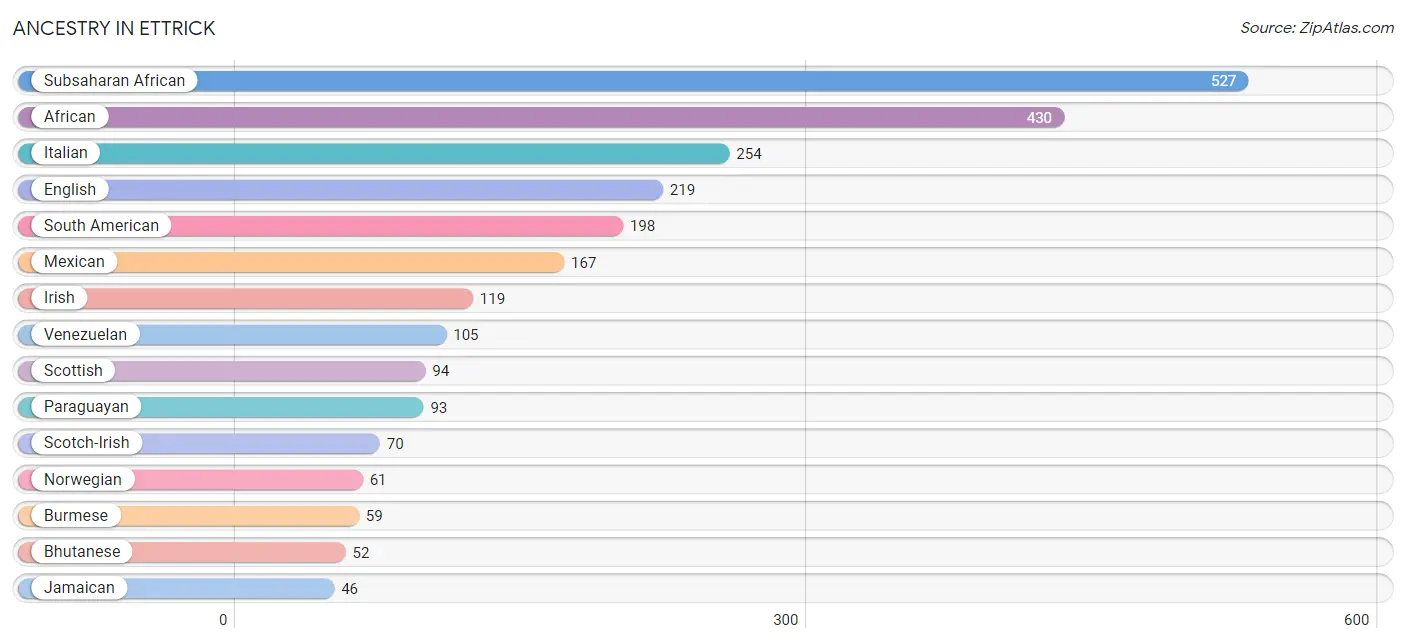
Ancestry in Ettrick
The most populous ancestries reported in Ettrick are Subsaharan African (527 | 9.4%), African (430 | 7.6%), Italian (254 | 4.5%), English (219 | 3.9%), and South American (198 | 3.5%), together accounting for 28.9% of all Ettrick residents.
| Ancestry | # Population | % Population |
| African | 430 | 7.6% |
| American | 40 | 0.7% |
| Armenian | 11 | 0.2% |
| Bhutanese | 52 | 0.9% |
| Blackfeet | 5 | 0.1% |
| British West Indian | 12 | 0.2% |
| Bulgarian | 12 | 0.2% |
| Burmese | 59 | 1.1% |
| Canadian | 11 | 0.2% |
| Celtic | 3 | 0.1% |
| Central American | 9 | 0.2% |
| Cherokee | 5 | 0.1% |
| Croatian | 9 | 0.2% |
| Czechoslovakian | 4 | 0.1% |
| English | 219 | 3.9% |
| Ethiopian | 8 | 0.1% |
| European | 4 | 0.1% |
| German | 42 | 0.7% |
| Greek | 12 | 0.2% |
| Guyanese | 10 | 0.2% |
| Honduran | 9 | 0.2% |
| Hungarian | 12 | 0.2% |
| Indian (Asian) | 10 | 0.2% |
| Irish | 119 | 2.1% |
| Italian | 254 | 4.5% |
| Jamaican | 46 | 0.8% |
| Korean | 18 | 0.3% |
| Lithuanian | 12 | 0.2% |
| Mexican | 167 | 3.0% |
| Nigerian | 12 | 0.2% |
| Norwegian | 61 | 1.1% |
| Paraguayan | 93 | 1.7% |
| Polish | 27 | 0.5% |
| Puerto Rican | 20 | 0.4% |
| Scotch-Irish | 70 | 1.2% |
| Scottish | 94 | 1.7% |
| South American | 198 | 3.5% |
| Sri Lankan | 24 | 0.4% |
| Subsaharan African | 527 | 9.4% |
| Swiss | 3 | 0.1% |
| Thai | 3 | 0.1% |
| Trinidadian and Tobagonian | 28 | 0.5% |
| Venezuelan | 105 | 1.9% |
| West Indian | 2 | 0.0% | View All 44 Rows |
Immigrants in Ettrick
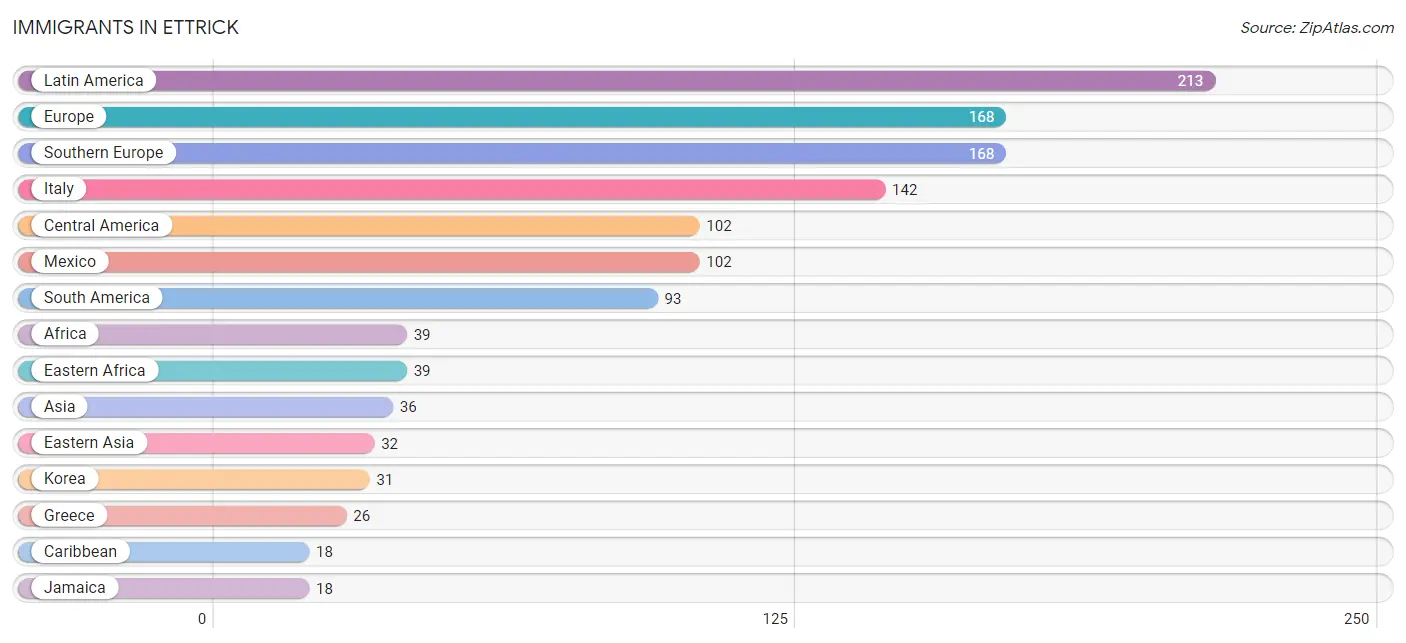
The most numerous immigrant groups reported in Ettrick came from Latin America (213 | 3.8%), Europe (168 | 3.0%), Southern Europe (168 | 3.0%), Italy (142 | 2.5%), and Central America (102 | 1.8%), together accounting for 14.1% of all Ettrick residents.
| Immigration Origin | # Population | % Population |
| Africa | 39 | 0.7% |
| Asia | 36 | 0.6% |
| Caribbean | 18 | 0.3% |
| Central America | 102 | 1.8% |
| Eastern Africa | 39 | 0.7% |
| Eastern Asia | 32 | 0.6% |
| Ethiopia | 1 | 0.0% |
| Europe | 168 | 3.0% |
| Greece | 26 | 0.5% |
| Italy | 142 | 2.5% |
| Jamaica | 18 | 0.3% |
| Japan | 1 | 0.0% |
| Korea | 31 | 0.5% |
| Latin America | 213 | 3.8% |
| Mexico | 102 | 1.8% |
| Philippines | 4 | 0.1% |
| South America | 93 | 1.7% |
| South Eastern Asia | 4 | 0.1% |
| Southern Europe | 168 | 3.0% | View All 19 Rows |
Sex and Age in Ettrick
Sex and Age in Ettrick
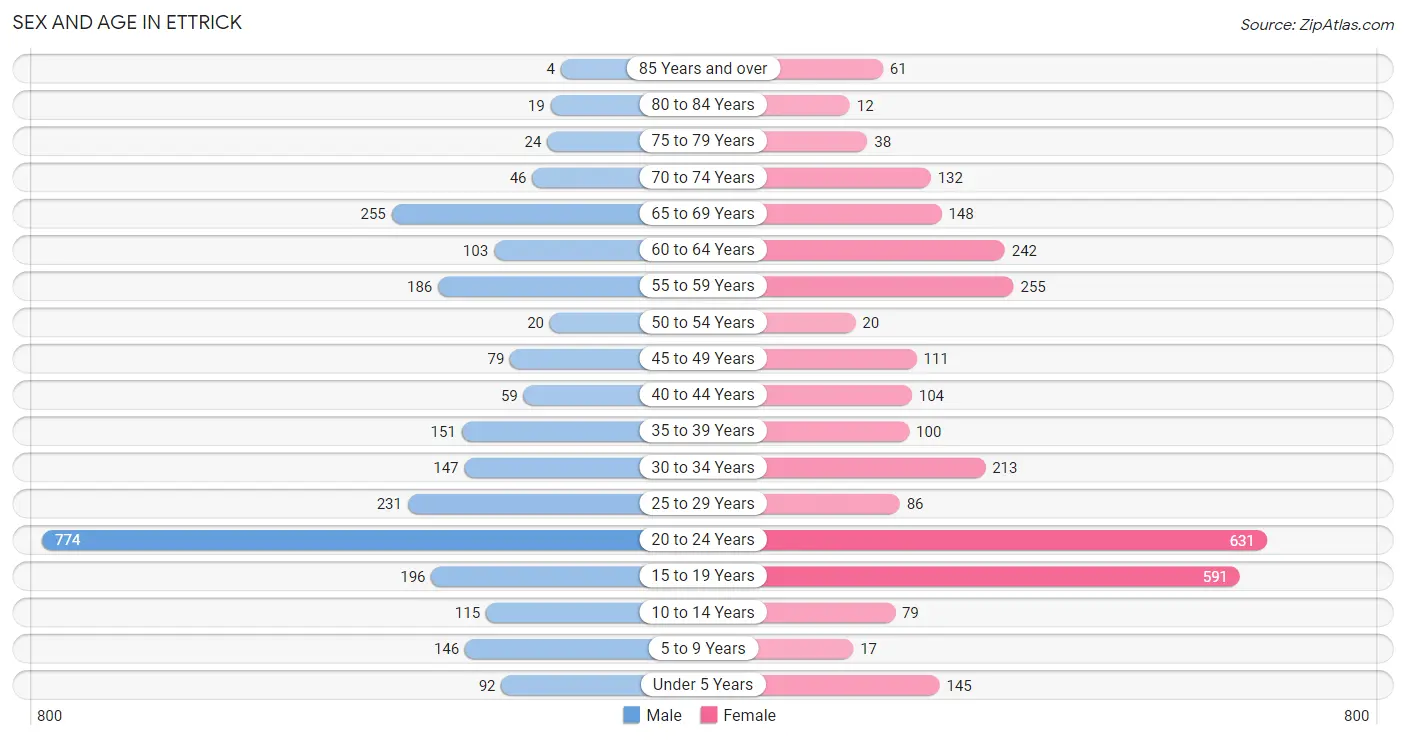
The most populous age groups in Ettrick are 20 to 24 Years (774 | 29.2%) for men and 20 to 24 Years (631 | 21.1%) for women.
| Age Bracket | Male | Female |
| Under 5 Years | 92 (3.5%) | 145 (4.9%) |
| 5 to 9 Years | 146 (5.5%) | 17 (0.6%) |
| 10 to 14 Years | 115 (4.3%) | 79 (2.6%) |
| 15 to 19 Years | 196 (7.4%) | 591 (19.8%) |
| 20 to 24 Years | 774 (29.2%) | 631 (21.1%) |
| 25 to 29 Years | 231 (8.7%) | 86 (2.9%) |
| 30 to 34 Years | 147 (5.6%) | 213 (7.1%) |
| 35 to 39 Years | 151 (5.7%) | 100 (3.4%) |
| 40 to 44 Years | 59 (2.2%) | 104 (3.5%) |
| 45 to 49 Years | 79 (3.0%) | 111 (3.7%) |
| 50 to 54 Years | 20 (0.8%) | 20 (0.7%) |
| 55 to 59 Years | 186 (7.0%) | 255 (8.5%) |
| 60 to 64 Years | 103 (3.9%) | 242 (8.1%) |
| 65 to 69 Years | 255 (9.6%) | 148 (5.0%) |
| 70 to 74 Years | 46 (1.7%) | 132 (4.4%) |
| 75 to 79 Years | 24 (0.9%) | 38 (1.3%) |
| 80 to 84 Years | 19 (0.7%) | 12 (0.4%) |
| 85 Years and over | 4 (0.2%) | 61 (2.0%) |
| Total | 2,647 (100.0%) | 2,985 (100.0%) |
Families and Households in Ettrick
Median Family Size in Ettrick
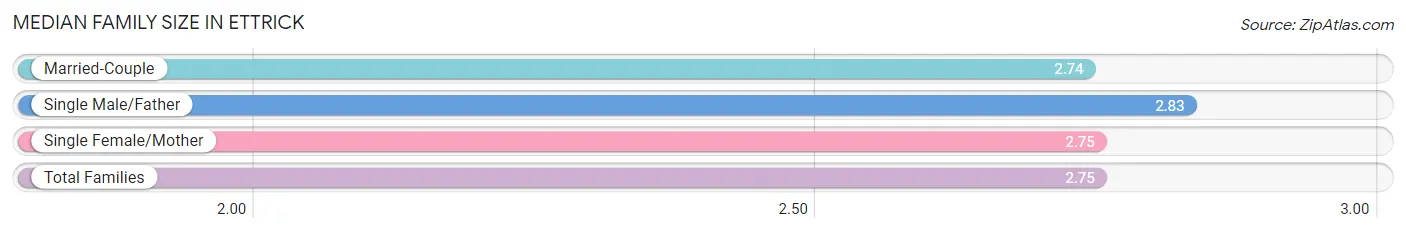
The median family size in Ettrick is 2.75 persons per family, with single male/father families (136 | 12.0%) accounting for the largest median family size of 2.83 persons per family. On the other hand, married-couple families (655 | 57.6%) represent the smallest median family size with 2.74 persons per family.
| Family Type | # Families | Family Size |
| Married-Couple | 655 (57.6%) | 2.74 |
| Single Male/Father | 136 (12.0%) | 2.83 |
| Single Female/Mother | 346 (30.4%) | 2.75 |
| Total Families | 1,137 (100.0%) | 2.75 |
Median Household Size in Ettrick
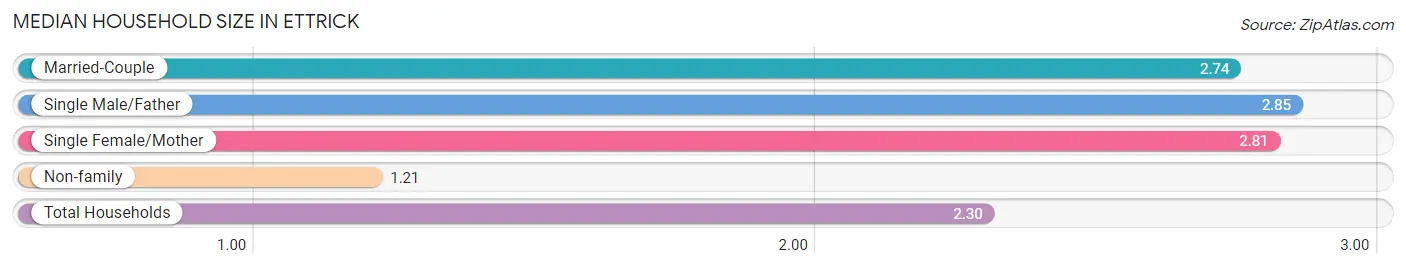
The median household size in Ettrick is 2.30 persons per household, with single male/father households (136 | 8.4%) accounting for the largest median household size of 2.85 persons per household. non-family households (487 | 30.0%) represent the smallest median household size with 1.21 persons per household.
| Household Type | # Households | Household Size |
| Married-Couple | 655 (40.3%) | 2.74 |
| Single Male/Father | 136 (8.4%) | 2.85 |
| Single Female/Mother | 346 (21.3%) | 2.81 |
| Non-family | 487 (30.0%) | 1.21 |
| Total Households | 1,624 (100.0%) | 2.30 |
Household Size by Marriage Status in Ettrick
Out of a total of 1,624 households in Ettrick, 1,137 (70.0%) are family households, while 487 (30.0%) are nonfamily households. The most numerous type of family households are 2-person households, comprising 630, and the most common type of nonfamily households are 1-person households, comprising 398.
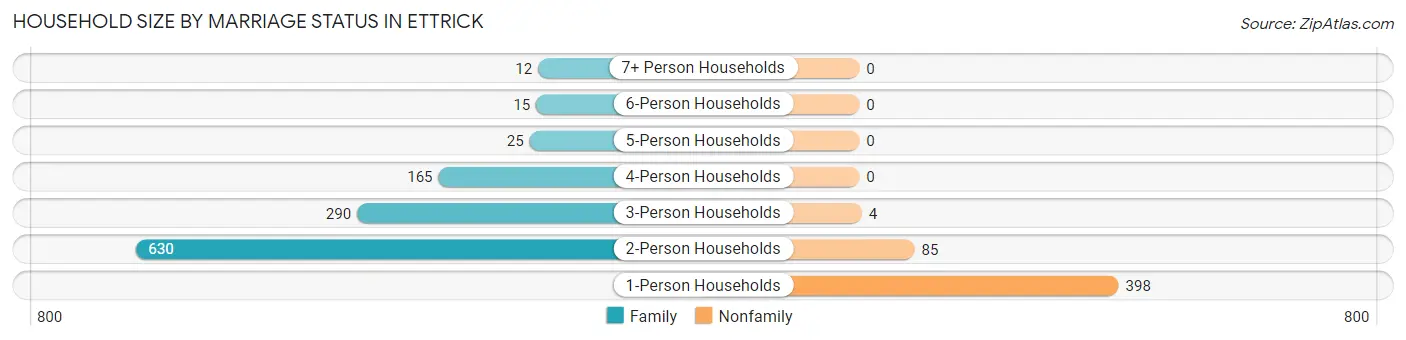
| Household Size | Family Households | Nonfamily Households |
| 1-Person Households | - | 398 (24.5%) |
| 2-Person Households | 630 (38.8%) | 85 (5.2%) |
| 3-Person Households | 290 (17.9%) | 4 (0.3%) |
| 4-Person Households | 165 (10.2%) | 0 (0.0%) |
| 5-Person Households | 25 (1.5%) | 0 (0.0%) |
| 6-Person Households | 15 (0.9%) | 0 (0.0%) |
| 7+ Person Households | 12 (0.7%) | 0 (0.0%) |
| Total | 1,137 (70.0%) | 487 (30.0%) |
Female Fertility in Ettrick
Fertility by Age in Ettrick
Average fertility rate in Ettrick is 10.0 births per 1,000 women. Women in the age bracket of 20 to 34 years have the highest fertility rate with 19.0 births per 1,000 women. Women in the age bracket of 20 to 34 years acount for 100.0% of all women with births.
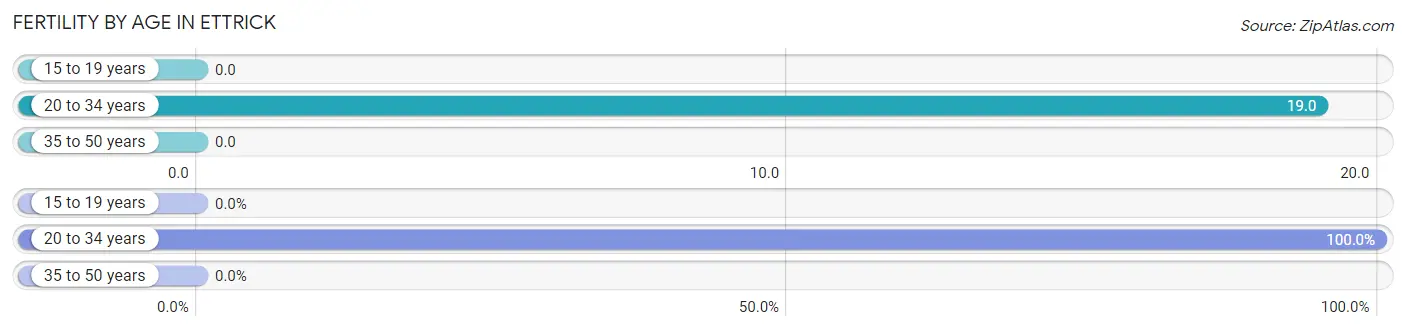
| Age Bracket | Women with Births | Births / 1,000 Women |
| 15 to 19 years | 0 (0.0%) | 0.0 |
| 20 to 34 years | 18 (100.0%) | 19.0 |
| 35 to 50 years | 0 (0.0%) | 0.0 |
| Total | 18 (100.0%) | 10.0 |
Fertility by Age by Marriage Status in Ettrick
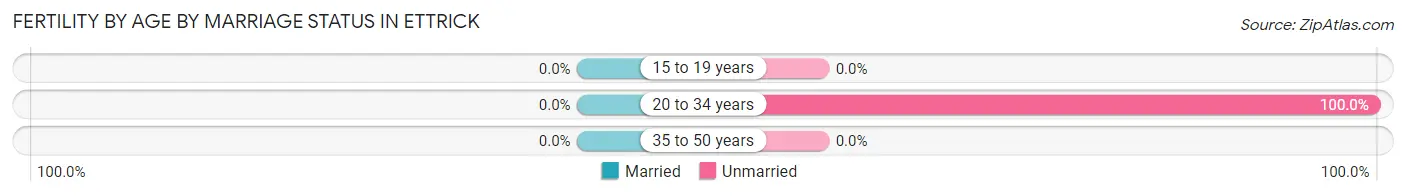
| Age Bracket | Married | Unmarried |
| 15 to 19 years | 0 (0.0%) | 0 (0.0%) |
| 20 to 34 years | 0 (0.0%) | 18 (100.0%) |
| 35 to 50 years | 0 (0.0%) | 0 (0.0%) |
| Total | 0 (0.0%) | 18 (100.0%) |
Fertility by Education in Ettrick
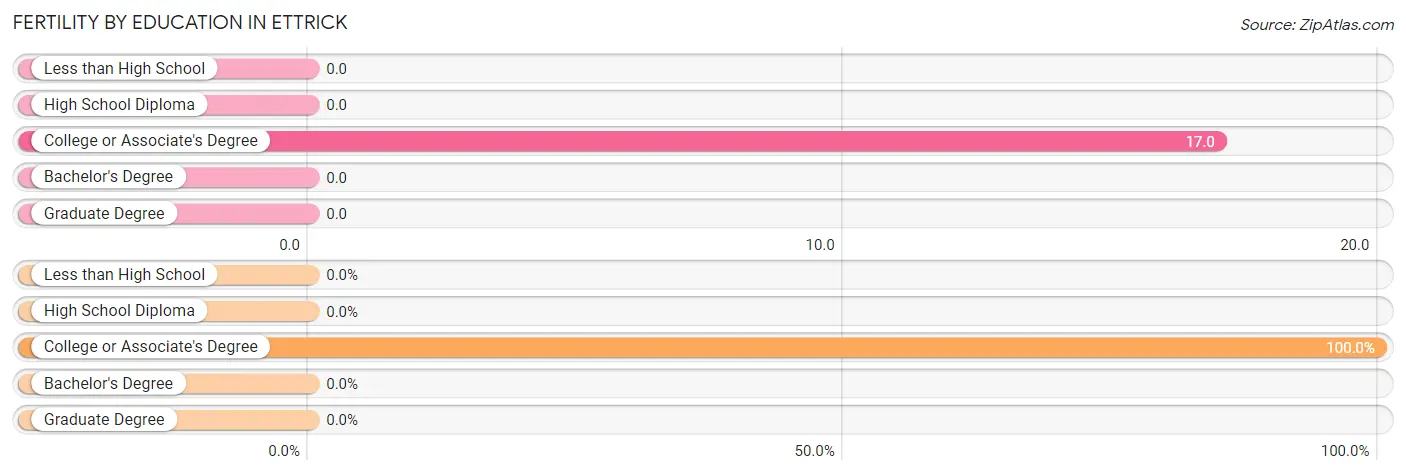
| Educational Attainment | Women with Births | Births / 1,000 Women |
| Less than High School | 0 (0.0%) | 0.0 |
| High School Diploma | 0 (0.0%) | 0.0 |
| College or Associate's Degree | 18 (100.0%) | 17.0 |
| Bachelor's Degree | 0 (0.0%) | 0.0 |
| Graduate Degree | 0 (0.0%) | 0.0 |
| Total | 18 (100.0%) | 10.0 |
Fertility by Education by Marriage Status in Ettrick
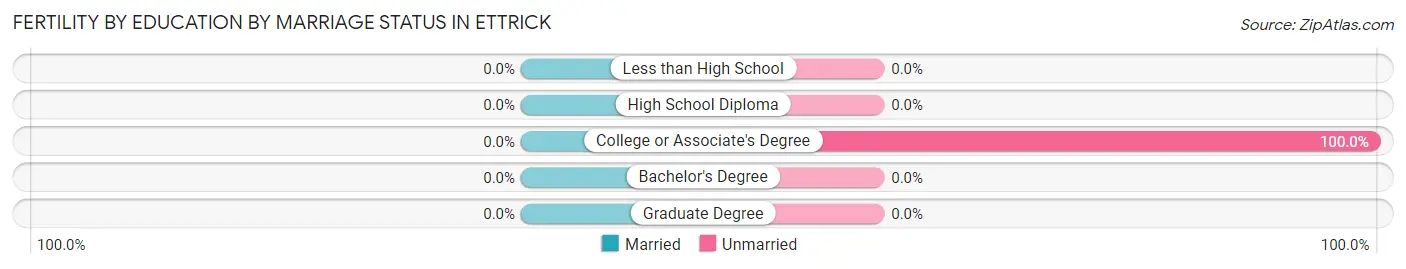
| Educational Attainment | Married | Unmarried |
| Less than High School | 0 (0.0%) | 0 (0.0%) |
| High School Diploma | 0 (0.0%) | 0 (0.0%) |
| College or Associate's Degree | 0 (0.0%) | 18 (100.0%) |
| Bachelor's Degree | 0 (0.0%) | 0 (0.0%) |
| Graduate Degree | 0 (0.0%) | 0 (0.0%) |
| Total | 0 (0.0%) | 18 (100.0%) |
Employment Characteristics in Ettrick
Employment by Class of Employer in Ettrick
Among the 2,427 employed individuals in Ettrick, private company employees (1,597 | 65.8%), state government employees (285 | 11.7%), and local government employees (168 | 6.9%) make up the most common classes of employment.
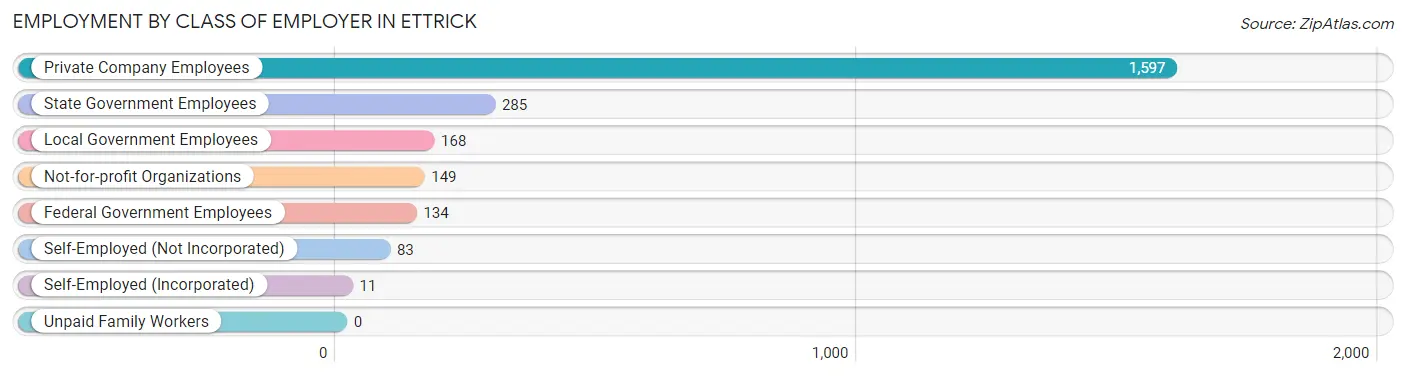
| Employer Class | # Employees | % Employees |
| Private Company Employees | 1,597 | 65.8% |
| Self-Employed (Incorporated) | 11 | 0.4% |
| Self-Employed (Not Incorporated) | 83 | 3.4% |
| Not-for-profit Organizations | 149 | 6.1% |
| Local Government Employees | 168 | 6.9% |
| State Government Employees | 285 | 11.7% |
| Federal Government Employees | 134 | 5.5% |
| Unpaid Family Workers | 0 | 0.0% |
| Total | 2,427 | 100.0% |
Employment Status by Age in Ettrick
According to the labor force statistics for Ettrick, out of the total population over 16 years of age (5,021), 58.7% or 2,947 individuals are in the labor force, with 15.1% or 445 of them unemployed. The age group with the highest labor force participation rate is 30 to 34 years, with 98.9% or 356 individuals in the labor force. Within the labor force, the 16 to 19 years age range has the highest percentage of unemployed individuals, with 30.7% or 96 of them being unemployed.
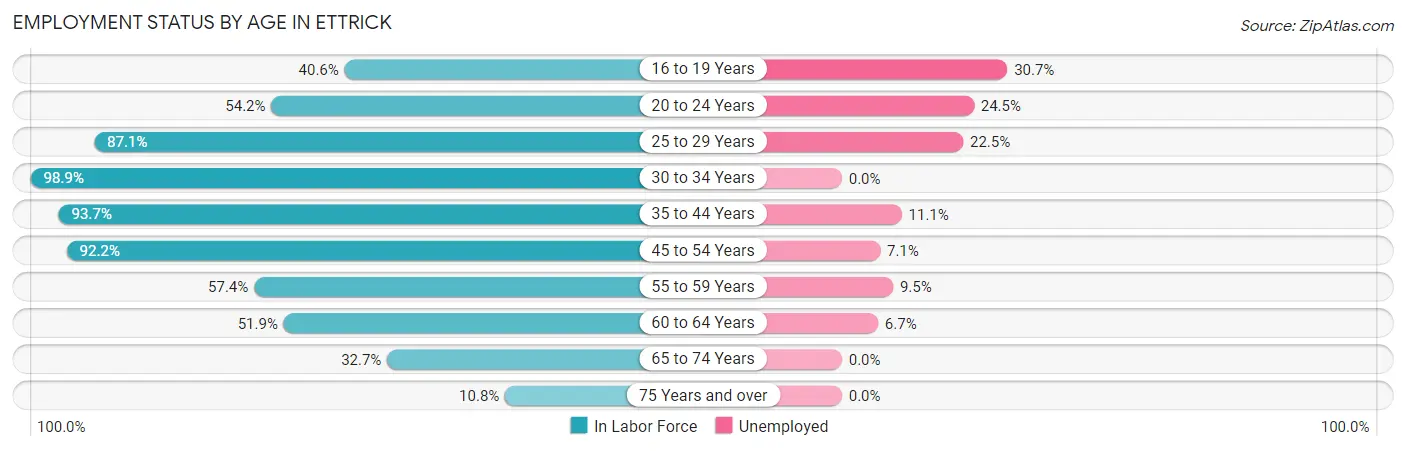
| Age Bracket | In Labor Force | Unemployed |
| 16 to 19 Years | 313 (40.6%) | 96 (30.7%) |
| 20 to 24 Years | 762 (54.2%) | 187 (24.5%) |
| 25 to 29 Years | 276 (87.1%) | 62 (22.5%) |
| 30 to 34 Years | 356 (98.9%) | 0 (0.0%) |
| 35 to 44 Years | 388 (93.7%) | 43 (11.1%) |
| 45 to 54 Years | 212 (92.2%) | 15 (7.1%) |
| 55 to 59 Years | 253 (57.4%) | 24 (9.5%) |
| 60 to 64 Years | 179 (51.9%) | 12 (6.7%) |
| 65 to 74 Years | 190 (32.7%) | 0 (0.0%) |
| 75 Years and over | 17 (10.8%) | 0 (0.0%) |
| Total | 2,947 (58.7%) | 445 (15.1%) |
Employment Status by Educational Attainment in Ettrick
According to labor force statistics for Ettrick, 79.0% of individuals (1,665) out of the total population between 25 and 64 years of age (2,107) are in the labor force, with 9.6% or 160 of them being unemployed. The group with the highest labor force participation rate are those with the educational attainment of college / associate degree, with 88.4% or 727 individuals in the labor force. Within the labor force, individuals with high school diploma education have the highest percentage of unemployment, with 28.8% or 111 of them being unemployed.
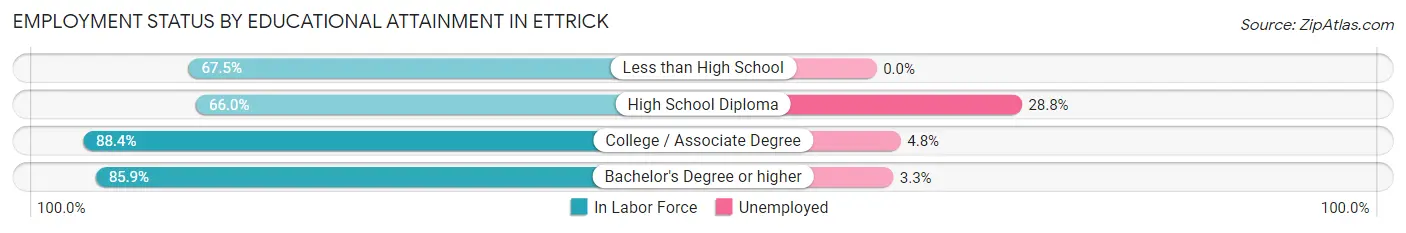
| Educational Attainment | In Labor Force | Unemployed |
| Less than High School | 187 (67.5%) | 0 (0.0%) |
| High School Diploma | 385 (66.0%) | 168 (28.8%) |
| College / Associate Degree | 727 (88.4%) | 39 (4.8%) |
| Bachelor's Degree or higher | 365 (85.9%) | 14 (3.3%) |
| Total | 1,665 (79.0%) | 202 (9.6%) |
Employment Occupations by Sex in Ettrick
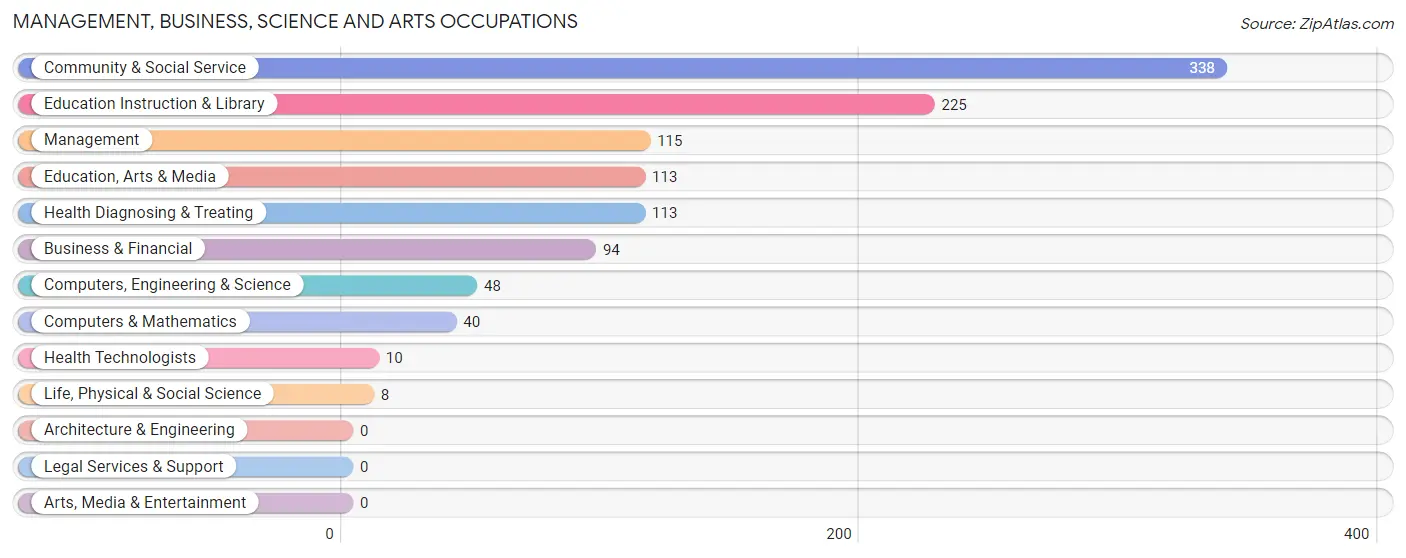
Management, Business, Science and Arts Occupations
The most common Management, Business, Science and Arts occupations in Ettrick are Community & Social Service (338 | 13.7%), Education Instruction & Library (225 | 9.1%), Management (115 | 4.7%), Education, Arts & Media (113 | 4.6%), and Health Diagnosing & Treating (113 | 4.6%).
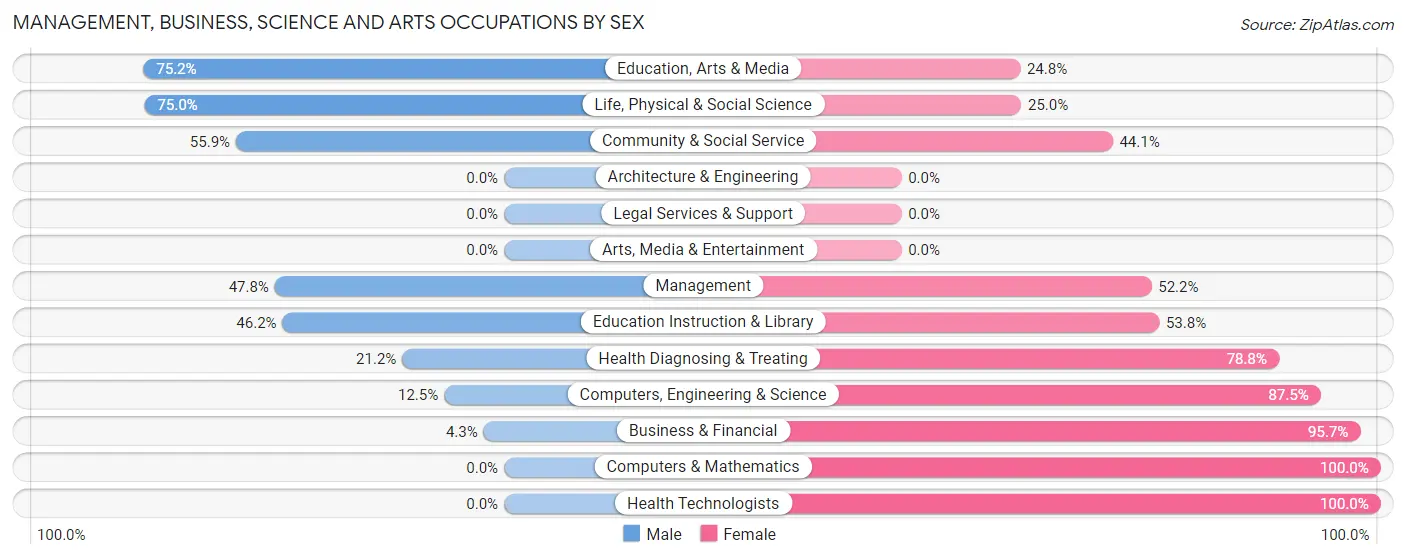
Management, Business, Science and Arts Occupations by Sex
Within the Management, Business, Science and Arts occupations in Ettrick, the most male-oriented occupations are Education, Arts & Media (75.2%), Life, Physical & Social Science (75.0%), and Community & Social Service (55.9%), while the most female-oriented occupations are Computers & Mathematics (100.0%), Health Technologists (100.0%), and Business & Financial (95.7%).
| Occupation | Male | Female |
| Management | 55 (47.8%) | 60 (52.2%) |
| Business & Financial | 4 (4.3%) | 90 (95.7%) |
| Computers, Engineering & Science | 6 (12.5%) | 42 (87.5%) |
| Computers & Mathematics | 0 (0.0%) | 40 (100.0%) |
| Architecture & Engineering | 0 (0.0%) | 0 (0.0%) |
| Life, Physical & Social Science | 6 (75.0%) | 2 (25.0%) |
| Community & Social Service | 189 (55.9%) | 149 (44.1%) |
| Education, Arts & Media | 85 (75.2%) | 28 (24.8%) |
| Legal Services & Support | 0 (0.0%) | 0 (0.0%) |
| Education Instruction & Library | 104 (46.2%) | 121 (53.8%) |
| Arts, Media & Entertainment | 0 (0.0%) | 0 (0.0%) |
| Health Diagnosing & Treating | 24 (21.2%) | 89 (78.8%) |
| Health Technologists | 0 (0.0%) | 10 (100.0%) |
| Total (Category) | 278 (39.3%) | 430 (60.7%) |
| Total (Overall) | 1,083 (43.9%) | 1,385 (56.1%) |
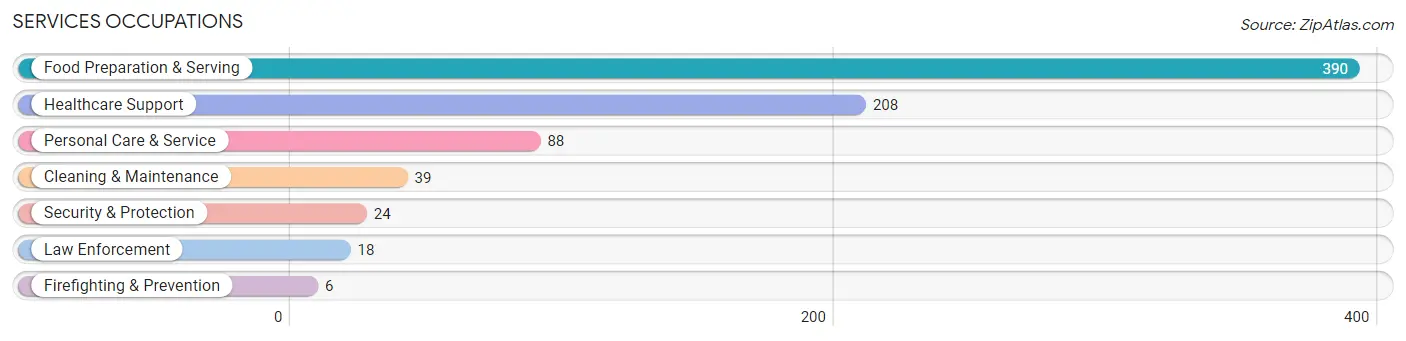
Services Occupations
The most common Services occupations in Ettrick are Food Preparation & Serving (390 | 15.8%), Healthcare Support (208 | 8.4%), Personal Care & Service (88 | 3.6%), Cleaning & Maintenance (39 | 1.6%), and Security & Protection (24 | 1.0%).
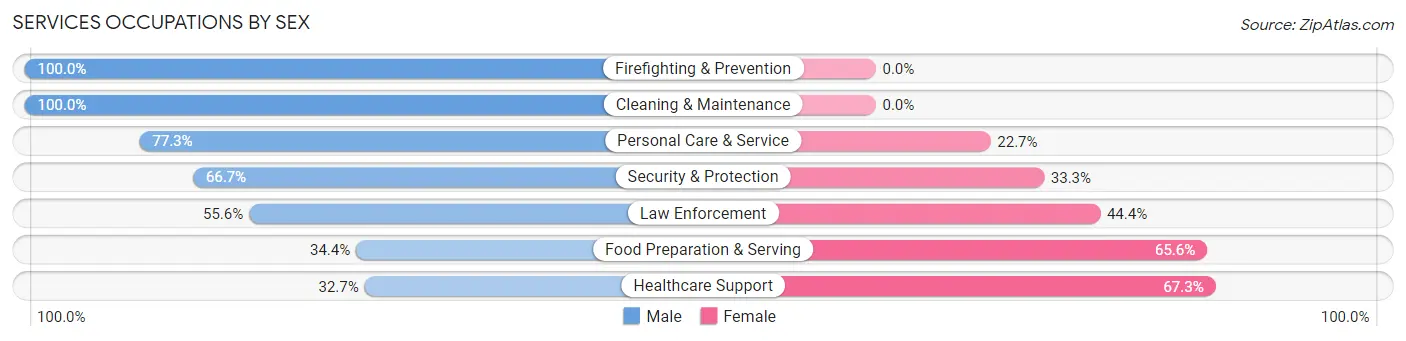
Services Occupations by Sex
Within the Services occupations in Ettrick, the most male-oriented occupations are Firefighting & Prevention (100.0%), Cleaning & Maintenance (100.0%), and Personal Care & Service (77.3%), while the most female-oriented occupations are Healthcare Support (67.3%), Food Preparation & Serving (65.6%), and Law Enforcement (44.4%).
| Occupation | Male | Female |
| Healthcare Support | 68 (32.7%) | 140 (67.3%) |
| Security & Protection | 16 (66.7%) | 8 (33.3%) |
| Firefighting & Prevention | 6 (100.0%) | 0 (0.0%) |
| Law Enforcement | 10 (55.6%) | 8 (44.4%) |
| Food Preparation & Serving | 134 (34.4%) | 256 (65.6%) |
| Cleaning & Maintenance | 39 (100.0%) | 0 (0.0%) |
| Personal Care & Service | 68 (77.3%) | 20 (22.7%) |
| Total (Category) | 325 (43.4%) | 424 (56.6%) |
| Total (Overall) | 1,083 (43.9%) | 1,385 (56.1%) |
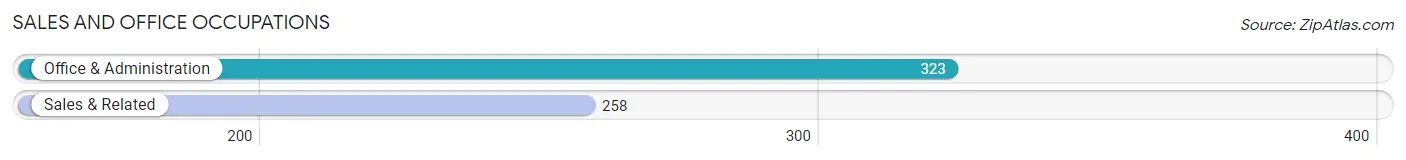
Sales and Office Occupations
The most common Sales and Office occupations in Ettrick are Office & Administration (323 | 13.1%), and Sales & Related (258 | 10.4%).
Sales and Office Occupations by Sex
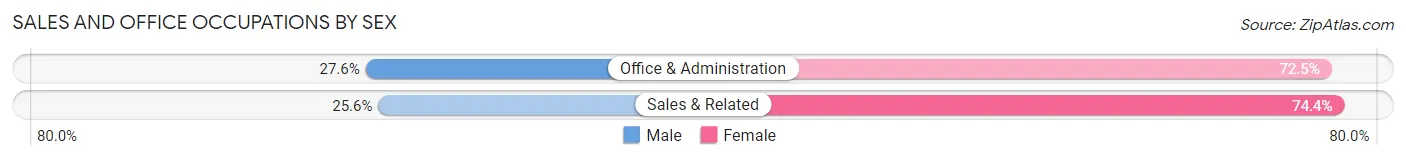
| Occupation | Male | Female |
| Sales & Related | 66 (25.6%) | 192 (74.4%) |
| Office & Administration | 89 (27.6%) | 234 (72.5%) |
| Total (Category) | 155 (26.7%) | 426 (73.3%) |
| Total (Overall) | 1,083 (43.9%) | 1,385 (56.1%) |
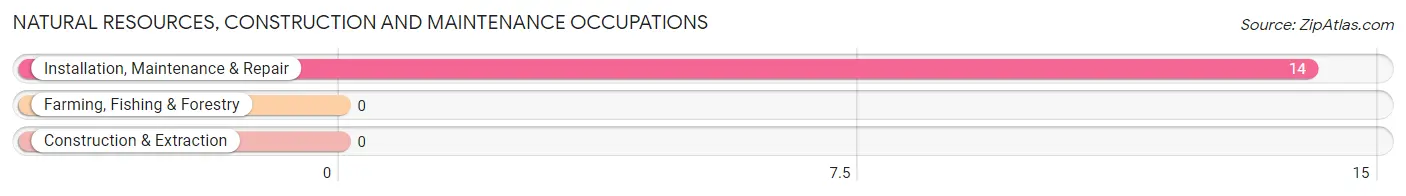
Natural Resources, Construction and Maintenance Occupations
The most common Natural Resources, Construction and Maintenance occupations in Ettrick are , and Installation, Maintenance & Repair (14 | 0.6%).
Natural Resources, Construction and Maintenance Occupations by Sex
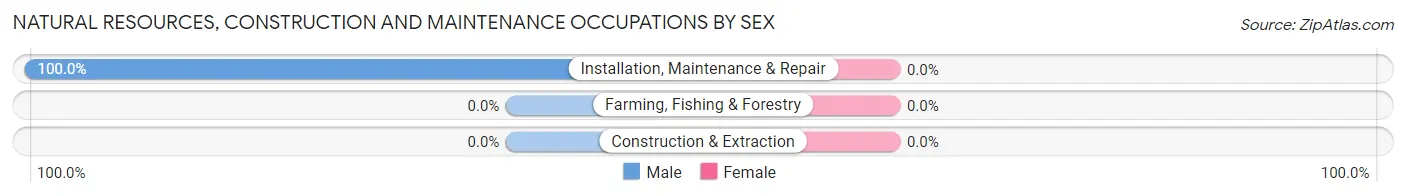
| Occupation | Male | Female |
| Farming, Fishing & Forestry | 0 (0.0%) | 0 (0.0%) |
| Construction & Extraction | 0 (0.0%) | 0 (0.0%) |
| Installation, Maintenance & Repair | 14 (100.0%) | 0 (0.0%) |
| Total (Category) | 14 (100.0%) | 0 (0.0%) |
| Total (Overall) | 1,083 (43.9%) | 1,385 (56.1%) |
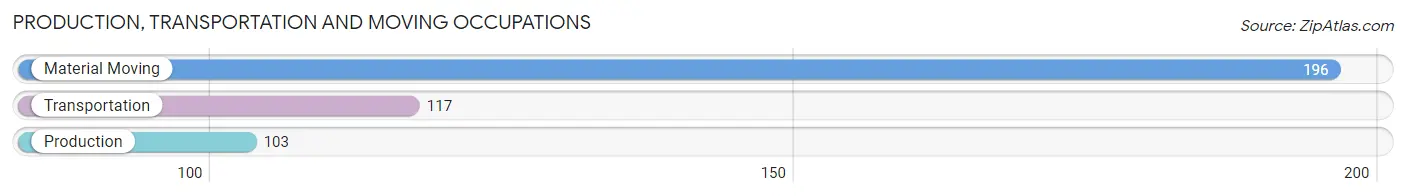
Production, Transportation and Moving Occupations
The most common Production, Transportation and Moving occupations in Ettrick are Material Moving (196 | 7.9%), Transportation (117 | 4.7%), and Production (103 | 4.2%).
Production, Transportation and Moving Occupations by Sex
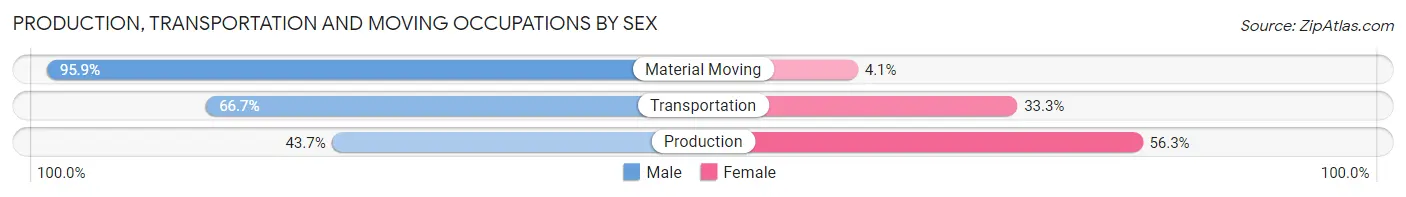
| Occupation | Male | Female |
| Production | 45 (43.7%) | 58 (56.3%) |
| Transportation | 78 (66.7%) | 39 (33.3%) |
| Material Moving | 188 (95.9%) | 8 (4.1%) |
| Total (Category) | 311 (74.8%) | 105 (25.2%) |
| Total (Overall) | 1,083 (43.9%) | 1,385 (56.1%) |
Employment Industries by Sex in Ettrick
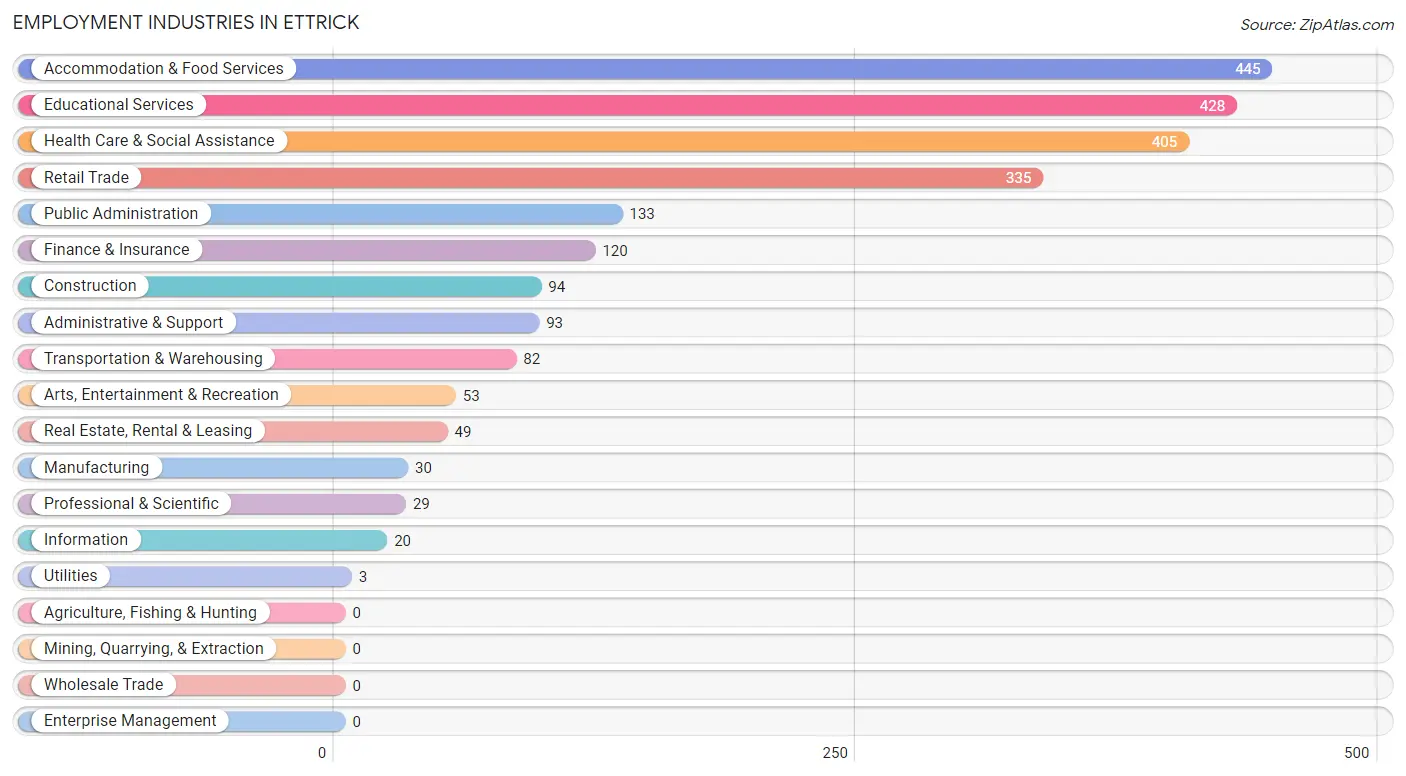
Employment Industries in Ettrick
The major employment industries in Ettrick include Accommodation & Food Services (445 | 18.0%), Educational Services (428 | 17.3%), Health Care & Social Assistance (405 | 16.4%), Retail Trade (335 | 13.6%), and Public Administration (133 | 5.4%).
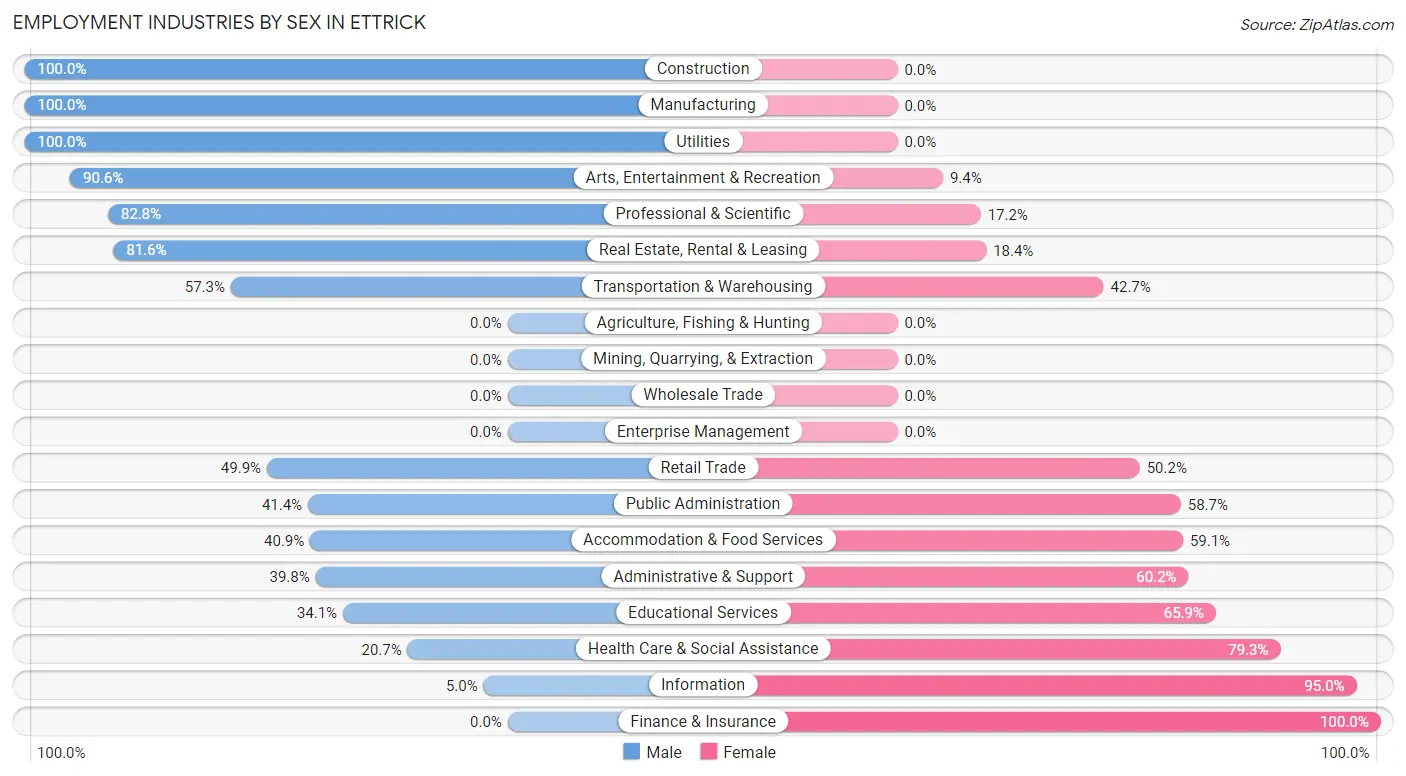
Employment Industries by Sex in Ettrick
The Ettrick industries that see more men than women are Construction (100.0%), Manufacturing (100.0%), and Utilities (100.0%), whereas the industries that tend to have a higher number of women are Finance & Insurance (100.0%), Information (95.0%), and Health Care & Social Assistance (79.3%).
| Industry | Male | Female |
| Agriculture, Fishing & Hunting | 0 (0.0%) | 0 (0.0%) |
| Mining, Quarrying, & Extraction | 0 (0.0%) | 0 (0.0%) |
| Construction | 94 (100.0%) | 0 (0.0%) |
| Manufacturing | 30 (100.0%) | 0 (0.0%) |
| Wholesale Trade | 0 (0.0%) | 0 (0.0%) |
| Retail Trade | 167 (49.8%) | 168 (50.1%) |
| Transportation & Warehousing | 47 (57.3%) | 35 (42.7%) |
| Utilities | 3 (100.0%) | 0 (0.0%) |
| Information | 1 (5.0%) | 19 (95.0%) |
| Finance & Insurance | 0 (0.0%) | 120 (100.0%) |
| Real Estate, Rental & Leasing | 40 (81.6%) | 9 (18.4%) |
| Professional & Scientific | 24 (82.8%) | 5 (17.2%) |
| Enterprise Management | 0 (0.0%) | 0 (0.0%) |
| Administrative & Support | 37 (39.8%) | 56 (60.2%) |
| Educational Services | 146 (34.1%) | 282 (65.9%) |
| Health Care & Social Assistance | 84 (20.7%) | 321 (79.3%) |
| Arts, Entertainment & Recreation | 48 (90.6%) | 5 (9.4%) |
| Accommodation & Food Services | 182 (40.9%) | 263 (59.1%) |
| Public Administration | 55 (41.3%) | 78 (58.7%) |
| Total | 1,083 (43.9%) | 1,385 (56.1%) |
Education in Ettrick
School Enrollment in Ettrick
The most common levels of schooling among the 2,725 students in Ettrick are college / undergraduate (1,985 | 72.8%), graduate / professional (250 | 9.2%), and middle school (179 | 6.6%).
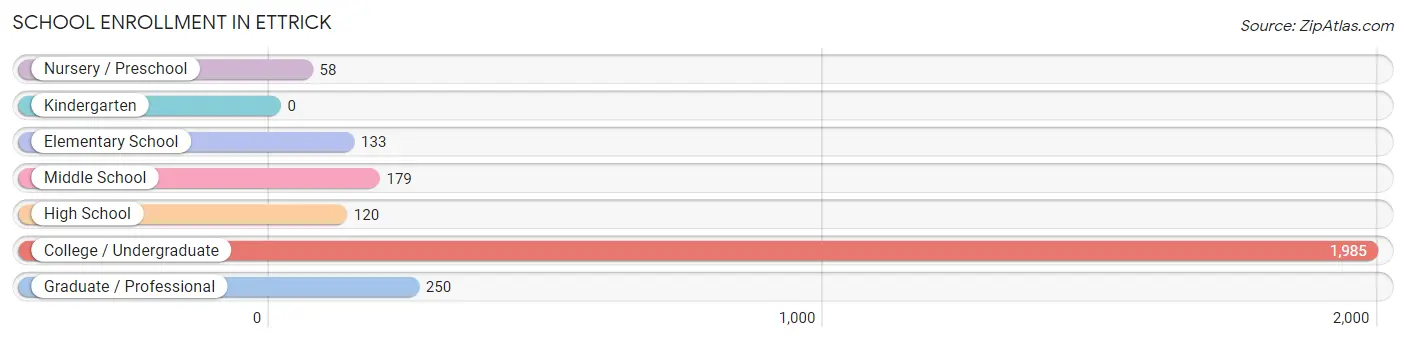
| School Level | # Students | % Students |
| Nursery / Preschool | 58 | 2.1% |
| Kindergarten | 0 | 0.0% |
| Elementary School | 133 | 4.9% |
| Middle School | 179 | 6.6% |
| High School | 120 | 4.4% |
| College / Undergraduate | 1,985 | 72.8% |
| Graduate / Professional | 250 | 9.2% |
| Total | 2,725 | 100.0% |
School Enrollment by Age by Funding Source in Ettrick
Out of a total of 2,725 students who are enrolled in schools in Ettrick, 349 (12.8%) attend a private institution, while the remaining 2,376 (87.2%) are enrolled in public schools. The age group of 20 to 24 year olds has the highest likelihood of being enrolled in private schools, with 303 (23.5% in the age bracket) enrolled. Conversely, the age group of 3 to 4 year olds has the lowest likelihood of being enrolled in a private school, with 58 (100.0% in the age bracket) attending a public institution.
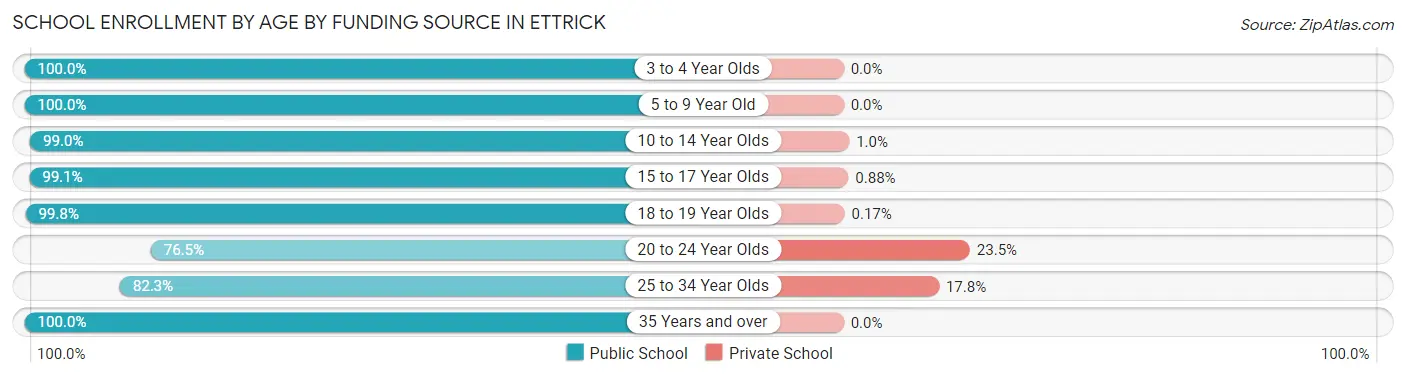
| Age Bracket | Public School | Private School |
| 3 to 4 Year Olds | 58 (100.0%) | 0 (0.0%) |
| 5 to 9 Year Old | 133 (100.0%) | 0 (0.0%) |
| 10 to 14 Year Olds | 192 (99.0%) | 2 (1.0%) |
| 15 to 17 Year Olds | 113 (99.1%) | 1 (0.9%) |
| 18 to 19 Year Olds | 571 (99.8%) | 1 (0.2%) |
| 20 to 24 Year Olds | 986 (76.5%) | 303 (23.5%) |
| 25 to 34 Year Olds | 190 (82.3%) | 41 (17.7%) |
| 35 Years and over | 134 (100.0%) | 0 (0.0%) |
| Total | 2,376 (87.2%) | 349 (12.8%) |
Educational Attainment by Field of Study in Ettrick
Business (159 | 20.3%), education (146 | 18.6%), liberal arts & history (131 | 16.7%), arts & humanities (73 | 9.3%), and science & technology (70 | 8.9%) are the most common fields of study among 784 individuals in Ettrick who have obtained a bachelor's degree or higher.
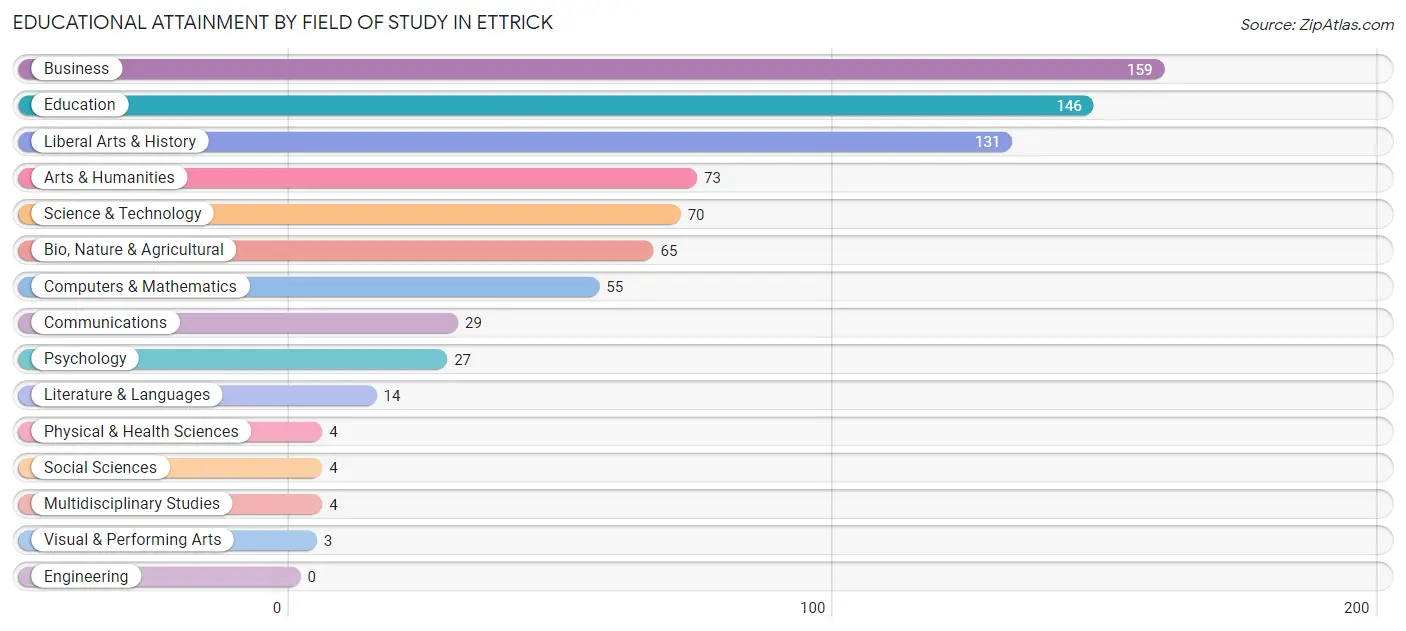
| Field of Study | # Graduates | % Graduates |
| Computers & Mathematics | 55 | 7.0% |
| Bio, Nature & Agricultural | 65 | 8.3% |
| Physical & Health Sciences | 4 | 0.5% |
| Psychology | 27 | 3.4% |
| Social Sciences | 4 | 0.5% |
| Engineering | 0 | 0.0% |
| Multidisciplinary Studies | 4 | 0.5% |
| Science & Technology | 70 | 8.9% |
| Business | 159 | 20.3% |
| Education | 146 | 18.6% |
| Literature & Languages | 14 | 1.8% |
| Liberal Arts & History | 131 | 16.7% |
| Visual & Performing Arts | 3 | 0.4% |
| Communications | 29 | 3.7% |
| Arts & Humanities | 73 | 9.3% |
| Total | 784 | 100.0% |
Transportation & Commute in Ettrick
Vehicle Availability by Sex in Ettrick
The most prevalent vehicle ownership categories in Ettrick are males with 2 vehicles (363, accounting for 44.9%) and females with 2 vehicles (458, making up 34.9%).
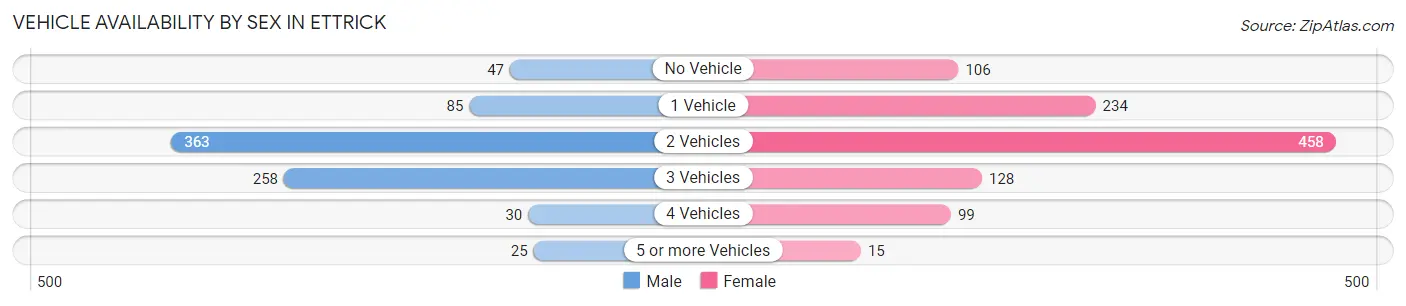
| Vehicles Available | Male | Female |
| No Vehicle | 47 (5.8%) | 106 (10.2%) |
| 1 Vehicle | 85 (10.5%) | 234 (22.5%) |
| 2 Vehicles | 363 (44.9%) | 458 (44.0%) |
| 3 Vehicles | 258 (31.9%) | 128 (12.3%) |
| 4 Vehicles | 30 (3.7%) | 99 (9.5%) |
| 5 or more Vehicles | 25 (3.1%) | 15 (1.4%) |
| Total | 808 (100.0%) | 1,040 (100.0%) |
Commute Time in Ettrick
The most frequently occuring commute durations in Ettrick are 20 to 24 minutes (458 commuters, 20.0%), 15 to 19 minutes (408 commuters, 17.8%), and 5 to 9 minutes (351 commuters, 15.3%).
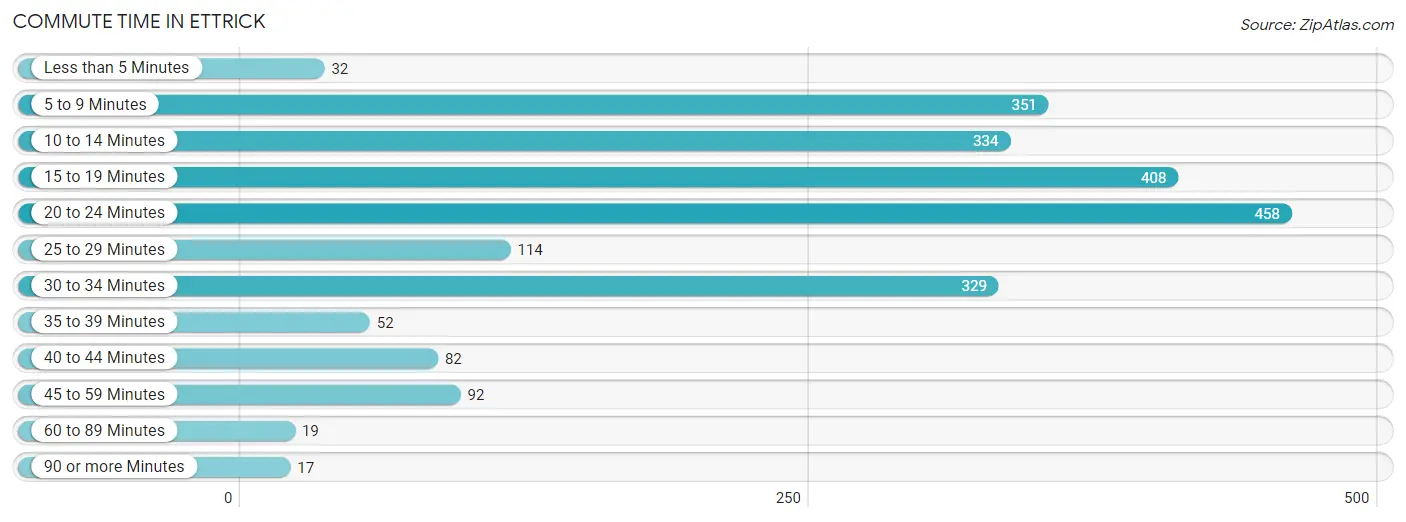
| Commute Time | # Commuters | % Commuters |
| Less than 5 Minutes | 32 | 1.4% |
| 5 to 9 Minutes | 351 | 15.3% |
| 10 to 14 Minutes | 334 | 14.6% |
| 15 to 19 Minutes | 408 | 17.8% |
| 20 to 24 Minutes | 458 | 20.0% |
| 25 to 29 Minutes | 114 | 5.0% |
| 30 to 34 Minutes | 329 | 14.4% |
| 35 to 39 Minutes | 52 | 2.3% |
| 40 to 44 Minutes | 82 | 3.6% |
| 45 to 59 Minutes | 92 | 4.0% |
| 60 to 89 Minutes | 19 | 0.8% |
| 90 or more Minutes | 17 | 0.7% |
Commute Time by Sex in Ettrick
The most common commute times in Ettrick are 15 to 19 minutes (303 commuters, 29.8%) for males and 20 to 24 minutes (367 commuters, 28.9%) for females.
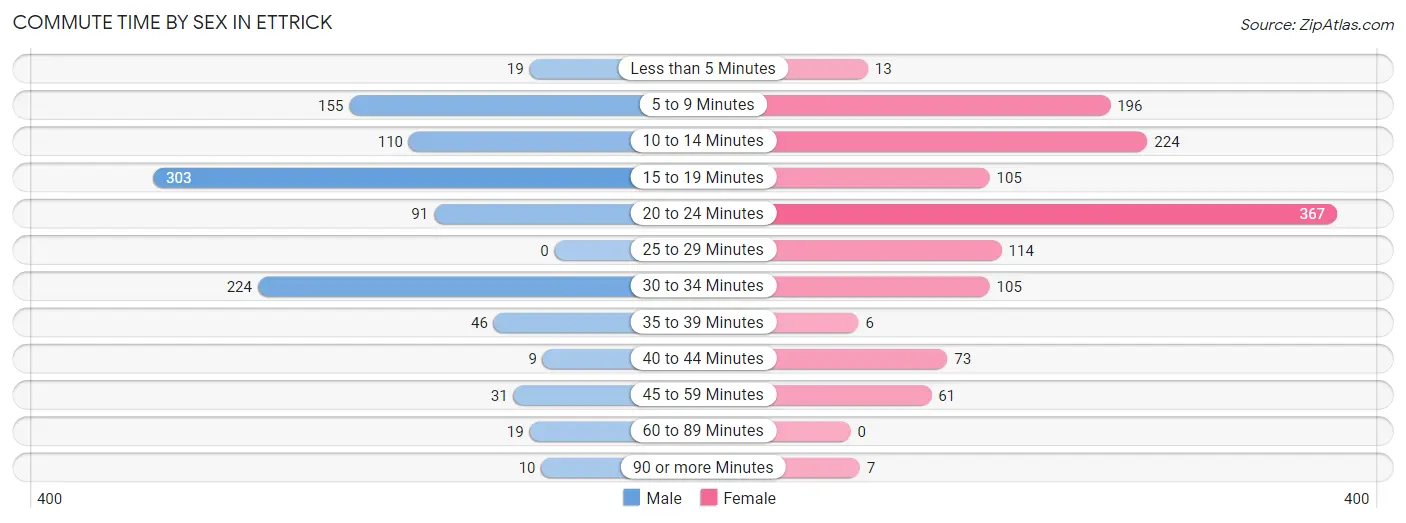
| Commute Time | Male | Female |
| Less than 5 Minutes | 19 (1.9%) | 13 (1.0%) |
| 5 to 9 Minutes | 155 (15.2%) | 196 (15.4%) |
| 10 to 14 Minutes | 110 (10.8%) | 224 (17.6%) |
| 15 to 19 Minutes | 303 (29.8%) | 105 (8.3%) |
| 20 to 24 Minutes | 91 (8.9%) | 367 (28.9%) |
| 25 to 29 Minutes | 0 (0.0%) | 114 (9.0%) |
| 30 to 34 Minutes | 224 (22.0%) | 105 (8.3%) |
| 35 to 39 Minutes | 46 (4.5%) | 6 (0.5%) |
| 40 to 44 Minutes | 9 (0.9%) | 73 (5.7%) |
| 45 to 59 Minutes | 31 (3.0%) | 61 (4.8%) |
| 60 to 89 Minutes | 19 (1.9%) | 0 (0.0%) |
| 90 or more Minutes | 10 (1.0%) | 7 (0.5%) |
Time of Departure to Work by Sex in Ettrick
The most frequent times of departure to work in Ettrick are 8:00 AM to 8:29 AM (188, 18.5%) for males and 7:00 AM to 7:29 AM (185, 14.6%) for females.
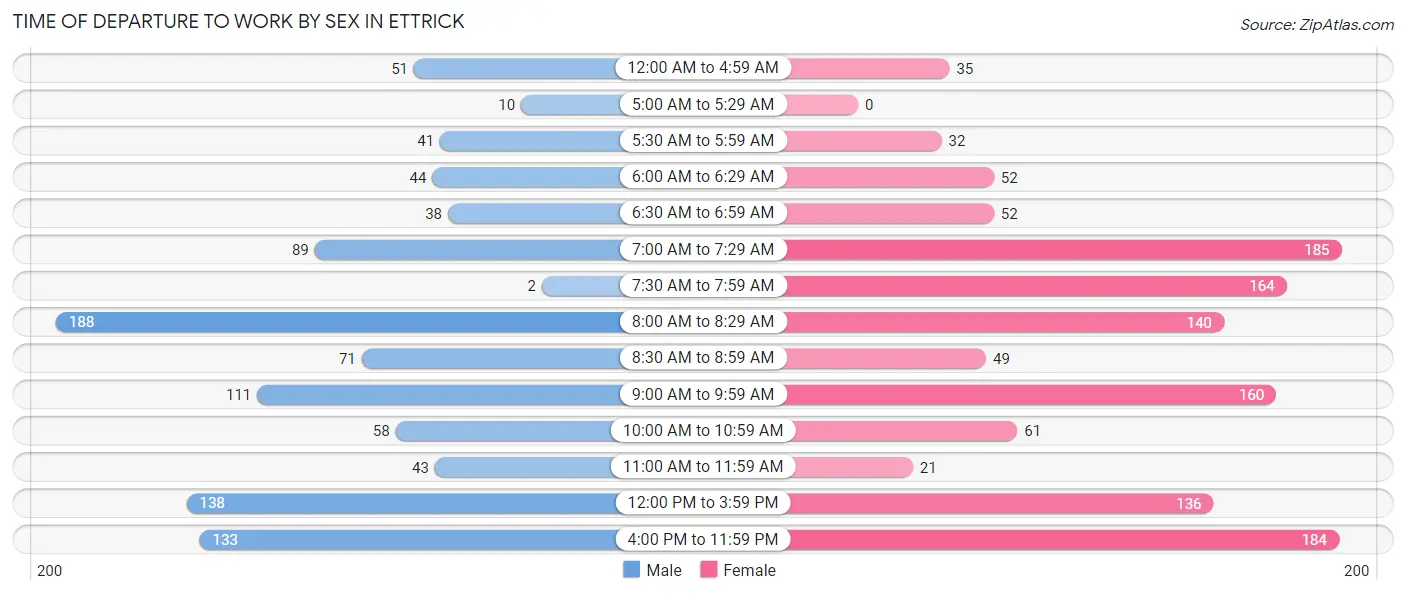
| Time of Departure | Male | Female |
| 12:00 AM to 4:59 AM | 51 (5.0%) | 35 (2.8%) |
| 5:00 AM to 5:29 AM | 10 (1.0%) | 0 (0.0%) |
| 5:30 AM to 5:59 AM | 41 (4.0%) | 32 (2.5%) |
| 6:00 AM to 6:29 AM | 44 (4.3%) | 52 (4.1%) |
| 6:30 AM to 6:59 AM | 38 (3.7%) | 52 (4.1%) |
| 7:00 AM to 7:29 AM | 89 (8.7%) | 185 (14.6%) |
| 7:30 AM to 7:59 AM | 2 (0.2%) | 164 (12.9%) |
| 8:00 AM to 8:29 AM | 188 (18.5%) | 140 (11.0%) |
| 8:30 AM to 8:59 AM | 71 (7.0%) | 49 (3.9%) |
| 9:00 AM to 9:59 AM | 111 (10.9%) | 160 (12.6%) |
| 10:00 AM to 10:59 AM | 58 (5.7%) | 61 (4.8%) |
| 11:00 AM to 11:59 AM | 43 (4.2%) | 21 (1.7%) |
| 12:00 PM to 3:59 PM | 138 (13.6%) | 136 (10.7%) |
| 4:00 PM to 11:59 PM | 133 (13.1%) | 184 (14.5%) |
| Total | 1,017 (100.0%) | 1,271 (100.0%) |
Housing Occupancy in Ettrick
Occupancy by Ownership in Ettrick
Of the total 1,624 dwellings in Ettrick, owner-occupied units account for 1,194 (73.5%), while renter-occupied units make up 430 (26.5%).
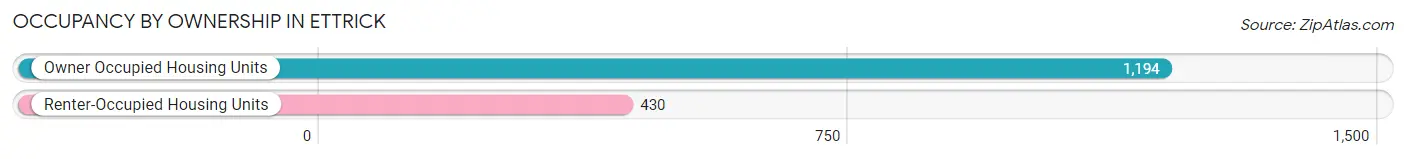
| Occupancy | # Housing Units | % Housing Units |
| Owner Occupied Housing Units | 1,194 | 73.5% |
| Renter-Occupied Housing Units | 430 | 26.5% |
| Total Occupied Housing Units | 1,624 | 100.0% |
Occupancy by Household Size in Ettrick
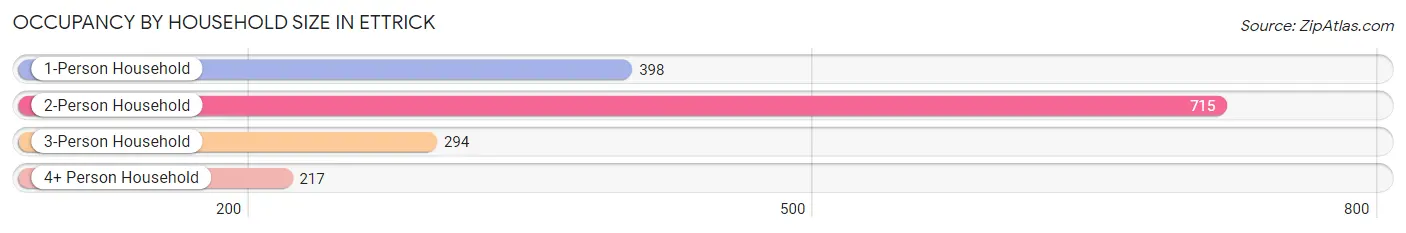
| Household Size | # Housing Units | % Housing Units |
| 1-Person Household | 398 | 24.5% |
| 2-Person Household | 715 | 44.0% |
| 3-Person Household | 294 | 18.1% |
| 4+ Person Household | 217 | 13.4% |
| Total Housing Units | 1,624 | 100.0% |
Occupancy by Ownership by Household Size in Ettrick
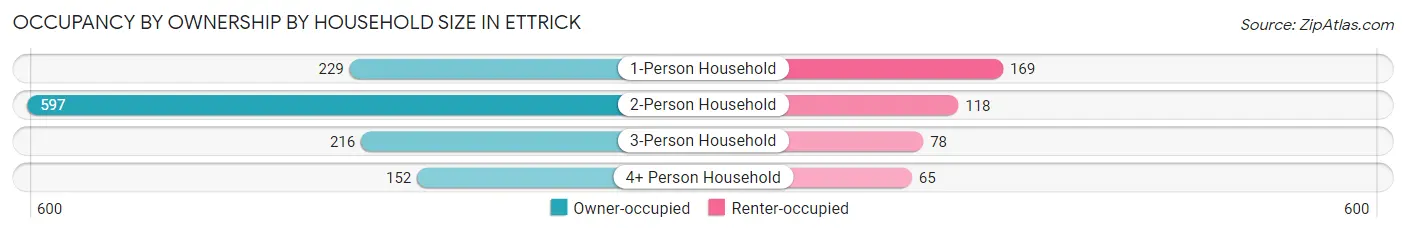
| Household Size | Owner-occupied | Renter-occupied |
| 1-Person Household | 229 (57.5%) | 169 (42.5%) |
| 2-Person Household | 597 (83.5%) | 118 (16.5%) |
| 3-Person Household | 216 (73.5%) | 78 (26.5%) |
| 4+ Person Household | 152 (70.1%) | 65 (29.9%) |
| Total Housing Units | 1,194 (73.5%) | 430 (26.5%) |
Occupancy by Educational Attainment in Ettrick
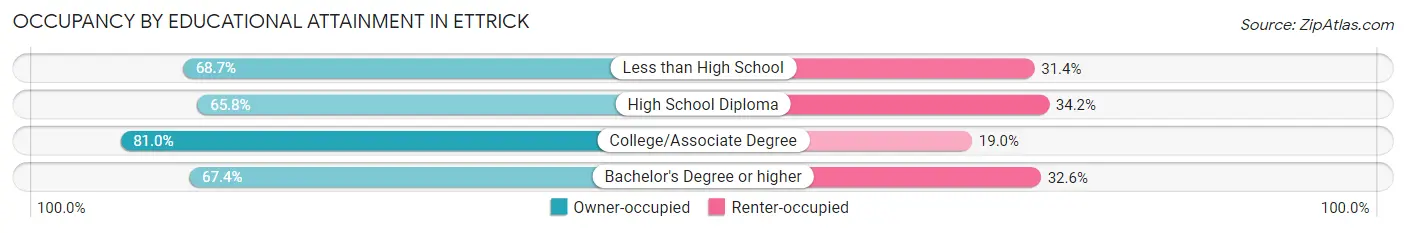
| Household Size | Owner-occupied | Renter-occupied |
| Less than High School | 173 (68.6%) | 79 (31.4%) |
| High School Diploma | 169 (65.8%) | 88 (34.2%) |
| College/Associate Degree | 598 (81.0%) | 140 (19.0%) |
| Bachelor's Degree or higher | 254 (67.4%) | 123 (32.6%) |
Occupancy by Age of Householder in Ettrick
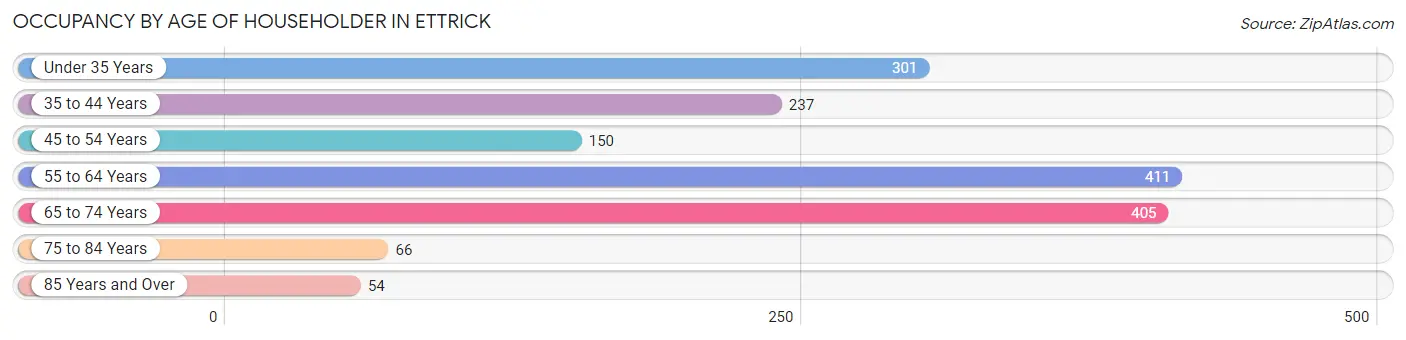
| Age Bracket | # Households | % Households |
| Under 35 Years | 301 | 18.5% |
| 35 to 44 Years | 237 | 14.6% |
| 45 to 54 Years | 150 | 9.2% |
| 55 to 64 Years | 411 | 25.3% |
| 65 to 74 Years | 405 | 24.9% |
| 75 to 84 Years | 66 | 4.1% |
| 85 Years and Over | 54 | 3.3% |
| Total | 1,624 | 100.0% |
Housing Finances in Ettrick
Median Income by Occupancy in Ettrick
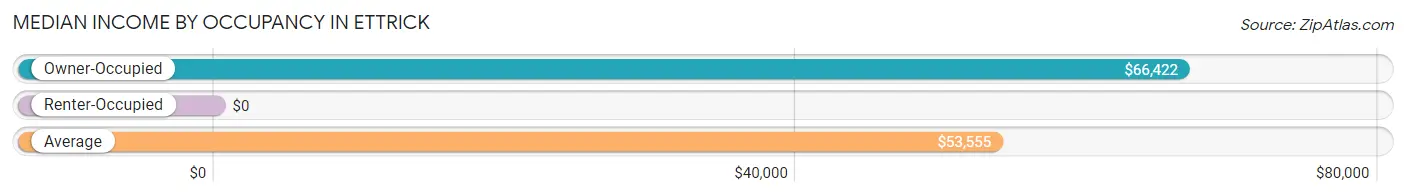
| Occupancy Type | # Households | Median Income |
| Owner-Occupied | 1,194 (73.5%) | $66,422 |
| Renter-Occupied | 430 (26.5%) | $0 |
| Average | 1,624 (100.0%) | $53,555 |
Occupancy by Householder Income Bracket in Ettrick
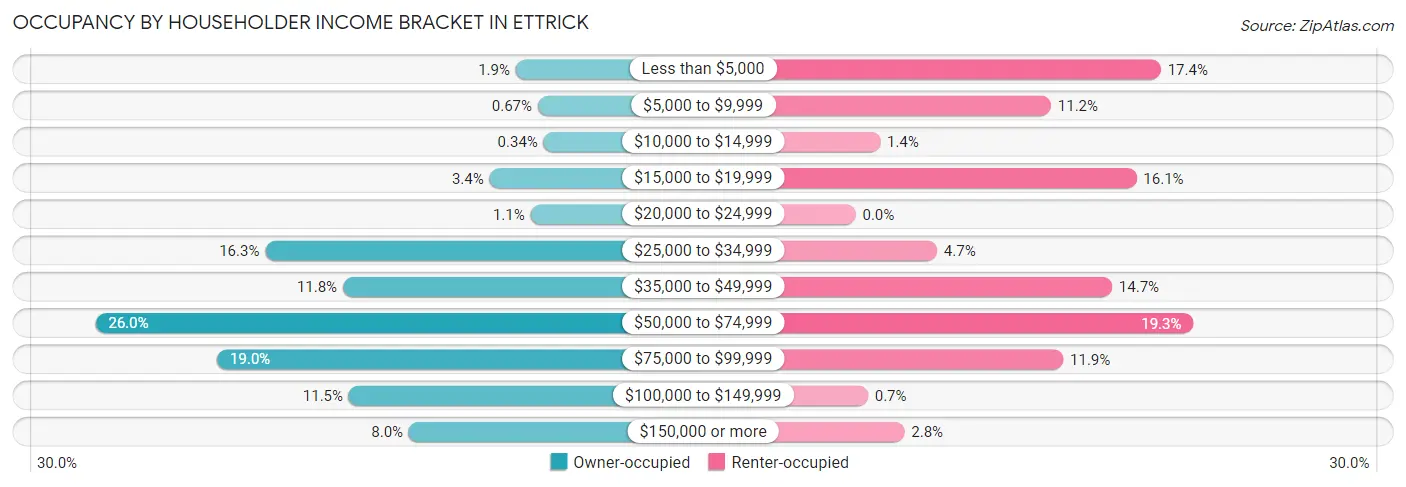
| Income Bracket | Owner-occupied | Renter-occupied |
| Less than $5,000 | 23 (1.9%) | 75 (17.4%) |
| $5,000 to $9,999 | 8 (0.7%) | 48 (11.2%) |
| $10,000 to $14,999 | 4 (0.3%) | 6 (1.4%) |
| $15,000 to $19,999 | 41 (3.4%) | 69 (16.1%) |
| $20,000 to $24,999 | 13 (1.1%) | 0 (0.0%) |
| $25,000 to $34,999 | 194 (16.3%) | 20 (4.6%) |
| $35,000 to $49,999 | 141 (11.8%) | 63 (14.6%) |
| $50,000 to $74,999 | 310 (26.0%) | 83 (19.3%) |
| $75,000 to $99,999 | 227 (19.0%) | 51 (11.9%) |
| $100,000 to $149,999 | 137 (11.5%) | 3 (0.7%) |
| $150,000 or more | 96 (8.0%) | 12 (2.8%) |
| Total | 1,194 (100.0%) | 430 (100.0%) |
Monthly Housing Cost Tiers in Ettrick
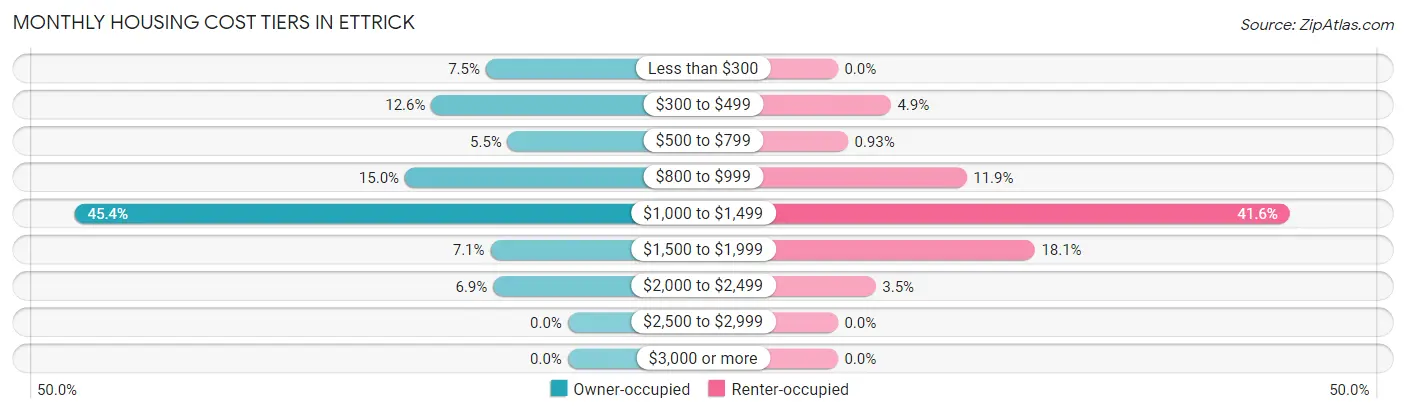
| Monthly Cost | Owner-occupied | Renter-occupied |
| Less than $300 | 90 (7.5%) | 0 (0.0%) |
| $300 to $499 | 150 (12.6%) | 21 (4.9%) |
| $500 to $799 | 66 (5.5%) | 4 (0.9%) |
| $800 to $999 | 179 (15.0%) | 51 (11.9%) |
| $1,000 to $1,499 | 542 (45.4%) | 179 (41.6%) |
| $1,500 to $1,999 | 85 (7.1%) | 78 (18.1%) |
| $2,000 to $2,499 | 82 (6.9%) | 15 (3.5%) |
| $2,500 to $2,999 | 0 (0.0%) | 0 (0.0%) |
| $3,000 or more | 0 (0.0%) | 0 (0.0%) |
| Total | 1,194 (100.0%) | 430 (100.0%) |
Physical Housing Characteristics in Ettrick
Housing Structures in Ettrick
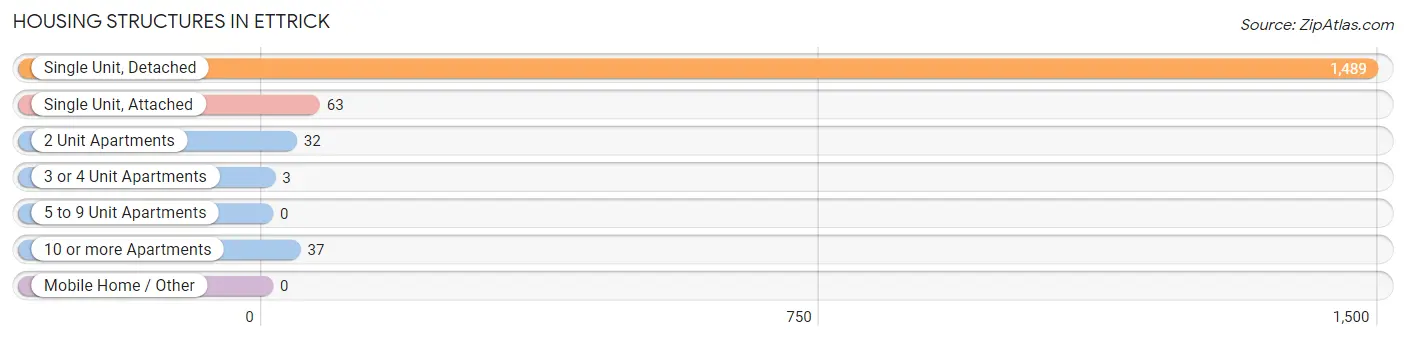
| Structure Type | # Housing Units | % Housing Units |
| Single Unit, Detached | 1,489 | 91.7% |
| Single Unit, Attached | 63 | 3.9% |
| 2 Unit Apartments | 32 | 2.0% |
| 3 or 4 Unit Apartments | 3 | 0.2% |
| 5 to 9 Unit Apartments | 0 | 0.0% |
| 10 or more Apartments | 37 | 2.3% |
| Mobile Home / Other | 0 | 0.0% |
| Total | 1,624 | 100.0% |
Housing Structures by Occupancy in Ettrick
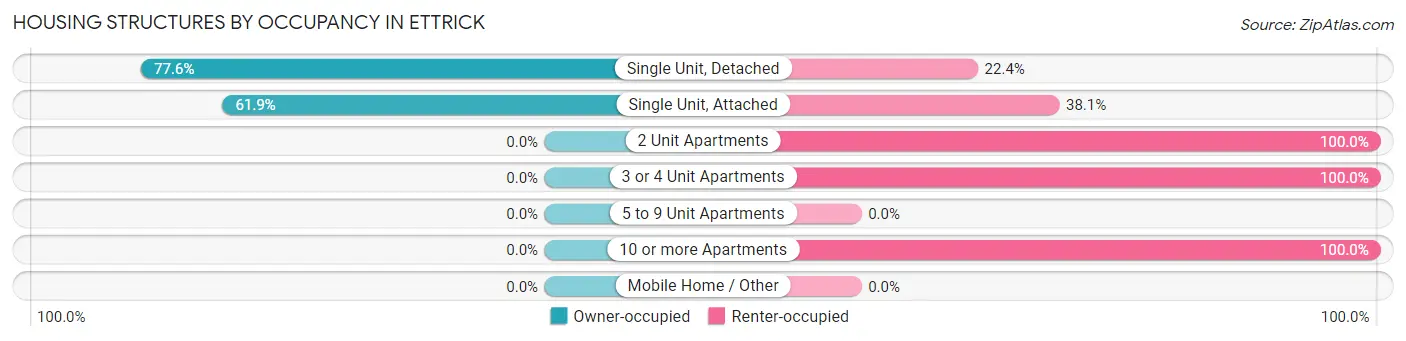
| Structure Type | Owner-occupied | Renter-occupied |
| Single Unit, Detached | 1,155 (77.6%) | 334 (22.4%) |
| Single Unit, Attached | 39 (61.9%) | 24 (38.1%) |
| 2 Unit Apartments | 0 (0.0%) | 32 (100.0%) |
| 3 or 4 Unit Apartments | 0 (0.0%) | 3 (100.0%) |
| 5 to 9 Unit Apartments | 0 (0.0%) | 0 (0.0%) |
| 10 or more Apartments | 0 (0.0%) | 37 (100.0%) |
| Mobile Home / Other | 0 (0.0%) | 0 (0.0%) |
| Total | 1,194 (73.5%) | 430 (26.5%) |
Housing Structures by Number of Rooms in Ettrick
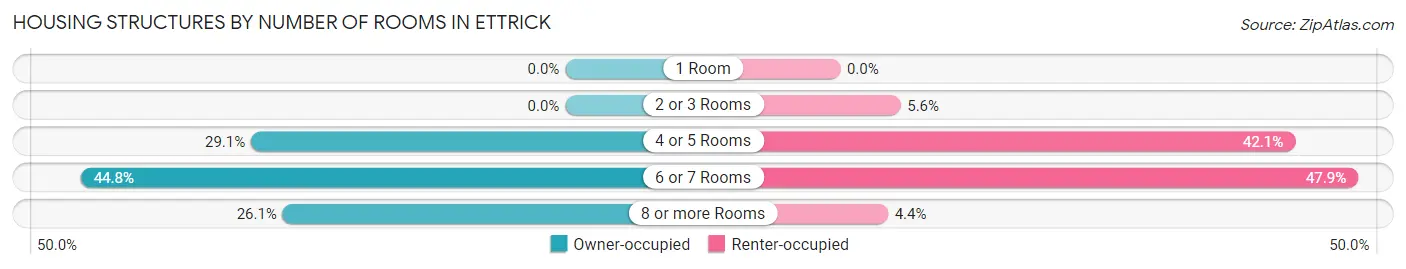
| Number of Rooms | Owner-occupied | Renter-occupied |
| 1 Room | 0 (0.0%) | 0 (0.0%) |
| 2 or 3 Rooms | 0 (0.0%) | 24 (5.6%) |
| 4 or 5 Rooms | 347 (29.1%) | 181 (42.1%) |
| 6 or 7 Rooms | 535 (44.8%) | 206 (47.9%) |
| 8 or more Rooms | 312 (26.1%) | 19 (4.4%) |
| Total | 1,194 (100.0%) | 430 (100.0%) |
Housing Structure by Heating Type in Ettrick
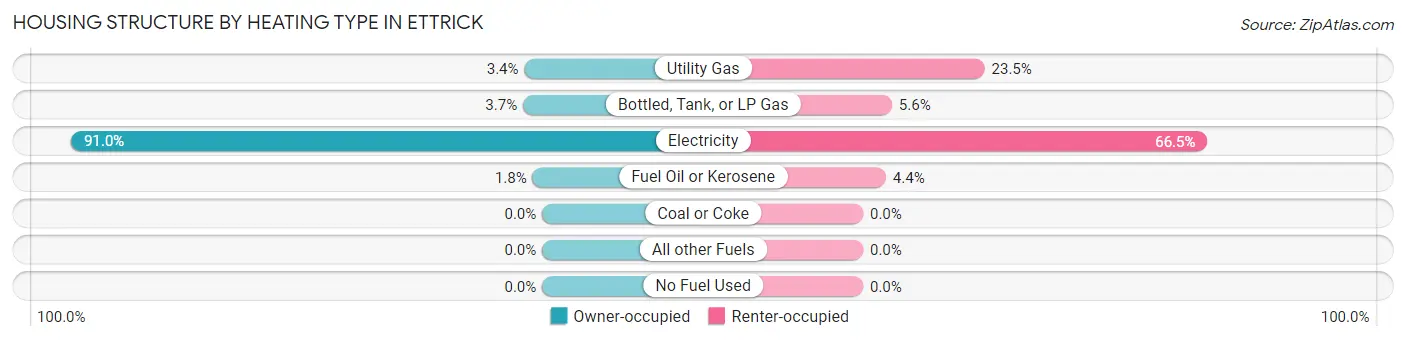
| Heating Type | Owner-occupied | Renter-occupied |
| Utility Gas | 41 (3.4%) | 101 (23.5%) |
| Bottled, Tank, or LP Gas | 44 (3.7%) | 24 (5.6%) |
| Electricity | 1,087 (91.0%) | 286 (66.5%) |
| Fuel Oil or Kerosene | 22 (1.8%) | 19 (4.4%) |
| Coal or Coke | 0 (0.0%) | 0 (0.0%) |
| All other Fuels | 0 (0.0%) | 0 (0.0%) |
| No Fuel Used | 0 (0.0%) | 0 (0.0%) |
| Total | 1,194 (100.0%) | 430 (100.0%) |
Household Vehicle Usage in Ettrick
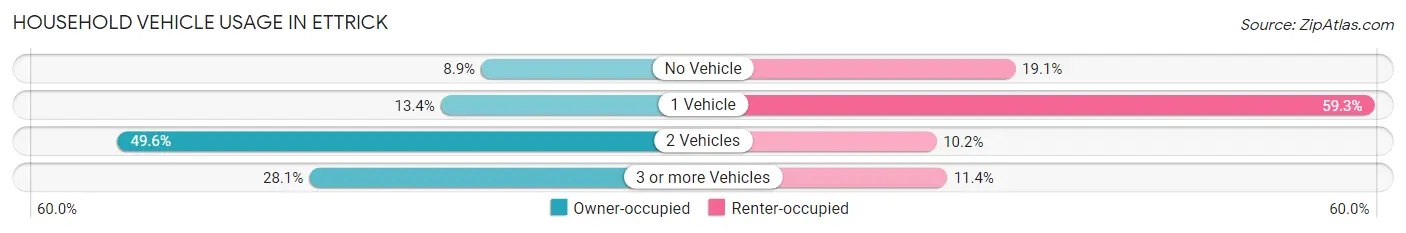
| Vehicles per Household | Owner-occupied | Renter-occupied |
| No Vehicle | 106 (8.9%) | 82 (19.1%) |
| 1 Vehicle | 160 (13.4%) | 255 (59.3%) |
| 2 Vehicles | 592 (49.6%) | 44 (10.2%) |
| 3 or more Vehicles | 336 (28.1%) | 49 (11.4%) |
| Total | 1,194 (100.0%) | 430 (100.0%) |
Real Estate & Mortgages in Ettrick
Real Estate and Mortgage Overview in Ettrick
| Characteristic | Without Mortgage | With Mortgage |
| Housing Units | 350 | 844 |
| Median Property Value | $188,200 | $158,500 |
| Median Household Income | $73,056 | $56 |
| Monthly Housing Costs | $442 | $0 |
| Real Estate Taxes | $1,585 | $85 |
Property Value by Mortgage Status in Ettrick
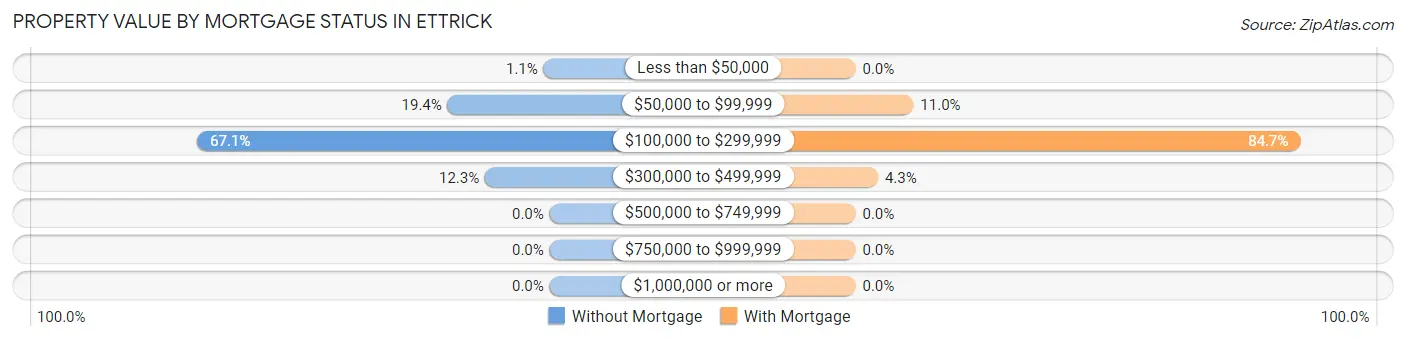
| Property Value | Without Mortgage | With Mortgage |
| Less than $50,000 | 4 (1.1%) | 0 (0.0%) |
| $50,000 to $99,999 | 68 (19.4%) | 93 (11.0%) |
| $100,000 to $299,999 | 235 (67.1%) | 715 (84.7%) |
| $300,000 to $499,999 | 43 (12.3%) | 36 (4.3%) |
| $500,000 to $749,999 | 0 (0.0%) | 0 (0.0%) |
| $750,000 to $999,999 | 0 (0.0%) | 0 (0.0%) |
| $1,000,000 or more | 0 (0.0%) | 0 (0.0%) |
| Total | 350 (100.0%) | 844 (100.0%) |
Household Income by Mortgage Status in Ettrick

| Household Income | Without Mortgage | With Mortgage |
| Less than $10,000 | 5 (1.4%) | 5 (0.6%) |
| $10,000 to $24,999 | 22 (6.3%) | 26 (3.1%) |
| $25,000 to $34,999 | 12 (3.4%) | 36 (4.3%) |
| $35,000 to $49,999 | 66 (18.9%) | 182 (21.6%) |
| $50,000 to $74,999 | 98 (28.0%) | 75 (8.9%) |
| $75,000 to $99,999 | 88 (25.1%) | 212 (25.1%) |
| $100,000 to $149,999 | 19 (5.4%) | 139 (16.5%) |
| $150,000 or more | 40 (11.4%) | 118 (14.0%) |
| Total | 350 (100.0%) | 844 (100.0%) |
Property Value to Household Income Ratio in Ettrick
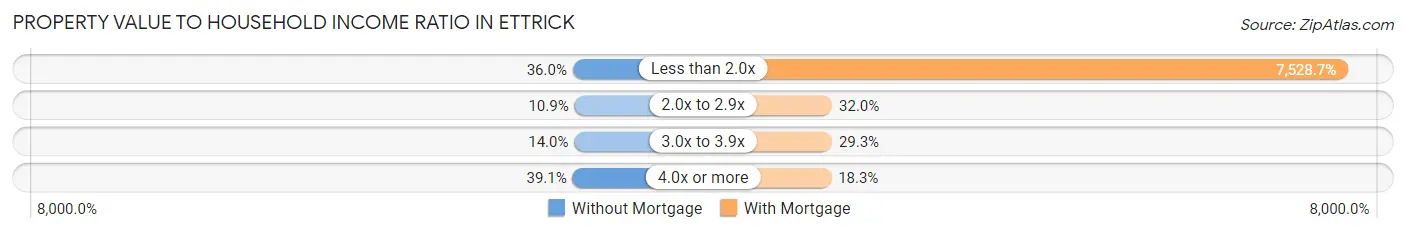
| Value-to-Income Ratio | Without Mortgage | With Mortgage |
| Less than 2.0x | 126 (36.0%) | 63,542 (7,528.7%) |
| 2.0x to 2.9x | 38 (10.9%) | 270 (32.0%) |
| 3.0x to 3.9x | 49 (14.0%) | 247 (29.3%) |
| 4.0x or more | 137 (39.1%) | 154 (18.2%) |
| Total | 350 (100.0%) | 844 (100.0%) |
Real Estate Taxes by Mortgage Status in Ettrick
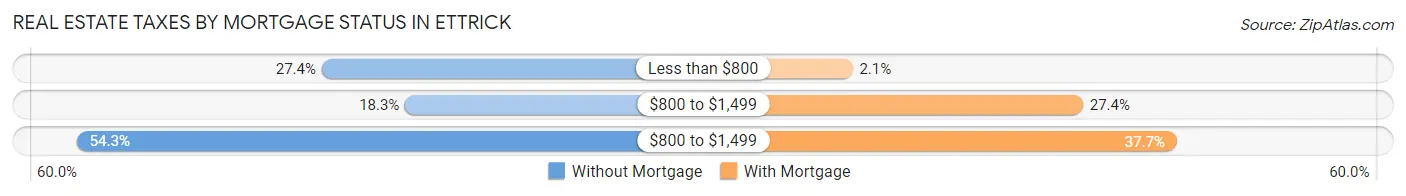
| Property Taxes | Without Mortgage | With Mortgage |
| Less than $800 | 96 (27.4%) | 18 (2.1%) |
| $800 to $1,499 | 64 (18.3%) | 231 (27.4%) |
| $800 to $1,499 | 190 (54.3%) | 318 (37.7%) |
| Total | 350 (100.0%) | 844 (100.0%) |
Health & Disability in Ettrick
Health Insurance Coverage by Age in Ettrick
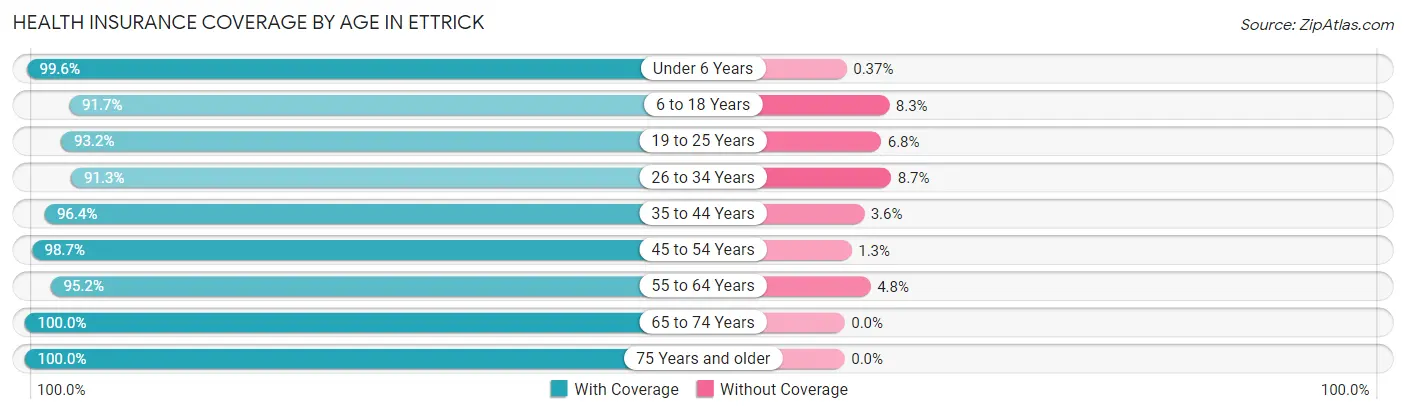
| Age Bracket | With Coverage | Without Coverage |
| Under 6 Years | 266 (99.6%) | 1 (0.4%) |
| 6 to 18 Years | 585 (91.7%) | 53 (8.3%) |
| 19 to 25 Years | 1,833 (93.2%) | 134 (6.8%) |
| 26 to 34 Years | 495 (91.3%) | 47 (8.7%) |
| 35 to 44 Years | 399 (96.4%) | 15 (3.6%) |
| 45 to 54 Years | 227 (98.7%) | 3 (1.3%) |
| 55 to 64 Years | 748 (95.2%) | 38 (4.8%) |
| 65 to 74 Years | 581 (100.0%) | 0 (0.0%) |
| 75 Years and older | 158 (100.0%) | 0 (0.0%) |
| Total | 5,292 (94.8%) | 291 (5.2%) |
Health Insurance Coverage by Citizenship Status in Ettrick
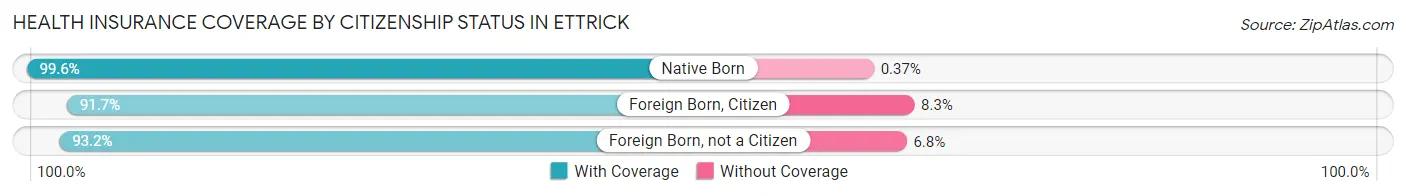
| Citizenship Status | With Coverage | Without Coverage |
| Native Born | 266 (99.6%) | 1 (0.4%) |
| Foreign Born, Citizen | 585 (91.7%) | 53 (8.3%) |
| Foreign Born, not a Citizen | 1,833 (93.2%) | 134 (6.8%) |
Health Insurance Coverage by Household Income in Ettrick
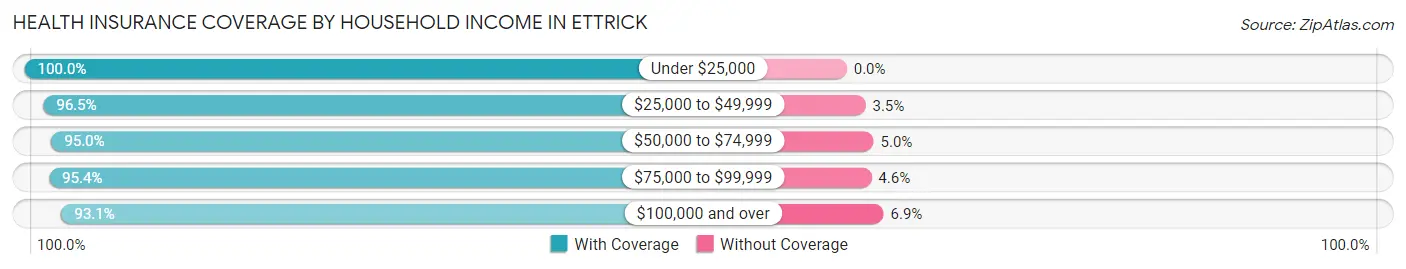
| Household Income | With Coverage | Without Coverage |
| Under $25,000 | 365 (100.0%) | 0 (0.0%) |
| $25,000 to $49,999 | 907 (96.5%) | 33 (3.5%) |
| $50,000 to $74,999 | 890 (95.0%) | 47 (5.0%) |
| $75,000 to $99,999 | 786 (95.4%) | 38 (4.6%) |
| $100,000 and over | 594 (93.1%) | 44 (6.9%) |
Public vs Private Health Insurance Coverage by Age in Ettrick
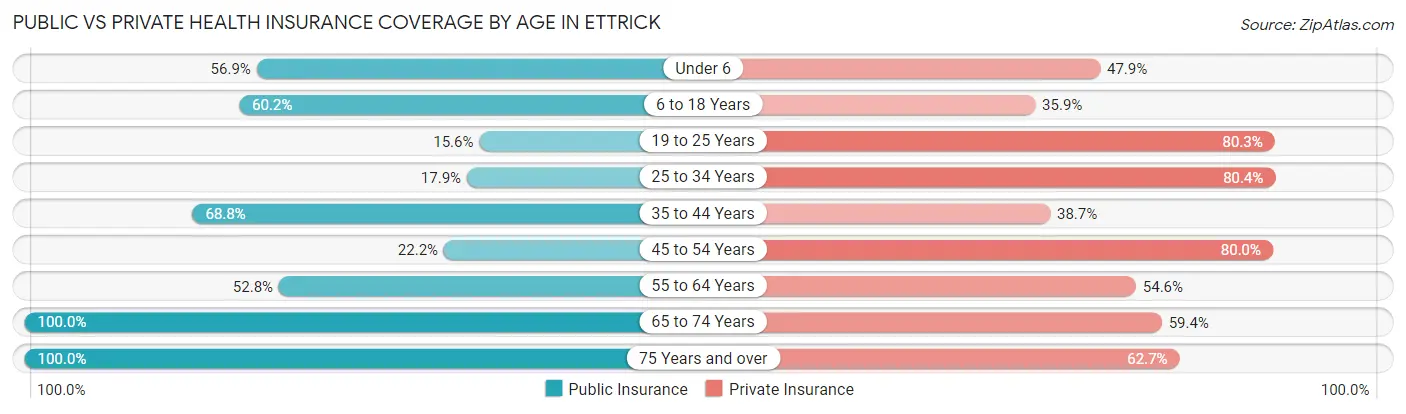
| Age Bracket | Public Insurance | Private Insurance |
| Under 6 | 152 (56.9%) | 128 (47.9%) |
| 6 to 18 Years | 384 (60.2%) | 229 (35.9%) |
| 19 to 25 Years | 307 (15.6%) | 1,580 (80.3%) |
| 25 to 34 Years | 97 (17.9%) | 436 (80.4%) |
| 35 to 44 Years | 285 (68.8%) | 160 (38.7%) |
| 45 to 54 Years | 51 (22.2%) | 184 (80.0%) |
| 55 to 64 Years | 415 (52.8%) | 429 (54.6%) |
| 65 to 74 Years | 581 (100.0%) | 345 (59.4%) |
| 75 Years and over | 158 (100.0%) | 99 (62.7%) |
| Total | 2,430 (43.5%) | 3,590 (64.3%) |
Disability Status by Sex by Age in Ettrick
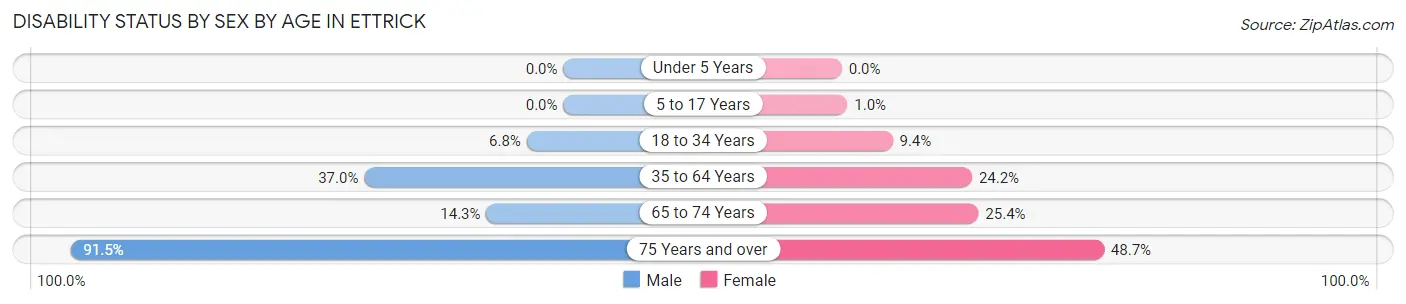
| Age Bracket | Male | Female |
| Under 5 Years | 0 (0.0%) | 0 (0.0%) |
| 5 to 17 Years | 0 (0.0%) | 2 (1.0%) |
| 18 to 34 Years | 88 (6.8%) | 134 (9.4%) |
| 35 to 64 Years | 221 (37.0%) | 201 (24.2%) |
| 65 to 74 Years | 43 (14.3%) | 71 (25.4%) |
| 75 Years and over | 43 (91.5%) | 54 (48.6%) |
Disability Class by Sex by Age in Ettrick
Disability Class: Hearing Difficulty
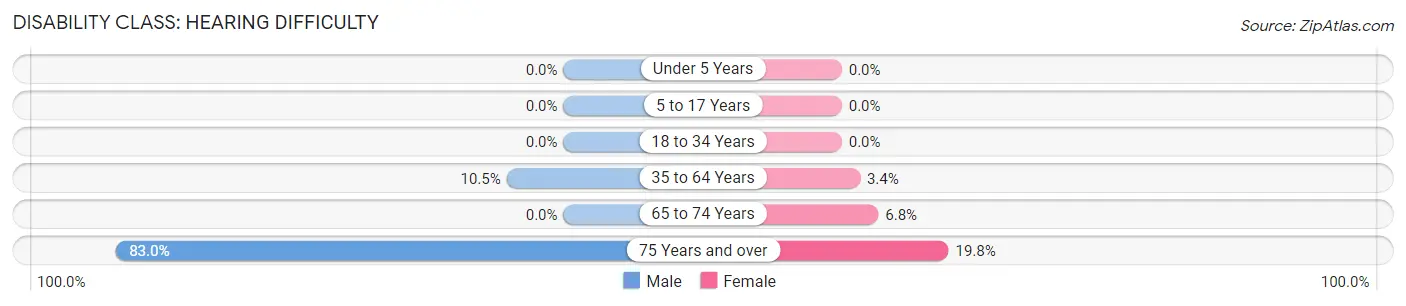
| Age Bracket | Male | Female |
| Under 5 Years | 0 (0.0%) | 0 (0.0%) |
| 5 to 17 Years | 0 (0.0%) | 0 (0.0%) |
| 18 to 34 Years | 0 (0.0%) | 0 (0.0%) |
| 35 to 64 Years | 63 (10.5%) | 28 (3.4%) |
| 65 to 74 Years | 0 (0.0%) | 19 (6.8%) |
| 75 Years and over | 39 (83.0%) | 22 (19.8%) |
Disability Class: Vision Difficulty
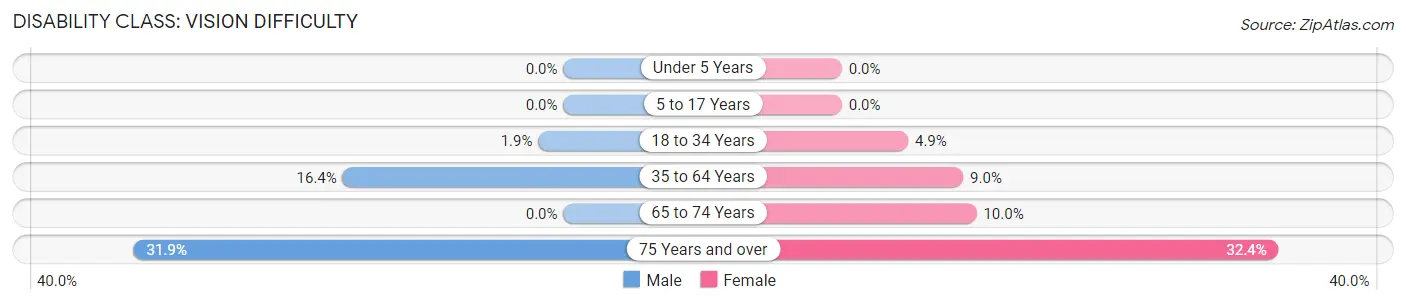
| Age Bracket | Male | Female |
| Under 5 Years | 0 (0.0%) | 0 (0.0%) |
| 5 to 17 Years | 0 (0.0%) | 0 (0.0%) |
| 18 to 34 Years | 24 (1.9%) | 70 (4.9%) |
| 35 to 64 Years | 98 (16.4%) | 75 (9.0%) |
| 65 to 74 Years | 0 (0.0%) | 28 (10.0%) |
| 75 Years and over | 15 (31.9%) | 36 (32.4%) |
Disability Class: Cognitive Difficulty
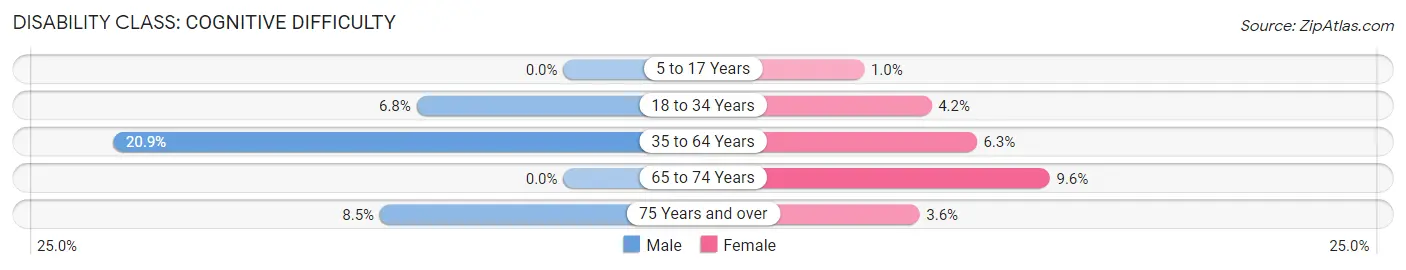
| Age Bracket | Male | Female |
| 5 to 17 Years | 0 (0.0%) | 2 (1.0%) |
| 18 to 34 Years | 88 (6.8%) | 59 (4.2%) |
| 35 to 64 Years | 125 (20.9%) | 52 (6.2%) |
| 65 to 74 Years | 0 (0.0%) | 27 (9.6%) |
| 75 Years and over | 4 (8.5%) | 4 (3.6%) |
Disability Class: Ambulatory Difficulty
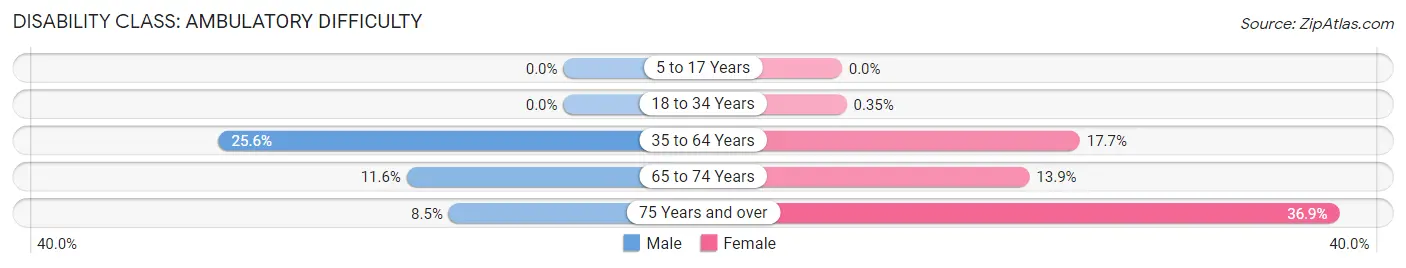
| Age Bracket | Male | Female |
| 5 to 17 Years | 0 (0.0%) | 0 (0.0%) |
| 18 to 34 Years | 0 (0.0%) | 5 (0.4%) |
| 35 to 64 Years | 153 (25.6%) | 147 (17.7%) |
| 65 to 74 Years | 35 (11.6%) | 39 (13.9%) |
| 75 Years and over | 4 (8.5%) | 41 (36.9%) |
Disability Class: Self-Care Difficulty
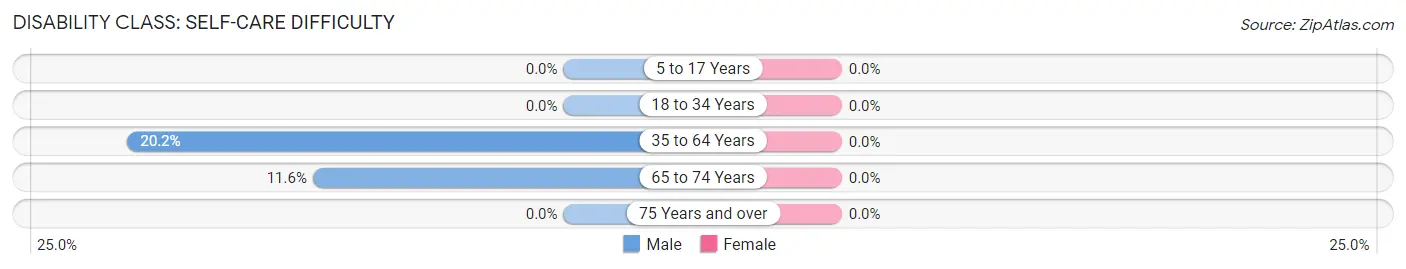
| Age Bracket | Male | Female |
| 5 to 17 Years | 0 (0.0%) | 0 (0.0%) |
| 18 to 34 Years | 0 (0.0%) | 0 (0.0%) |
| 35 to 64 Years | 121 (20.2%) | 0 (0.0%) |
| 65 to 74 Years | 35 (11.6%) | 0 (0.0%) |
| 75 Years and over | 0 (0.0%) | 0 (0.0%) |
Technology Access in Ettrick
Computing Device Access in Ettrick
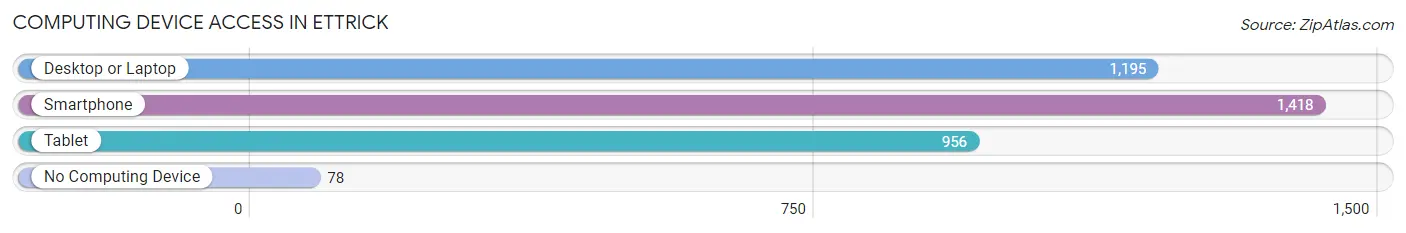
| Device Type | # Households | % Households |
| Desktop or Laptop | 1,195 | 73.6% |
| Smartphone | 1,418 | 87.3% |
| Tablet | 956 | 58.9% |
| No Computing Device | 78 | 4.8% |
| Total | 1,624 | 100.0% |
Internet Access in Ettrick
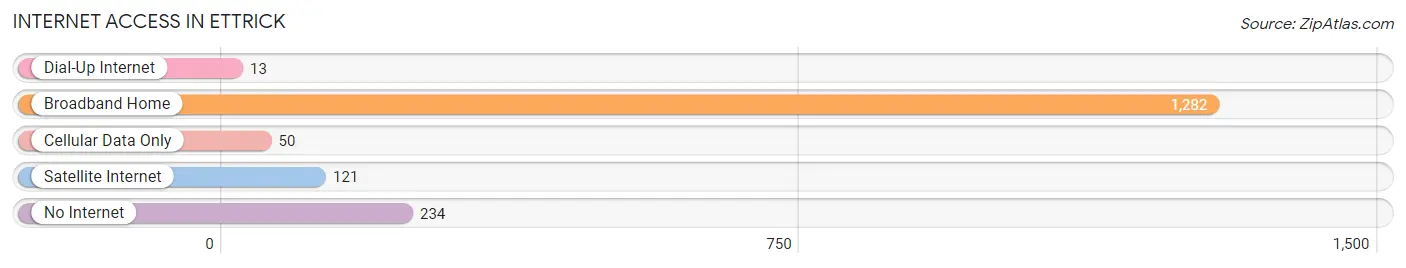
| Internet Type | # Households | % Households |
| Dial-Up Internet | 13 | 0.8% |
| Broadband Home | 1,282 | 78.9% |
| Cellular Data Only | 50 | 3.1% |
| Satellite Internet | 121 | 7.4% |
| No Internet | 234 | 14.4% |
| Total | 1,624 | 100.0% |
Ettrick Summary
Ettrick is a small unincorporated community located in Chesterfield County, Virginia. It is situated along the Appomattox River, about 10 miles south of the city of Petersburg. The population of Ettrick was estimated to be 2,845 in 2019.
History
Ettrick was first settled in the early 1700s by English settlers. The town was named after the Ettrick Forest in Scotland. The town was originally known as Ettrickville, but the name was changed to Ettrick in 1876.
The town was an important stop on the Southside Railroad, which connected Petersburg to Lynchburg. The railroad was completed in 1854 and was a major factor in the growth of Ettrick. The town was also home to a number of factories, including a cotton mill, a tobacco factory, and a paper mill.
The town was also home to a number of prominent African-American families, including the families of Booker T. Washington and George Washington Carver.
Geography
Ettrick is located in the Piedmont region of Virginia, about 10 miles south of Petersburg. The town is situated along the Appomattox River, which is a major tributary of the James River. The town is surrounded by rolling hills and forests.
The climate in Ettrick is humid subtropical, with hot, humid summers and mild winters. The average annual temperature is around 60°F (15°C).
Economy
The economy of Ettrick is largely based on agriculture and manufacturing. The town is home to a number of farms, which produce a variety of crops, including corn, soybeans, and tobacco. The town is also home to a number of factories, including a cotton mill, a tobacco factory, and a paper mill.
Demographics
As of the 2019 census, the population of Ettrick was estimated to be 2,845. The racial makeup of the town was 79.3% White, 17.2% African American, 0.7% Asian, 0.3% Native American, and 2.5% from other races. The median household income was $45,945, and the median home value was $179,400.
The town is served by the Chesterfield County Public Schools system. The town is also home to a number of churches, including the Ettrick Baptist Church, the Ettrick United Methodist Church, and the Ettrick Presbyterian Church.
Conclusion
Ettrick is a small unincorporated community located in Chesterfield County, Virginia. It is situated along the Appomattox River, about 10 miles south of the city of Petersburg. The population of Ettrick was estimated to be 2,845 in 2019. The town is largely agricultural and manufacturing-based, and is home to a number of prominent African-American families. The town is served by the Chesterfield County Public Schools system, and is home to a number of churches.
Common Questions
What is Per Capita Income in Ettrick?
Per Capita income in Ettrick is $20,486.
What is the Median Family Income in Ettrick?
Median Family Income in Ettrick is $66,573.
What is the Median Household income in Ettrick?
Median Household Income in Ettrick is $53,555.
What is Income or Wage Gap in Ettrick?
Income or Wage Gap in Ettrick is 6.5%.
Women in Ettrick earn 93.5 cents for every dollar earned by a man.
What is Inequality or Gini Index in Ettrick?
Inequality or Gini Index in Ettrick is 0.39.
What is the Total Population of Ettrick?
Total Population of Ettrick is 5,632.
What is the Total Male Population of Ettrick?
Total Male Population of Ettrick is 2,647.
What is the Total Female Population of Ettrick?
Total Female Population of Ettrick is 2,985.
What is the Ratio of Males per 100 Females in Ettrick?
There are 88.68 Males per 100 Females in Ettrick.
What is the Ratio of Females per 100 Males in Ettrick?
There are 112.77 Females per 100 Males in Ettrick.
What is the Median Population Age in Ettrick?
Median Population Age in Ettrick is 25.3 Years.
What is the Average Family Size in Ettrick
Average Family Size in Ettrick is 2.8 People.
What is the Average Household Size in Ettrick
Average Household Size in Ettrick is 2.3 People.
How Large is the Labor Force in Ettrick?
There are 2,947 People in the Labor Forcein in Ettrick.
What is the Percentage of People in the Labor Force in Ettrick?
58.7% of People are in the Labor Force in Ettrick.
What is the Unemployment Rate in Ettrick?
Unemployment Rate in Ettrick is 15.1%.