Bedford, VA Map & Demographics
Bedford Map
Bedford Overview
$26,238
PER CAPITA INCOME
$61,134
AVG FAMILY INCOME
$41,154
AVG HOUSEHOLD INCOME
20.6%
WAGE / INCOME GAP [ % ]
79.4¢/ $1
WAGE / INCOME GAP [ $ ]
$11,095
FAMILY INCOME DEFICIT
0.45
INEQUALITY / GINI INDEX
6,676
TOTAL POPULATION
2,980
MALE POPULATION
3,696
FEMALE POPULATION
80.63
MALES / 100 FEMALES
124.03
FEMALES / 100 MALES
40.5
MEDIAN AGE
3.1
AVG FAMILY SIZE
2.2
AVG HOUSEHOLD SIZE
3,046
LABOR FORCE [ PEOPLE ]
55.7%
PERCENT IN LABOR FORCE
2.4%
UNEMPLOYMENT RATE
Bedford Zip Codes
Bedford Area Codes
Income in Bedford
Income Overview in Bedford
Per Capita Income in Bedford is $26,238, while median incomes of families and households are $61,134 and $41,154 respectively.
| Characteristic | Number | Measure |
| Per Capita Income | 6,676 | $26,238 |
| Median Family Income | 1,565 | $61,134 |
| Mean Family Income | 1,565 | $73,688 |
| Median Household Income | 2,858 | $41,154 |
| Mean Household Income | 2,858 | $58,498 |
| Income Deficit | 1,565 | $11,095 |
| Wage / Income Gap (%) | 6,676 | 20.61% |
| Wage / Income Gap ($) | 6,676 | 79.39¢ per $1 |
| Gini / Inequality Index | 6,676 | 0.45 |
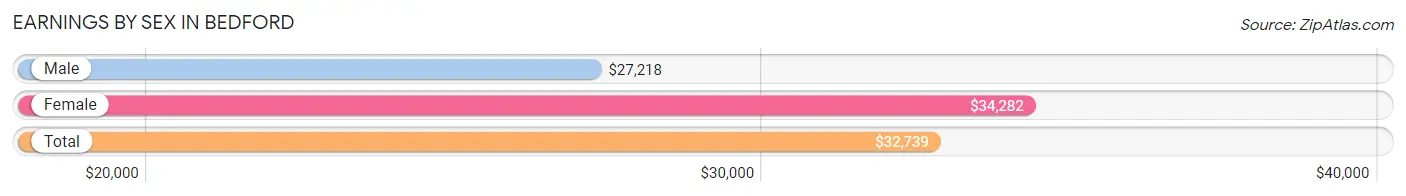
Earnings by Sex in Bedford
Average Earnings in Bedford are $32,739, $27,218 for men and $34,282 for women, a difference of 20.6%.
| Sex | Number | Average Earnings |
| Male | 1,610 (50.0%) | $27,218 |
| Female | 1,607 (49.9%) | $34,282 |
| Total | 3,217 (100.0%) | $32,739 |
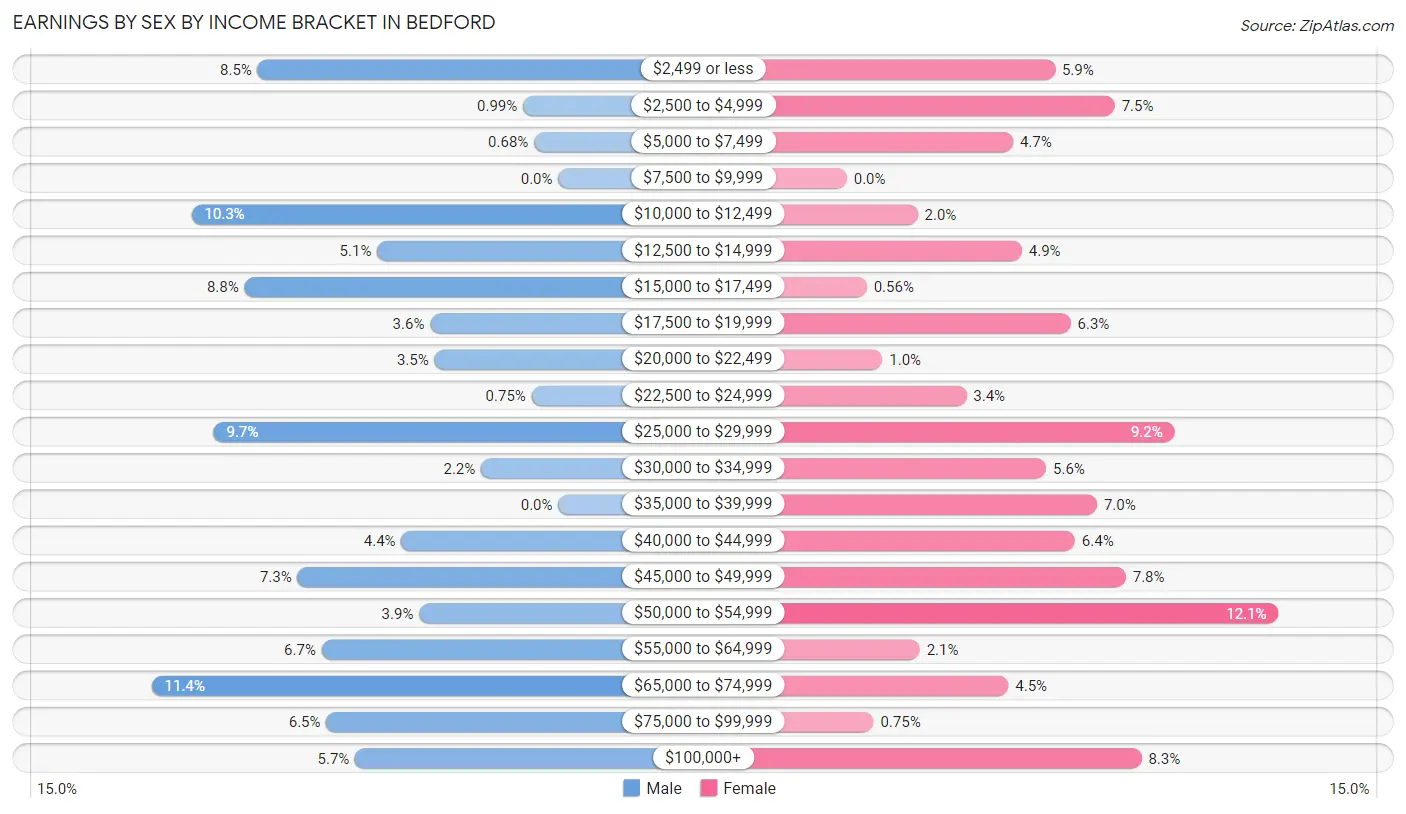
Earnings by Sex by Income Bracket in Bedford
The most common earnings brackets in Bedford are $65,000 to $74,999 for men (184 | 11.4%) and $50,000 to $54,999 for women (195 | 12.1%).
| Income | Male | Female |
| $2,499 or less | 136 (8.5%) | 94 (5.9%) |
| $2,500 to $4,999 | 16 (1.0%) | 121 (7.5%) |
| $5,000 to $7,499 | 11 (0.7%) | 75 (4.7%) |
| $7,500 to $9,999 | 0 (0.0%) | 0 (0.0%) |
| $10,000 to $12,499 | 166 (10.3%) | 32 (2.0%) |
| $12,500 to $14,999 | 82 (5.1%) | 79 (4.9%) |
| $15,000 to $17,499 | 142 (8.8%) | 9 (0.6%) |
| $17,500 to $19,999 | 58 (3.6%) | 101 (6.3%) |
| $20,000 to $22,499 | 56 (3.5%) | 16 (1.0%) |
| $22,500 to $24,999 | 12 (0.7%) | 54 (3.4%) |
| $25,000 to $29,999 | 156 (9.7%) | 148 (9.2%) |
| $30,000 to $34,999 | 35 (2.2%) | 90 (5.6%) |
| $35,000 to $39,999 | 0 (0.0%) | 113 (7.0%) |
| $40,000 to $44,999 | 71 (4.4%) | 103 (6.4%) |
| $45,000 to $49,999 | 118 (7.3%) | 126 (7.8%) |
| $50,000 to $54,999 | 63 (3.9%) | 195 (12.1%) |
| $55,000 to $64,999 | 107 (6.7%) | 33 (2.1%) |
| $65,000 to $74,999 | 184 (11.4%) | 73 (4.5%) |
| $75,000 to $99,999 | 105 (6.5%) | 12 (0.7%) |
| $100,000+ | 92 (5.7%) | 133 (8.3%) |
| Total | 1,610 (100.0%) | 1,607 (100.0%) |
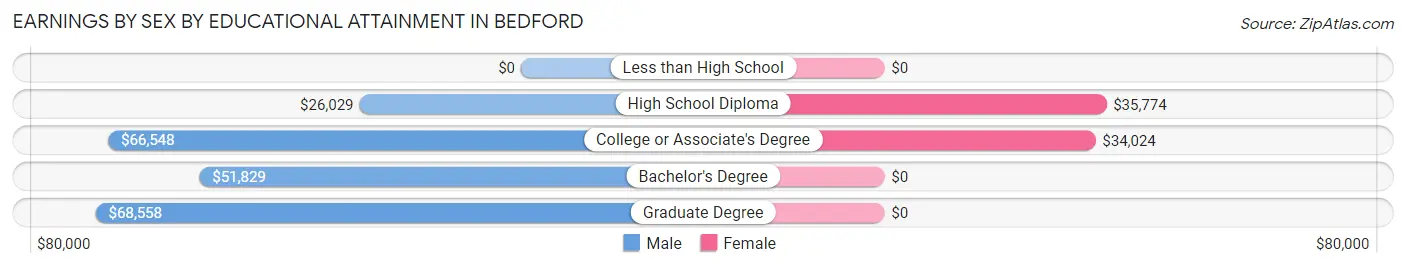
Earnings by Sex by Educational Attainment in Bedford
Average earnings in Bedford are $44,000 for men and $37,321 for women, a difference of 15.2%. Men with an educational attainment of graduate degree enjoy the highest average annual earnings of $68,558, while those with high school diploma education earn the least with $26,029. Women with an educational attainment of high school diploma earn the most with the average annual earnings of $35,774, while those with college or associate's degree education have the smallest earnings of $34,024.
| Educational Attainment | Male Income | Female Income |
| Less than High School | - | - |
| High School Diploma | $26,029 | $35,774 |
| College or Associate's Degree | $66,548 | $34,024 |
| Bachelor's Degree | $51,829 | $0 |
| Graduate Degree | $68,558 | $0 |
| Total | $44,000 | $37,321 |
Family Income in Bedford
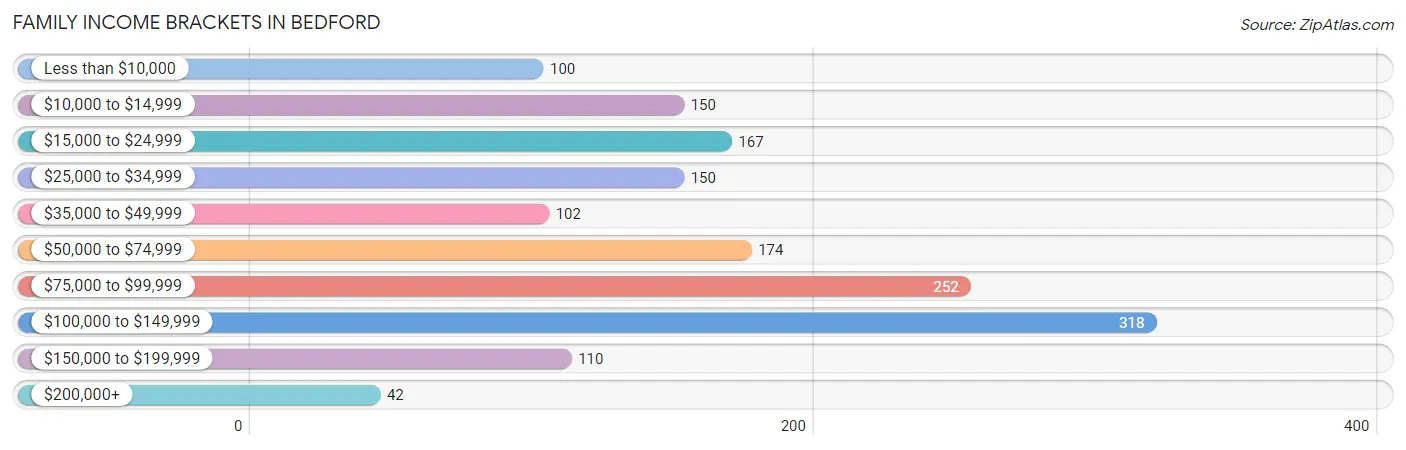
Family Income Brackets in Bedford
According to the Bedford family income data, there are 318 families falling into the $100,000 to $149,999 income range, which is the most common income bracket and makes up 20.3% of all families. Conversely, the $200,000+ income bracket is the least frequent group with only 42 families (2.7%) belonging to this category.
| Income Bracket | # Families | % Families |
| Less than $10,000 | 100 | 6.4% |
| $10,000 to $14,999 | 150 | 9.6% |
| $15,000 to $24,999 | 167 | 10.7% |
| $25,000 to $34,999 | 150 | 9.6% |
| $35,000 to $49,999 | 102 | 6.5% |
| $50,000 to $74,999 | 174 | 11.1% |
| $75,000 to $99,999 | 252 | 16.1% |
| $100,000 to $149,999 | 318 | 20.3% |
| $150,000 to $199,999 | 110 | 7.0% |
| $200,000+ | 42 | 2.7% |
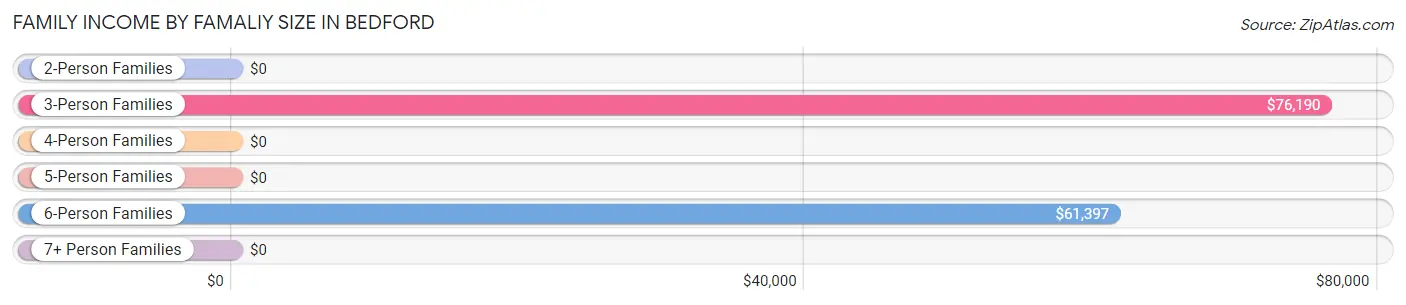
Family Income by Famaliy Size in Bedford
3-person families (350 | 22.4%) account for the highest median family income in Bedford with $76,190 per family, while 3-person families (350 | 22.4%) have the highest median income of $25,397 per family member.
| Income Bracket | # Families | Median Income |
| 2-Person Families | 830 (53.0%) | $0 |
| 3-Person Families | 350 (22.4%) | $76,190 |
| 4-Person Families | 216 (13.8%) | $0 |
| 5-Person Families | 57 (3.6%) | $0 |
| 6-Person Families | 41 (2.6%) | $61,397 |
| 7+ Person Families | 71 (4.5%) | $0 |
| Total | 1,565 (100.0%) | $61,134 |
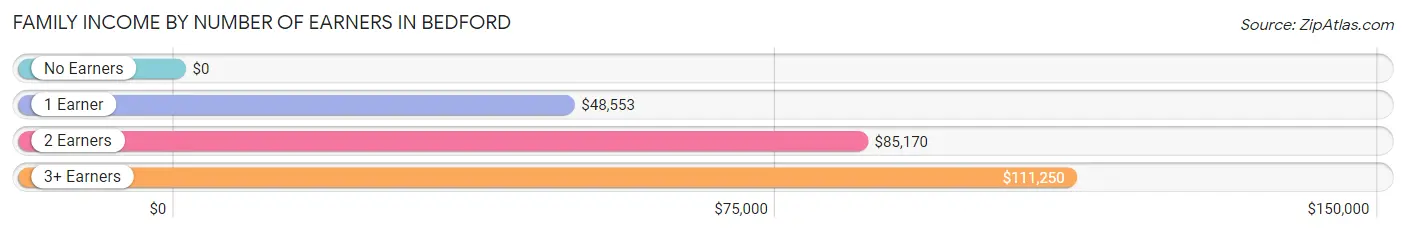
Family Income by Number of Earners in Bedford
| Number of Earners | # Families | Median Income |
| No Earners | 358 (22.9%) | $0 |
| 1 Earner | 586 (37.4%) | $48,553 |
| 2 Earners | 379 (24.2%) | $85,170 |
| 3+ Earners | 242 (15.5%) | $111,250 |
| Total | 1,565 (100.0%) | $61,134 |
Household Income in Bedford
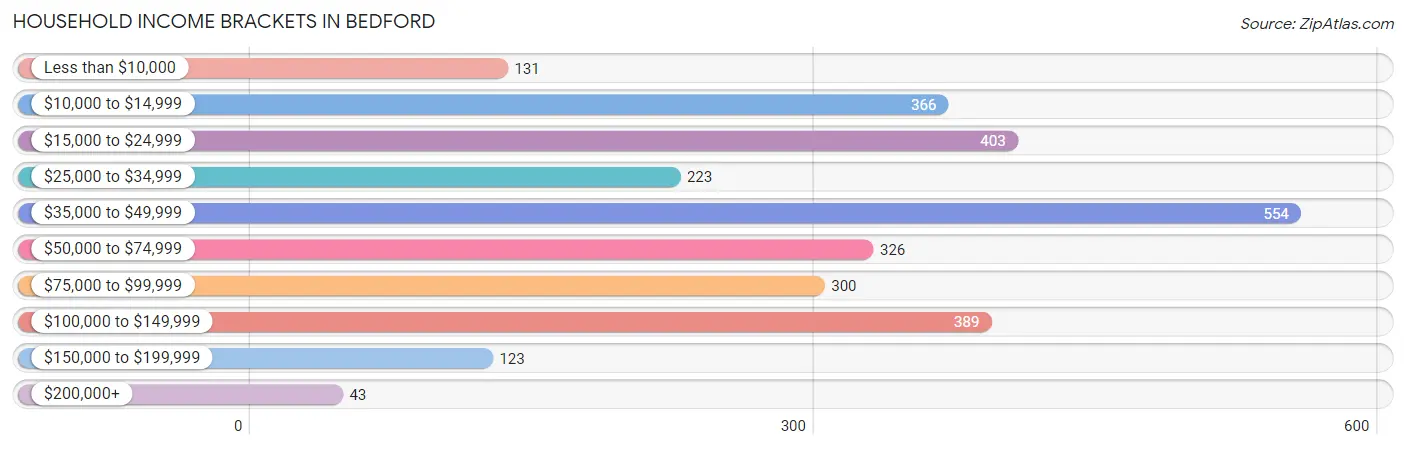
Household Income Brackets in Bedford
With 554 households falling in the category, the $35,000 to $49,999 income range is the most frequent in Bedford, accounting for 19.4% of all households. In contrast, only 43 households (1.5%) fall into the $200,000+ income bracket, making it the least populous group.
| Income Bracket | # Households | % Households |
| Less than $10,000 | 131 | 4.6% |
| $10,000 to $14,999 | 366 | 12.8% |
| $15,000 to $24,999 | 403 | 14.1% |
| $25,000 to $34,999 | 223 | 7.8% |
| $35,000 to $49,999 | 554 | 19.4% |
| $50,000 to $74,999 | 326 | 11.4% |
| $75,000 to $99,999 | 300 | 10.5% |
| $100,000 to $149,999 | 389 | 13.6% |
| $150,000 to $199,999 | 123 | 4.3% |
| $200,000+ | 43 | 1.5% |
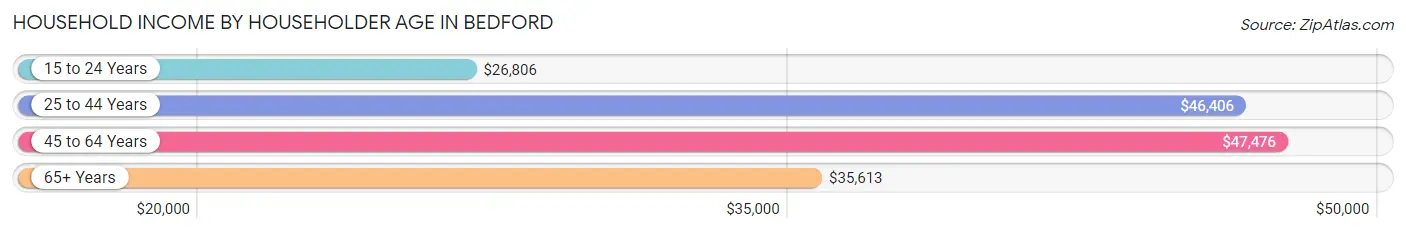
Household Income by Householder Age in Bedford
The median household income in Bedford is $41,154, with the highest median household income of $47,476 found in the 45 to 64 years age bracket for the primary householder. A total of 1,178 households (41.2%) fall into this category. Meanwhile, the 15 to 24 years age bracket for the primary householder has the lowest median household income of $26,806, with 109 households (3.8%) in this group.
| Income Bracket | # Households | Median Income |
| 15 to 24 Years | 109 (3.8%) | $26,806 |
| 25 to 44 Years | 756 (26.5%) | $46,406 |
| 45 to 64 Years | 1,178 (41.2%) | $47,476 |
| 65+ Years | 815 (28.5%) | $35,613 |
| Total | 2,858 (100.0%) | $41,154 |
Poverty in Bedford
Income Below Poverty by Sex and Age in Bedford
With 27.5% poverty level for males and 26.1% for females among the residents of Bedford, under 5 year old males and 6 to 11 year old females are the most vulnerable to poverty, with 44 males (51.2%) and 186 females (74.1%) in their respective age groups living below the poverty level.
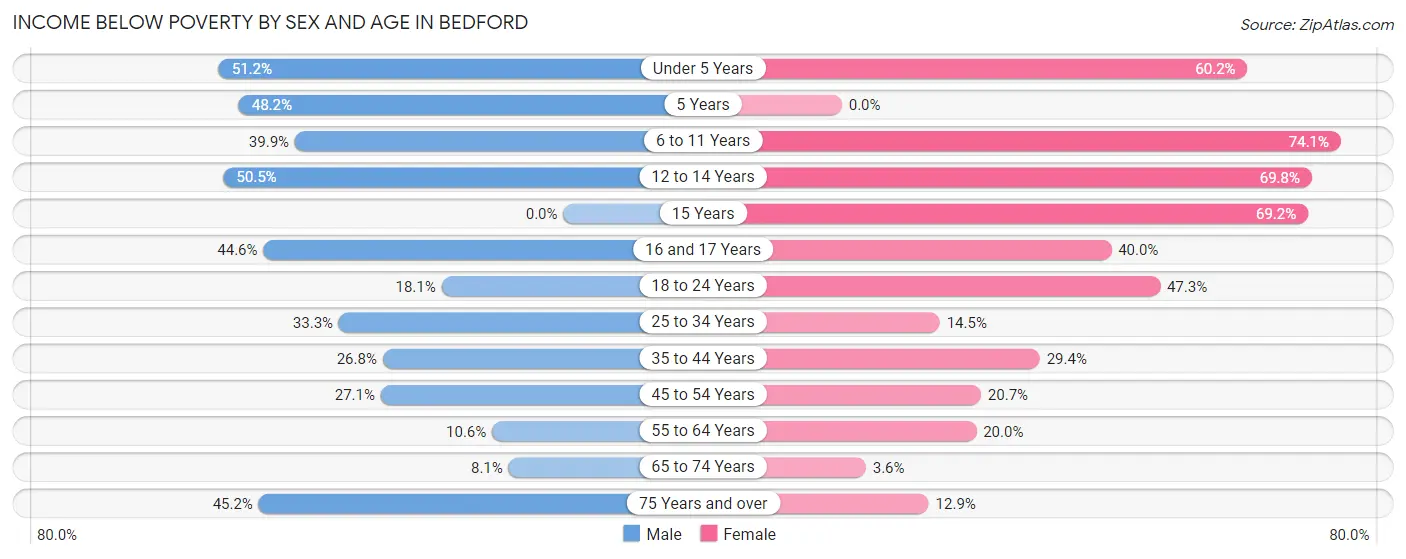
| Age Bracket | Male | Female |
| Under 5 Years | 44 (51.2%) | 53 (60.2%) |
| 5 Years | 40 (48.2%) | 0 (0.0%) |
| 6 to 11 Years | 118 (39.9%) | 186 (74.1%) |
| 12 to 14 Years | 54 (50.5%) | 67 (69.8%) |
| 15 Years | 0 (0.0%) | 63 (69.2%) |
| 16 and 17 Years | 49 (44.6%) | 12 (40.0%) |
| 18 to 24 Years | 68 (18.1%) | 129 (47.2%) |
| 25 to 34 Years | 148 (33.3%) | 89 (14.5%) |
| 35 to 44 Years | 48 (26.8%) | 77 (29.4%) |
| 45 to 54 Years | 119 (27.1%) | 100 (20.7%) |
| 55 to 64 Years | 42 (10.6%) | 92 (20.0%) |
| 65 to 74 Years | 17 (8.1%) | 18 (3.6%) |
| 75 Years and over | 19 (45.2%) | 44 (12.9%) |
| Total | 766 (27.5%) | 930 (26.1%) |
Income Above Poverty by Sex and Age in Bedford
According to the poverty statistics in Bedford, males aged 15 years and females aged 5 years are the age groups that are most secure financially, with 100.0% of males and 100.0% of females in these age groups living above the poverty line.
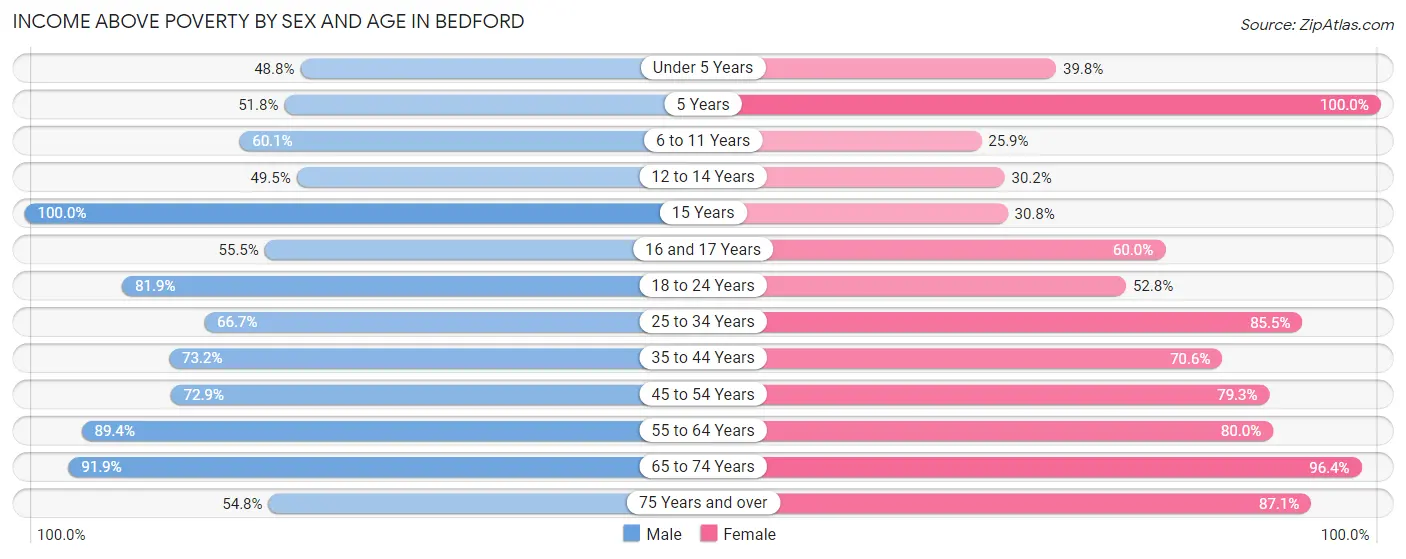
| Age Bracket | Male | Female |
| Under 5 Years | 42 (48.8%) | 35 (39.8%) |
| 5 Years | 43 (51.8%) | 67 (100.0%) |
| 6 to 11 Years | 178 (60.1%) | 65 (25.9%) |
| 12 to 14 Years | 53 (49.5%) | 29 (30.2%) |
| 15 Years | 20 (100.0%) | 28 (30.8%) |
| 16 and 17 Years | 61 (55.4%) | 18 (60.0%) |
| 18 to 24 Years | 308 (81.9%) | 144 (52.7%) |
| 25 to 34 Years | 296 (66.7%) | 523 (85.5%) |
| 35 to 44 Years | 131 (73.2%) | 185 (70.6%) |
| 45 to 54 Years | 320 (72.9%) | 384 (79.3%) |
| 55 to 64 Years | 355 (89.4%) | 369 (80.0%) |
| 65 to 74 Years | 192 (91.9%) | 488 (96.4%) |
| 75 Years and over | 23 (54.8%) | 297 (87.1%) |
| Total | 2,022 (72.5%) | 2,632 (73.9%) |
Income Below Poverty Among Married-Couple Families in Bedford
The poverty statistics for married-couple families in Bedford show that 16.6% or 162 of the total 978 families live below the poverty line. Families with 5 or more children have the highest poverty rate of 100.0%, comprising of 55 families. On the other hand, families with no children have the lowest poverty rate of 0.0%, which includes 0 families.
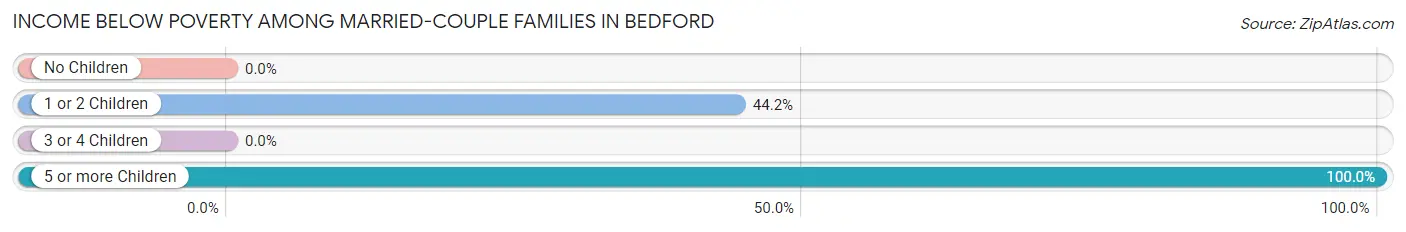
| Children | Above Poverty | Below Poverty |
| No Children | 603 (100.0%) | 0 (0.0%) |
| 1 or 2 Children | 135 (55.8%) | 107 (44.2%) |
| 3 or 4 Children | 78 (100.0%) | 0 (0.0%) |
| 5 or more Children | 0 (0.0%) | 55 (100.0%) |
| Total | 816 (83.4%) | 162 (16.6%) |
Income Below Poverty Among Single-Parent Households in Bedford
According to the poverty data in Bedford, 34.2% or 69 single-father households and 40.0% or 154 single-mother households are living below the poverty line. Among single-father households, those with 1 or 2 children have the highest poverty rate, with 49 households (68.1%) experiencing poverty. Likewise, among single-mother households, those with 1 or 2 children have the highest poverty rate, with 121 households (48.2%) falling below the poverty line.
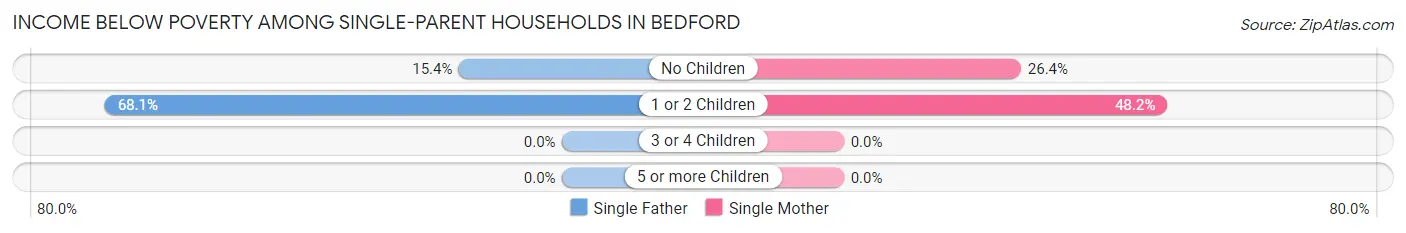
| Children | Single Father | Single Mother |
| No Children | 20 (15.4%) | 33 (26.4%) |
| 1 or 2 Children | 49 (68.1%) | 121 (48.2%) |
| 3 or 4 Children | 0 (0.0%) | 0 (0.0%) |
| 5 or more Children | 0 (0.0%) | 0 (0.0%) |
| Total | 69 (34.2%) | 154 (40.0%) |
Income Below Poverty Among Married-Couple vs Single-Parent Households in Bedford
The poverty data for Bedford shows that 162 of the married-couple family households (16.6%) and 223 of the single-parent households (38.0%) are living below the poverty level. Within the married-couple family households, those with 5 or more children have the highest poverty rate, with 55 households (100.0%) falling below the poverty line. Among the single-parent households, those with 1 or 2 children have the highest poverty rate, with 170 household (52.6%) living below poverty.
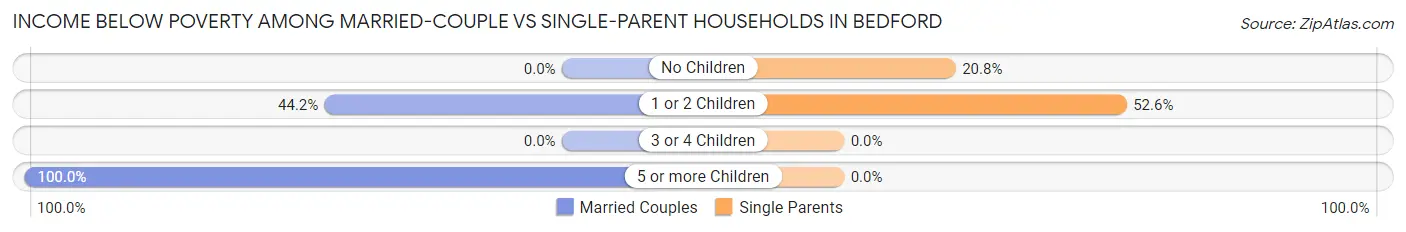
| Children | Married-Couple Families | Single-Parent Households |
| No Children | 0 (0.0%) | 53 (20.8%) |
| 1 or 2 Children | 107 (44.2%) | 170 (52.6%) |
| 3 or 4 Children | 0 (0.0%) | 0 (0.0%) |
| 5 or more Children | 55 (100.0%) | 0 (0.0%) |
| Total | 162 (16.6%) | 223 (38.0%) |
Race in Bedford
The most populous races in Bedford are White / Caucasian (4,791 | 71.8%), Black / African American (1,172 | 17.6%), and Some other Race (267 | 4.0%).
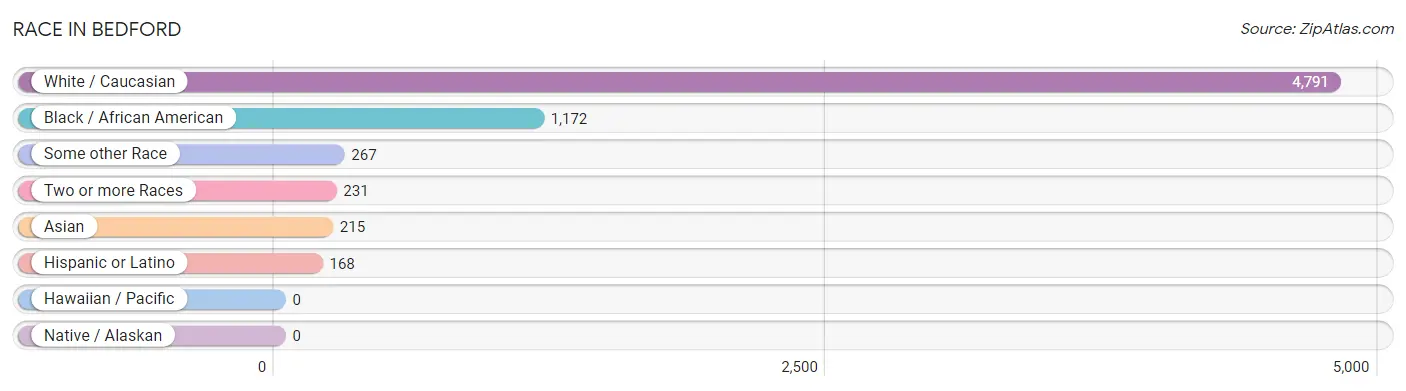
| Race | # Population | % Population |
| Asian | 215 | 3.2% |
| Black / African American | 1,172 | 17.6% |
| Hawaiian / Pacific | 0 | 0.0% |
| Hispanic or Latino | 168 | 2.5% |
| Native / Alaskan | 0 | 0.0% |
| White / Caucasian | 4,791 | 71.8% |
| Two or more Races | 231 | 3.5% |
| Some other Race | 267 | 4.0% |
| Total | 6,676 | 100.0% |
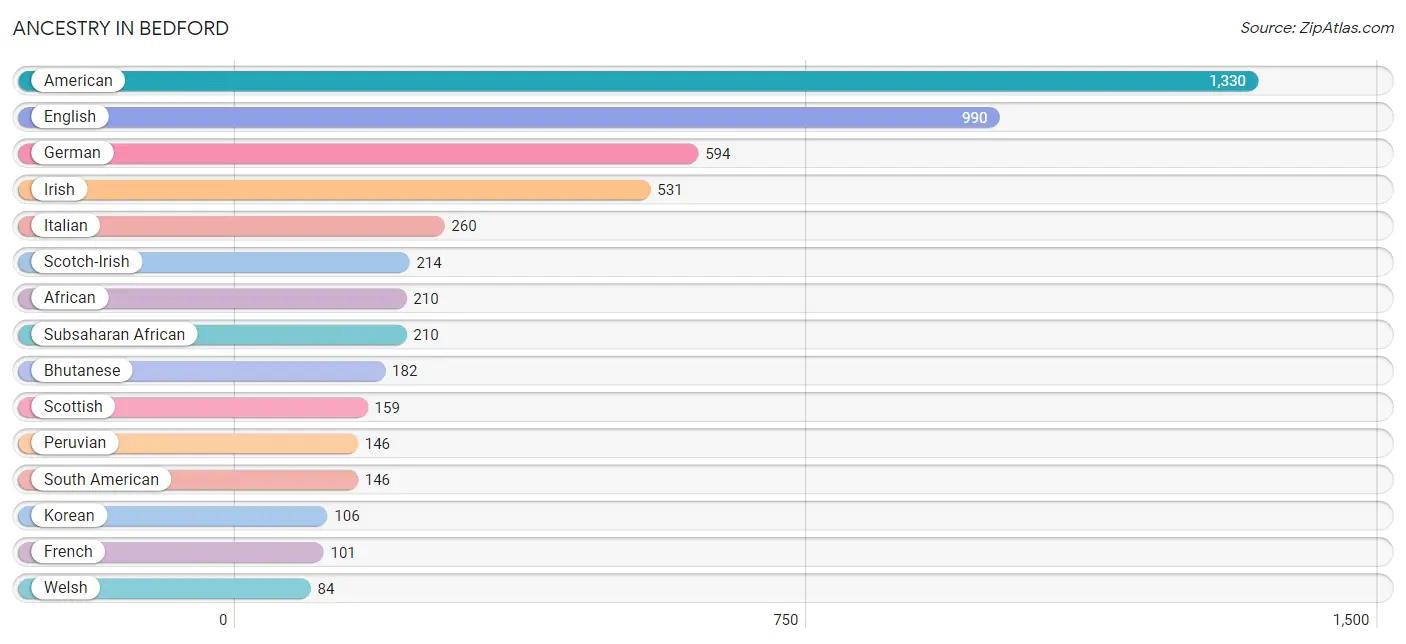
Ancestry in Bedford
The most populous ancestries reported in Bedford are American (1,330 | 19.9%), English (990 | 14.8%), German (594 | 8.9%), Irish (531 | 8.0%), and Italian (260 | 3.9%), together accounting for 55.5% of all Bedford residents.
| Ancestry | # Population | % Population |
| African | 210 | 3.2% |
| American | 1,330 | 19.9% |
| Arab | 12 | 0.2% |
| Armenian | 19 | 0.3% |
| Bhutanese | 182 | 2.7% |
| British | 23 | 0.3% |
| Cherokee | 28 | 0.4% |
| Dutch | 56 | 0.8% |
| English | 990 | 14.8% |
| European | 24 | 0.4% |
| French | 101 | 1.5% |
| French Canadian | 11 | 0.2% |
| German | 594 | 8.9% |
| Greek | 4 | 0.1% |
| Haitian | 53 | 0.8% |
| Indian (Asian) | 11 | 0.2% |
| Iranian | 4 | 0.1% |
| Irish | 531 | 8.0% |
| Italian | 260 | 3.9% |
| Jamaican | 15 | 0.2% |
| Korean | 106 | 1.6% |
| Laotian | 3 | 0.0% |
| Norwegian | 19 | 0.3% |
| Peruvian | 146 | 2.2% |
| Polish | 24 | 0.4% |
| Puerto Rican | 22 | 0.3% |
| Scandinavian | 40 | 0.6% |
| Scotch-Irish | 214 | 3.2% |
| Scottish | 159 | 2.4% |
| South American | 146 | 2.2% |
| Subsaharan African | 210 | 3.2% |
| Syrian | 12 | 0.2% |
| Welsh | 84 | 1.3% | View All 33 Rows |
Immigrants in Bedford
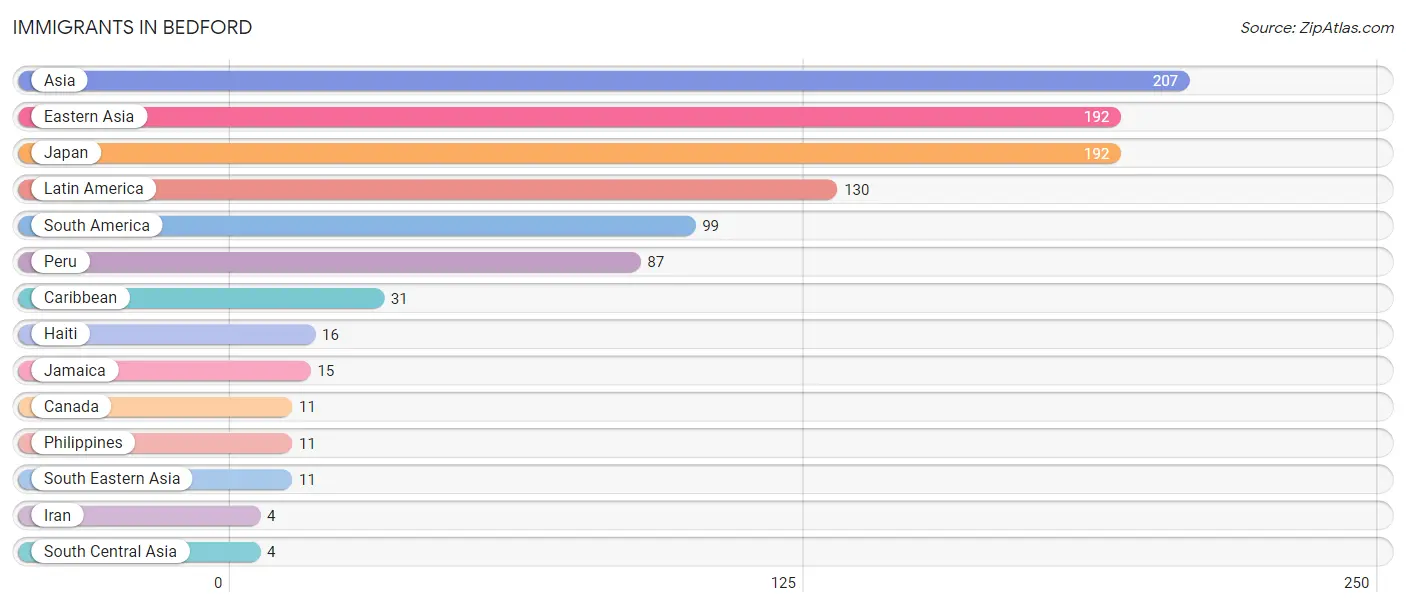
The most numerous immigrant groups reported in Bedford came from Asia (207 | 3.1%), Eastern Asia (192 | 2.9%), Japan (192 | 2.9%), Latin America (130 | 1.9%), and South America (99 | 1.5%), together accounting for 12.3% of all Bedford residents.
| Immigration Origin | # Population | % Population |
| Asia | 207 | 3.1% |
| Canada | 11 | 0.2% |
| Caribbean | 31 | 0.5% |
| Eastern Asia | 192 | 2.9% |
| Haiti | 16 | 0.2% |
| Iran | 4 | 0.1% |
| Jamaica | 15 | 0.2% |
| Japan | 192 | 2.9% |
| Latin America | 130 | 1.9% |
| Peru | 87 | 1.3% |
| Philippines | 11 | 0.2% |
| South America | 99 | 1.5% |
| South Central Asia | 4 | 0.1% |
| South Eastern Asia | 11 | 0.2% | View All 14 Rows |
Sex and Age in Bedford
Sex and Age in Bedford
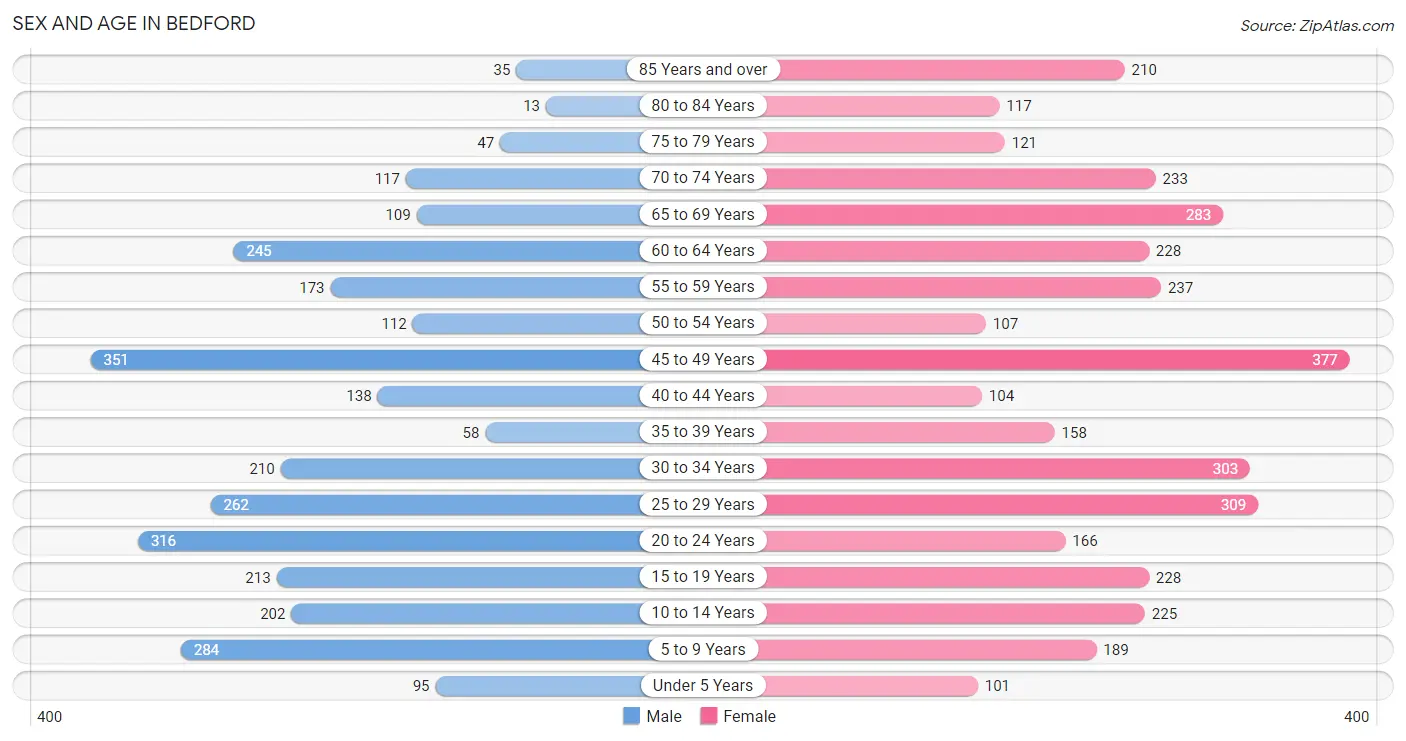
The most populous age groups in Bedford are 45 to 49 Years (351 | 11.8%) for men and 45 to 49 Years (377 | 10.2%) for women.
| Age Bracket | Male | Female |
| Under 5 Years | 95 (3.2%) | 101 (2.7%) |
| 5 to 9 Years | 284 (9.5%) | 189 (5.1%) |
| 10 to 14 Years | 202 (6.8%) | 225 (6.1%) |
| 15 to 19 Years | 213 (7.1%) | 228 (6.2%) |
| 20 to 24 Years | 316 (10.6%) | 166 (4.5%) |
| 25 to 29 Years | 262 (8.8%) | 309 (8.4%) |
| 30 to 34 Years | 210 (7.0%) | 303 (8.2%) |
| 35 to 39 Years | 58 (1.9%) | 158 (4.3%) |
| 40 to 44 Years | 138 (4.6%) | 104 (2.8%) |
| 45 to 49 Years | 351 (11.8%) | 377 (10.2%) |
| 50 to 54 Years | 112 (3.8%) | 107 (2.9%) |
| 55 to 59 Years | 173 (5.8%) | 237 (6.4%) |
| 60 to 64 Years | 245 (8.2%) | 228 (6.2%) |
| 65 to 69 Years | 109 (3.7%) | 283 (7.7%) |
| 70 to 74 Years | 117 (3.9%) | 233 (6.3%) |
| 75 to 79 Years | 47 (1.6%) | 121 (3.3%) |
| 80 to 84 Years | 13 (0.4%) | 117 (3.2%) |
| 85 Years and over | 35 (1.2%) | 210 (5.7%) |
| Total | 2,980 (100.0%) | 3,696 (100.0%) |
Families and Households in Bedford
Median Family Size in Bedford
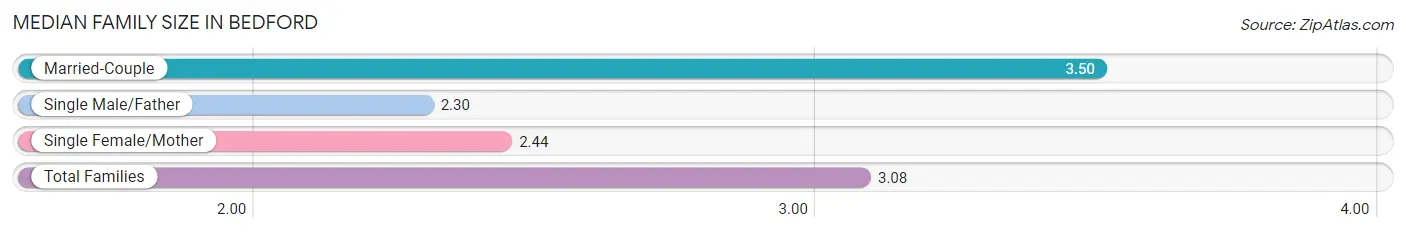
The median family size in Bedford is 3.08 persons per family, with married-couple families (978 | 62.5%) accounting for the largest median family size of 3.5 persons per family. On the other hand, single male/father families (202 | 12.9%) represent the smallest median family size with 2.30 persons per family.
| Family Type | # Families | Family Size |
| Married-Couple | 978 (62.5%) | 3.50 |
| Single Male/Father | 202 (12.9%) | 2.30 |
| Single Female/Mother | 385 (24.6%) | 2.44 |
| Total Families | 1,565 (100.0%) | 3.08 |
Median Household Size in Bedford
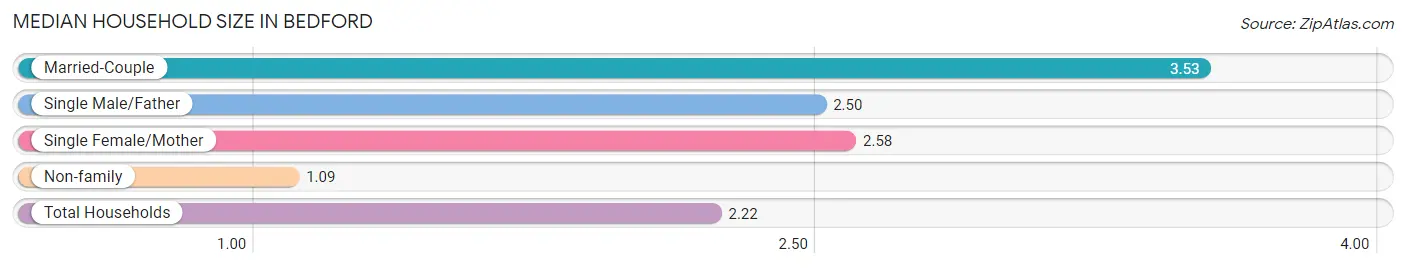
The median household size in Bedford is 2.22 persons per household, with married-couple households (978 | 34.2%) accounting for the largest median household size of 3.53 persons per household. non-family households (1,293 | 45.2%) represent the smallest median household size with 1.09 persons per household.
| Household Type | # Households | Household Size |
| Married-Couple | 978 (34.2%) | 3.53 |
| Single Male/Father | 202 (7.1%) | 2.50 |
| Single Female/Mother | 385 (13.5%) | 2.58 |
| Non-family | 1,293 (45.2%) | 1.09 |
| Total Households | 2,858 (100.0%) | 2.22 |
Household Size by Marriage Status in Bedford
Out of a total of 2,858 households in Bedford, 1,565 (54.8%) are family households, while 1,293 (45.2%) are nonfamily households. The most numerous type of family households are 2-person households, comprising 777, and the most common type of nonfamily households are 1-person households, comprising 1,182.
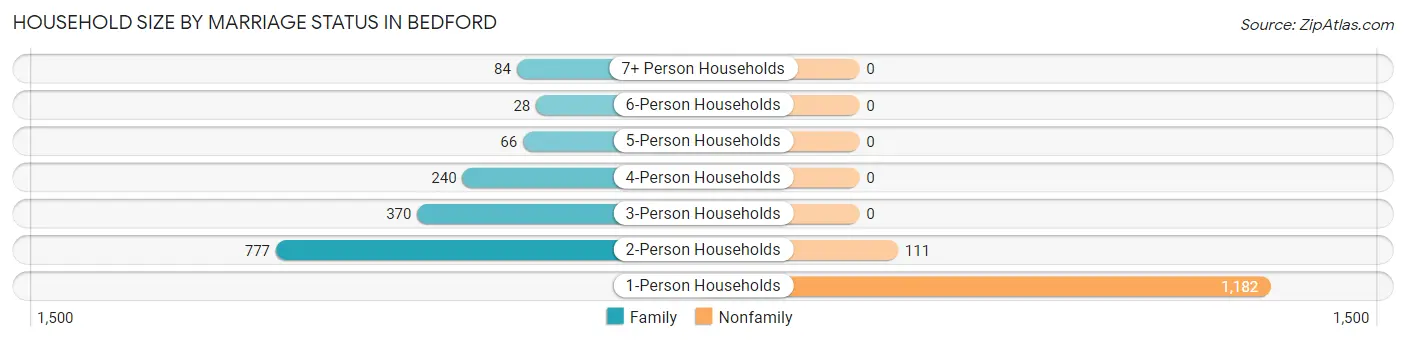
| Household Size | Family Households | Nonfamily Households |
| 1-Person Households | - | 1,182 (41.4%) |
| 2-Person Households | 777 (27.2%) | 111 (3.9%) |
| 3-Person Households | 370 (13.0%) | 0 (0.0%) |
| 4-Person Households | 240 (8.4%) | 0 (0.0%) |
| 5-Person Households | 66 (2.3%) | 0 (0.0%) |
| 6-Person Households | 28 (1.0%) | 0 (0.0%) |
| 7+ Person Households | 84 (2.9%) | 0 (0.0%) |
| Total | 1,565 (54.8%) | 1,293 (45.2%) |
Female Fertility in Bedford
Fertility by Age in Bedford
Average fertility rate in Bedford is 75.0 births per 1,000 women. Women in the age bracket of 20 to 34 years have the highest fertility rate with 134.0 births per 1,000 women. Women in the age bracket of 20 to 34 years acount for 83.2% of all women with births.
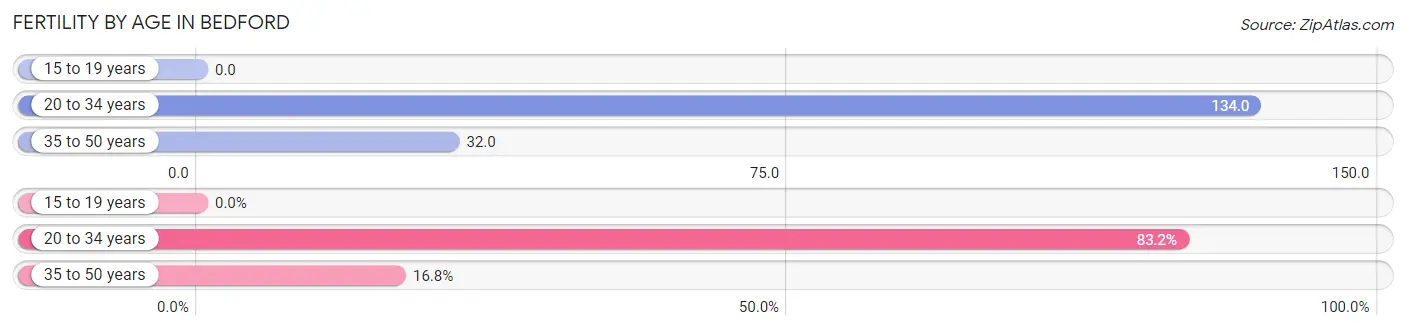
| Age Bracket | Women with Births | Births / 1,000 Women |
| 15 to 19 years | 0 (0.0%) | 0.0 |
| 20 to 34 years | 104 (83.2%) | 134.0 |
| 35 to 50 years | 21 (16.8%) | 32.0 |
| Total | 125 (100.0%) | 75.0 |
Fertility by Age by Marriage Status in Bedford
87.2% of women with births (125) in Bedford are married. The highest percentage of unmarried women with births falls into 20 to 34 years age bracket with 15.4% of them unmarried at the time of birth, while the lowest percentage of unmarried women with births belong to 35 to 50 years age bracket with 0.0% of them unmarried.
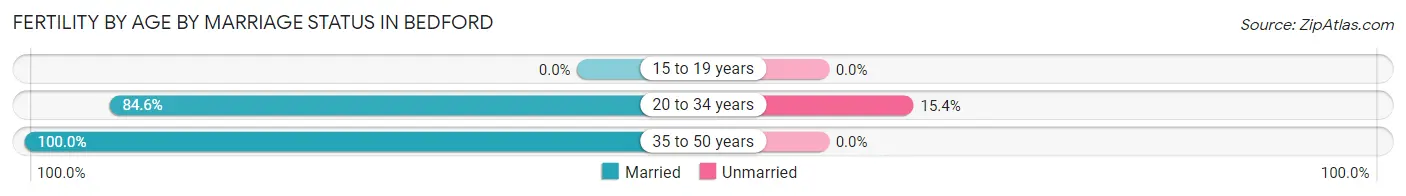
| Age Bracket | Married | Unmarried |
| 15 to 19 years | 0 (0.0%) | 0 (0.0%) |
| 20 to 34 years | 88 (84.6%) | 16 (15.4%) |
| 35 to 50 years | 21 (100.0%) | 0 (0.0%) |
| Total | 109 (87.2%) | 16 (12.8%) |
Fertility by Education in Bedford
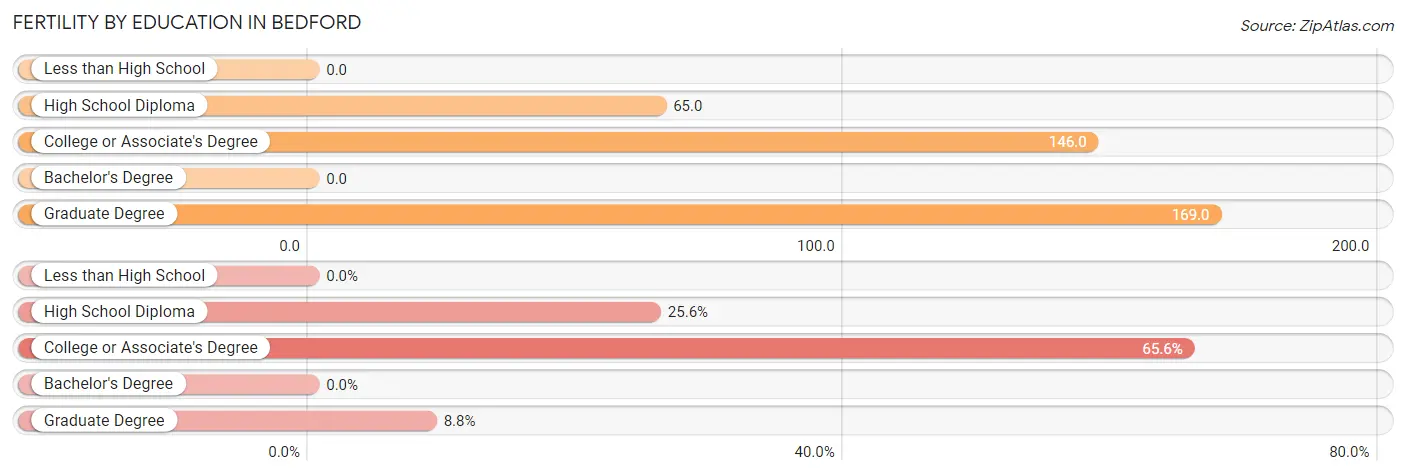
| Educational Attainment | Women with Births | Births / 1,000 Women |
| Less than High School | 0 (0.0%) | 0.0 |
| High School Diploma | 32 (25.6%) | 65.0 |
| College or Associate's Degree | 82 (65.6%) | 146.0 |
| Bachelor's Degree | 0 (0.0%) | 0.0 |
| Graduate Degree | 11 (8.8%) | 169.0 |
| Total | 125 (100.0%) | 75.0 |
Fertility by Education by Marriage Status in Bedford
12.8% of women with births in Bedford are unmarried. Women with the educational attainment of graduate degree are most likely to be married with 100.0% of them married at childbirth, while women with the educational attainment of high school diploma are least likely to be married with 21.9% of them unmarried at childbirth.
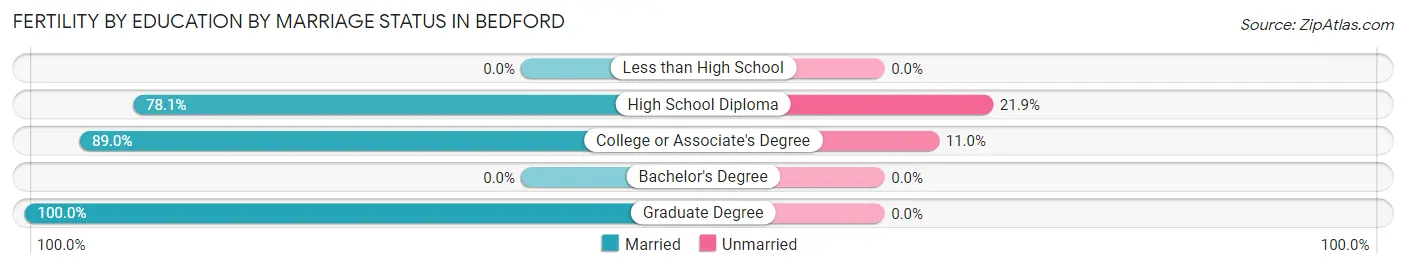
| Educational Attainment | Married | Unmarried |
| Less than High School | 0 (0.0%) | 0 (0.0%) |
| High School Diploma | 25 (78.1%) | 7 (21.9%) |
| College or Associate's Degree | 73 (89.0%) | 9 (11.0%) |
| Bachelor's Degree | 0 (0.0%) | 0 (0.0%) |
| Graduate Degree | 11 (100.0%) | 0 (0.0%) |
| Total | 109 (87.2%) | 16 (12.8%) |
Employment Characteristics in Bedford
Employment by Class of Employer in Bedford
Among the 2,970 employed individuals in Bedford, private company employees (2,008 | 67.6%), local government employees (301 | 10.1%), and self-employed (not incorporated) (230 | 7.7%) make up the most common classes of employment.
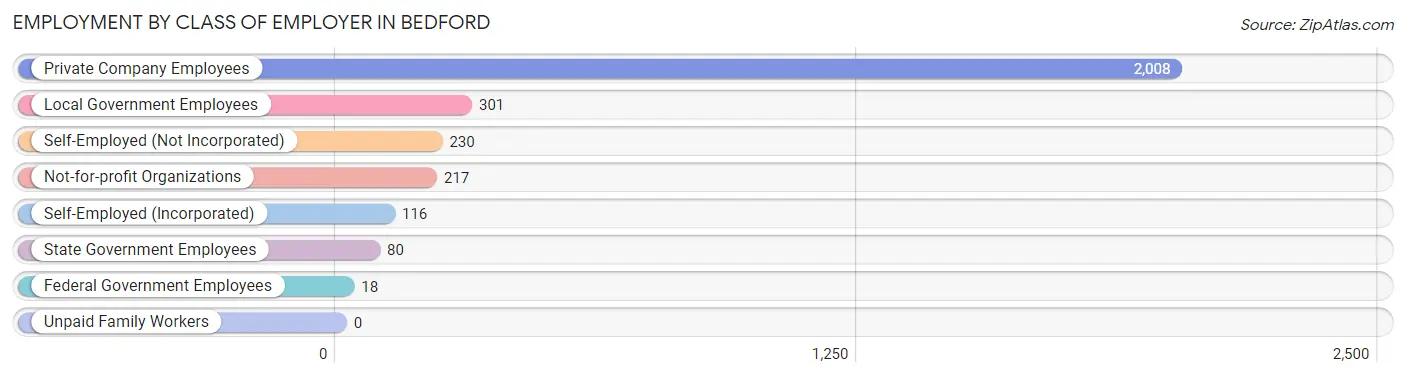
| Employer Class | # Employees | % Employees |
| Private Company Employees | 2,008 | 67.6% |
| Self-Employed (Incorporated) | 116 | 3.9% |
| Self-Employed (Not Incorporated) | 230 | 7.7% |
| Not-for-profit Organizations | 217 | 7.3% |
| Local Government Employees | 301 | 10.1% |
| State Government Employees | 80 | 2.7% |
| Federal Government Employees | 18 | 0.6% |
| Unpaid Family Workers | 0 | 0.0% |
| Total | 2,970 | 100.0% |
Employment Status by Age in Bedford
According to the labor force statistics for Bedford, out of the total population over 16 years of age (5,469), 55.7% or 3,046 individuals are in the labor force, with 2.4% or 73 of them unemployed. The age group with the highest labor force participation rate is 25 to 29 years, with 96.7% or 552 individuals in the labor force. Within the labor force, the 45 to 54 years age range has the highest percentage of unemployed individuals, with 10.1% or 62 of them being unemployed.
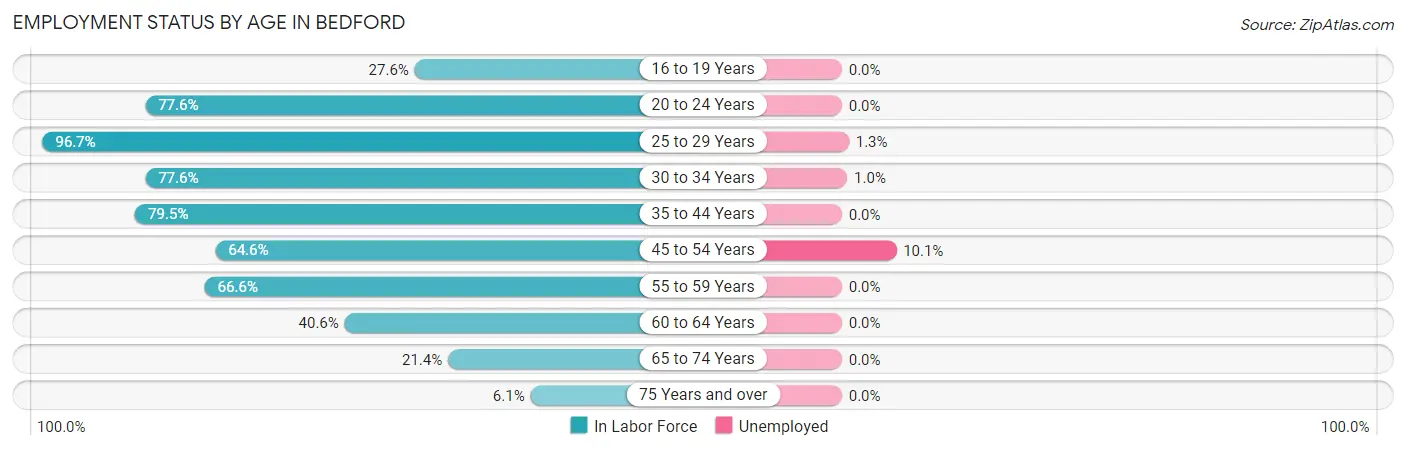
| Age Bracket | In Labor Force | Unemployed |
| 16 to 19 Years | 91 (27.6%) | 0 (0.0%) |
| 20 to 24 Years | 374 (77.6%) | 0 (0.0%) |
| 25 to 29 Years | 552 (96.7%) | 7 (1.3%) |
| 30 to 34 Years | 398 (77.6%) | 4 (1.0%) |
| 35 to 44 Years | 364 (79.5%) | 0 (0.0%) |
| 45 to 54 Years | 612 (64.6%) | 62 (10.1%) |
| 55 to 59 Years | 273 (66.6%) | 0 (0.0%) |
| 60 to 64 Years | 192 (40.6%) | 0 (0.0%) |
| 65 to 74 Years | 159 (21.4%) | 0 (0.0%) |
| 75 Years and over | 33 (6.1%) | 0 (0.0%) |
| Total | 3,046 (55.7%) | 73 (2.4%) |
Employment Status by Educational Attainment in Bedford
According to labor force statistics for Bedford, 70.9% of individuals (2,391) out of the total population between 25 and 64 years of age (3,372) are in the labor force, with 3.1% or 74 of them being unemployed. The group with the highest labor force participation rate are those with the educational attainment of college / associate degree, with 84.0% or 808 individuals in the labor force. Within the labor force, individuals with college / associate degree education have the highest percentage of unemployment, with 7.7% or 62 of them being unemployed.
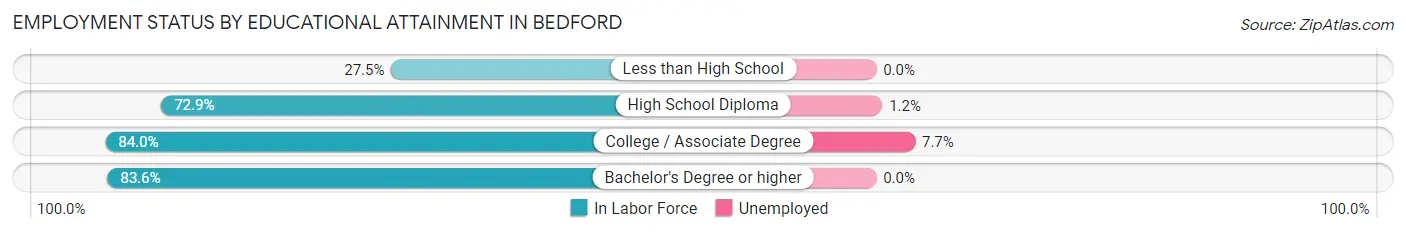
| Educational Attainment | In Labor Force | Unemployed |
| Less than High School | 147 (27.5%) | 0 (0.0%) |
| High School Diploma | 897 (72.9%) | 15 (1.2%) |
| College / Associate Degree | 808 (84.0%) | 74 (7.7%) |
| Bachelor's Degree or higher | 539 (83.6%) | 0 (0.0%) |
| Total | 2,391 (70.9%) | 105 (3.1%) |
Employment Occupations by Sex in Bedford
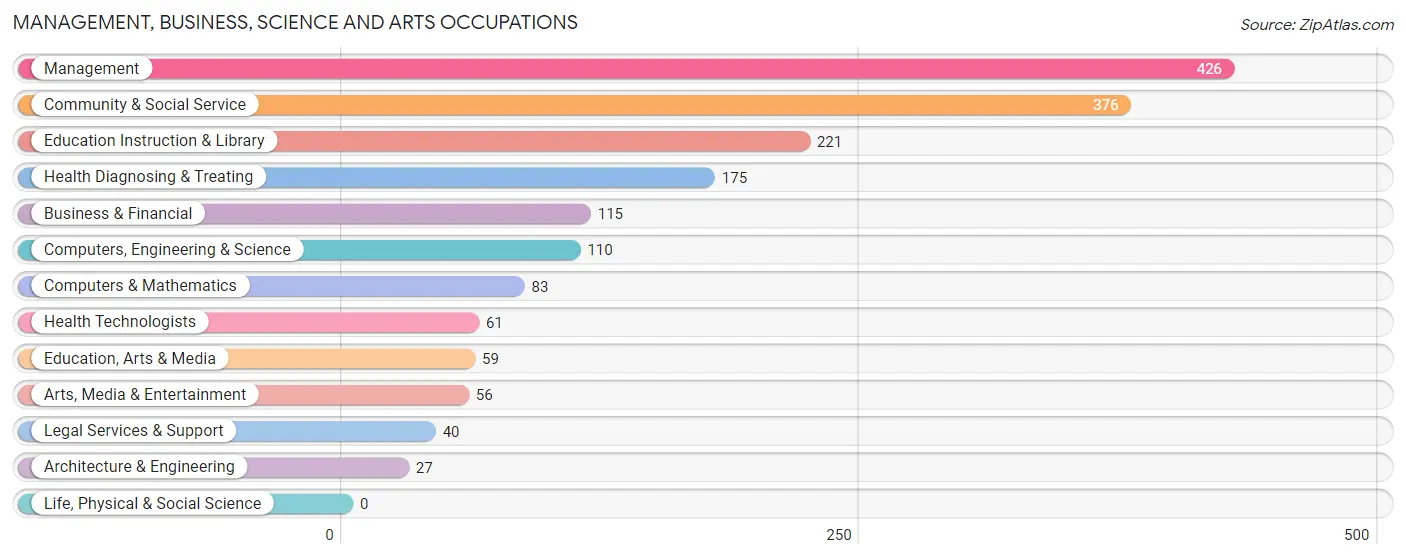
Management, Business, Science and Arts Occupations
The most common Management, Business, Science and Arts occupations in Bedford are Management (426 | 14.3%), Community & Social Service (376 | 12.6%), Education Instruction & Library (221 | 7.4%), Health Diagnosing & Treating (175 | 5.9%), and Business & Financial (115 | 3.9%).
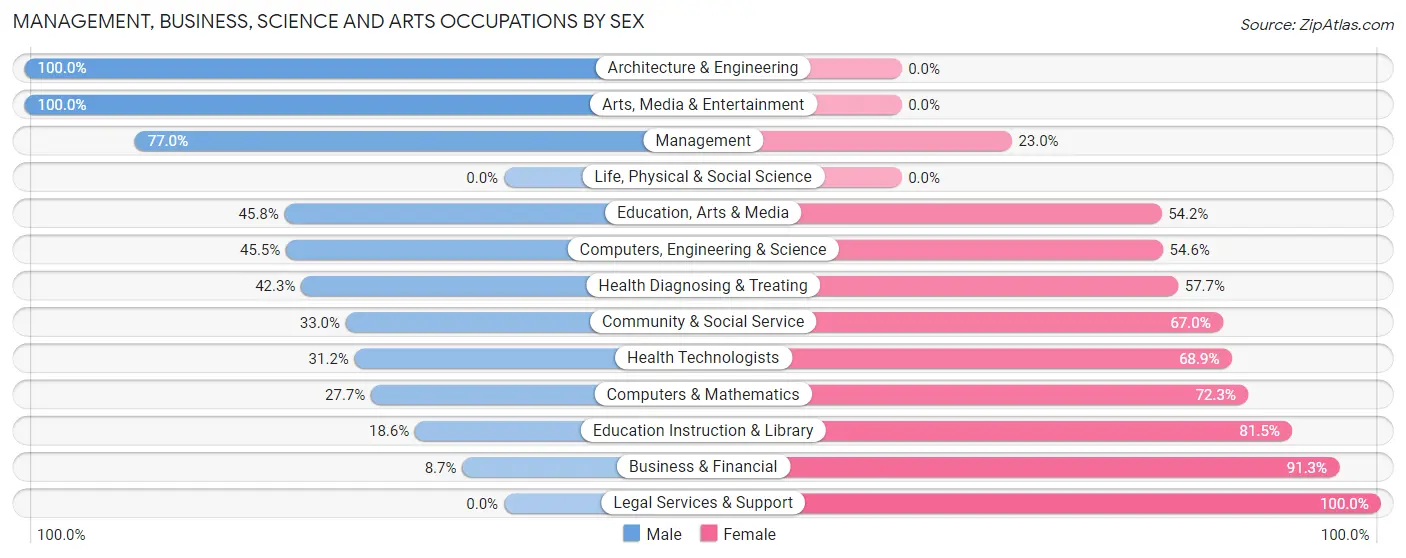
Management, Business, Science and Arts Occupations by Sex
Within the Management, Business, Science and Arts occupations in Bedford, the most male-oriented occupations are Architecture & Engineering (100.0%), Arts, Media & Entertainment (100.0%), and Management (77.0%), while the most female-oriented occupations are Legal Services & Support (100.0%), Business & Financial (91.3%), and Education Instruction & Library (81.5%).
| Occupation | Male | Female |
| Management | 328 (77.0%) | 98 (23.0%) |
| Business & Financial | 10 (8.7%) | 105 (91.3%) |
| Computers, Engineering & Science | 50 (45.5%) | 60 (54.5%) |
| Computers & Mathematics | 23 (27.7%) | 60 (72.3%) |
| Architecture & Engineering | 27 (100.0%) | 0 (0.0%) |
| Life, Physical & Social Science | 0 (0.0%) | 0 (0.0%) |
| Community & Social Service | 124 (33.0%) | 252 (67.0%) |
| Education, Arts & Media | 27 (45.8%) | 32 (54.2%) |
| Legal Services & Support | 0 (0.0%) | 40 (100.0%) |
| Education Instruction & Library | 41 (18.5%) | 180 (81.5%) |
| Arts, Media & Entertainment | 56 (100.0%) | 0 (0.0%) |
| Health Diagnosing & Treating | 74 (42.3%) | 101 (57.7%) |
| Health Technologists | 19 (31.1%) | 42 (68.9%) |
| Total (Category) | 586 (48.7%) | 616 (51.2%) |
| Total (Overall) | 1,522 (51.2%) | 1,453 (48.8%) |
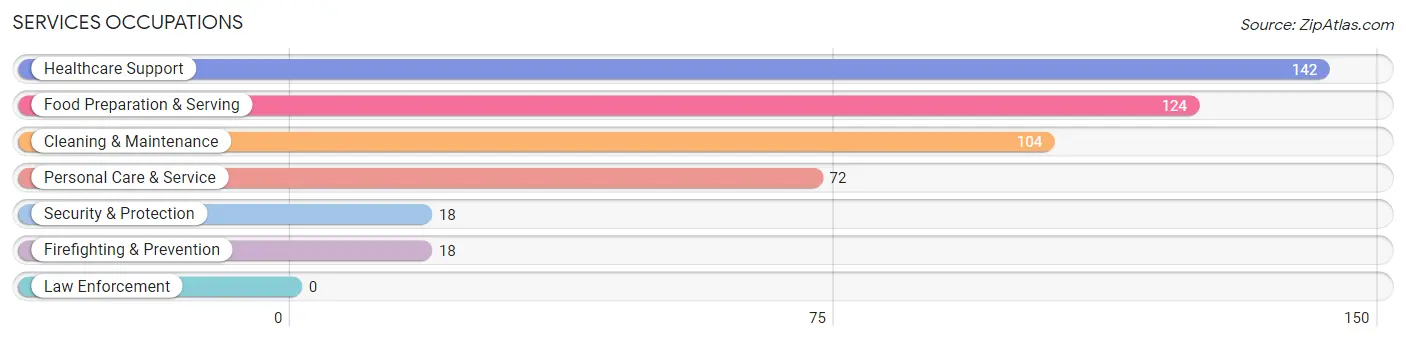
Services Occupations
The most common Services occupations in Bedford are Healthcare Support (142 | 4.8%), Food Preparation & Serving (124 | 4.2%), Cleaning & Maintenance (104 | 3.5%), Personal Care & Service (72 | 2.4%), and Security & Protection (18 | 0.6%).
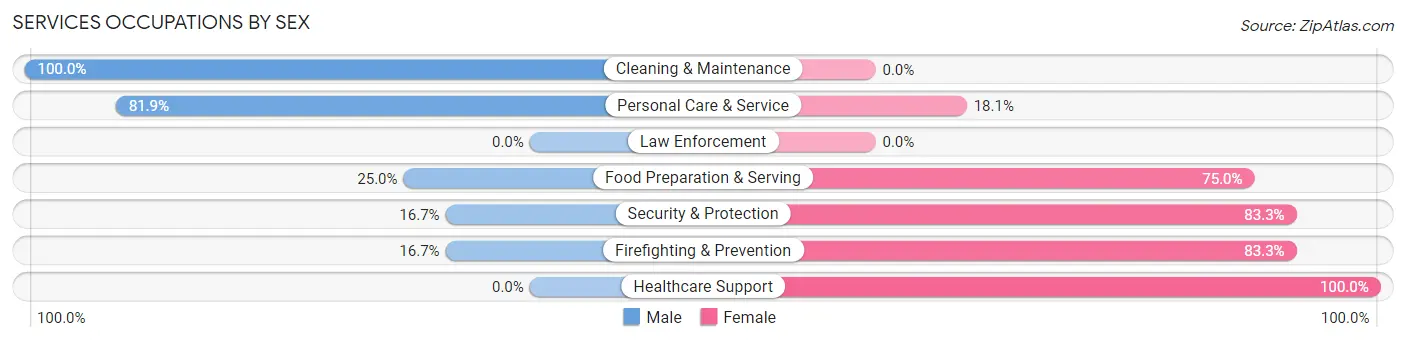
Services Occupations by Sex
Within the Services occupations in Bedford, the most male-oriented occupations are Cleaning & Maintenance (100.0%), Personal Care & Service (81.9%), and Food Preparation & Serving (25.0%), while the most female-oriented occupations are Healthcare Support (100.0%), Security & Protection (83.3%), and Firefighting & Prevention (83.3%).
| Occupation | Male | Female |
| Healthcare Support | 0 (0.0%) | 142 (100.0%) |
| Security & Protection | 3 (16.7%) | 15 (83.3%) |
| Firefighting & Prevention | 3 (16.7%) | 15 (83.3%) |
| Law Enforcement | 0 (0.0%) | 0 (0.0%) |
| Food Preparation & Serving | 31 (25.0%) | 93 (75.0%) |
| Cleaning & Maintenance | 104 (100.0%) | 0 (0.0%) |
| Personal Care & Service | 59 (81.9%) | 13 (18.1%) |
| Total (Category) | 197 (42.8%) | 263 (57.2%) |
| Total (Overall) | 1,522 (51.2%) | 1,453 (48.8%) |
Sales and Office Occupations
The most common Sales and Office occupations in Bedford are Office & Administration (366 | 12.3%), and Sales & Related (323 | 10.9%).

Sales and Office Occupations by Sex

| Occupation | Male | Female |
| Sales & Related | 158 (48.9%) | 165 (51.1%) |
| Office & Administration | 35 (9.6%) | 331 (90.4%) |
| Total (Category) | 193 (28.0%) | 496 (72.0%) |
| Total (Overall) | 1,522 (51.2%) | 1,453 (48.8%) |
Natural Resources, Construction and Maintenance Occupations
The most common Natural Resources, Construction and Maintenance occupations in Bedford are Construction & Extraction (156 | 5.2%), and Installation, Maintenance & Repair (142 | 4.8%).

Natural Resources, Construction and Maintenance Occupations by Sex

| Occupation | Male | Female |
| Farming, Fishing & Forestry | 0 (0.0%) | 0 (0.0%) |
| Construction & Extraction | 156 (100.0%) | 0 (0.0%) |
| Installation, Maintenance & Repair | 142 (100.0%) | 0 (0.0%) |
| Total (Category) | 298 (100.0%) | 0 (0.0%) |
| Total (Overall) | 1,522 (51.2%) | 1,453 (48.8%) |
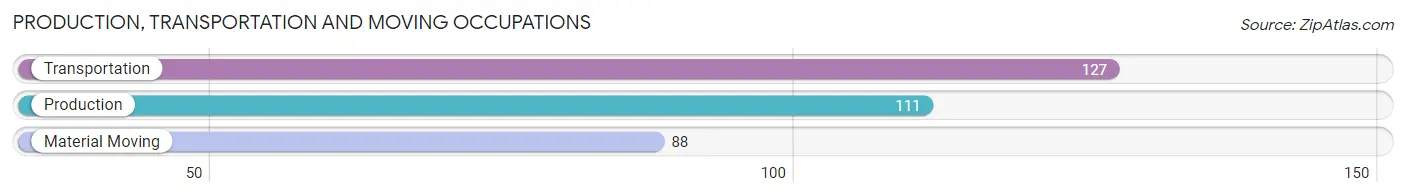
Production, Transportation and Moving Occupations
The most common Production, Transportation and Moving occupations in Bedford are Transportation (127 | 4.3%), Production (111 | 3.7%), and Material Moving (88 | 3.0%).
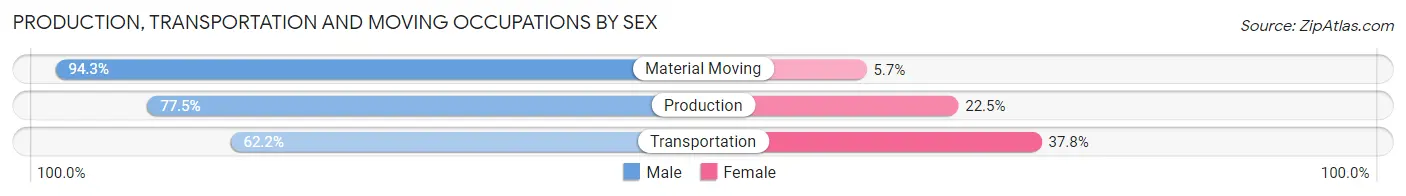
Production, Transportation and Moving Occupations by Sex
| Occupation | Male | Female |
| Production | 86 (77.5%) | 25 (22.5%) |
| Transportation | 79 (62.2%) | 48 (37.8%) |
| Material Moving | 83 (94.3%) | 5 (5.7%) |
| Total (Category) | 248 (76.1%) | 78 (23.9%) |
| Total (Overall) | 1,522 (51.2%) | 1,453 (48.8%) |
Employment Industries by Sex in Bedford
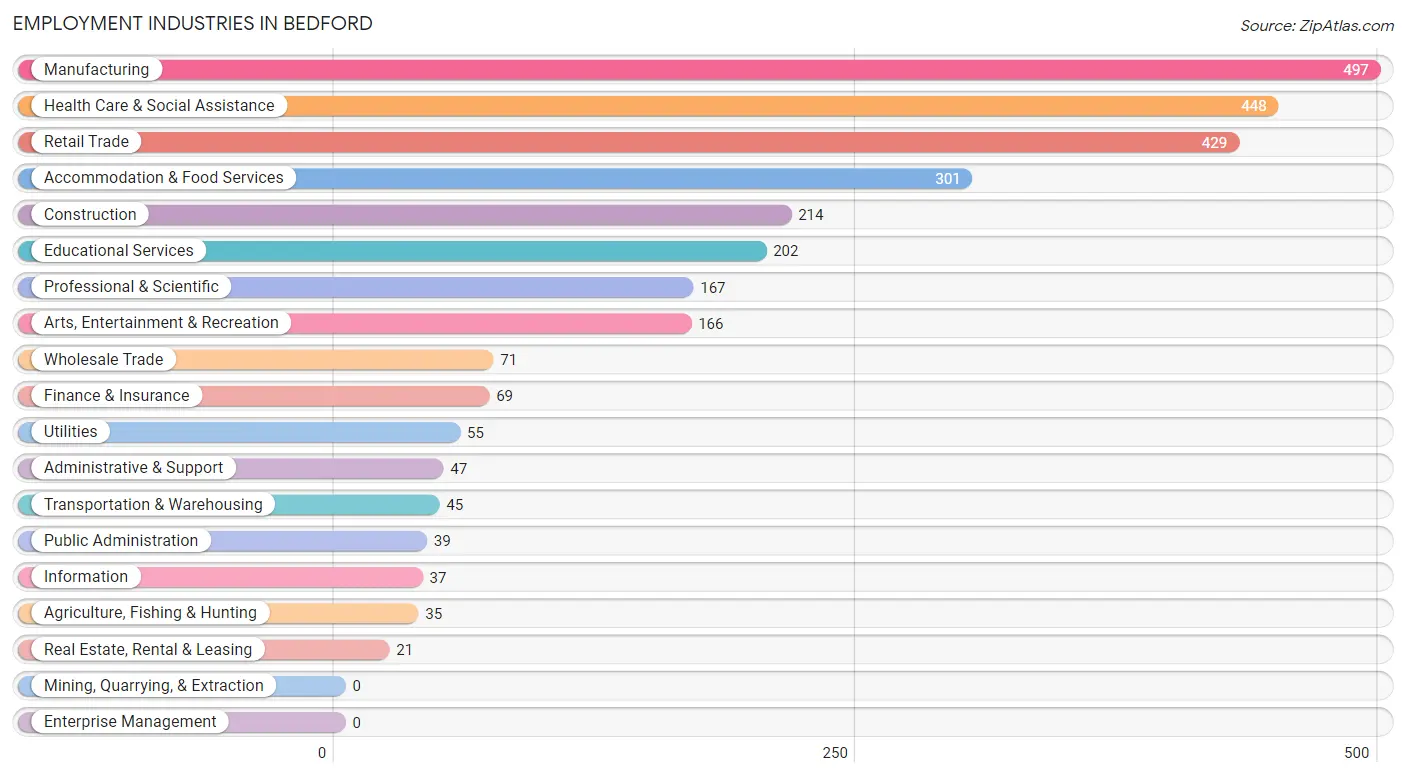
Employment Industries in Bedford
The major employment industries in Bedford include Manufacturing (497 | 16.7%), Health Care & Social Assistance (448 | 15.1%), Retail Trade (429 | 14.4%), Accommodation & Food Services (301 | 10.1%), and Construction (214 | 7.2%).
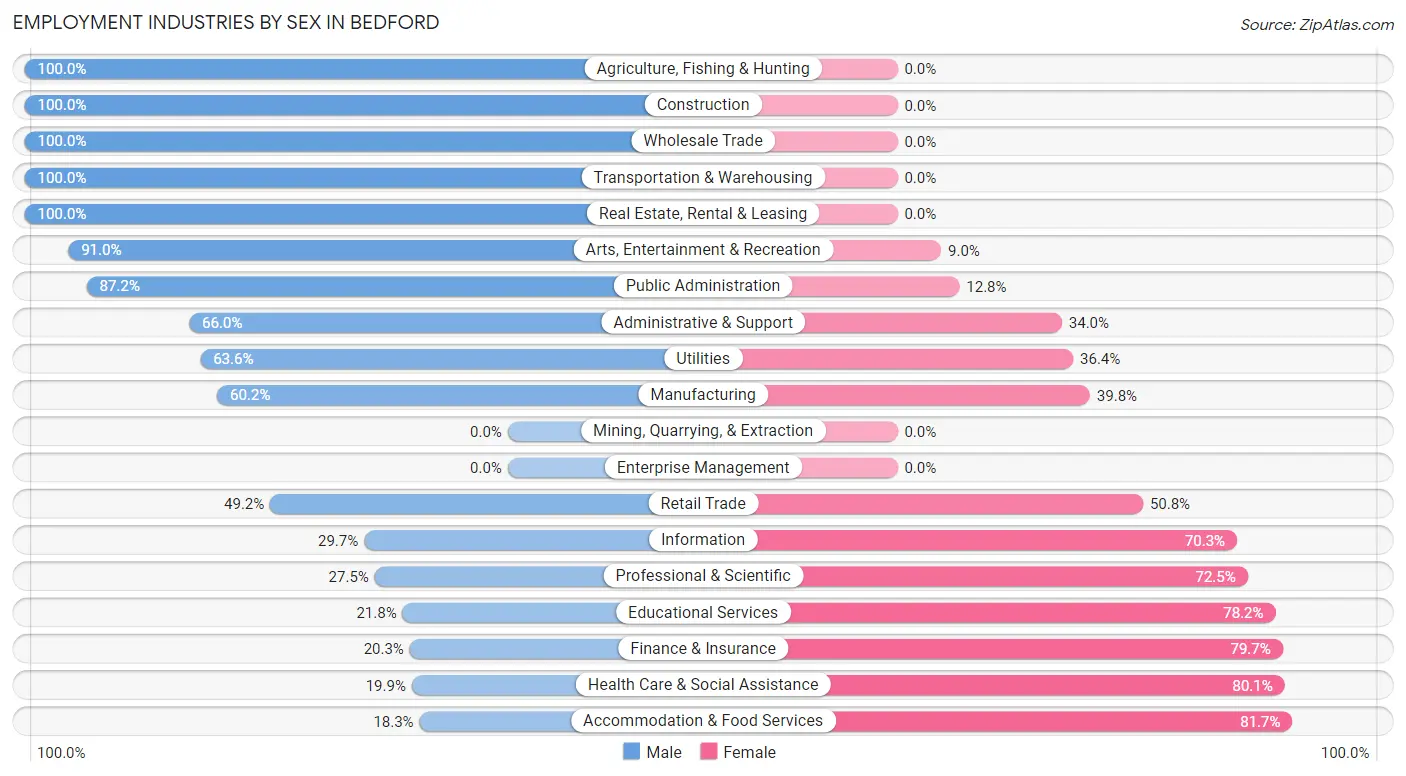
Employment Industries by Sex in Bedford
The Bedford industries that see more men than women are Agriculture, Fishing & Hunting (100.0%), Construction (100.0%), and Wholesale Trade (100.0%), whereas the industries that tend to have a higher number of women are Accommodation & Food Services (81.7%), Health Care & Social Assistance (80.1%), and Finance & Insurance (79.7%).
| Industry | Male | Female |
| Agriculture, Fishing & Hunting | 35 (100.0%) | 0 (0.0%) |
| Mining, Quarrying, & Extraction | 0 (0.0%) | 0 (0.0%) |
| Construction | 214 (100.0%) | 0 (0.0%) |
| Manufacturing | 299 (60.2%) | 198 (39.8%) |
| Wholesale Trade | 71 (100.0%) | 0 (0.0%) |
| Retail Trade | 211 (49.2%) | 218 (50.8%) |
| Transportation & Warehousing | 45 (100.0%) | 0 (0.0%) |
| Utilities | 35 (63.6%) | 20 (36.4%) |
| Information | 11 (29.7%) | 26 (70.3%) |
| Finance & Insurance | 14 (20.3%) | 55 (79.7%) |
| Real Estate, Rental & Leasing | 21 (100.0%) | 0 (0.0%) |
| Professional & Scientific | 46 (27.5%) | 121 (72.5%) |
| Enterprise Management | 0 (0.0%) | 0 (0.0%) |
| Administrative & Support | 31 (66.0%) | 16 (34.0%) |
| Educational Services | 44 (21.8%) | 158 (78.2%) |
| Health Care & Social Assistance | 89 (19.9%) | 359 (80.1%) |
| Arts, Entertainment & Recreation | 151 (91.0%) | 15 (9.0%) |
| Accommodation & Food Services | 55 (18.3%) | 246 (81.7%) |
| Public Administration | 34 (87.2%) | 5 (12.8%) |
| Total | 1,522 (51.2%) | 1,453 (48.8%) |
Education in Bedford
School Enrollment in Bedford
The most common levels of schooling among the 1,525 students in Bedford are elementary school (448 | 29.4%), high school (375 | 24.6%), and middle school (255 | 16.7%).
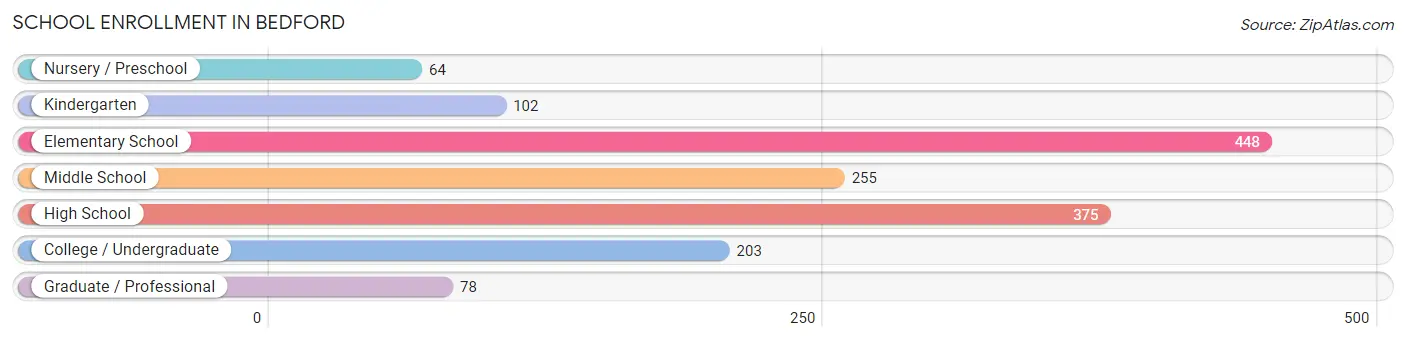
| School Level | # Students | % Students |
| Nursery / Preschool | 64 | 4.2% |
| Kindergarten | 102 | 6.7% |
| Elementary School | 448 | 29.4% |
| Middle School | 255 | 16.7% |
| High School | 375 | 24.6% |
| College / Undergraduate | 203 | 13.3% |
| Graduate / Professional | 78 | 5.1% |
| Total | 1,525 | 100.0% |
School Enrollment by Age by Funding Source in Bedford
Out of a total of 1,525 students who are enrolled in schools in Bedford, 317 (20.8%) attend a private institution, while the remaining 1,208 (79.2%) are enrolled in public schools. The age group of 35 years and over has the highest likelihood of being enrolled in private schools, with 26 (100.0% in the age bracket) enrolled. Conversely, the age group of 20 to 24 year olds has the lowest likelihood of being enrolled in a private school, with 94 (100.0% in the age bracket) attending a public institution.
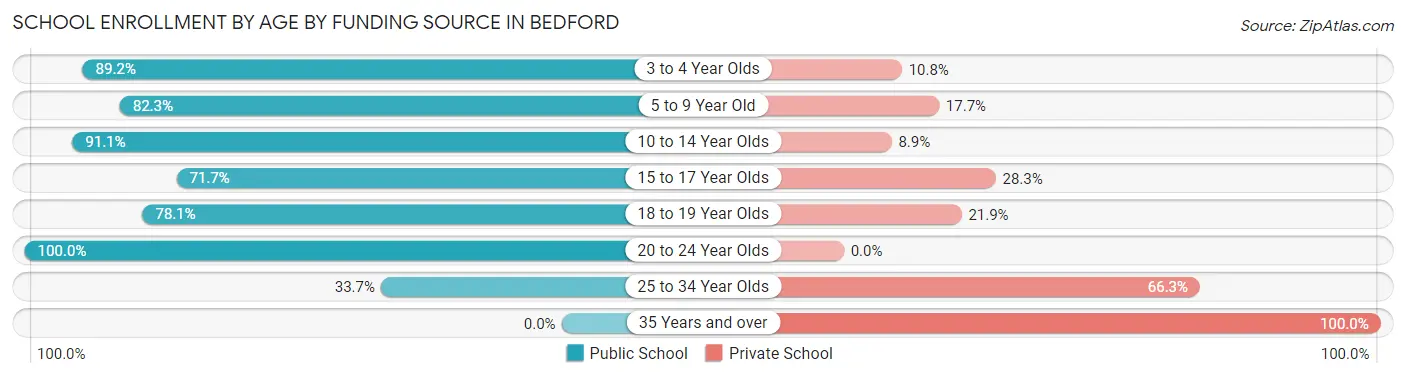
| Age Bracket | Public School | Private School |
| 3 to 4 Year Olds | 33 (89.2%) | 4 (10.8%) |
| 5 to 9 Year Old | 357 (82.3%) | 77 (17.7%) |
| 10 to 14 Year Olds | 389 (91.1%) | 38 (8.9%) |
| 15 to 17 Year Olds | 180 (71.7%) | 71 (28.3%) |
| 18 to 19 Year Olds | 121 (78.1%) | 34 (21.9%) |
| 20 to 24 Year Olds | 94 (100.0%) | 0 (0.0%) |
| 25 to 34 Year Olds | 34 (33.7%) | 67 (66.3%) |
| 35 Years and over | 0 (0.0%) | 26 (100.0%) |
| Total | 1,208 (79.2%) | 317 (20.8%) |
Educational Attainment by Field of Study in Bedford
Education (186 | 19.2%), liberal arts & history (100 | 10.3%), bio, nature & agricultural (92 | 9.5%), computers & mathematics (91 | 9.4%), and social sciences (81 | 8.4%) are the most common fields of study among 968 individuals in Bedford who have obtained a bachelor's degree or higher.
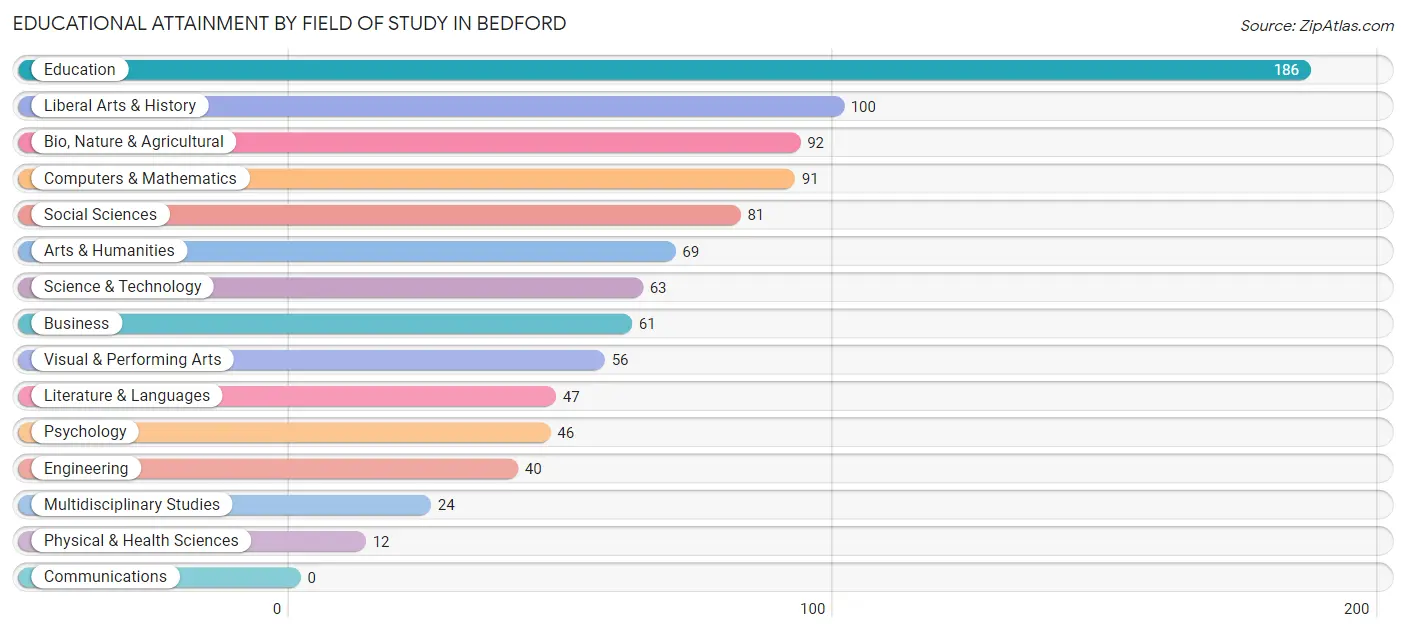
| Field of Study | # Graduates | % Graduates |
| Computers & Mathematics | 91 | 9.4% |
| Bio, Nature & Agricultural | 92 | 9.5% |
| Physical & Health Sciences | 12 | 1.2% |
| Psychology | 46 | 4.8% |
| Social Sciences | 81 | 8.4% |
| Engineering | 40 | 4.1% |
| Multidisciplinary Studies | 24 | 2.5% |
| Science & Technology | 63 | 6.5% |
| Business | 61 | 6.3% |
| Education | 186 | 19.2% |
| Literature & Languages | 47 | 4.9% |
| Liberal Arts & History | 100 | 10.3% |
| Visual & Performing Arts | 56 | 5.8% |
| Communications | 0 | 0.0% |
| Arts & Humanities | 69 | 7.1% |
| Total | 968 | 100.0% |
Transportation & Commute in Bedford
Vehicle Availability by Sex in Bedford
The most prevalent vehicle ownership categories in Bedford are males with 3 vehicles (484, accounting for 31.8%) and females with 3 vehicles (332, making up 33.4%).
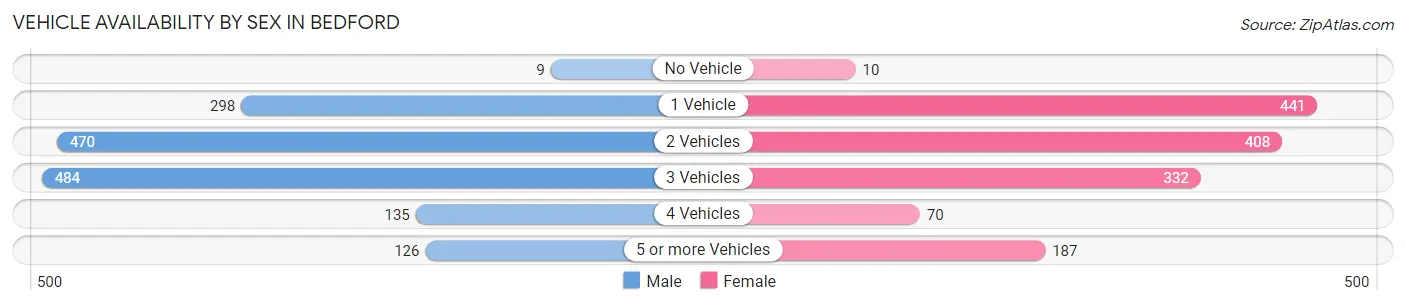
| Vehicles Available | Male | Female |
| No Vehicle | 9 (0.6%) | 10 (0.7%) |
| 1 Vehicle | 298 (19.6%) | 441 (30.5%) |
| 2 Vehicles | 470 (30.9%) | 408 (28.2%) |
| 3 Vehicles | 484 (31.8%) | 332 (22.9%) |
| 4 Vehicles | 135 (8.9%) | 70 (4.8%) |
| 5 or more Vehicles | 126 (8.3%) | 187 (12.9%) |
| Total | 1,522 (100.0%) | 1,448 (100.0%) |
Commute Time in Bedford
The most frequently occuring commute durations in Bedford are 5 to 9 minutes (637 commuters, 22.5%), 30 to 34 minutes (559 commuters, 19.8%), and 10 to 14 minutes (309 commuters, 10.9%).
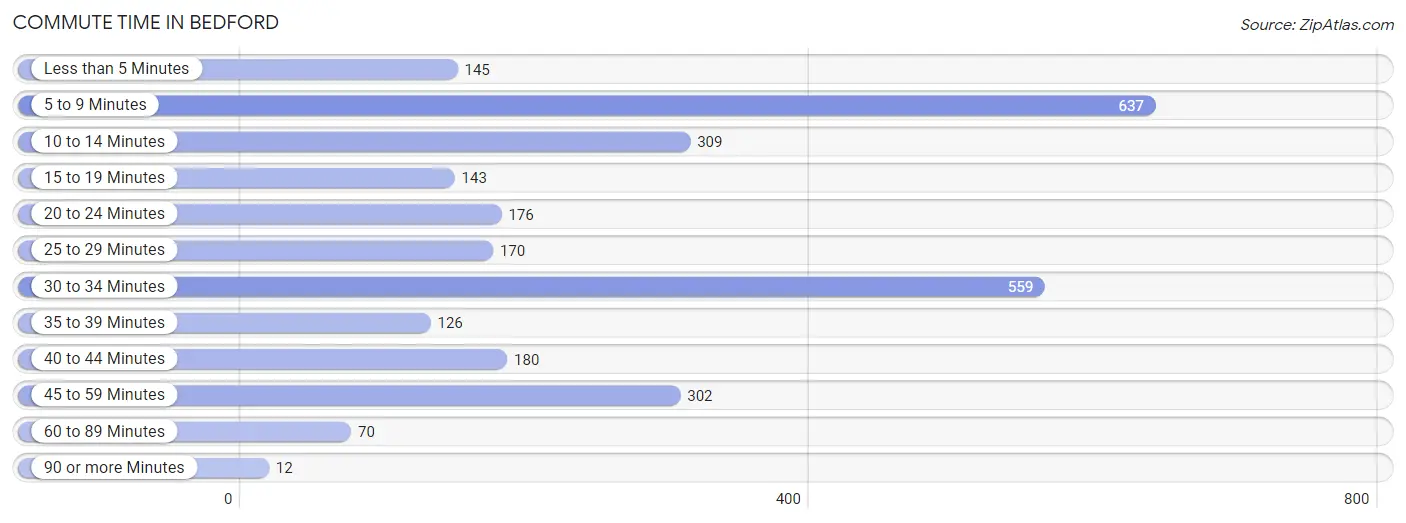
| Commute Time | # Commuters | % Commuters |
| Less than 5 Minutes | 145 | 5.1% |
| 5 to 9 Minutes | 637 | 22.5% |
| 10 to 14 Minutes | 309 | 10.9% |
| 15 to 19 Minutes | 143 | 5.1% |
| 20 to 24 Minutes | 176 | 6.2% |
| 25 to 29 Minutes | 170 | 6.0% |
| 30 to 34 Minutes | 559 | 19.8% |
| 35 to 39 Minutes | 126 | 4.4% |
| 40 to 44 Minutes | 180 | 6.4% |
| 45 to 59 Minutes | 302 | 10.7% |
| 60 to 89 Minutes | 70 | 2.5% |
| 90 or more Minutes | 12 | 0.4% |
Commute Time by Sex in Bedford
The most common commute times in Bedford are 30 to 34 minutes (423 commuters, 28.9%) for males and 5 to 9 minutes (341 commuters, 25.0%) for females.
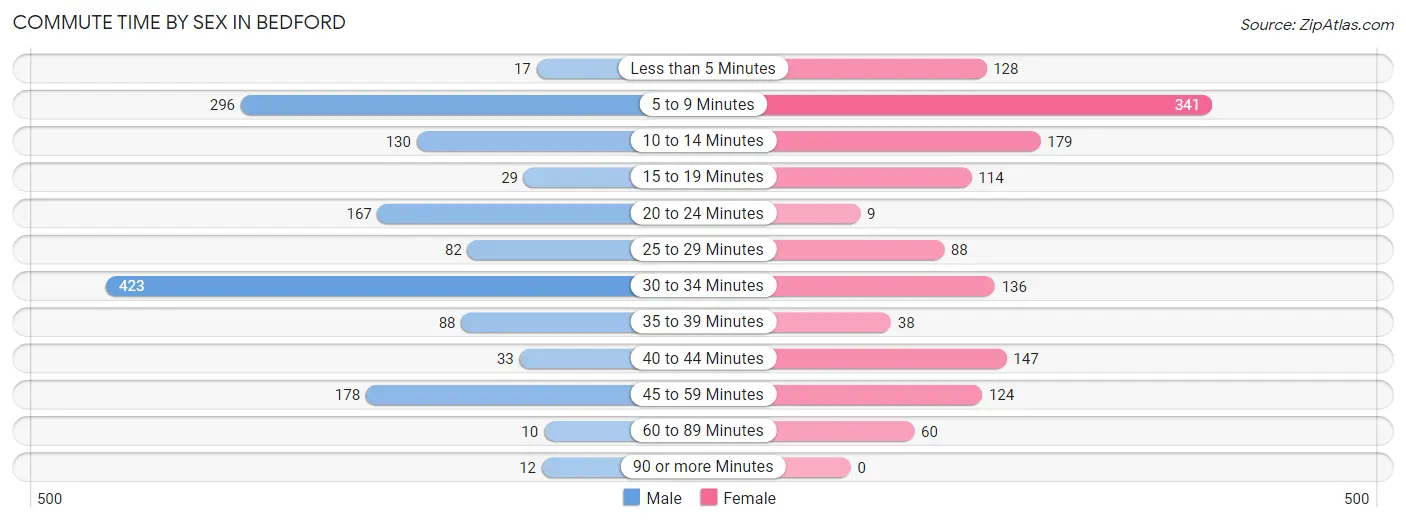
| Commute Time | Male | Female |
| Less than 5 Minutes | 17 (1.2%) | 128 (9.4%) |
| 5 to 9 Minutes | 296 (20.2%) | 341 (25.0%) |
| 10 to 14 Minutes | 130 (8.9%) | 179 (13.1%) |
| 15 to 19 Minutes | 29 (2.0%) | 114 (8.4%) |
| 20 to 24 Minutes | 167 (11.4%) | 9 (0.7%) |
| 25 to 29 Minutes | 82 (5.6%) | 88 (6.5%) |
| 30 to 34 Minutes | 423 (28.9%) | 136 (10.0%) |
| 35 to 39 Minutes | 88 (6.0%) | 38 (2.8%) |
| 40 to 44 Minutes | 33 (2.2%) | 147 (10.8%) |
| 45 to 59 Minutes | 178 (12.1%) | 124 (9.1%) |
| 60 to 89 Minutes | 10 (0.7%) | 60 (4.4%) |
| 90 or more Minutes | 12 (0.8%) | 0 (0.0%) |
Time of Departure to Work by Sex in Bedford
The most frequent times of departure to work in Bedford are 7:00 AM to 7:29 AM (332, 22.7%) for males and 7:30 AM to 7:59 AM (251, 18.4%) for females.
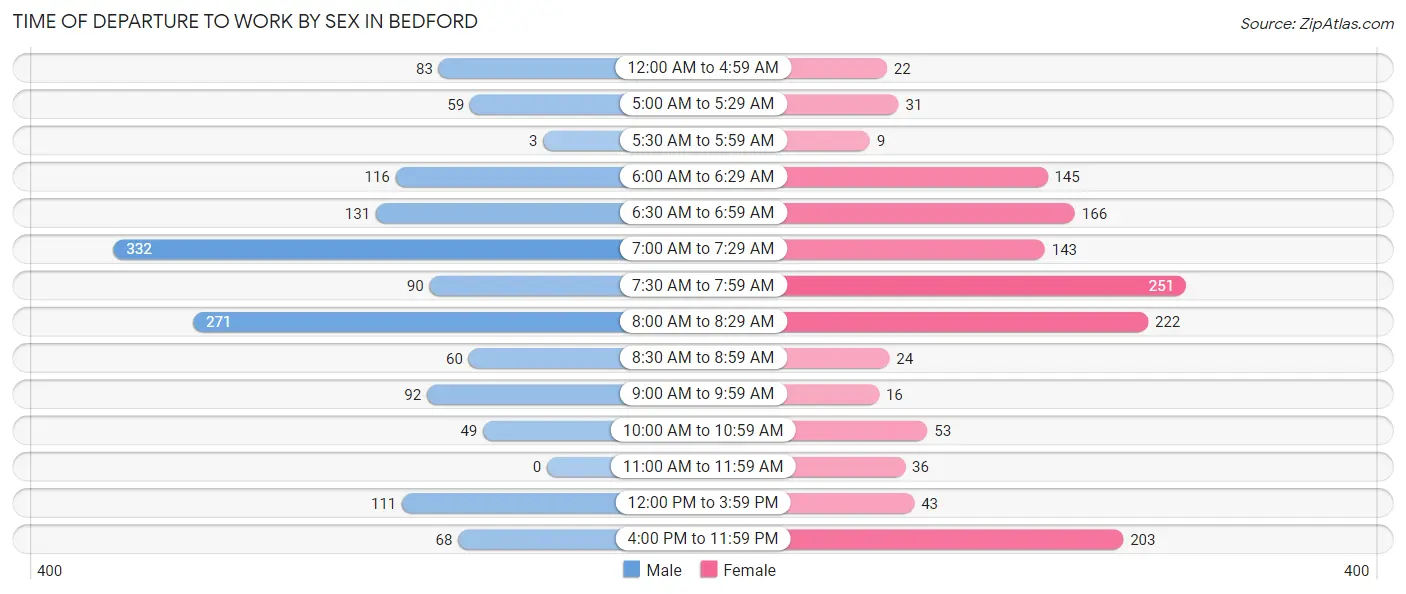
| Time of Departure | Male | Female |
| 12:00 AM to 4:59 AM | 83 (5.7%) | 22 (1.6%) |
| 5:00 AM to 5:29 AM | 59 (4.0%) | 31 (2.3%) |
| 5:30 AM to 5:59 AM | 3 (0.2%) | 9 (0.7%) |
| 6:00 AM to 6:29 AM | 116 (7.9%) | 145 (10.6%) |
| 6:30 AM to 6:59 AM | 131 (8.9%) | 166 (12.2%) |
| 7:00 AM to 7:29 AM | 332 (22.7%) | 143 (10.5%) |
| 7:30 AM to 7:59 AM | 90 (6.1%) | 251 (18.4%) |
| 8:00 AM to 8:29 AM | 271 (18.5%) | 222 (16.3%) |
| 8:30 AM to 8:59 AM | 60 (4.1%) | 24 (1.8%) |
| 9:00 AM to 9:59 AM | 92 (6.3%) | 16 (1.2%) |
| 10:00 AM to 10:59 AM | 49 (3.3%) | 53 (3.9%) |
| 11:00 AM to 11:59 AM | 0 (0.0%) | 36 (2.6%) |
| 12:00 PM to 3:59 PM | 111 (7.6%) | 43 (3.2%) |
| 4:00 PM to 11:59 PM | 68 (4.6%) | 203 (14.9%) |
| Total | 1,465 (100.0%) | 1,364 (100.0%) |
Housing Occupancy in Bedford
Occupancy by Ownership in Bedford
Of the total 2,858 dwellings in Bedford, owner-occupied units account for 1,454 (50.9%), while renter-occupied units make up 1,404 (49.1%).
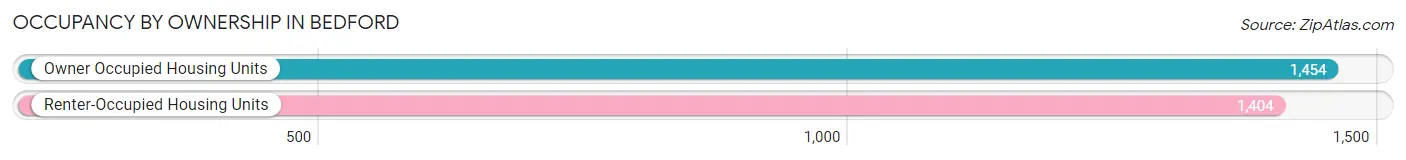
| Occupancy | # Housing Units | % Housing Units |
| Owner Occupied Housing Units | 1,454 | 50.9% |
| Renter-Occupied Housing Units | 1,404 | 49.1% |
| Total Occupied Housing Units | 2,858 | 100.0% |
Occupancy by Household Size in Bedford
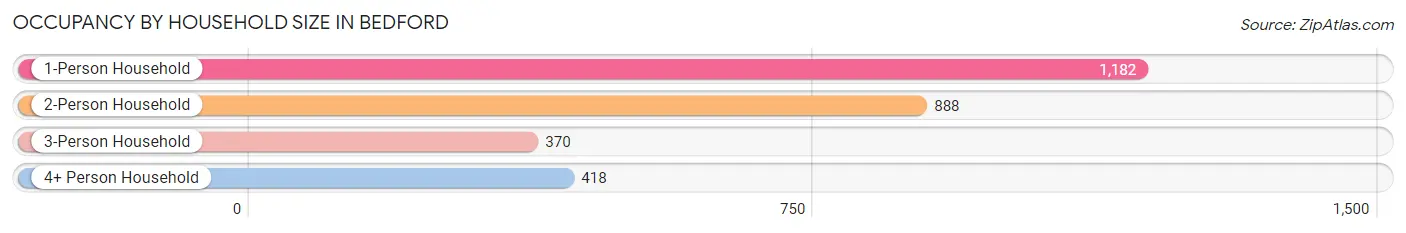
| Household Size | # Housing Units | % Housing Units |
| 1-Person Household | 1,182 | 41.4% |
| 2-Person Household | 888 | 31.1% |
| 3-Person Household | 370 | 13.0% |
| 4+ Person Household | 418 | 14.6% |
| Total Housing Units | 2,858 | 100.0% |
Occupancy by Ownership by Household Size in Bedford
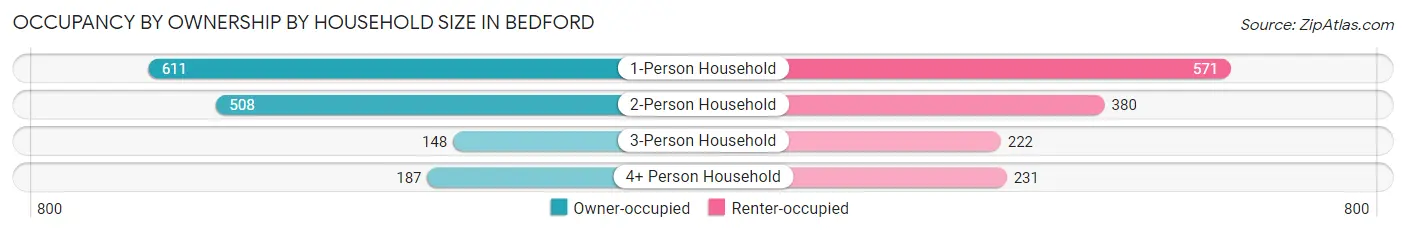
| Household Size | Owner-occupied | Renter-occupied |
| 1-Person Household | 611 (51.7%) | 571 (48.3%) |
| 2-Person Household | 508 (57.2%) | 380 (42.8%) |
| 3-Person Household | 148 (40.0%) | 222 (60.0%) |
| 4+ Person Household | 187 (44.7%) | 231 (55.3%) |
| Total Housing Units | 1,454 (50.9%) | 1,404 (49.1%) |
Occupancy by Educational Attainment in Bedford
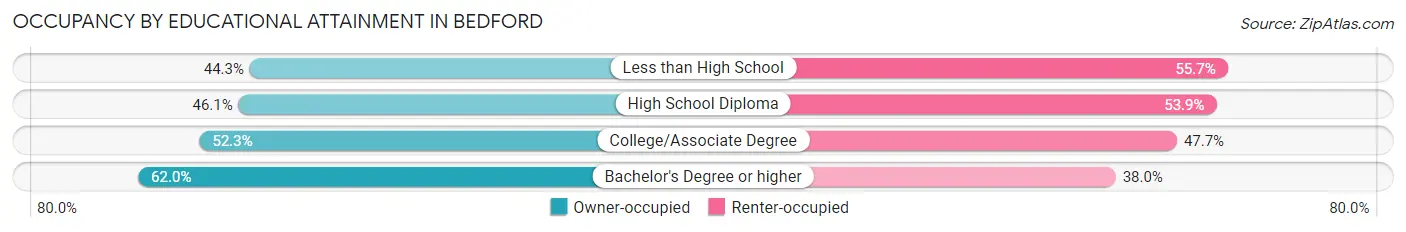
| Household Size | Owner-occupied | Renter-occupied |
| Less than High School | 213 (44.3%) | 268 (55.7%) |
| High School Diploma | 415 (46.1%) | 486 (53.9%) |
| College/Associate Degree | 480 (52.3%) | 438 (47.7%) |
| Bachelor's Degree or higher | 346 (62.0%) | 212 (38.0%) |
Occupancy by Age of Householder in Bedford
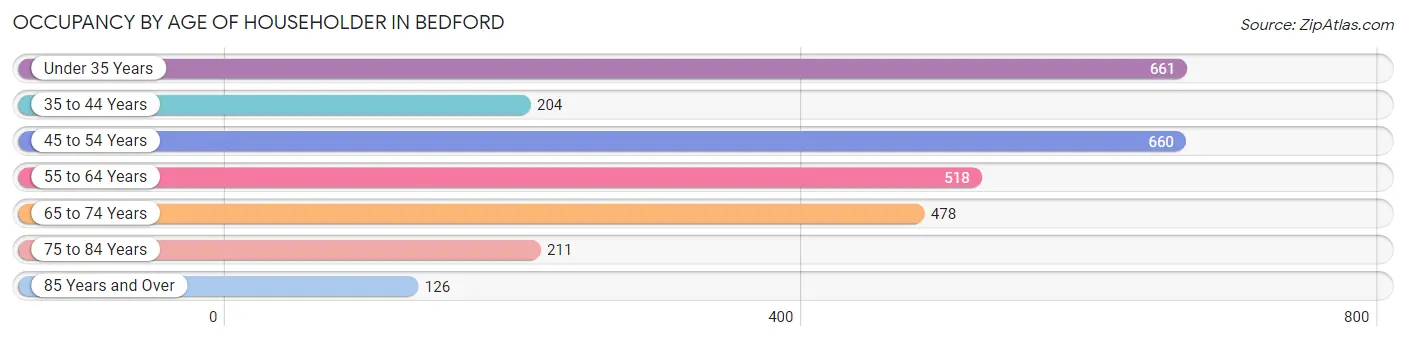
| Age Bracket | # Households | % Households |
| Under 35 Years | 661 | 23.1% |
| 35 to 44 Years | 204 | 7.1% |
| 45 to 54 Years | 660 | 23.1% |
| 55 to 64 Years | 518 | 18.1% |
| 65 to 74 Years | 478 | 16.7% |
| 75 to 84 Years | 211 | 7.4% |
| 85 Years and Over | 126 | 4.4% |
| Total | 2,858 | 100.0% |
Housing Finances in Bedford
Median Income by Occupancy in Bedford
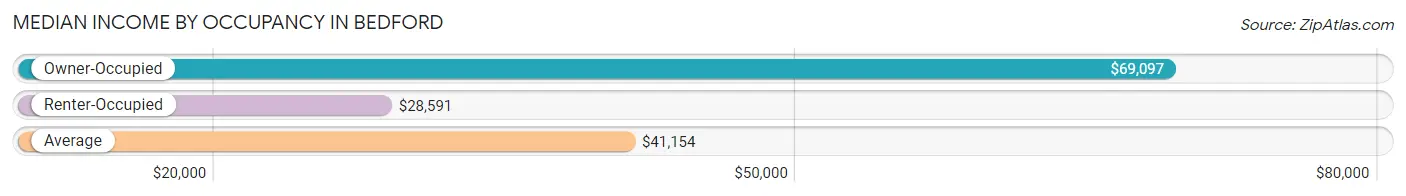
| Occupancy Type | # Households | Median Income |
| Owner-Occupied | 1,454 (50.9%) | $69,097 |
| Renter-Occupied | 1,404 (49.1%) | $28,591 |
| Average | 2,858 (100.0%) | $41,154 |
Occupancy by Householder Income Bracket in Bedford
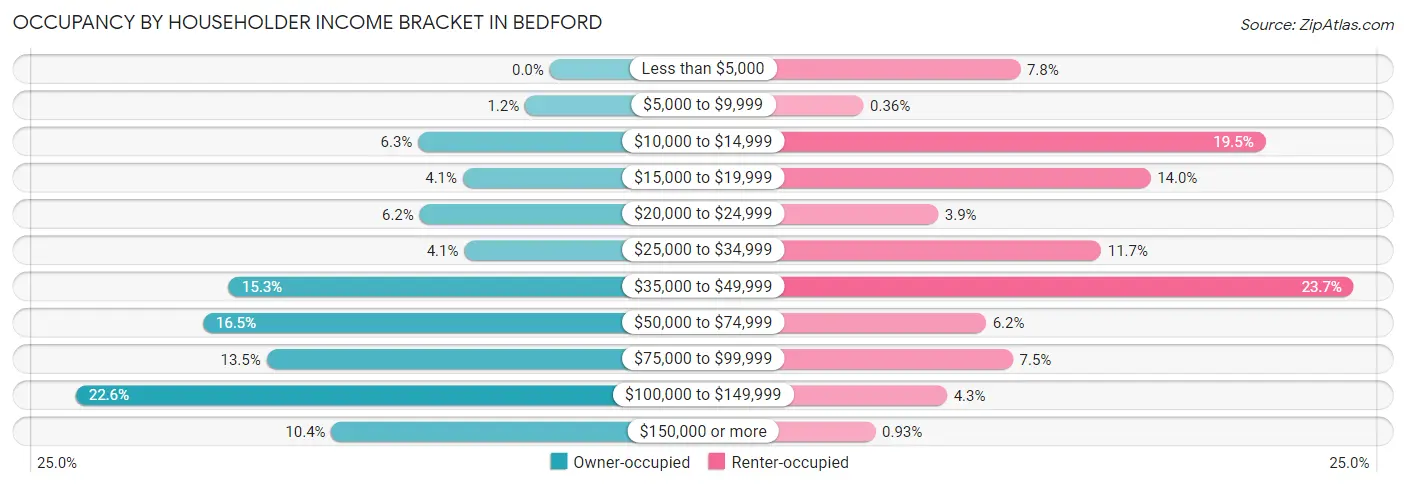
| Income Bracket | Owner-occupied | Renter-occupied |
| Less than $5,000 | 0 (0.0%) | 110 (7.8%) |
| $5,000 to $9,999 | 17 (1.2%) | 5 (0.4%) |
| $10,000 to $14,999 | 91 (6.3%) | 274 (19.5%) |
| $15,000 to $19,999 | 60 (4.1%) | 197 (14.0%) |
| $20,000 to $24,999 | 90 (6.2%) | 55 (3.9%) |
| $25,000 to $34,999 | 59 (4.1%) | 164 (11.7%) |
| $35,000 to $49,999 | 222 (15.3%) | 333 (23.7%) |
| $50,000 to $74,999 | 240 (16.5%) | 87 (6.2%) |
| $75,000 to $99,999 | 196 (13.5%) | 105 (7.5%) |
| $100,000 to $149,999 | 328 (22.6%) | 61 (4.3%) |
| $150,000 or more | 151 (10.4%) | 13 (0.9%) |
| Total | 1,454 (100.0%) | 1,404 (100.0%) |
Monthly Housing Cost Tiers in Bedford
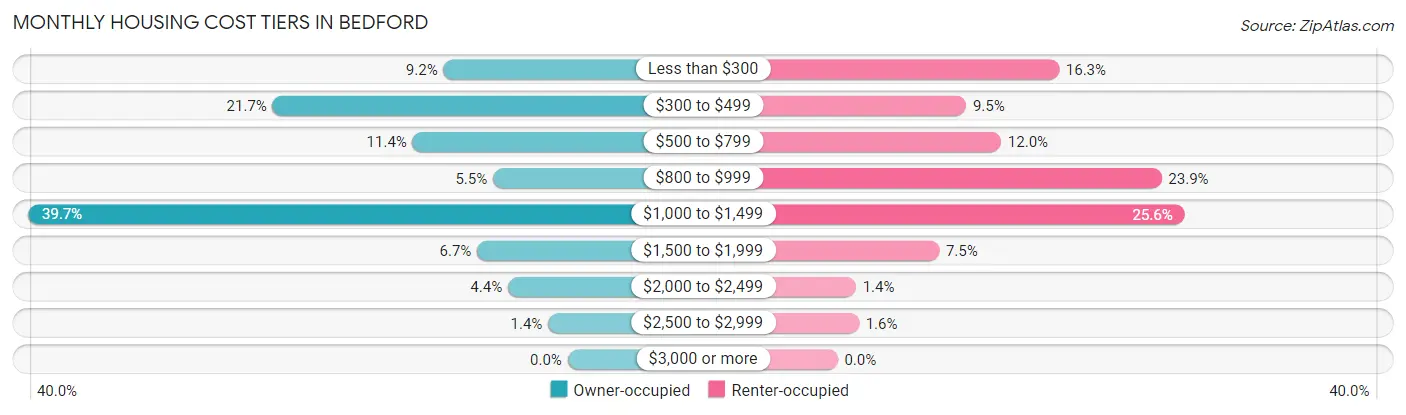
| Monthly Cost | Owner-occupied | Renter-occupied |
| Less than $300 | 133 (9.1%) | 229 (16.3%) |
| $300 to $499 | 316 (21.7%) | 133 (9.5%) |
| $500 to $799 | 166 (11.4%) | 169 (12.0%) |
| $800 to $999 | 80 (5.5%) | 335 (23.9%) |
| $1,000 to $1,499 | 577 (39.7%) | 359 (25.6%) |
| $1,500 to $1,999 | 97 (6.7%) | 105 (7.5%) |
| $2,000 to $2,499 | 64 (4.4%) | 19 (1.3%) |
| $2,500 to $2,999 | 21 (1.4%) | 22 (1.6%) |
| $3,000 or more | 0 (0.0%) | 0 (0.0%) |
| Total | 1,454 (100.0%) | 1,404 (100.0%) |
Physical Housing Characteristics in Bedford
Housing Structures in Bedford
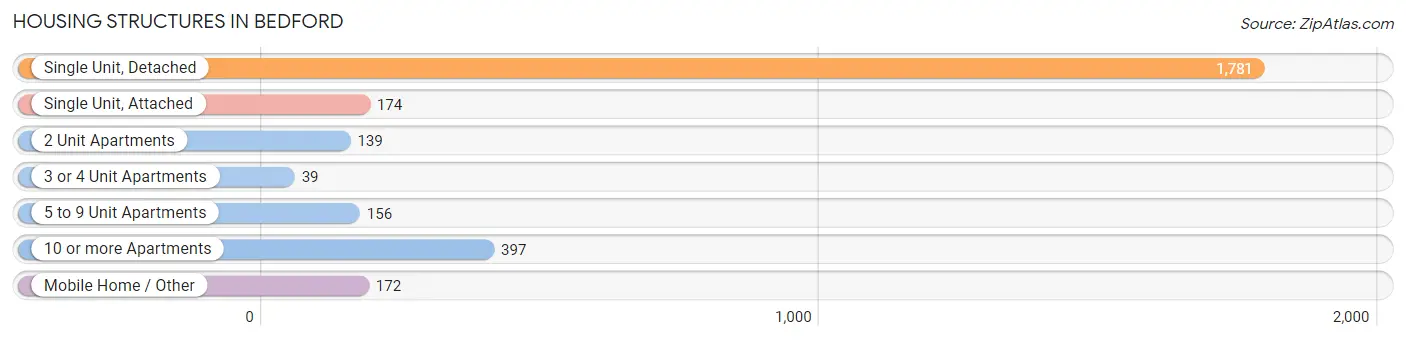
| Structure Type | # Housing Units | % Housing Units |
| Single Unit, Detached | 1,781 | 62.3% |
| Single Unit, Attached | 174 | 6.1% |
| 2 Unit Apartments | 139 | 4.9% |
| 3 or 4 Unit Apartments | 39 | 1.4% |
| 5 to 9 Unit Apartments | 156 | 5.5% |
| 10 or more Apartments | 397 | 13.9% |
| Mobile Home / Other | 172 | 6.0% |
| Total | 2,858 | 100.0% |
Housing Structures by Occupancy in Bedford
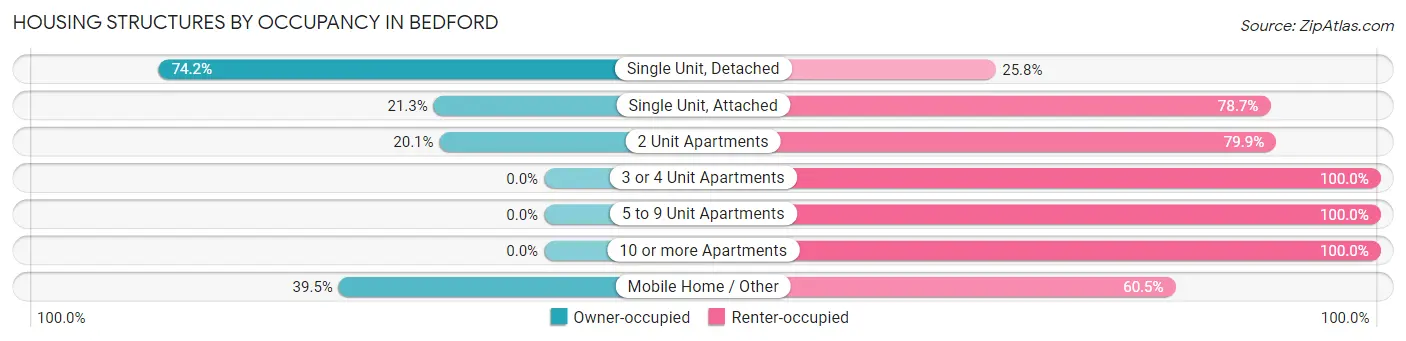
| Structure Type | Owner-occupied | Renter-occupied |
| Single Unit, Detached | 1,321 (74.2%) | 460 (25.8%) |
| Single Unit, Attached | 37 (21.3%) | 137 (78.7%) |
| 2 Unit Apartments | 28 (20.1%) | 111 (79.9%) |
| 3 or 4 Unit Apartments | 0 (0.0%) | 39 (100.0%) |
| 5 to 9 Unit Apartments | 0 (0.0%) | 156 (100.0%) |
| 10 or more Apartments | 0 (0.0%) | 397 (100.0%) |
| Mobile Home / Other | 68 (39.5%) | 104 (60.5%) |
| Total | 1,454 (50.9%) | 1,404 (49.1%) |
Housing Structures by Number of Rooms in Bedford
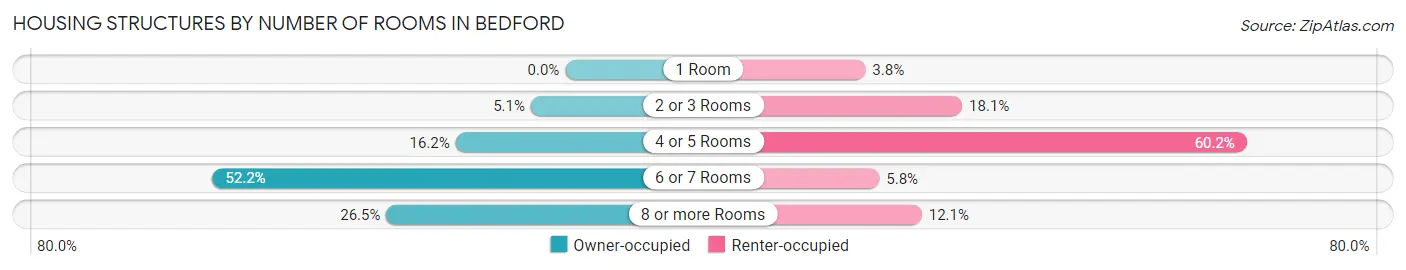
| Number of Rooms | Owner-occupied | Renter-occupied |
| 1 Room | 0 (0.0%) | 53 (3.8%) |
| 2 or 3 Rooms | 74 (5.1%) | 254 (18.1%) |
| 4 or 5 Rooms | 236 (16.2%) | 845 (60.2%) |
| 6 or 7 Rooms | 759 (52.2%) | 82 (5.8%) |
| 8 or more Rooms | 385 (26.5%) | 170 (12.1%) |
| Total | 1,454 (100.0%) | 1,404 (100.0%) |
Housing Structure by Heating Type in Bedford
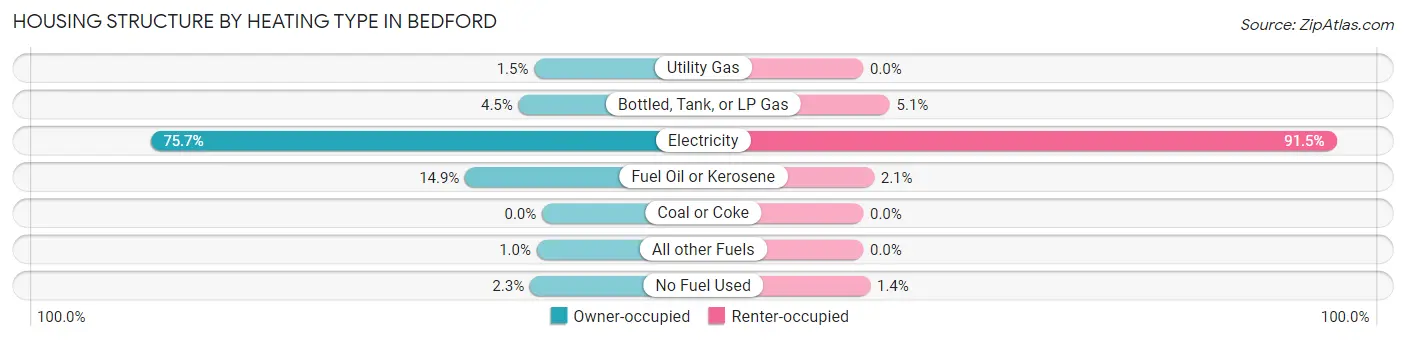
| Heating Type | Owner-occupied | Renter-occupied |
| Utility Gas | 22 (1.5%) | 0 (0.0%) |
| Bottled, Tank, or LP Gas | 66 (4.5%) | 72 (5.1%) |
| Electricity | 1,101 (75.7%) | 1,284 (91.4%) |
| Fuel Oil or Kerosene | 216 (14.9%) | 29 (2.1%) |
| Coal or Coke | 0 (0.0%) | 0 (0.0%) |
| All other Fuels | 15 (1.0%) | 0 (0.0%) |
| No Fuel Used | 34 (2.3%) | 19 (1.3%) |
| Total | 1,454 (100.0%) | 1,404 (100.0%) |
Household Vehicle Usage in Bedford
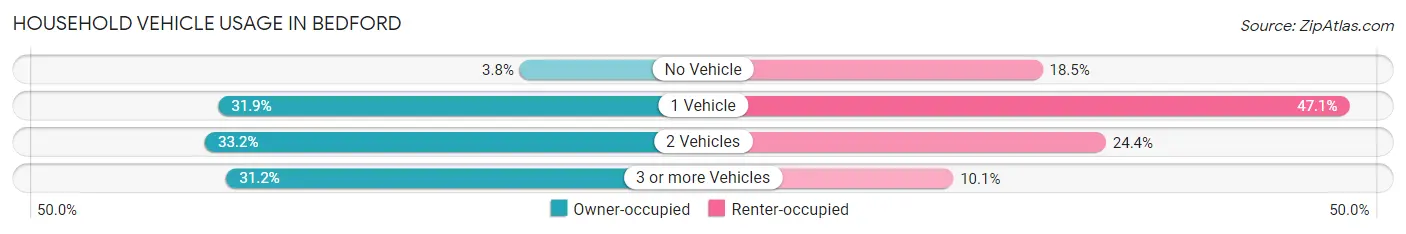
| Vehicles per Household | Owner-occupied | Renter-occupied |
| No Vehicle | 55 (3.8%) | 259 (18.4%) |
| 1 Vehicle | 464 (31.9%) | 661 (47.1%) |
| 2 Vehicles | 482 (33.2%) | 342 (24.4%) |
| 3 or more Vehicles | 453 (31.2%) | 142 (10.1%) |
| Total | 1,454 (100.0%) | 1,404 (100.0%) |
Real Estate & Mortgages in Bedford
Real Estate and Mortgage Overview in Bedford
| Characteristic | Without Mortgage | With Mortgage |
| Housing Units | 579 | 875 |
| Median Property Value | $161,100 | $216,900 |
| Median Household Income | $36,925 | $126 |
| Monthly Housing Costs | $402 | $0 |
| Real Estate Taxes | $1,135 | $14 |
Property Value by Mortgage Status in Bedford
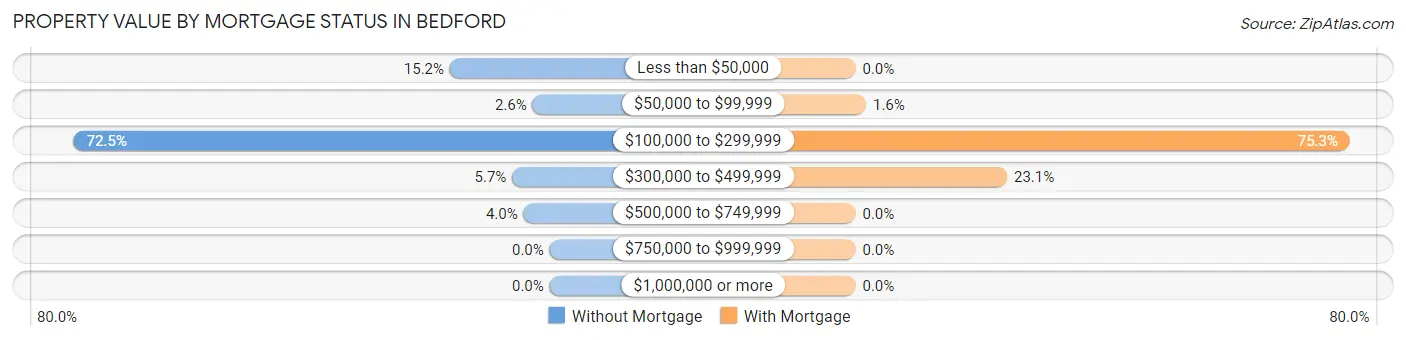
| Property Value | Without Mortgage | With Mortgage |
| Less than $50,000 | 88 (15.2%) | 0 (0.0%) |
| $50,000 to $99,999 | 15 (2.6%) | 14 (1.6%) |
| $100,000 to $299,999 | 420 (72.5%) | 659 (75.3%) |
| $300,000 to $499,999 | 33 (5.7%) | 202 (23.1%) |
| $500,000 to $749,999 | 23 (4.0%) | 0 (0.0%) |
| $750,000 to $999,999 | 0 (0.0%) | 0 (0.0%) |
| $1,000,000 or more | 0 (0.0%) | 0 (0.0%) |
| Total | 579 (100.0%) | 875 (100.0%) |
Household Income by Mortgage Status in Bedford
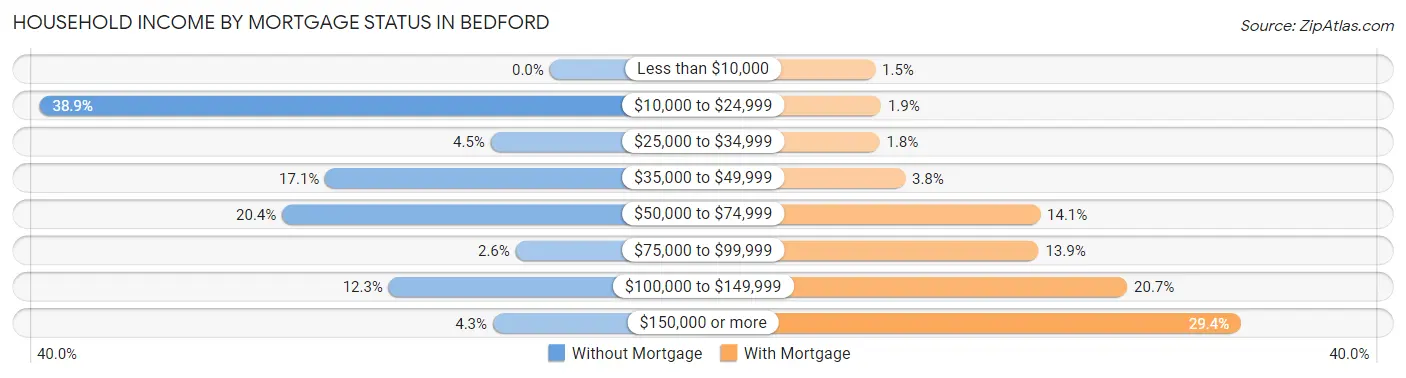
| Household Income | Without Mortgage | With Mortgage |
| Less than $10,000 | 0 (0.0%) | 13 (1.5%) |
| $10,000 to $24,999 | 225 (38.9%) | 17 (1.9%) |
| $25,000 to $34,999 | 26 (4.5%) | 16 (1.8%) |
| $35,000 to $49,999 | 99 (17.1%) | 33 (3.8%) |
| $50,000 to $74,999 | 118 (20.4%) | 123 (14.1%) |
| $75,000 to $99,999 | 15 (2.6%) | 122 (13.9%) |
| $100,000 to $149,999 | 71 (12.3%) | 181 (20.7%) |
| $150,000 or more | 25 (4.3%) | 257 (29.4%) |
| Total | 579 (100.0%) | 875 (100.0%) |
Property Value to Household Income Ratio in Bedford
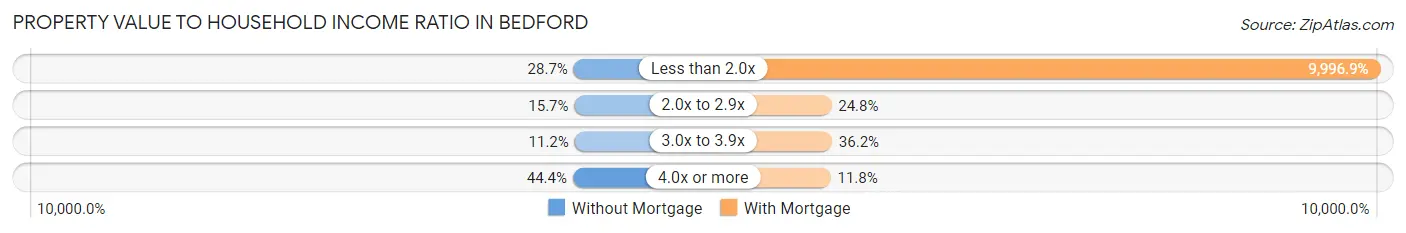
| Value-to-Income Ratio | Without Mortgage | With Mortgage |
| Less than 2.0x | 166 (28.7%) | 87,473 (9,996.9%) |
| 2.0x to 2.9x | 91 (15.7%) | 217 (24.8%) |
| 3.0x to 3.9x | 65 (11.2%) | 317 (36.2%) |
| 4.0x or more | 257 (44.4%) | 103 (11.8%) |
| Total | 579 (100.0%) | 875 (100.0%) |
Real Estate Taxes by Mortgage Status in Bedford
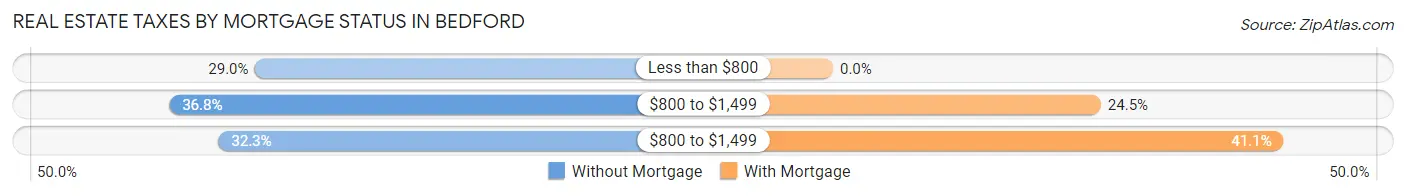
| Property Taxes | Without Mortgage | With Mortgage |
| Less than $800 | 168 (29.0%) | 0 (0.0%) |
| $800 to $1,499 | 213 (36.8%) | 214 (24.5%) |
| $800 to $1,499 | 187 (32.3%) | 360 (41.1%) |
| Total | 579 (100.0%) | 875 (100.0%) |
Health & Disability in Bedford
Health Insurance Coverage by Age in Bedford
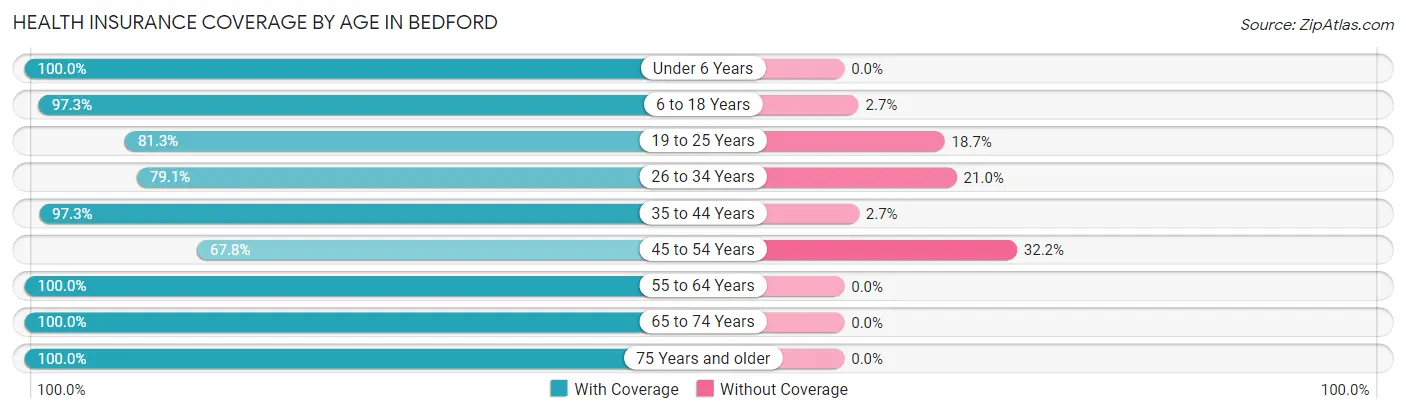
| Age Bracket | With Coverage | Without Coverage |
| Under 6 Years | 346 (100.0%) | 0 (0.0%) |
| 6 to 18 Years | 1,096 (97.3%) | 30 (2.7%) |
| 19 to 25 Years | 547 (81.3%) | 126 (18.7%) |
| 26 to 34 Years | 717 (79.0%) | 190 (20.9%) |
| 35 to 44 Years | 429 (97.3%) | 12 (2.7%) |
| 45 to 54 Years | 626 (67.8%) | 297 (32.2%) |
| 55 to 64 Years | 858 (100.0%) | 0 (0.0%) |
| 65 to 74 Years | 715 (100.0%) | 0 (0.0%) |
| 75 Years and older | 383 (100.0%) | 0 (0.0%) |
| Total | 5,717 (89.7%) | 655 (10.3%) |
Health Insurance Coverage by Citizenship Status in Bedford

| Citizenship Status | With Coverage | Without Coverage |
| Native Born | 346 (100.0%) | 0 (0.0%) |
| Foreign Born, Citizen | 1,096 (97.3%) | 30 (2.7%) |
| Foreign Born, not a Citizen | 547 (81.3%) | 126 (18.7%) |
Health Insurance Coverage by Household Income in Bedford
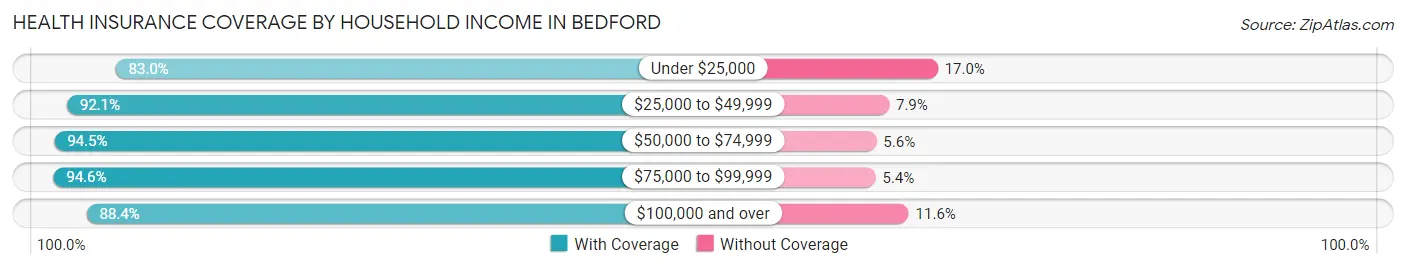
| Household Income | With Coverage | Without Coverage |
| Under $25,000 | 1,213 (83.0%) | 249 (17.0%) |
| $25,000 to $49,999 | 1,549 (92.1%) | 133 (7.9%) |
| $50,000 to $74,999 | 800 (94.5%) | 47 (5.6%) |
| $75,000 to $99,999 | 738 (94.6%) | 42 (5.4%) |
| $100,000 and over | 1,404 (88.4%) | 184 (11.6%) |
Public vs Private Health Insurance Coverage by Age in Bedford
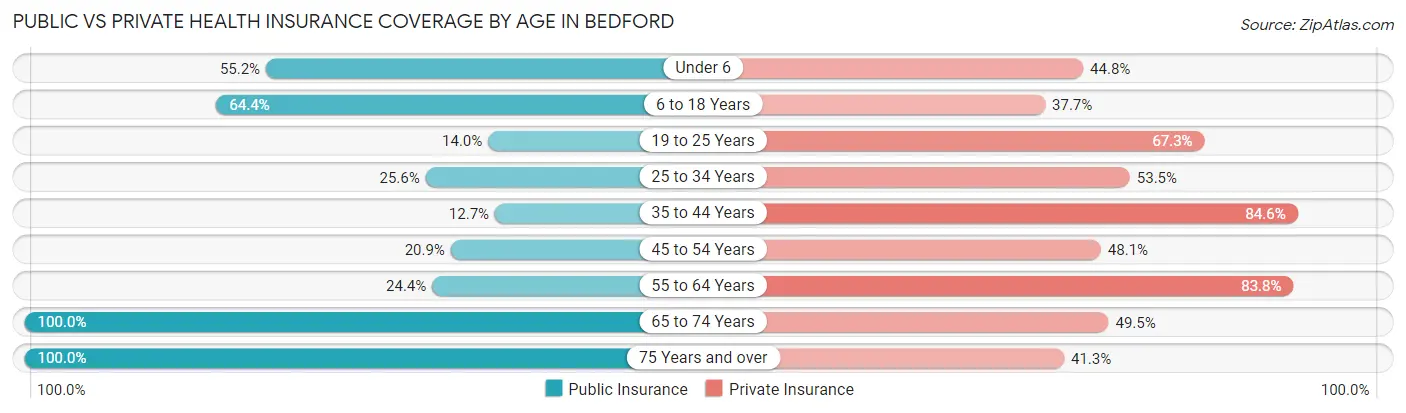
| Age Bracket | Public Insurance | Private Insurance |
| Under 6 | 191 (55.2%) | 155 (44.8%) |
| 6 to 18 Years | 725 (64.4%) | 425 (37.7%) |
| 19 to 25 Years | 94 (14.0%) | 453 (67.3%) |
| 25 to 34 Years | 232 (25.6%) | 485 (53.5%) |
| 35 to 44 Years | 56 (12.7%) | 373 (84.6%) |
| 45 to 54 Years | 193 (20.9%) | 444 (48.1%) |
| 55 to 64 Years | 209 (24.4%) | 719 (83.8%) |
| 65 to 74 Years | 715 (100.0%) | 354 (49.5%) |
| 75 Years and over | 383 (100.0%) | 158 (41.2%) |
| Total | 2,798 (43.9%) | 3,566 (56.0%) |
Disability Status by Sex by Age in Bedford
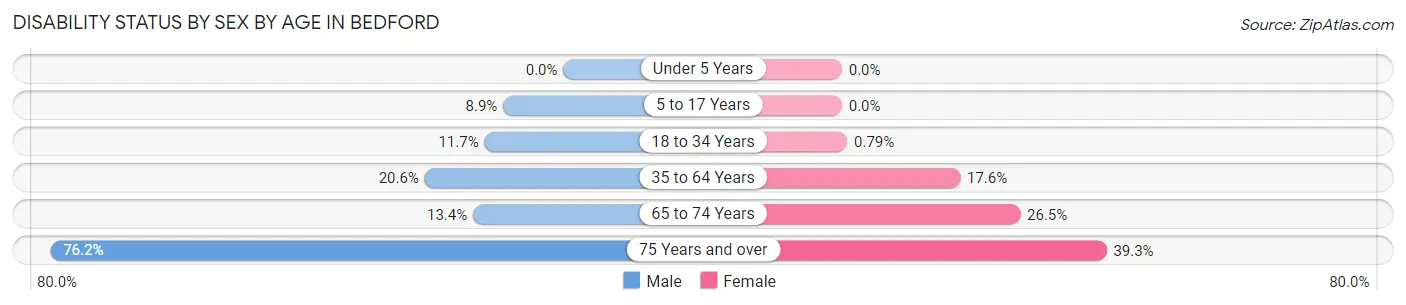
| Age Bracket | Male | Female |
| Under 5 Years | 0 (0.0%) | 0 (0.0%) |
| 5 to 17 Years | 55 (8.9%) | 0 (0.0%) |
| 18 to 34 Years | 96 (11.7%) | 7 (0.8%) |
| 35 to 64 Years | 209 (20.6%) | 212 (17.6%) |
| 65 to 74 Years | 28 (13.4%) | 134 (26.5%) |
| 75 Years and over | 32 (76.2%) | 134 (39.3%) |
Disability Class by Sex by Age in Bedford
Disability Class: Hearing Difficulty
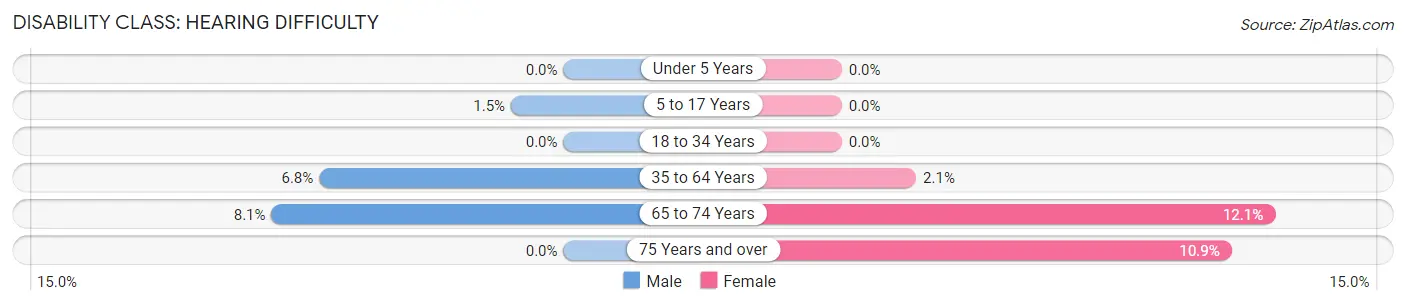
| Age Bracket | Male | Female |
| Under 5 Years | 0 (0.0%) | 0 (0.0%) |
| 5 to 17 Years | 9 (1.5%) | 0 (0.0%) |
| 18 to 34 Years | 0 (0.0%) | 0 (0.0%) |
| 35 to 64 Years | 69 (6.8%) | 25 (2.1%) |
| 65 to 74 Years | 17 (8.1%) | 61 (12.1%) |
| 75 Years and over | 0 (0.0%) | 37 (10.8%) |
Disability Class: Vision Difficulty
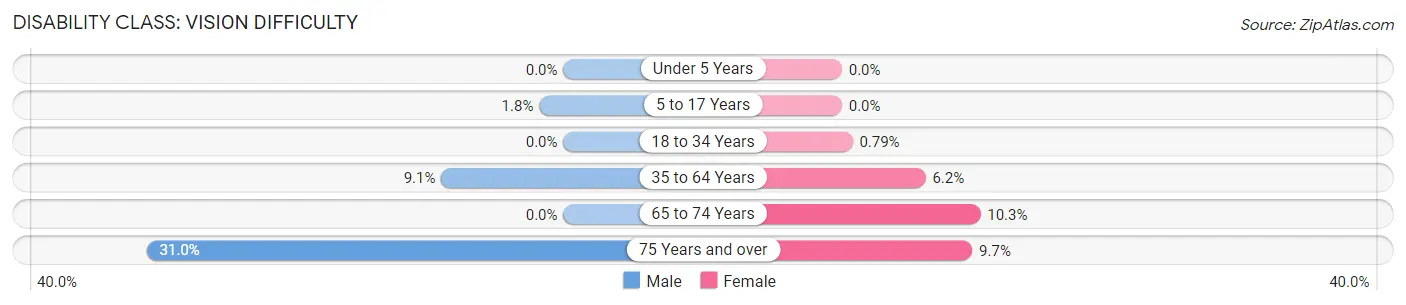
| Age Bracket | Male | Female |
| Under 5 Years | 0 (0.0%) | 0 (0.0%) |
| 5 to 17 Years | 11 (1.8%) | 0 (0.0%) |
| 18 to 34 Years | 0 (0.0%) | 7 (0.8%) |
| 35 to 64 Years | 92 (9.1%) | 75 (6.2%) |
| 65 to 74 Years | 0 (0.0%) | 52 (10.3%) |
| 75 Years and over | 13 (30.9%) | 33 (9.7%) |
Disability Class: Cognitive Difficulty
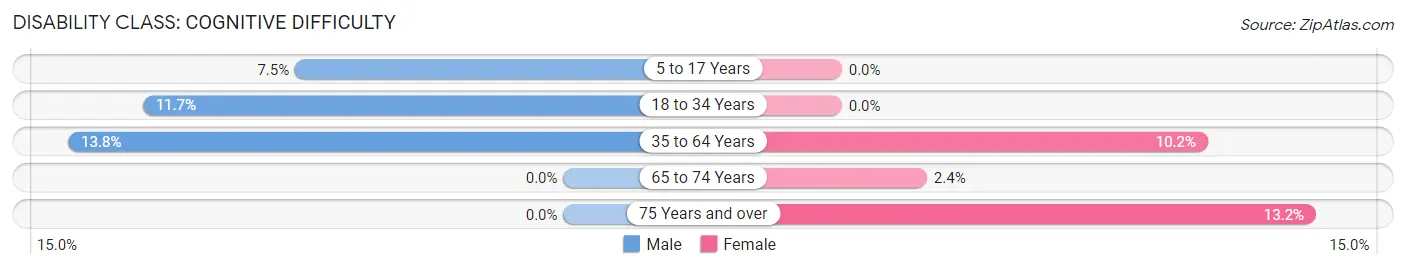
| Age Bracket | Male | Female |
| 5 to 17 Years | 46 (7.5%) | 0 (0.0%) |
| 18 to 34 Years | 96 (11.7%) | 0 (0.0%) |
| 35 to 64 Years | 140 (13.8%) | 123 (10.2%) |
| 65 to 74 Years | 0 (0.0%) | 12 (2.4%) |
| 75 Years and over | 0 (0.0%) | 45 (13.2%) |
Disability Class: Ambulatory Difficulty
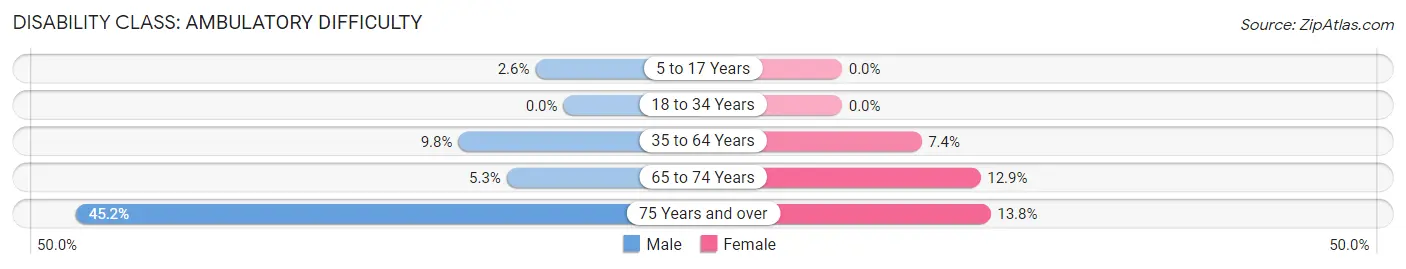
| Age Bracket | Male | Female |
| 5 to 17 Years | 16 (2.6%) | 0 (0.0%) |
| 18 to 34 Years | 0 (0.0%) | 0 (0.0%) |
| 35 to 64 Years | 99 (9.8%) | 89 (7.4%) |
| 65 to 74 Years | 11 (5.3%) | 65 (12.9%) |
| 75 Years and over | 19 (45.2%) | 47 (13.8%) |
Disability Class: Self-Care Difficulty
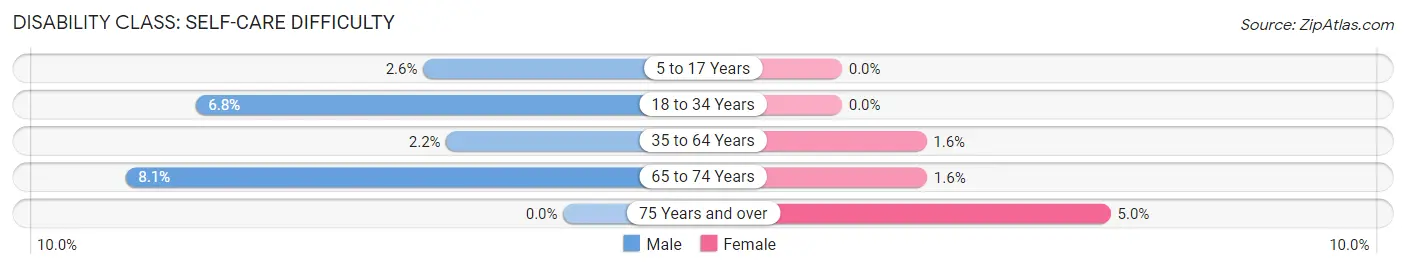
| Age Bracket | Male | Female |
| 5 to 17 Years | 16 (2.6%) | 0 (0.0%) |
| 18 to 34 Years | 56 (6.8%) | 0 (0.0%) |
| 35 to 64 Years | 22 (2.2%) | 19 (1.6%) |
| 65 to 74 Years | 17 (8.1%) | 8 (1.6%) |
| 75 Years and over | 0 (0.0%) | 17 (5.0%) |
Technology Access in Bedford
Computing Device Access in Bedford
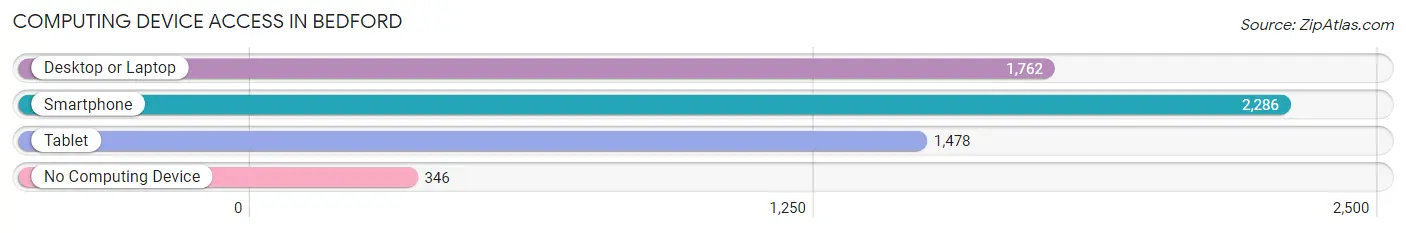
| Device Type | # Households | % Households |
| Desktop or Laptop | 1,762 | 61.7% |
| Smartphone | 2,286 | 80.0% |
| Tablet | 1,478 | 51.7% |
| No Computing Device | 346 | 12.1% |
| Total | 2,858 | 100.0% |
Internet Access in Bedford
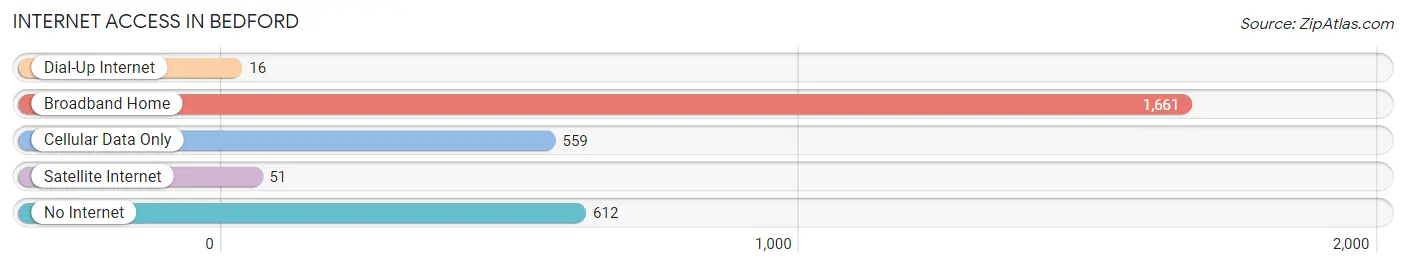
| Internet Type | # Households | % Households |
| Dial-Up Internet | 16 | 0.6% |
| Broadband Home | 1,661 | 58.1% |
| Cellular Data Only | 559 | 19.6% |
| Satellite Internet | 51 | 1.8% |
| No Internet | 612 | 21.4% |
| Total | 2,858 | 100.0% |
Bedford Summary
Bedford, Virginia is a small town located in the foothills of the Blue Ridge Mountains in the central part of the state. It is the county seat of Bedford County and is part of the Lynchburg Metropolitan Statistical Area. The town has a population of 6,222 as of the 2010 census.
History
Bedford was established in 1754 as the county seat of Bedford County. It was named after the Duke of Bedford, who was a prominent figure in the British government at the time. The town was a major stop on the Great Wagon Road, which was a major route for settlers heading west. During the American Revolution, Bedford was the site of several battles, including the Battle of Bedford in 1781.
In the 19th century, Bedford became an important center for the production of tobacco. The town was also home to several prominent figures in American history, including Thomas Jefferson, who was born in nearby Albemarle County.
Geography
Bedford is located in the foothills of the Blue Ridge Mountains in the central part of the state. It is situated at the intersection of US Route 460 and US Route 221. The town is located about 25 miles east of Roanoke and about 90 miles west of Richmond.
The terrain around Bedford is mostly hilly, with some flat areas in the valleys. The town is located in the Appalachian Plateau, which is characterized by rolling hills and valleys. The climate in Bedford is humid subtropical, with hot, humid summers and mild winters.
Economy
The economy of Bedford is largely based on agriculture and manufacturing. The town is home to several large companies, including Smithfield Foods, which is the largest pork producer in the world. Other major employers in the area include the Bedford County Public Schools, the Bedford County Sheriff's Office, and the Bedford County Courthouse.
The town is also home to several small businesses, including restaurants, retail stores, and professional services. Tourism is also an important part of the local economy, with many visitors coming to the area to enjoy the natural beauty of the Blue Ridge Mountains.
Demographics
As of the 2010 census, Bedford had a population of 6,222. The racial makeup of the town was 87.3% White, 8.2% African American, 0.4% Native American, 0.7% Asian, 0.1% Pacific Islander, 1.2% from other races, and 2.1% from two or more races. Hispanic or Latino of any race were 3.2% of the population.
The median household income in Bedford was $41,945, and the median family income was $50,945. The per capita income for the town was $20,945. About 11.2% of families and 14.2% of the population were below the poverty line, including 19.2% of those under age 18 and 8.2% of those age 65 or over.
Conclusion
Bedford, Virginia is a small town located in the foothills of the Blue Ridge Mountains in the central part of the state. It has a long and rich history, and is home to several prominent figures in American history. The town has a diverse economy, with agriculture and manufacturing being the main industries. The population of Bedford is mostly white, with a small percentage of African Americans, Native Americans, and other races. The median household income in Bedford is slightly above the national average, and the poverty rate is slightly below the national average.
Common Questions
What is Per Capita Income in Bedford?
Per Capita income in Bedford is $26,238.
What is the Median Family Income in Bedford?
Median Family Income in Bedford is $61,134.
What is the Median Household income in Bedford?
Median Household Income in Bedford is $41,154.
What is Income or Wage Gap in Bedford?
Income or Wage Gap in Bedford is 20.6%.
Women in Bedford earn 79.4 cents for every dollar earned by a man.
What is Family Income Deficit in Bedford?
Family Income Deficit in Bedford is $11,095.
Families that are below poverty line in Bedford earn $11,095 less on average than the poverty threshold level.
What is Inequality or Gini Index in Bedford?
Inequality or Gini Index in Bedford is 0.45.
What is the Total Population of Bedford?
Total Population of Bedford is 6,676.
What is the Total Male Population of Bedford?
Total Male Population of Bedford is 2,980.
What is the Total Female Population of Bedford?
Total Female Population of Bedford is 3,696.
What is the Ratio of Males per 100 Females in Bedford?
There are 80.63 Males per 100 Females in Bedford.
What is the Ratio of Females per 100 Males in Bedford?
There are 124.03 Females per 100 Males in Bedford.
What is the Median Population Age in Bedford?
Median Population Age in Bedford is 40.5 Years.
What is the Average Family Size in Bedford
Average Family Size in Bedford is 3.1 People.
What is the Average Household Size in Bedford
Average Household Size in Bedford is 2.2 People.
How Large is the Labor Force in Bedford?
There are 3,046 People in the Labor Forcein in Bedford.
What is the Percentage of People in the Labor Force in Bedford?
55.7% of People are in the Labor Force in Bedford.
What is the Unemployment Rate in Bedford?
Unemployment Rate in Bedford is 2.4%.