Waynesboro, VA Map & Demographics
Waynesboro Map
Waynesboro Overview
$30,380
PER CAPITA INCOME
$69,708
AVG FAMILY INCOME
$52,519
AVG HOUSEHOLD INCOME
28.6%
WAGE / INCOME GAP [ % ]
71.4¢/ $1
WAGE / INCOME GAP [ $ ]
$12,674
FAMILY INCOME DEFICIT
0.45
INEQUALITY / GINI INDEX
22,341
TOTAL POPULATION
10,995
MALE POPULATION
11,346
FEMALE POPULATION
96.91
MALES / 100 FEMALES
103.19
FEMALES / 100 MALES
38.7
MEDIAN AGE
3.1
AVG FAMILY SIZE
2.4
AVG HOUSEHOLD SIZE
11,502
LABOR FORCE [ PEOPLE ]
64.8%
PERCENT IN LABOR FORCE
4.7%
UNEMPLOYMENT RATE
Waynesboro Zip Codes
Waynesboro Area Codes
Income in Waynesboro
Income Overview in Waynesboro
Per Capita Income in Waynesboro is $30,380, while median incomes of families and households are $69,708 and $52,519 respectively.
| Characteristic | Number | Measure |
| Per Capita Income | 22,341 | $30,380 |
| Median Family Income | 5,238 | $69,708 |
| Mean Family Income | 5,238 | $80,563 |
| Median Household Income | 9,431 | $52,519 |
| Mean Household Income | 9,431 | $68,820 |
| Income Deficit | 5,238 | $12,674 |
| Wage / Income Gap (%) | 22,341 | 28.60% |
| Wage / Income Gap ($) | 22,341 | 71.40¢ per $1 |
| Gini / Inequality Index | 22,341 | 0.45 |
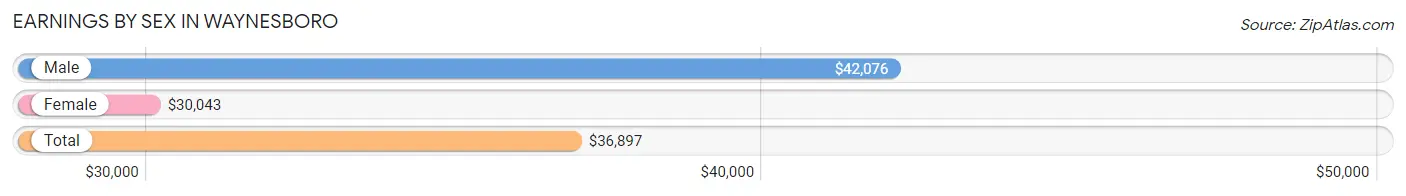
Earnings by Sex in Waynesboro
Average Earnings in Waynesboro are $36,897, $42,076 for men and $30,043 for women, a difference of 28.6%.
| Sex | Number | Average Earnings |
| Male | 5,923 (50.4%) | $42,076 |
| Female | 5,839 (49.6%) | $30,043 |
| Total | 11,762 (100.0%) | $36,897 |
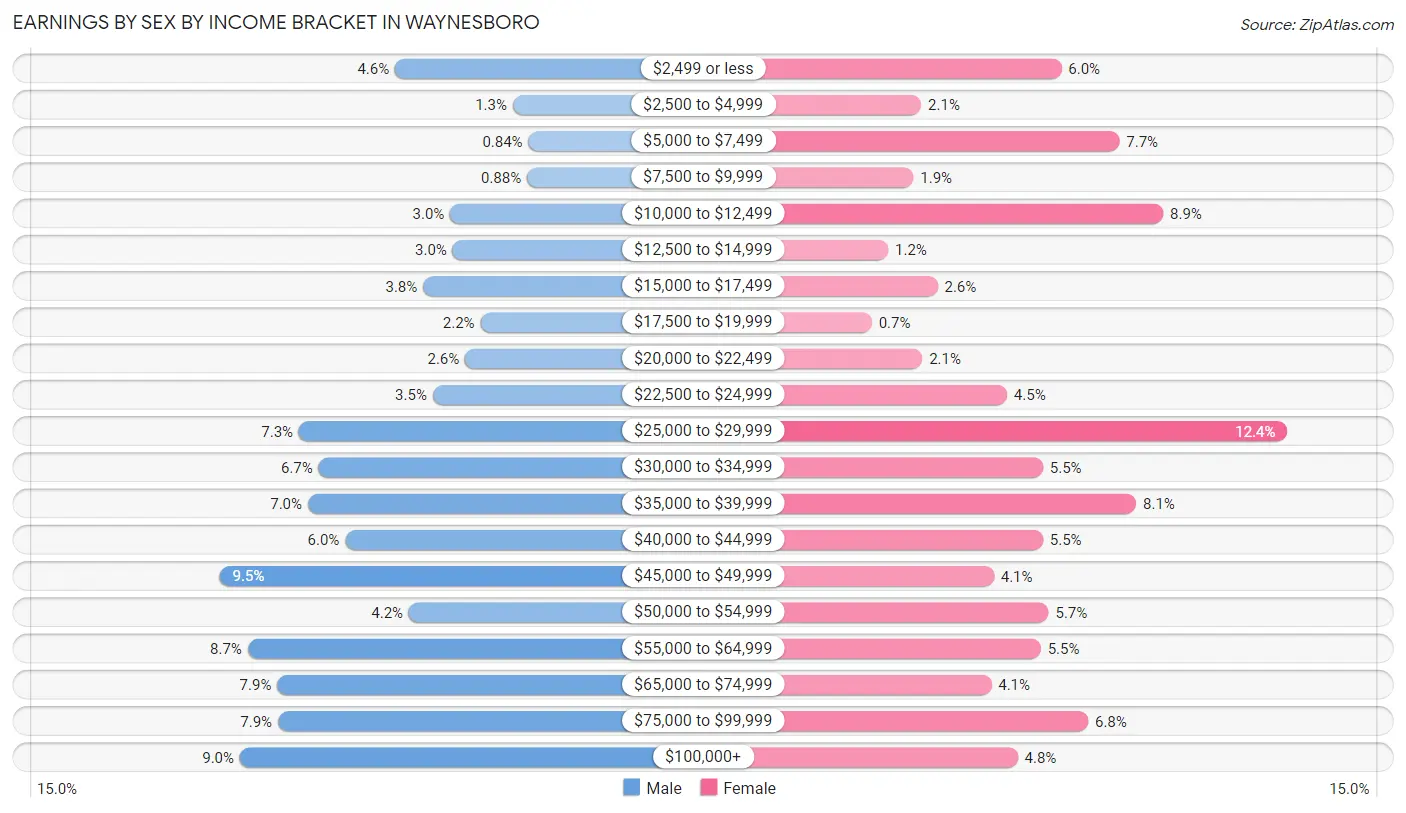
Earnings by Sex by Income Bracket in Waynesboro
The most common earnings brackets in Waynesboro are $45,000 to $49,999 for men (564 | 9.5%) and $25,000 to $29,999 for women (723 | 12.4%).
| Income | Male | Female |
| $2,499 or less | 272 (4.6%) | 352 (6.0%) |
| $2,500 to $4,999 | 76 (1.3%) | 122 (2.1%) |
| $5,000 to $7,499 | 50 (0.8%) | 447 (7.7%) |
| $7,500 to $9,999 | 52 (0.9%) | 109 (1.9%) |
| $10,000 to $12,499 | 180 (3.0%) | 519 (8.9%) |
| $12,500 to $14,999 | 176 (3.0%) | 68 (1.2%) |
| $15,000 to $17,499 | 225 (3.8%) | 149 (2.5%) |
| $17,500 to $19,999 | 130 (2.2%) | 41 (0.7%) |
| $20,000 to $22,499 | 155 (2.6%) | 124 (2.1%) |
| $22,500 to $24,999 | 209 (3.5%) | 263 (4.5%) |
| $25,000 to $29,999 | 432 (7.3%) | 723 (12.4%) |
| $30,000 to $34,999 | 399 (6.7%) | 322 (5.5%) |
| $35,000 to $39,999 | 417 (7.0%) | 475 (8.1%) |
| $40,000 to $44,999 | 355 (6.0%) | 322 (5.5%) |
| $45,000 to $49,999 | 564 (9.5%) | 241 (4.1%) |
| $50,000 to $54,999 | 249 (4.2%) | 331 (5.7%) |
| $55,000 to $64,999 | 517 (8.7%) | 318 (5.4%) |
| $65,000 to $74,999 | 468 (7.9%) | 237 (4.1%) |
| $75,000 to $99,999 | 467 (7.9%) | 396 (6.8%) |
| $100,000+ | 530 (8.9%) | 280 (4.8%) |
| Total | 5,923 (100.0%) | 5,839 (100.0%) |
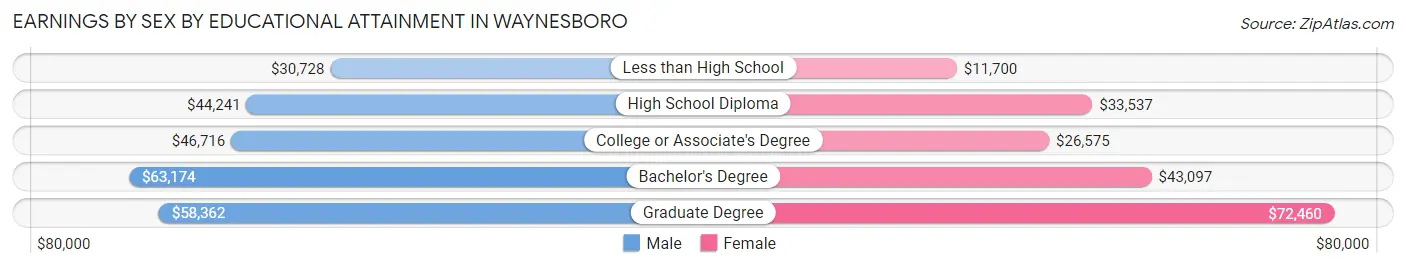
Earnings by Sex by Educational Attainment in Waynesboro
Average earnings in Waynesboro are $45,854 for men and $33,900 for women, a difference of 26.1%. Men with an educational attainment of bachelor's degree enjoy the highest average annual earnings of $63,174, while those with less than high school education earn the least with $30,728. Women with an educational attainment of graduate degree earn the most with the average annual earnings of $72,460, while those with less than high school education have the smallest earnings of $11,700.
| Educational Attainment | Male Income | Female Income |
| Less than High School | $30,728 | $11,700 |
| High School Diploma | $44,241 | $33,537 |
| College or Associate's Degree | $46,716 | $26,575 |
| Bachelor's Degree | $63,174 | $43,097 |
| Graduate Degree | $58,362 | $72,460 |
| Total | $45,854 | $33,900 |
Family Income in Waynesboro
Family Income Brackets in Waynesboro
According to the Waynesboro family income data, there are 1,069 families falling into the $100,000 to $149,999 income range, which is the most common income bracket and makes up 20.4% of all families. Conversely, the $200,000+ income bracket is the least frequent group with only 173 families (3.3%) belonging to this category.
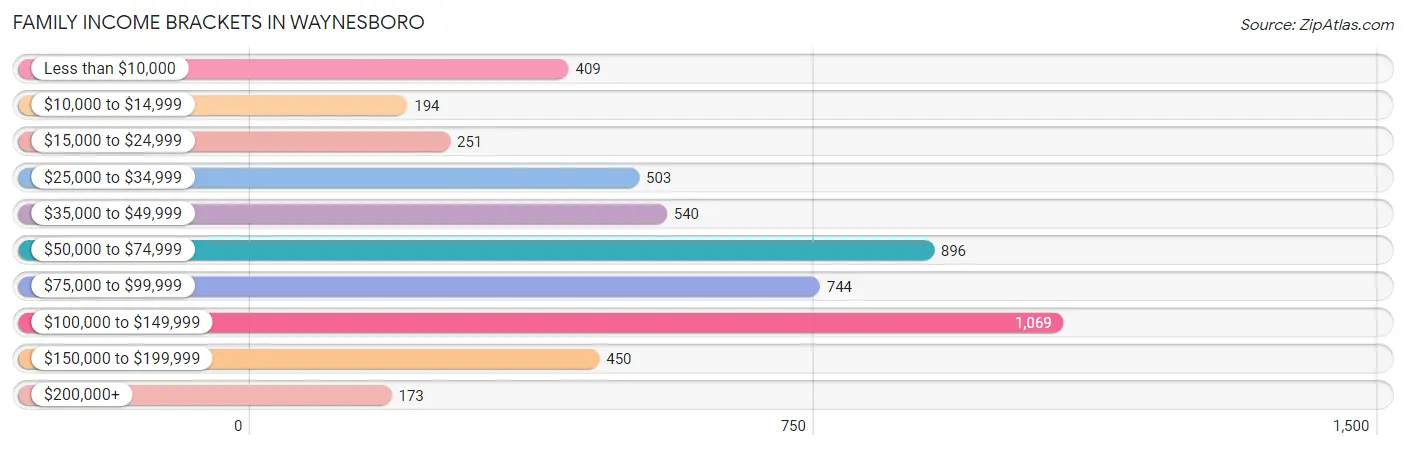
| Income Bracket | # Families | % Families |
| Less than $10,000 | 409 | 7.8% |
| $10,000 to $14,999 | 194 | 3.7% |
| $15,000 to $24,999 | 251 | 4.8% |
| $25,000 to $34,999 | 503 | 9.6% |
| $35,000 to $49,999 | 540 | 10.3% |
| $50,000 to $74,999 | 896 | 17.1% |
| $75,000 to $99,999 | 744 | 14.2% |
| $100,000 to $149,999 | 1,069 | 20.4% |
| $150,000 to $199,999 | 450 | 8.6% |
| $200,000+ | 173 | 3.3% |
Family Income by Famaliy Size in Waynesboro
6-person families (186 | 3.5%) account for the highest median family income in Waynesboro with $98,333 per family, while 2-person families (2,591 | 49.5%) have the highest median income of $30,164 per family member.
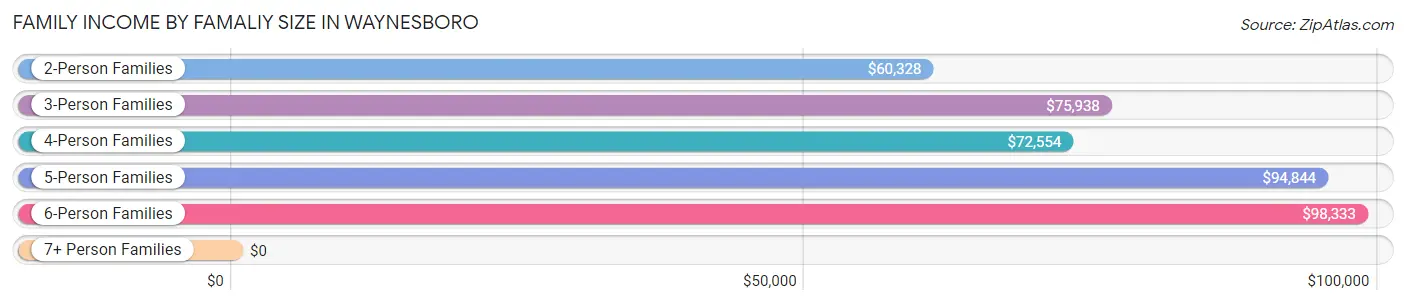
| Income Bracket | # Families | Median Income |
| 2-Person Families | 2,591 (49.5%) | $60,328 |
| 3-Person Families | 1,117 (21.3%) | $75,938 |
| 4-Person Families | 823 (15.7%) | $72,554 |
| 5-Person Families | 510 (9.7%) | $94,844 |
| 6-Person Families | 186 (3.5%) | $98,333 |
| 7+ Person Families | 11 (0.2%) | $0 |
| Total | 5,238 (100.0%) | $69,708 |
Family Income by Number of Earners in Waynesboro
The median family income in Waynesboro is $69,708, with families comprising 3+ earners (616) having the highest median family income of $128,487, while families with 1 earner (2,042) have the lowest median family income of $36,624, accounting for 11.8% and 39.0% of families, respectively.
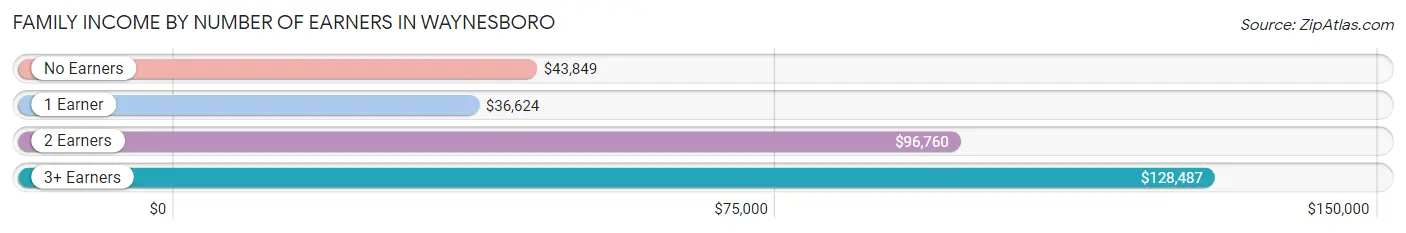
| Number of Earners | # Families | Median Income |
| No Earners | 847 (16.2%) | $43,849 |
| 1 Earner | 2,042 (39.0%) | $36,624 |
| 2 Earners | 1,733 (33.1%) | $96,760 |
| 3+ Earners | 616 (11.8%) | $128,487 |
| Total | 5,238 (100.0%) | $69,708 |
Household Income in Waynesboro
Household Income Brackets in Waynesboro
With 1,641 households falling in the category, the $50,000 to $74,999 income range is the most frequent in Waynesboro, accounting for 17.4% of all households. In contrast, only 358 households (3.8%) fall into the $200,000+ income bracket, making it the least populous group.
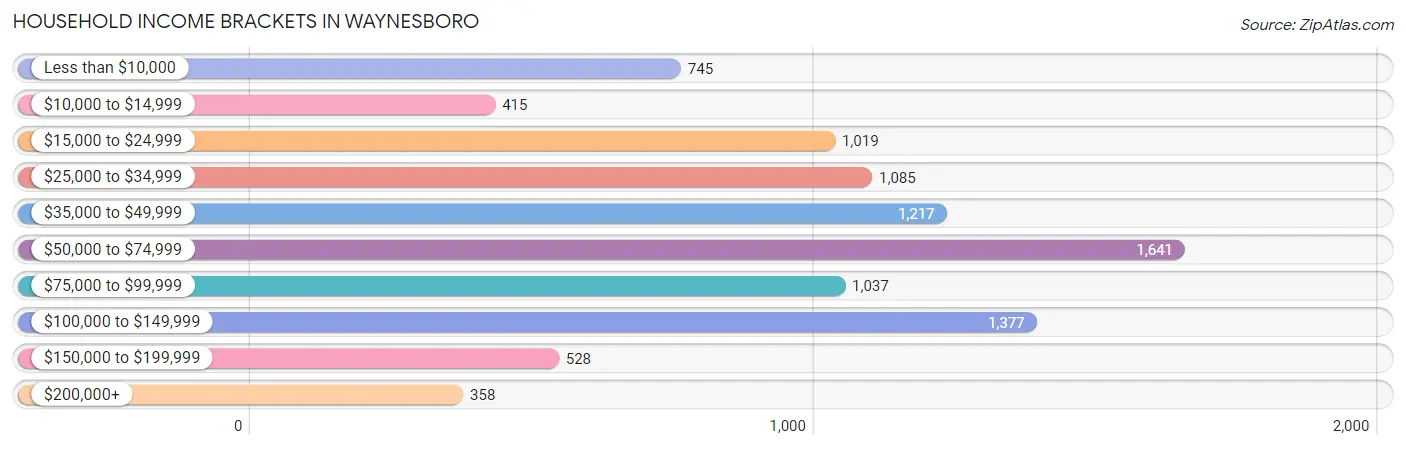
| Income Bracket | # Households | % Households |
| Less than $10,000 | 745 | 7.9% |
| $10,000 to $14,999 | 415 | 4.4% |
| $15,000 to $24,999 | 1,019 | 10.8% |
| $25,000 to $34,999 | 1,085 | 11.5% |
| $35,000 to $49,999 | 1,217 | 12.9% |
| $50,000 to $74,999 | 1,641 | 17.4% |
| $75,000 to $99,999 | 1,037 | 11.0% |
| $100,000 to $149,999 | 1,377 | 14.6% |
| $150,000 to $199,999 | 528 | 5.6% |
| $200,000+ | 358 | 3.8% |
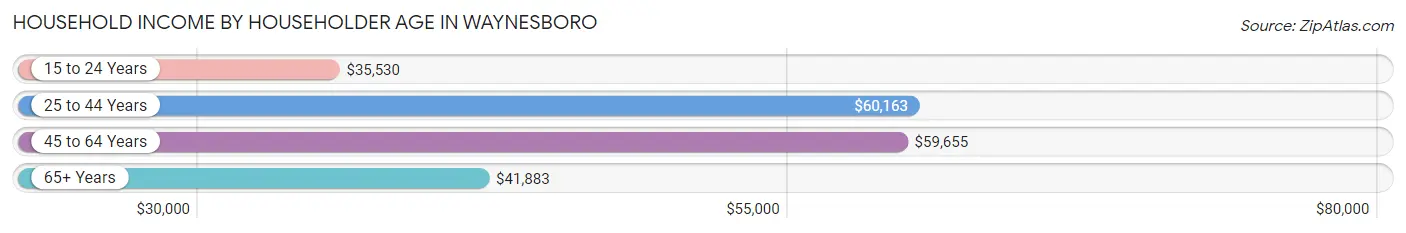
Household Income by Householder Age in Waynesboro
The median household income in Waynesboro is $52,519, with the highest median household income of $60,163 found in the 25 to 44 years age bracket for the primary householder. A total of 3,362 households (35.6%) fall into this category. Meanwhile, the 15 to 24 years age bracket for the primary householder has the lowest median household income of $35,530, with 455 households (4.8%) in this group.
| Income Bracket | # Households | Median Income |
| 15 to 24 Years | 455 (4.8%) | $35,530 |
| 25 to 44 Years | 3,362 (35.6%) | $60,163 |
| 45 to 64 Years | 2,932 (31.1%) | $59,655 |
| 65+ Years | 2,682 (28.4%) | $41,883 |
| Total | 9,431 (100.0%) | $52,519 |
Poverty in Waynesboro
Income Below Poverty by Sex and Age in Waynesboro
With 13.4% poverty level for males and 18.8% for females among the residents of Waynesboro, 5 year old males and 18 to 24 year old females are the most vulnerable to poverty, with 137 males (71.4%) and 324 females (41.3%) in their respective age groups living below the poverty level.
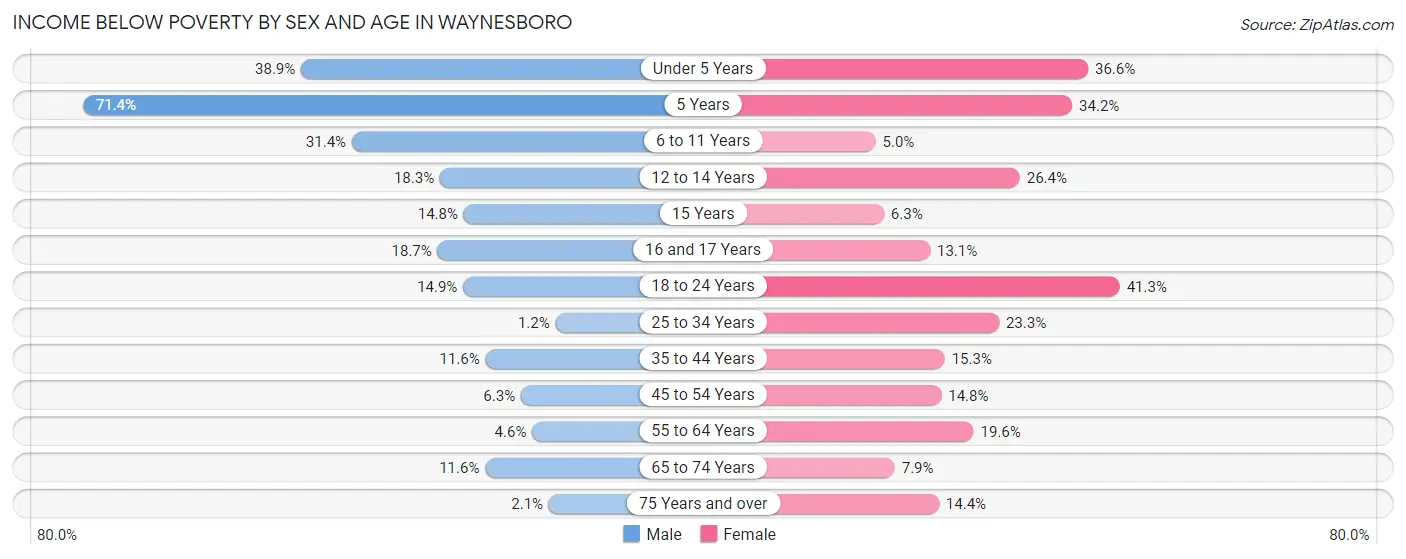
| Age Bracket | Male | Female |
| Under 5 Years | 301 (38.9%) | 222 (36.6%) |
| 5 Years | 137 (71.4%) | 52 (34.2%) |
| 6 to 11 Years | 293 (31.4%) | 46 (5.0%) |
| 12 to 14 Years | 87 (18.3%) | 37 (26.4%) |
| 15 Years | 30 (14.8%) | 6 (6.2%) |
| 16 and 17 Years | 45 (18.7%) | 19 (13.1%) |
| 18 to 24 Years | 116 (14.9%) | 324 (41.3%) |
| 25 to 34 Years | 19 (1.2%) | 439 (23.3%) |
| 35 to 44 Years | 168 (11.6%) | 211 (15.3%) |
| 45 to 54 Years | 75 (6.3%) | 208 (14.8%) |
| 55 to 64 Years | 65 (4.6%) | 301 (19.6%) |
| 65 to 74 Years | 111 (11.6%) | 85 (7.9%) |
| 75 Years and over | 14 (2.1%) | 151 (14.4%) |
| Total | 1,461 (13.4%) | 2,101 (18.8%) |
Income Above Poverty by Sex and Age in Waynesboro
According to the poverty statistics in Waynesboro, males aged 25 to 34 years and females aged 6 to 11 years are the age groups that are most secure financially, with 98.8% of males and 95.0% of females in these age groups living above the poverty line.
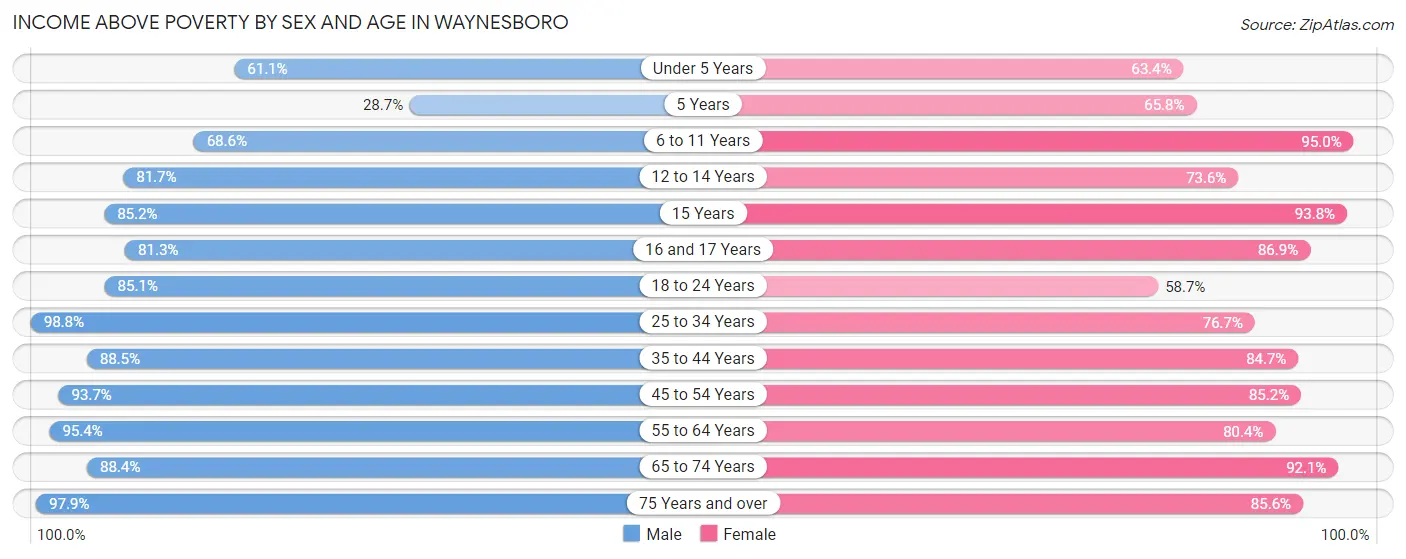
| Age Bracket | Male | Female |
| Under 5 Years | 472 (61.1%) | 385 (63.4%) |
| 5 Years | 55 (28.6%) | 100 (65.8%) |
| 6 to 11 Years | 640 (68.6%) | 870 (95.0%) |
| 12 to 14 Years | 388 (81.7%) | 103 (73.6%) |
| 15 Years | 173 (85.2%) | 90 (93.8%) |
| 16 and 17 Years | 196 (81.3%) | 126 (86.9%) |
| 18 to 24 Years | 664 (85.1%) | 461 (58.7%) |
| 25 to 34 Years | 1,613 (98.8%) | 1,442 (76.7%) |
| 35 to 44 Years | 1,287 (88.4%) | 1,169 (84.7%) |
| 45 to 54 Years | 1,118 (93.7%) | 1,200 (85.2%) |
| 55 to 64 Years | 1,343 (95.4%) | 1,238 (80.4%) |
| 65 to 74 Years | 846 (88.4%) | 995 (92.1%) |
| 75 Years and over | 641 (97.9%) | 896 (85.6%) |
| Total | 9,436 (86.6%) | 9,075 (81.2%) |
Income Below Poverty Among Married-Couple Families in Waynesboro
The poverty statistics for married-couple families in Waynesboro show that 4.6% or 140 of the total 3,059 families live below the poverty line. Families with 3 or 4 children have the highest poverty rate of 13.9%, comprising of 29 families. On the other hand, families with no children have the lowest poverty rate of 3.2%, which includes 60 families.
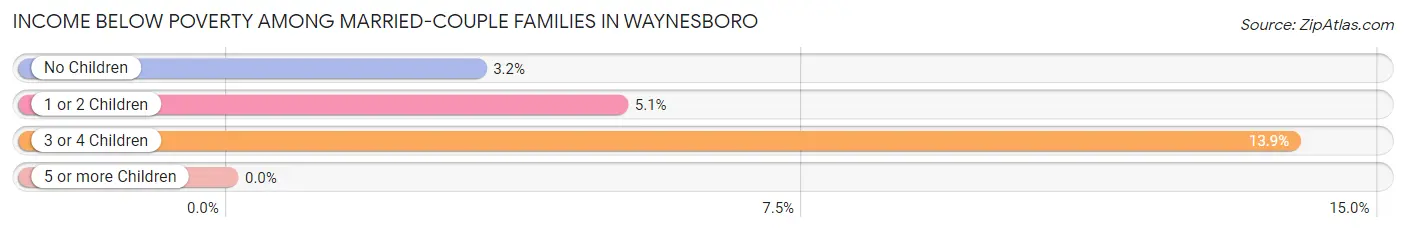
| Children | Above Poverty | Below Poverty |
| No Children | 1,789 (96.8%) | 60 (3.2%) |
| 1 or 2 Children | 950 (94.9%) | 51 (5.1%) |
| 3 or 4 Children | 180 (86.1%) | 29 (13.9%) |
| 5 or more Children | 0 (0.0%) | 0 (0.0%) |
| Total | 2,919 (95.4%) | 140 (4.6%) |
Income Below Poverty Among Single-Parent Households in Waynesboro
According to the poverty data in Waynesboro, 11.5% or 71 single-father households and 37.7% or 589 single-mother households are living below the poverty line. Among single-father households, those with 3 or 4 children have the highest poverty rate, with 25 households (24.3%) experiencing poverty. Likewise, among single-mother households, those with 3 or 4 children have the highest poverty rate, with 140 households (84.9%) falling below the poverty line.
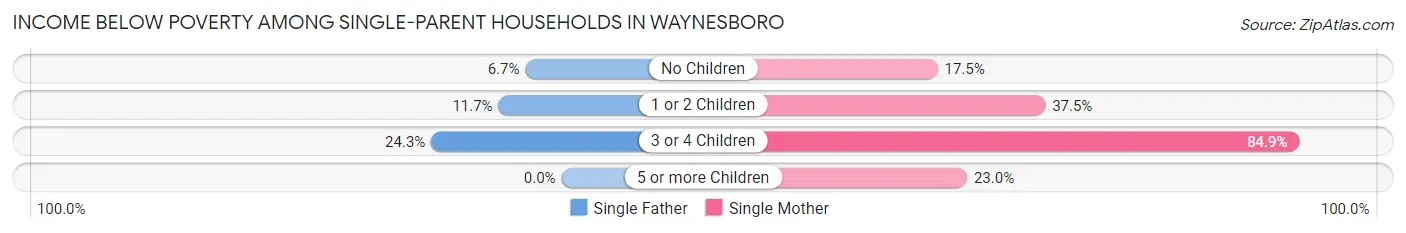
| Children | Single Father | Single Mother |
| No Children | 19 (6.7%) | 57 (17.5%) |
| 1 or 2 Children | 27 (11.7%) | 375 (37.5%) |
| 3 or 4 Children | 25 (24.3%) | 140 (84.9%) |
| 5 or more Children | 0 (0.0%) | 17 (23.0%) |
| Total | 71 (11.5%) | 589 (37.7%) |
Income Below Poverty Among Married-Couple vs Single-Parent Households in Waynesboro
The poverty data for Waynesboro shows that 140 of the married-couple family households (4.6%) and 660 of the single-parent households (30.3%) are living below the poverty level. Within the married-couple family households, those with 3 or 4 children have the highest poverty rate, with 29 households (13.9%) falling below the poverty line. Among the single-parent households, those with 3 or 4 children have the highest poverty rate, with 165 household (61.6%) living below poverty.
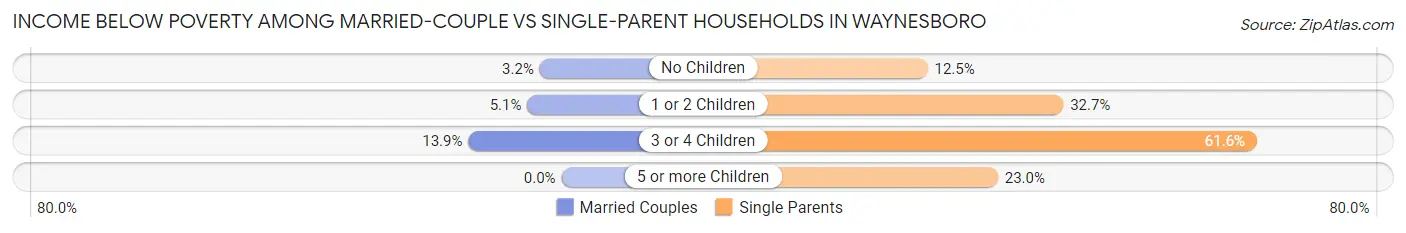
| Children | Married-Couple Families | Single-Parent Households |
| No Children | 60 (3.2%) | 76 (12.5%) |
| 1 or 2 Children | 51 (5.1%) | 402 (32.7%) |
| 3 or 4 Children | 29 (13.9%) | 165 (61.6%) |
| 5 or more Children | 0 (0.0%) | 17 (23.0%) |
| Total | 140 (4.6%) | 660 (30.3%) |
Race in Waynesboro
The most populous races in Waynesboro are White / Caucasian (17,060 | 76.4%), Black / African American (2,363 | 10.6%), and Hispanic or Latino (2,075 | 9.3%).
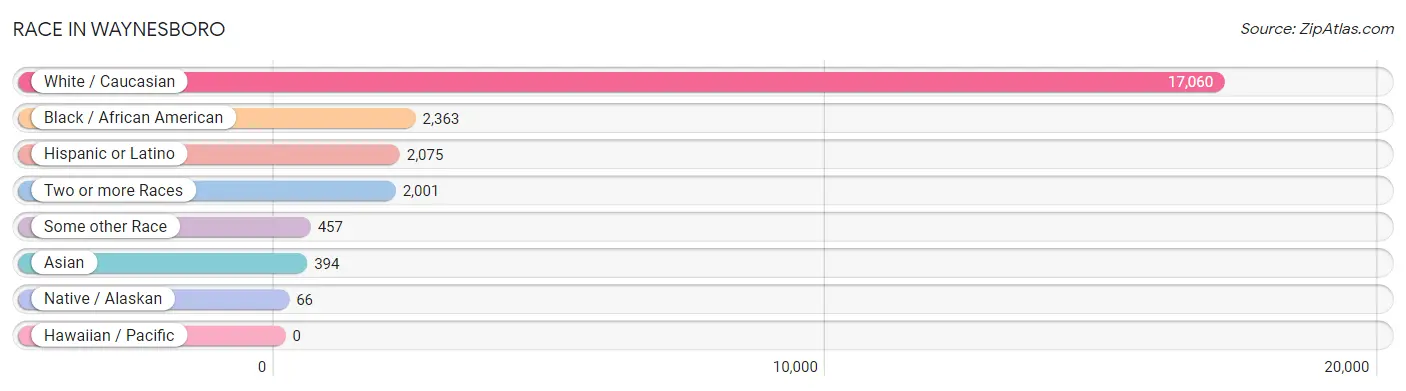
| Race | # Population | % Population |
| Asian | 394 | 1.8% |
| Black / African American | 2,363 | 10.6% |
| Hawaiian / Pacific | 0 | 0.0% |
| Hispanic or Latino | 2,075 | 9.3% |
| Native / Alaskan | 66 | 0.3% |
| White / Caucasian | 17,060 | 76.4% |
| Two or more Races | 2,001 | 9.0% |
| Some other Race | 457 | 2.1% |
| Total | 22,341 | 100.0% |
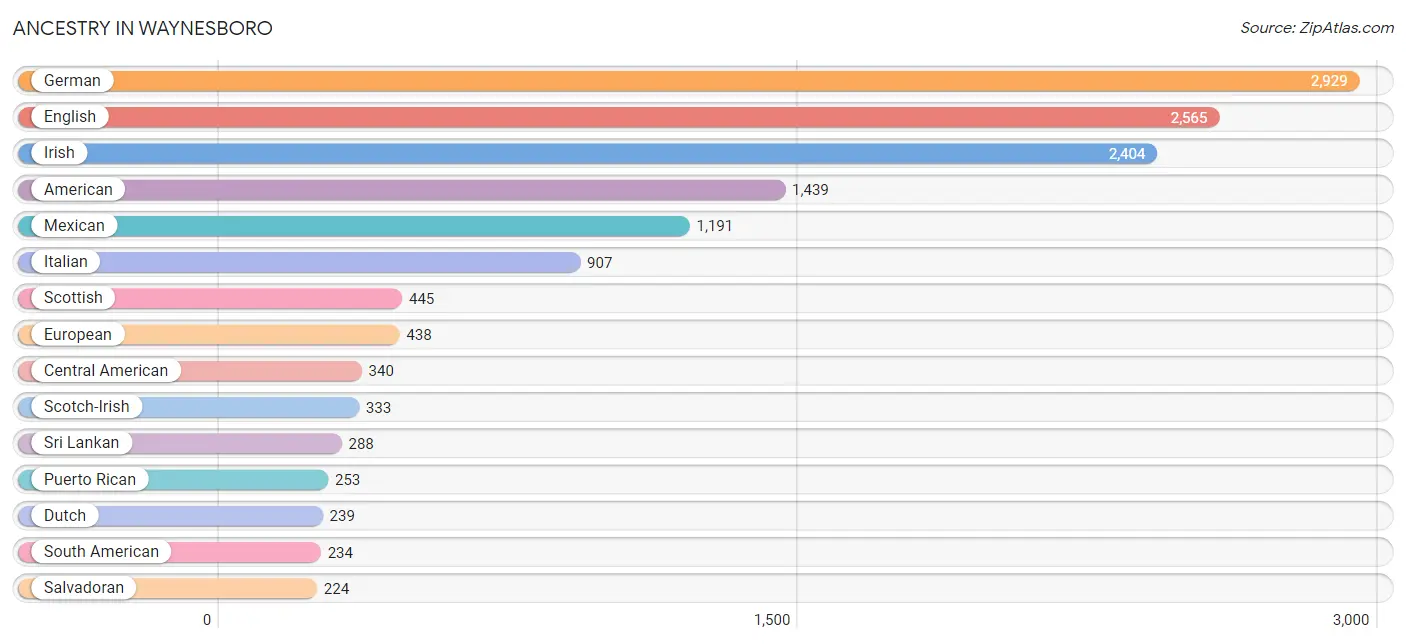
Ancestry in Waynesboro
The most populous ancestries reported in Waynesboro are German (2,929 | 13.1%), English (2,565 | 11.5%), Irish (2,404 | 10.8%), American (1,439 | 6.4%), and Mexican (1,191 | 5.3%), together accounting for 47.1% of all Waynesboro residents.
| Ancestry | # Population | % Population |
| Afghan | 22 | 0.1% |
| Albanian | 34 | 0.2% |
| American | 1,439 | 6.4% |
| Arapaho | 8 | 0.0% |
| Austrian | 14 | 0.1% |
| Belgian | 16 | 0.1% |
| Bhutanese | 55 | 0.3% |
| British | 72 | 0.3% |
| Canadian | 29 | 0.1% |
| Central American | 340 | 1.5% |
| Cherokee | 30 | 0.1% |
| Cheyenne | 1 | 0.0% |
| Colombian | 71 | 0.3% |
| Creek | 8 | 0.0% |
| Czech | 17 | 0.1% |
| Danish | 21 | 0.1% |
| Dutch | 239 | 1.1% |
| Eastern European | 14 | 0.1% |
| English | 2,565 | 11.5% |
| European | 438 | 2.0% |
| Finnish | 16 | 0.1% |
| French | 217 | 1.0% |
| French American Indian | 20 | 0.1% |
| French Canadian | 37 | 0.2% |
| German | 2,929 | 13.1% |
| Greek | 21 | 0.1% |
| Guatemalan | 35 | 0.2% |
| Honduran | 81 | 0.4% |
| Hungarian | 31 | 0.1% |
| Irish | 2,404 | 10.8% |
| Israeli | 19 | 0.1% |
| Italian | 907 | 4.1% |
| Jamaican | 57 | 0.3% |
| Korean | 62 | 0.3% |
| Latvian | 3 | 0.0% |
| Mexican | 1,191 | 5.3% |
| Nigerian | 22 | 0.1% |
| Northern European | 9 | 0.0% |
| Norwegian | 63 | 0.3% |
| Peruvian | 36 | 0.2% |
| Polish | 216 | 1.0% |
| Portuguese | 61 | 0.3% |
| Puerto Rican | 253 | 1.1% |
| Russian | 51 | 0.2% |
| Salvadoran | 224 | 1.0% |
| Scandinavian | 60 | 0.3% |
| Scotch-Irish | 333 | 1.5% |
| Scottish | 445 | 2.0% |
| Slovak | 105 | 0.5% |
| South American | 234 | 1.1% |
| Spanish | 46 | 0.2% |
| Sri Lankan | 288 | 1.3% |
| Subsaharan African | 48 | 0.2% |
| Swedish | 52 | 0.2% |
| Swiss | 38 | 0.2% |
| Ukrainian | 32 | 0.1% |
| Venezuelan | 127 | 0.6% |
| Welsh | 151 | 0.7% |
| Yugoslavian | 18 | 0.1% | View All 59 Rows |
Immigrants in Waynesboro
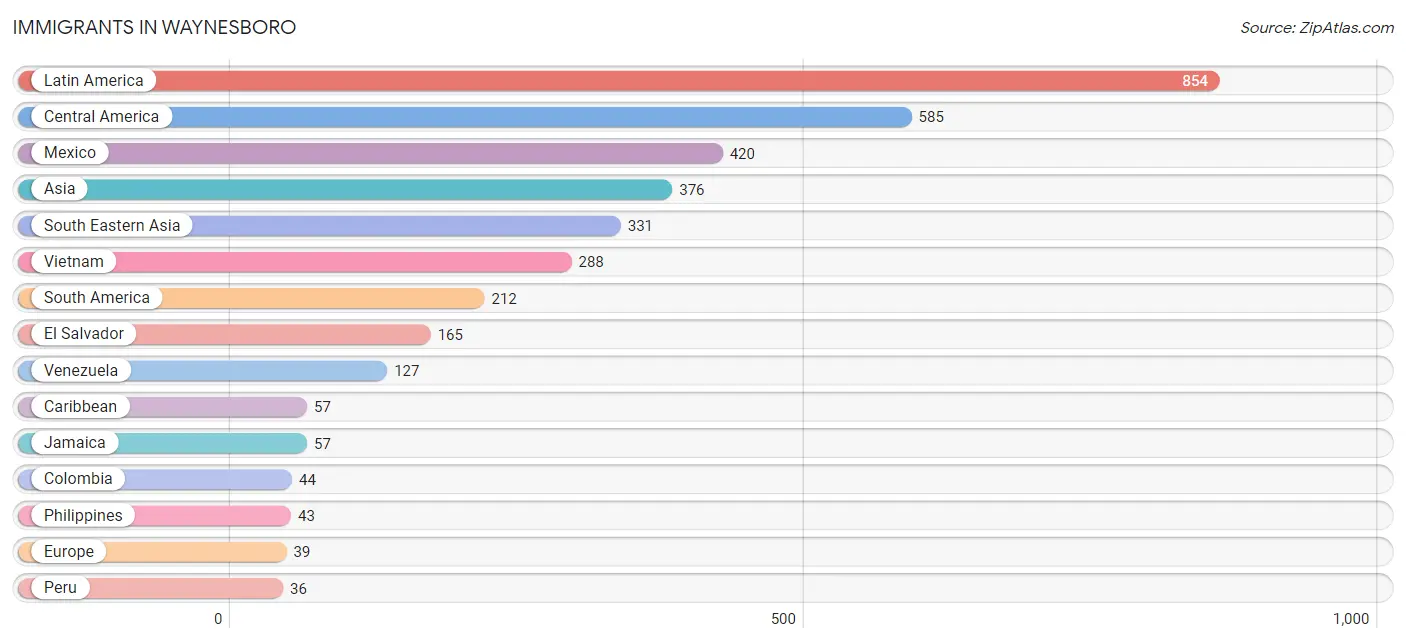
The most numerous immigrant groups reported in Waynesboro came from Latin America (854 | 3.8%), Central America (585 | 2.6%), Mexico (420 | 1.9%), Asia (376 | 1.7%), and South Eastern Asia (331 | 1.5%), together accounting for 11.5% of all Waynesboro residents.
| Immigration Origin | # Population | % Population |
| Afghanistan | 22 | 0.1% |
| Asia | 376 | 1.7% |
| Caribbean | 57 | 0.3% |
| Central America | 585 | 2.6% |
| China | 4 | 0.0% |
| Colombia | 44 | 0.2% |
| Eastern Asia | 4 | 0.0% |
| El Salvador | 165 | 0.7% |
| England | 12 | 0.1% |
| Europe | 39 | 0.2% |
| Germany | 27 | 0.1% |
| Guyana | 5 | 0.0% |
| Israel | 19 | 0.1% |
| Jamaica | 57 | 0.3% |
| Latin America | 854 | 3.8% |
| Mexico | 420 | 1.9% |
| Northern Europe | 12 | 0.1% |
| Peru | 36 | 0.2% |
| Philippines | 43 | 0.2% |
| South America | 212 | 0.9% |
| South Central Asia | 22 | 0.1% |
| South Eastern Asia | 331 | 1.5% |
| Venezuela | 127 | 0.6% |
| Vietnam | 288 | 1.3% |
| Western Asia | 19 | 0.1% |
| Western Europe | 27 | 0.1% | View All 26 Rows |
Sex and Age in Waynesboro
Sex and Age in Waynesboro
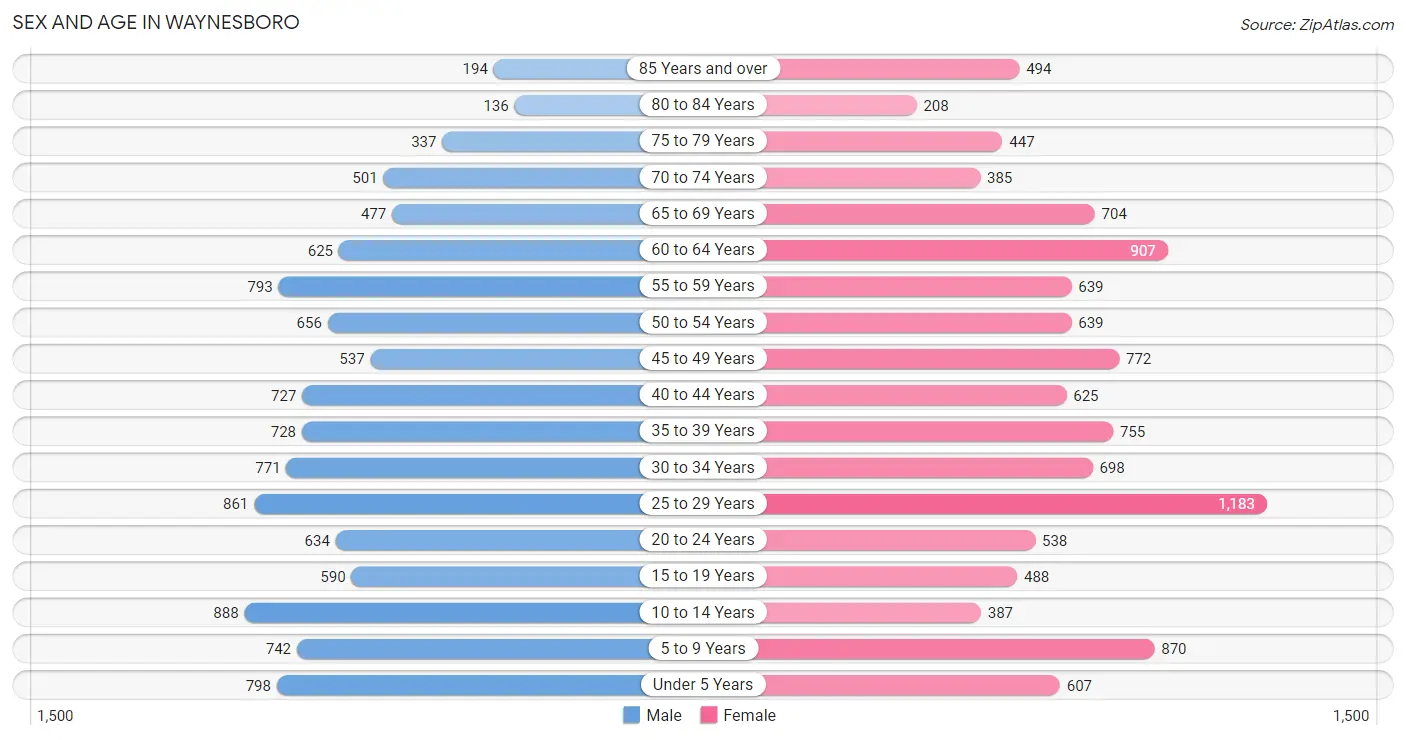
The most populous age groups in Waynesboro are 10 to 14 Years (888 | 8.1%) for men and 25 to 29 Years (1,183 | 10.4%) for women.
| Age Bracket | Male | Female |
| Under 5 Years | 798 (7.3%) | 607 (5.3%) |
| 5 to 9 Years | 742 (6.8%) | 870 (7.7%) |
| 10 to 14 Years | 888 (8.1%) | 387 (3.4%) |
| 15 to 19 Years | 590 (5.4%) | 488 (4.3%) |
| 20 to 24 Years | 634 (5.8%) | 538 (4.7%) |
| 25 to 29 Years | 861 (7.8%) | 1,183 (10.4%) |
| 30 to 34 Years | 771 (7.0%) | 698 (6.1%) |
| 35 to 39 Years | 728 (6.6%) | 755 (6.7%) |
| 40 to 44 Years | 727 (6.6%) | 625 (5.5%) |
| 45 to 49 Years | 537 (4.9%) | 772 (6.8%) |
| 50 to 54 Years | 656 (6.0%) | 639 (5.6%) |
| 55 to 59 Years | 793 (7.2%) | 639 (5.6%) |
| 60 to 64 Years | 625 (5.7%) | 907 (8.0%) |
| 65 to 69 Years | 477 (4.3%) | 704 (6.2%) |
| 70 to 74 Years | 501 (4.6%) | 385 (3.4%) |
| 75 to 79 Years | 337 (3.1%) | 447 (3.9%) |
| 80 to 84 Years | 136 (1.2%) | 208 (1.8%) |
| 85 Years and over | 194 (1.8%) | 494 (4.3%) |
| Total | 10,995 (100.0%) | 11,346 (100.0%) |
Families and Households in Waynesboro
Median Family Size in Waynesboro
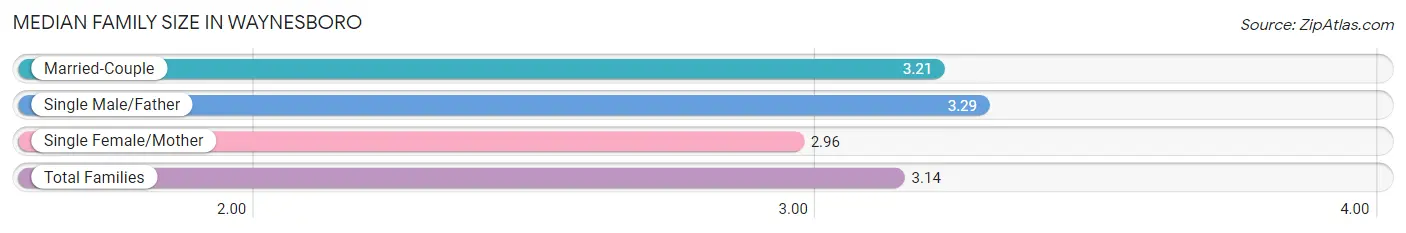
The median family size in Waynesboro is 3.14 persons per family, with single male/father families (615 | 11.7%) accounting for the largest median family size of 3.29 persons per family. On the other hand, single female/mother families (1,564 | 29.9%) represent the smallest median family size with 2.96 persons per family.
| Family Type | # Families | Family Size |
| Married-Couple | 3,059 (58.4%) | 3.21 |
| Single Male/Father | 615 (11.7%) | 3.29 |
| Single Female/Mother | 1,564 (29.9%) | 2.96 |
| Total Families | 5,238 (100.0%) | 3.14 |
Median Household Size in Waynesboro
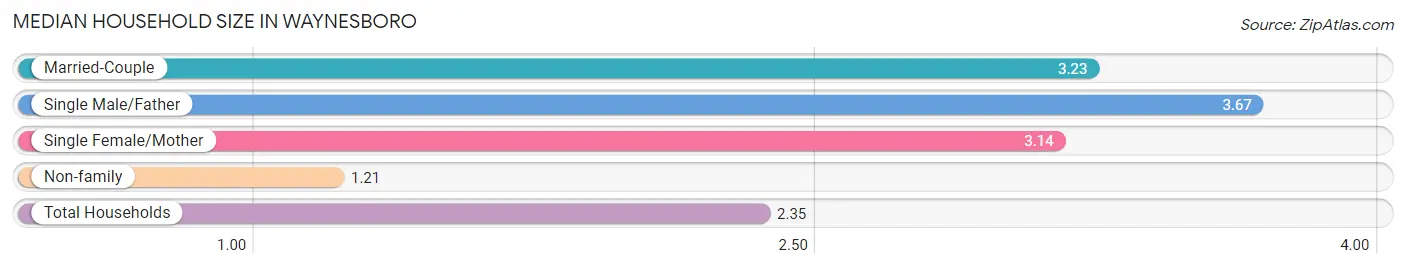
The median household size in Waynesboro is 2.35 persons per household, with single male/father households (615 | 6.5%) accounting for the largest median household size of 3.67 persons per household. non-family households (4,193 | 44.5%) represent the smallest median household size with 1.21 persons per household.
| Household Type | # Households | Household Size |
| Married-Couple | 3,059 (32.4%) | 3.23 |
| Single Male/Father | 615 (6.5%) | 3.67 |
| Single Female/Mother | 1,564 (16.6%) | 3.14 |
| Non-family | 4,193 (44.5%) | 1.21 |
| Total Households | 9,431 (100.0%) | 2.35 |
Household Size by Marriage Status in Waynesboro
Out of a total of 9,431 households in Waynesboro, 5,238 (55.5%) are family households, while 4,193 (44.5%) are nonfamily households. The most numerous type of family households are 2-person households, comprising 2,462, and the most common type of nonfamily households are 1-person households, comprising 3,591.
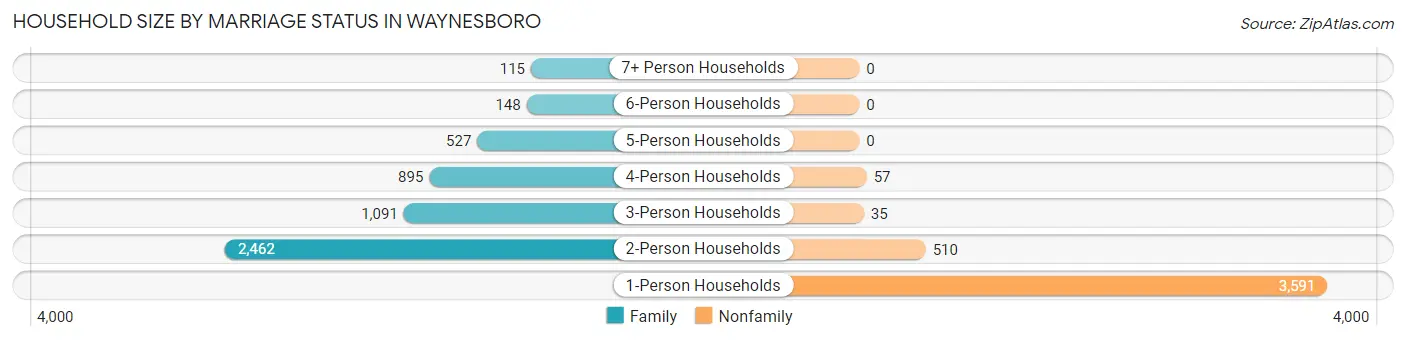
| Household Size | Family Households | Nonfamily Households |
| 1-Person Households | - | 3,591 (38.1%) |
| 2-Person Households | 2,462 (26.1%) | 510 (5.4%) |
| 3-Person Households | 1,091 (11.6%) | 35 (0.4%) |
| 4-Person Households | 895 (9.5%) | 57 (0.6%) |
| 5-Person Households | 527 (5.6%) | 0 (0.0%) |
| 6-Person Households | 148 (1.6%) | 0 (0.0%) |
| 7+ Person Households | 115 (1.2%) | 0 (0.0%) |
| Total | 5,238 (55.5%) | 4,193 (44.5%) |
Female Fertility in Waynesboro
Fertility by Age in Waynesboro
Average fertility rate in Waynesboro is 28.0 births per 1,000 women. Women in the age bracket of 20 to 34 years have the highest fertility rate with 54.0 births per 1,000 women. Women in the age bracket of 20 to 34 years acount for 89.7% of all women with births.
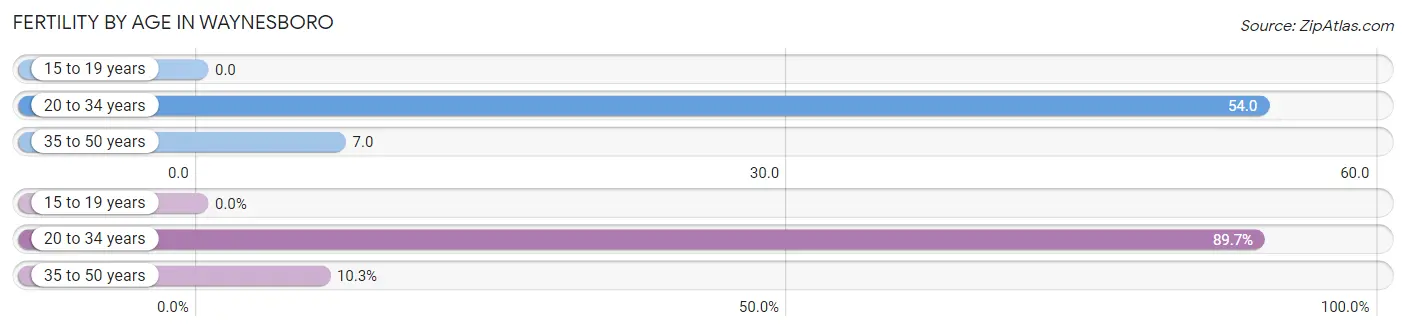
| Age Bracket | Women with Births | Births / 1,000 Women |
| 15 to 19 years | 0 (0.0%) | 0.0 |
| 20 to 34 years | 130 (89.7%) | 54.0 |
| 35 to 50 years | 15 (10.3%) | 7.0 |
| Total | 145 (100.0%) | 28.0 |
Fertility by Age by Marriage Status in Waynesboro
29.0% of women with births (145) in Waynesboro are married. The highest percentage of unmarried women with births falls into 35 to 50 years age bracket with 100.0% of them unmarried at the time of birth, while the lowest percentage of unmarried women with births belong to 20 to 34 years age bracket with 67.7% of them unmarried.
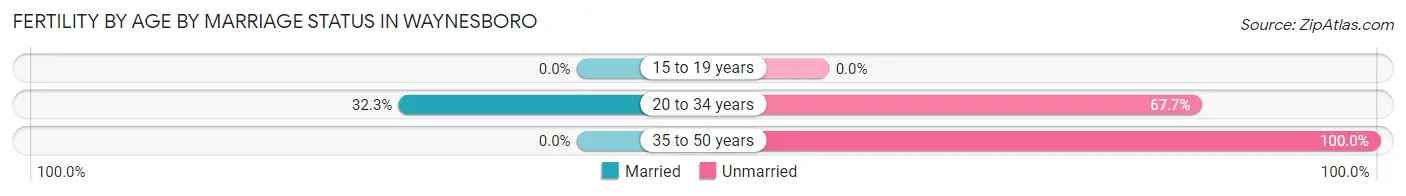
| Age Bracket | Married | Unmarried |
| 15 to 19 years | 0 (0.0%) | 0 (0.0%) |
| 20 to 34 years | 42 (32.3%) | 88 (67.7%) |
| 35 to 50 years | 0 (0.0%) | 15 (100.0%) |
| Total | 42 (29.0%) | 103 (71.0%) |
Fertility by Education in Waynesboro
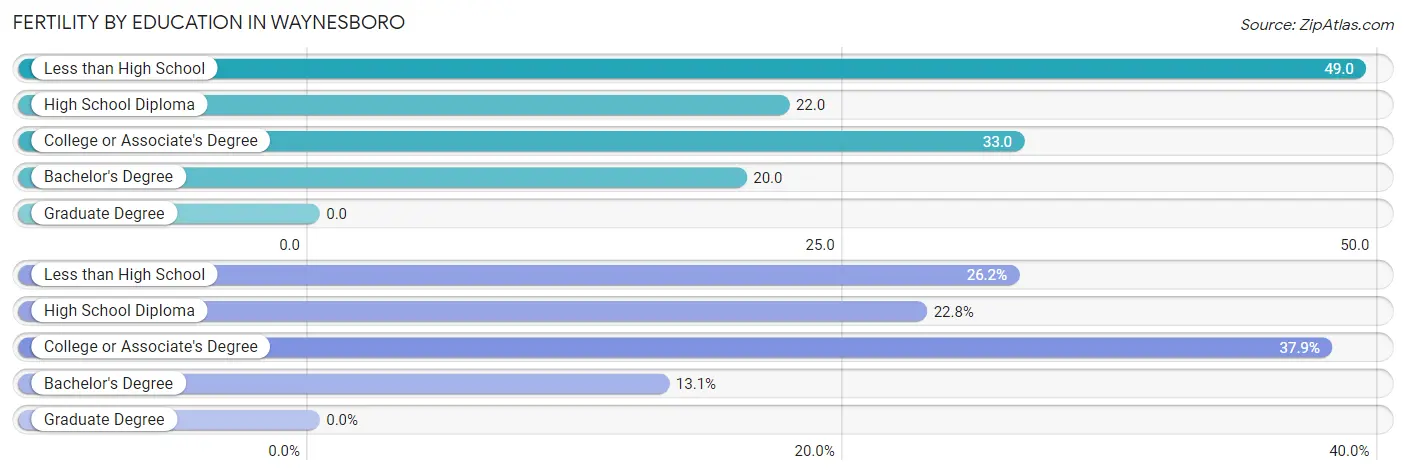
| Educational Attainment | Women with Births | Births / 1,000 Women |
| Less than High School | 38 (26.2%) | 49.0 |
| High School Diploma | 33 (22.8%) | 22.0 |
| College or Associate's Degree | 55 (37.9%) | 33.0 |
| Bachelor's Degree | 19 (13.1%) | 20.0 |
| Graduate Degree | 0 (0.0%) | 0.0 |
| Total | 145 (100.0%) | 28.0 |
Fertility by Education by Marriage Status in Waynesboro
71.0% of women with births in Waynesboro are unmarried. Women with the educational attainment of bachelor's degree are most likely to be married with 100.0% of them married at childbirth, while women with the educational attainment of high school diploma are least likely to be married with 100.0% of them unmarried at childbirth.
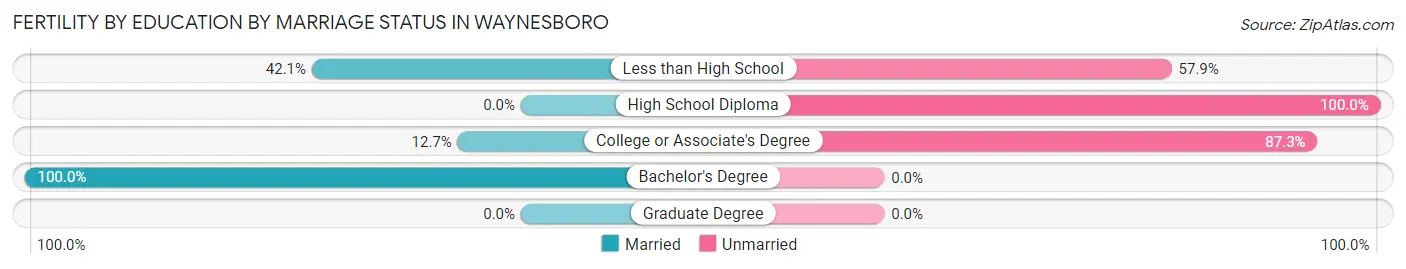
| Educational Attainment | Married | Unmarried |
| Less than High School | 16 (42.1%) | 22 (57.9%) |
| High School Diploma | 0 (0.0%) | 33 (100.0%) |
| College or Associate's Degree | 7 (12.7%) | 48 (87.3%) |
| Bachelor's Degree | 19 (100.0%) | 0 (0.0%) |
| Graduate Degree | 0 (0.0%) | 0 (0.0%) |
| Total | 42 (29.0%) | 103 (71.0%) |
Employment Characteristics in Waynesboro
Employment by Class of Employer in Waynesboro
Among the 10,864 employed individuals in Waynesboro, private company employees (7,400 | 68.1%), not-for-profit organizations (923 | 8.5%), and local government employees (718 | 6.6%) make up the most common classes of employment.
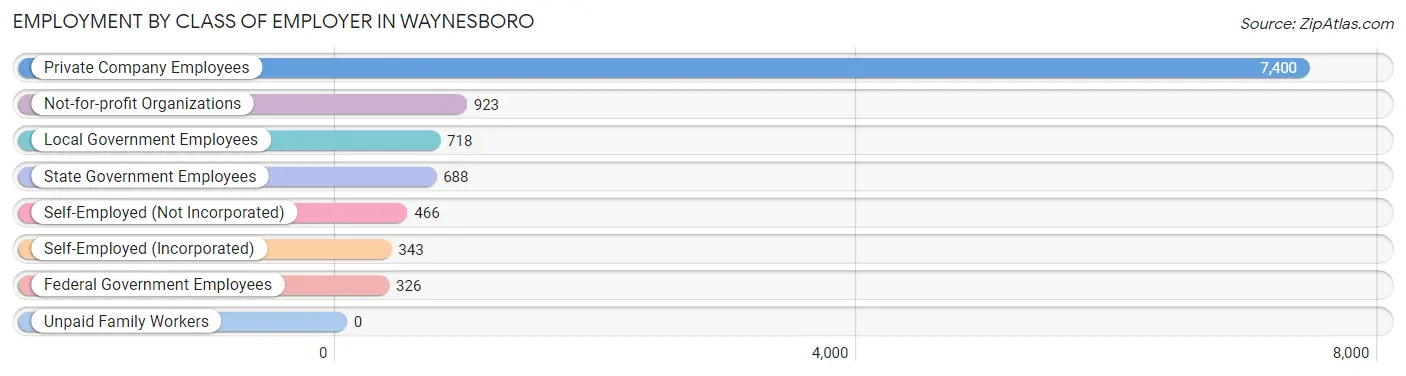
| Employer Class | # Employees | % Employees |
| Private Company Employees | 7,400 | 68.1% |
| Self-Employed (Incorporated) | 343 | 3.2% |
| Self-Employed (Not Incorporated) | 466 | 4.3% |
| Not-for-profit Organizations | 923 | 8.5% |
| Local Government Employees | 718 | 6.6% |
| State Government Employees | 688 | 6.3% |
| Federal Government Employees | 326 | 3.0% |
| Unpaid Family Workers | 0 | 0.0% |
| Total | 10,864 | 100.0% |
Employment Status by Age in Waynesboro
According to the labor force statistics for Waynesboro, out of the total population over 16 years of age (17,750), 64.8% or 11,502 individuals are in the labor force, with 4.7% or 541 of them unemployed. The age group with the highest labor force participation rate is 30 to 34 years, with 88.8% or 1,304 individuals in the labor force. Within the labor force, the 16 to 19 years age range has the highest percentage of unemployed individuals, with 26.5% or 101 of them being unemployed.
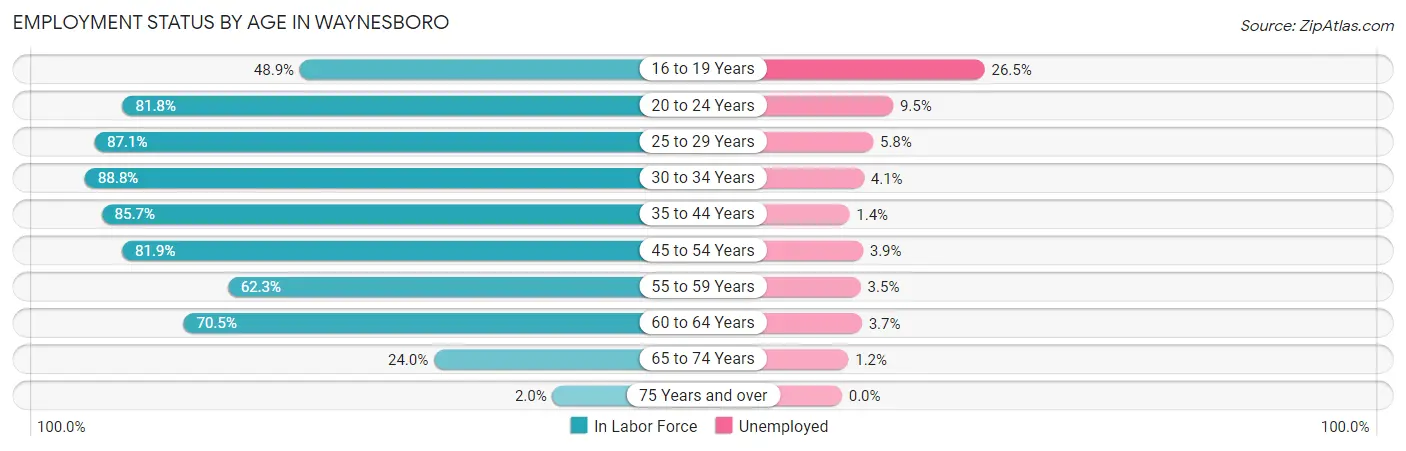
| Age Bracket | In Labor Force | Unemployed |
| 16 to 19 Years | 381 (48.9%) | 101 (26.5%) |
| 20 to 24 Years | 959 (81.8%) | 91 (9.5%) |
| 25 to 29 Years | 1,780 (87.1%) | 103 (5.8%) |
| 30 to 34 Years | 1,304 (88.8%) | 53 (4.1%) |
| 35 to 44 Years | 2,430 (85.7%) | 34 (1.4%) |
| 45 to 54 Years | 2,133 (81.9%) | 83 (3.9%) |
| 55 to 59 Years | 892 (62.3%) | 31 (3.5%) |
| 60 to 64 Years | 1,080 (70.5%) | 40 (3.7%) |
| 65 to 74 Years | 496 (24.0%) | 6 (1.2%) |
| 75 Years and over | 36 (2.0%) | 0 (0.0%) |
| Total | 11,502 (64.8%) | 541 (4.7%) |
Employment Status by Educational Attainment in Waynesboro
According to labor force statistics for Waynesboro, 80.7% of individuals (9,616) out of the total population between 25 and 64 years of age (11,916) are in the labor force, with 3.6% or 346 of them being unemployed. The group with the highest labor force participation rate are those with the educational attainment of bachelor's degree or higher, with 92.0% or 3,054 individuals in the labor force. Within the labor force, individuals with less than high school education have the highest percentage of unemployment, with 7.3% or 68 of them being unemployed.
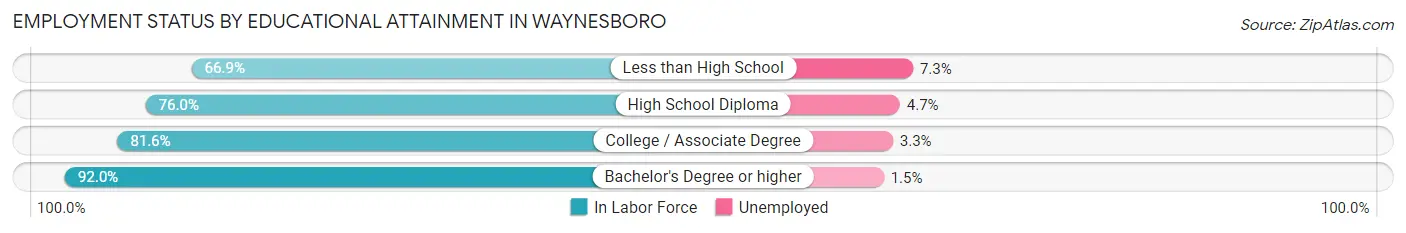
| Educational Attainment | In Labor Force | Unemployed |
| Less than High School | 931 (66.9%) | 102 (7.3%) |
| High School Diploma | 3,287 (76.0%) | 203 (4.7%) |
| College / Associate Degree | 2,349 (81.6%) | 95 (3.3%) |
| Bachelor's Degree or higher | 3,054 (92.0%) | 50 (1.5%) |
| Total | 9,616 (80.7%) | 429 (3.6%) |
Employment Occupations by Sex in Waynesboro
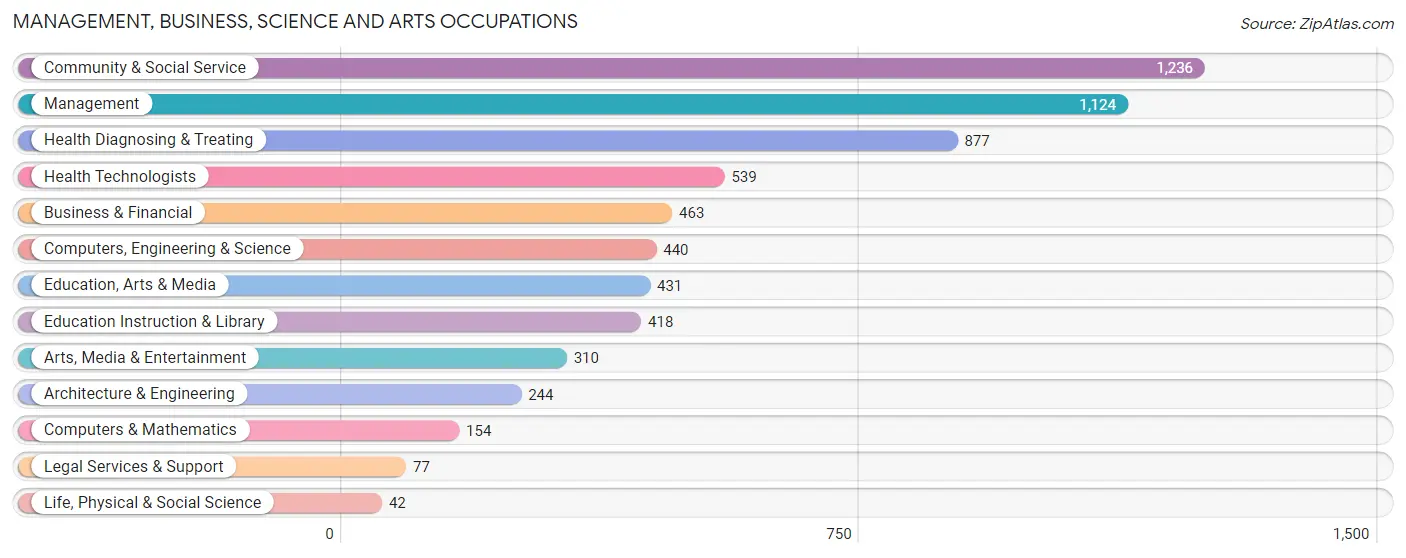
Management, Business, Science and Arts Occupations
The most common Management, Business, Science and Arts occupations in Waynesboro are Community & Social Service (1,236 | 11.3%), Management (1,124 | 10.3%), Health Diagnosing & Treating (877 | 8.1%), Health Technologists (539 | 5.0%), and Business & Financial (463 | 4.3%).
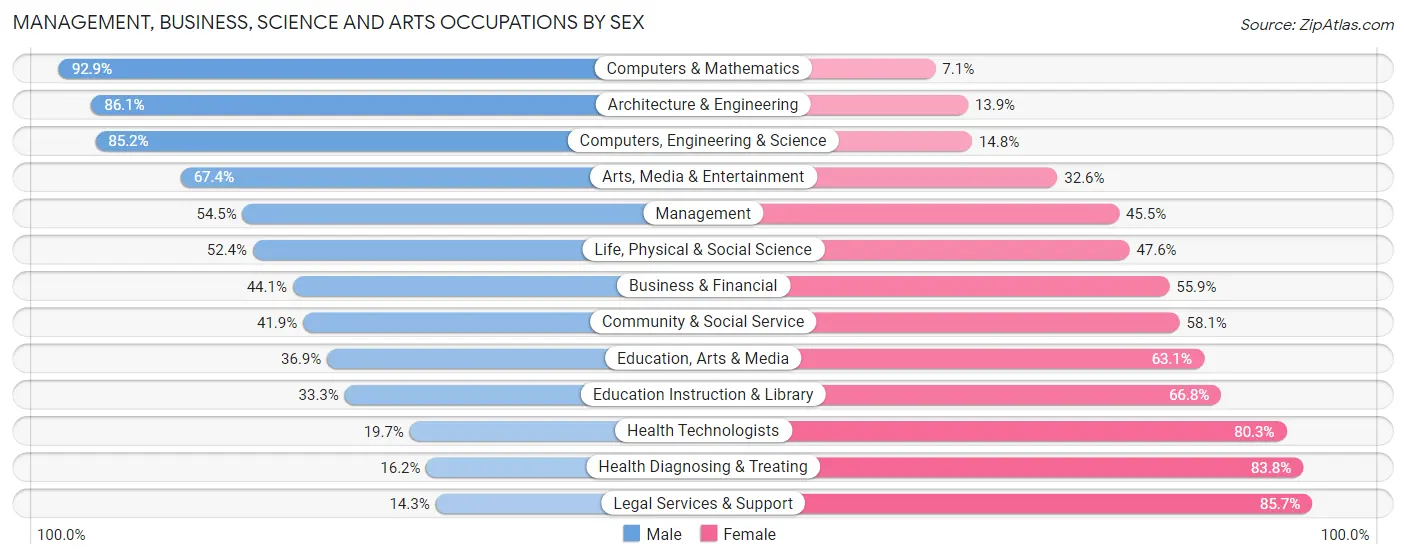
Management, Business, Science and Arts Occupations by Sex
Within the Management, Business, Science and Arts occupations in Waynesboro, the most male-oriented occupations are Computers & Mathematics (92.9%), Architecture & Engineering (86.1%), and Computers, Engineering & Science (85.2%), while the most female-oriented occupations are Legal Services & Support (85.7%), Health Diagnosing & Treating (83.8%), and Health Technologists (80.3%).
| Occupation | Male | Female |
| Management | 613 (54.5%) | 511 (45.5%) |
| Business & Financial | 204 (44.1%) | 259 (55.9%) |
| Computers, Engineering & Science | 375 (85.2%) | 65 (14.8%) |
| Computers & Mathematics | 143 (92.9%) | 11 (7.1%) |
| Architecture & Engineering | 210 (86.1%) | 34 (13.9%) |
| Life, Physical & Social Science | 22 (52.4%) | 20 (47.6%) |
| Community & Social Service | 518 (41.9%) | 718 (58.1%) |
| Education, Arts & Media | 159 (36.9%) | 272 (63.1%) |
| Legal Services & Support | 11 (14.3%) | 66 (85.7%) |
| Education Instruction & Library | 139 (33.3%) | 279 (66.7%) |
| Arts, Media & Entertainment | 209 (67.4%) | 101 (32.6%) |
| Health Diagnosing & Treating | 142 (16.2%) | 735 (83.8%) |
| Health Technologists | 106 (19.7%) | 433 (80.3%) |
| Total (Category) | 1,852 (44.7%) | 2,288 (55.3%) |
| Total (Overall) | 5,377 (49.3%) | 5,518 (50.6%) |
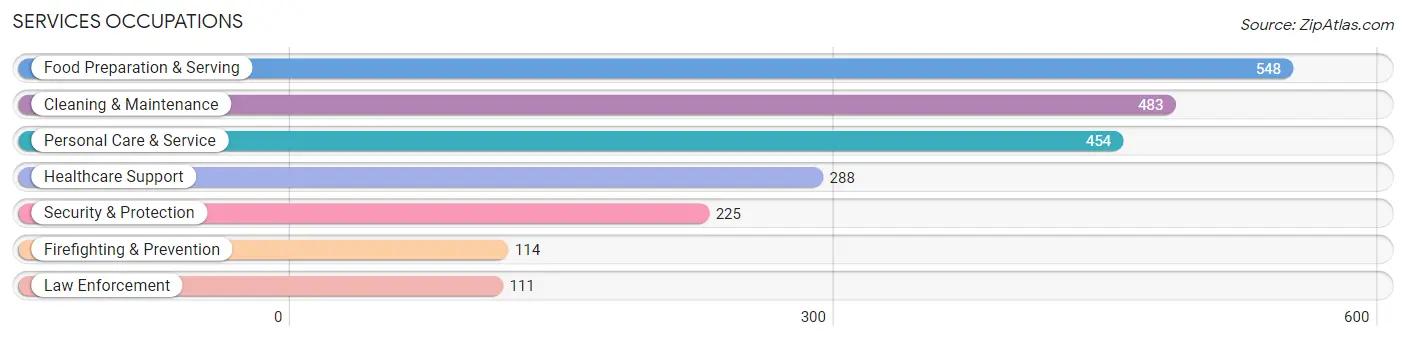
Services Occupations
The most common Services occupations in Waynesboro are Food Preparation & Serving (548 | 5.0%), Cleaning & Maintenance (483 | 4.4%), Personal Care & Service (454 | 4.2%), Healthcare Support (288 | 2.6%), and Security & Protection (225 | 2.1%).
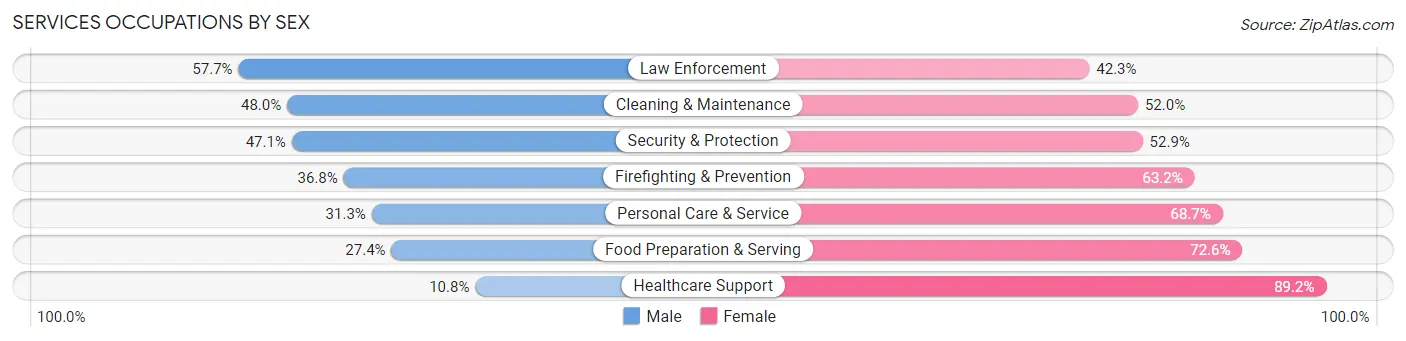
Services Occupations by Sex
Within the Services occupations in Waynesboro, the most male-oriented occupations are Law Enforcement (57.7%), Cleaning & Maintenance (48.0%), and Security & Protection (47.1%), while the most female-oriented occupations are Healthcare Support (89.2%), Food Preparation & Serving (72.6%), and Personal Care & Service (68.7%).
| Occupation | Male | Female |
| Healthcare Support | 31 (10.8%) | 257 (89.2%) |
| Security & Protection | 106 (47.1%) | 119 (52.9%) |
| Firefighting & Prevention | 42 (36.8%) | 72 (63.2%) |
| Law Enforcement | 64 (57.7%) | 47 (42.3%) |
| Food Preparation & Serving | 150 (27.4%) | 398 (72.6%) |
| Cleaning & Maintenance | 232 (48.0%) | 251 (52.0%) |
| Personal Care & Service | 142 (31.3%) | 312 (68.7%) |
| Total (Category) | 661 (33.1%) | 1,337 (66.9%) |
| Total (Overall) | 5,377 (49.3%) | 5,518 (50.6%) |
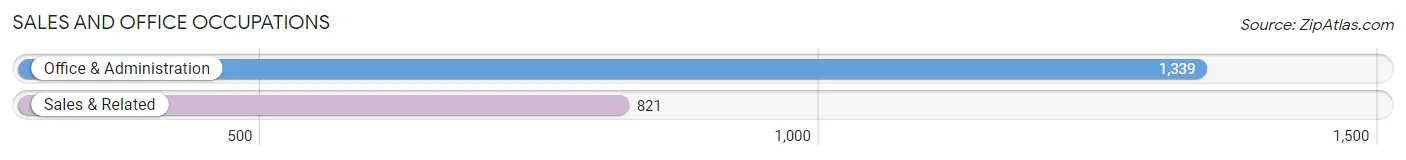
Sales and Office Occupations
The most common Sales and Office occupations in Waynesboro are Office & Administration (1,339 | 12.3%), and Sales & Related (821 | 7.5%).
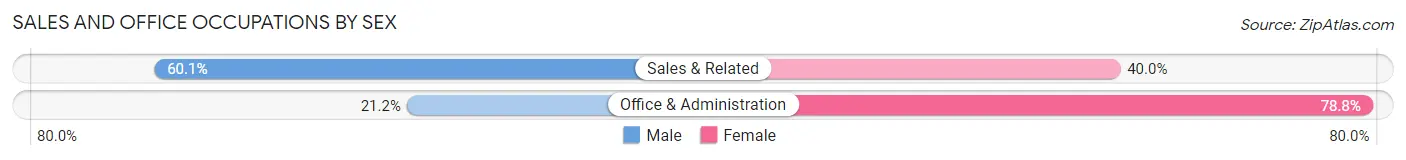
Sales and Office Occupations by Sex
| Occupation | Male | Female |
| Sales & Related | 493 (60.1%) | 328 (40.0%) |
| Office & Administration | 284 (21.2%) | 1,055 (78.8%) |
| Total (Category) | 777 (36.0%) | 1,383 (64.0%) |
| Total (Overall) | 5,377 (49.3%) | 5,518 (50.6%) |
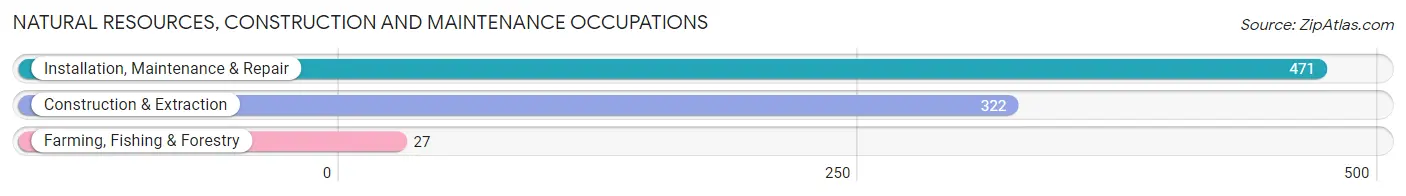
Natural Resources, Construction and Maintenance Occupations
The most common Natural Resources, Construction and Maintenance occupations in Waynesboro are Installation, Maintenance & Repair (471 | 4.3%), Construction & Extraction (322 | 3.0%), and Farming, Fishing & Forestry (27 | 0.3%).
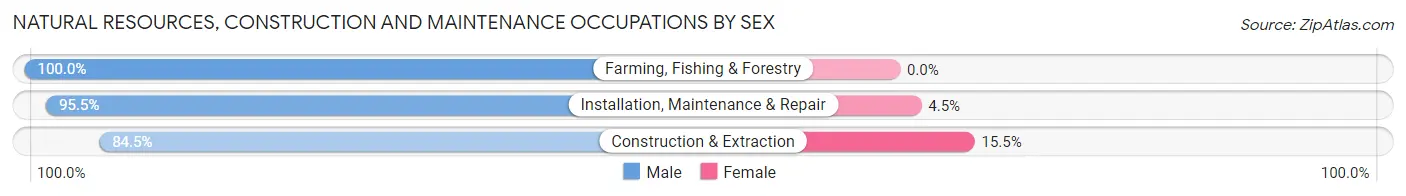
Natural Resources, Construction and Maintenance Occupations by Sex
| Occupation | Male | Female |
| Farming, Fishing & Forestry | 27 (100.0%) | 0 (0.0%) |
| Construction & Extraction | 272 (84.5%) | 50 (15.5%) |
| Installation, Maintenance & Repair | 450 (95.5%) | 21 (4.5%) |
| Total (Category) | 749 (91.3%) | 71 (8.7%) |
| Total (Overall) | 5,377 (49.3%) | 5,518 (50.6%) |
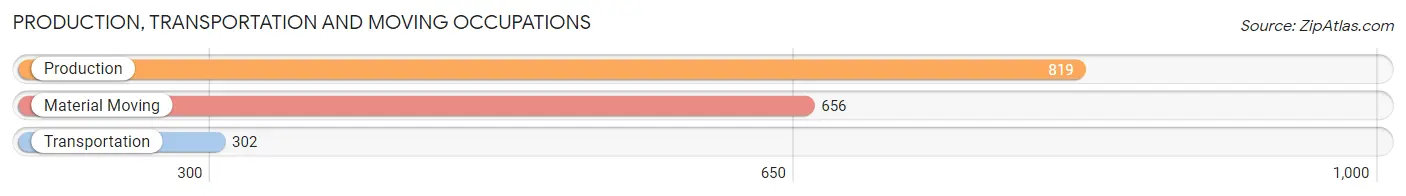
Production, Transportation and Moving Occupations
The most common Production, Transportation and Moving occupations in Waynesboro are Production (819 | 7.5%), Material Moving (656 | 6.0%), and Transportation (302 | 2.8%).
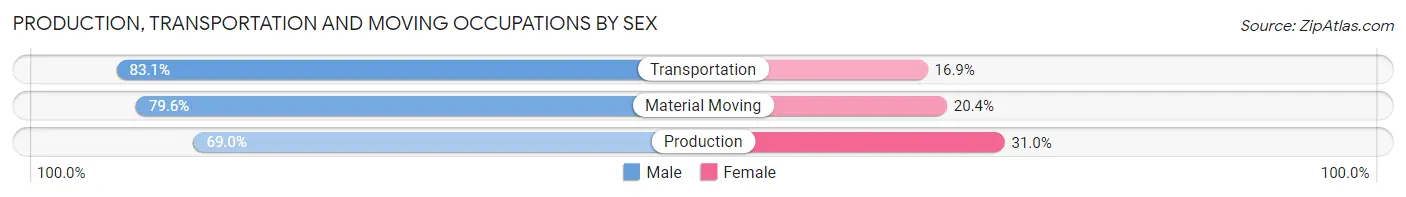
Production, Transportation and Moving Occupations by Sex
| Occupation | Male | Female |
| Production | 565 (69.0%) | 254 (31.0%) |
| Transportation | 251 (83.1%) | 51 (16.9%) |
| Material Moving | 522 (79.6%) | 134 (20.4%) |
| Total (Category) | 1,338 (75.3%) | 439 (24.7%) |
| Total (Overall) | 5,377 (49.3%) | 5,518 (50.6%) |
Employment Industries by Sex in Waynesboro
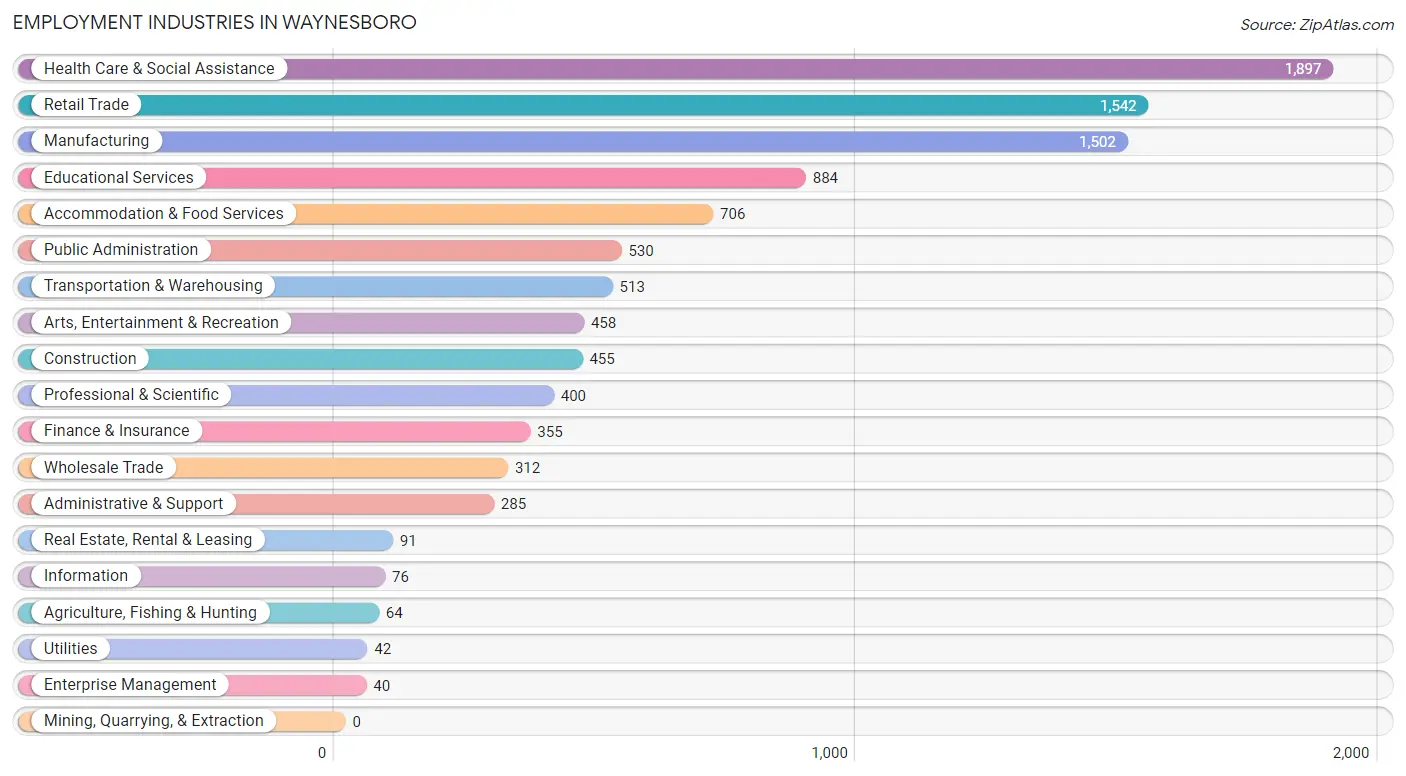
Employment Industries in Waynesboro
The major employment industries in Waynesboro include Health Care & Social Assistance (1,897 | 17.4%), Retail Trade (1,542 | 14.1%), Manufacturing (1,502 | 13.8%), Educational Services (884 | 8.1%), and Accommodation & Food Services (706 | 6.5%).
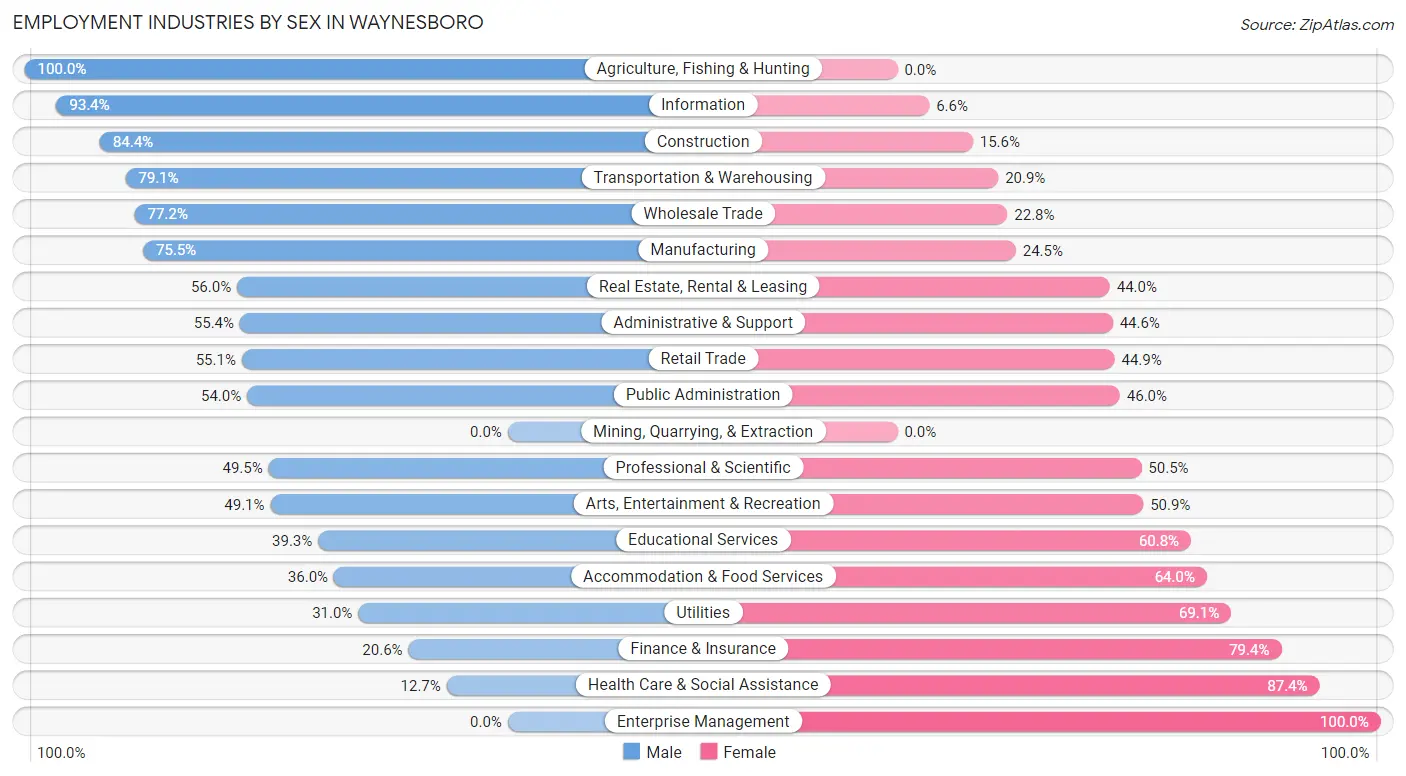
Employment Industries by Sex in Waynesboro
The Waynesboro industries that see more men than women are Agriculture, Fishing & Hunting (100.0%), Information (93.4%), and Construction (84.4%), whereas the industries that tend to have a higher number of women are Enterprise Management (100.0%), Health Care & Social Assistance (87.4%), and Finance & Insurance (79.4%).
| Industry | Male | Female |
| Agriculture, Fishing & Hunting | 64 (100.0%) | 0 (0.0%) |
| Mining, Quarrying, & Extraction | 0 (0.0%) | 0 (0.0%) |
| Construction | 384 (84.4%) | 71 (15.6%) |
| Manufacturing | 1,134 (75.5%) | 368 (24.5%) |
| Wholesale Trade | 241 (77.2%) | 71 (22.8%) |
| Retail Trade | 849 (55.1%) | 693 (44.9%) |
| Transportation & Warehousing | 406 (79.1%) | 107 (20.9%) |
| Utilities | 13 (30.9%) | 29 (69.1%) |
| Information | 71 (93.4%) | 5 (6.6%) |
| Finance & Insurance | 73 (20.6%) | 282 (79.4%) |
| Real Estate, Rental & Leasing | 51 (56.0%) | 40 (44.0%) |
| Professional & Scientific | 198 (49.5%) | 202 (50.5%) |
| Enterprise Management | 0 (0.0%) | 40 (100.0%) |
| Administrative & Support | 158 (55.4%) | 127 (44.6%) |
| Educational Services | 347 (39.3%) | 537 (60.8%) |
| Health Care & Social Assistance | 240 (12.7%) | 1,657 (87.4%) |
| Arts, Entertainment & Recreation | 225 (49.1%) | 233 (50.9%) |
| Accommodation & Food Services | 254 (36.0%) | 452 (64.0%) |
| Public Administration | 286 (54.0%) | 244 (46.0%) |
| Total | 5,377 (49.3%) | 5,518 (50.6%) |
Education in Waynesboro
School Enrollment in Waynesboro
The most common levels of schooling among the 4,869 students in Waynesboro are elementary school (1,164 | 23.9%), middle school (1,062 | 21.8%), and high school (958 | 19.7%).
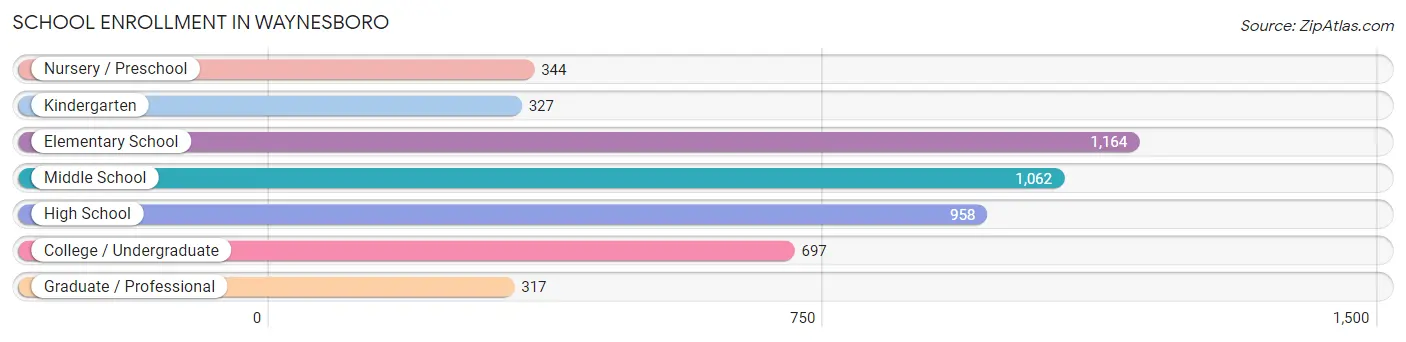
| School Level | # Students | % Students |
| Nursery / Preschool | 344 | 7.1% |
| Kindergarten | 327 | 6.7% |
| Elementary School | 1,164 | 23.9% |
| Middle School | 1,062 | 21.8% |
| High School | 958 | 19.7% |
| College / Undergraduate | 697 | 14.3% |
| Graduate / Professional | 317 | 6.5% |
| Total | 4,869 | 100.0% |
School Enrollment by Age by Funding Source in Waynesboro
Out of a total of 4,869 students who are enrolled in schools in Waynesboro, 769 (15.8%) attend a private institution, while the remaining 4,100 (84.2%) are enrolled in public schools. The age group of 20 to 24 year olds has the highest likelihood of being enrolled in private schools, with 102 (40.6% in the age bracket) enrolled. Conversely, the age group of 5 to 9 year old has the lowest likelihood of being enrolled in a private school, with 1,425 (91.5% in the age bracket) attending a public institution.
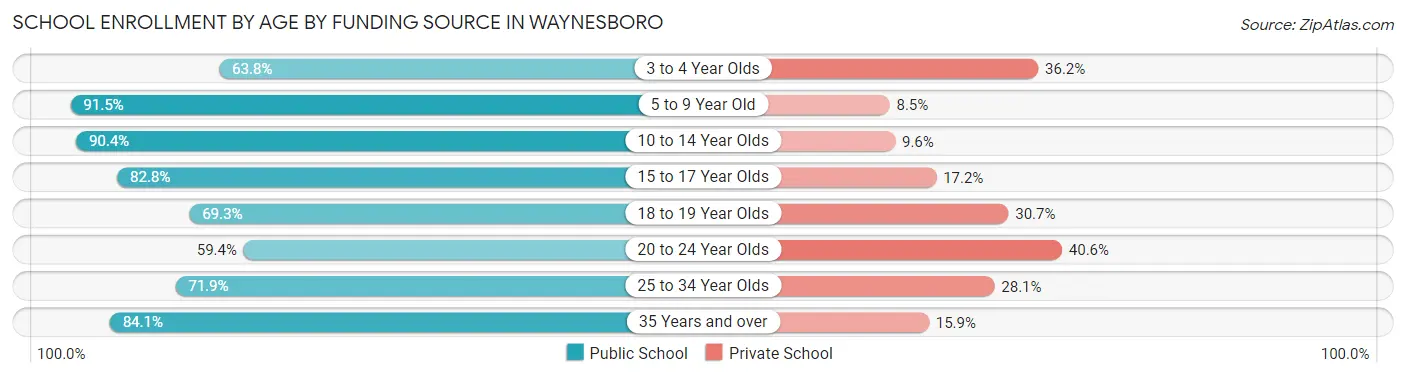
| Age Bracket | Public School | Private School |
| 3 to 4 Year Olds | 162 (63.8%) | 92 (36.2%) |
| 5 to 9 Year Old | 1,425 (91.5%) | 133 (8.5%) |
| 10 to 14 Year Olds | 1,153 (90.4%) | 122 (9.6%) |
| 15 to 17 Year Olds | 567 (82.8%) | 118 (17.2%) |
| 18 to 19 Year Olds | 113 (69.3%) | 50 (30.7%) |
| 20 to 24 Year Olds | 149 (59.4%) | 102 (40.6%) |
| 25 to 34 Year Olds | 269 (71.9%) | 105 (28.1%) |
| 35 Years and over | 260 (84.1%) | 49 (15.9%) |
| Total | 4,100 (84.2%) | 769 (15.8%) |
Educational Attainment by Field of Study in Waynesboro
Business (655 | 13.7%), science & technology (498 | 10.4%), education (443 | 9.3%), arts & humanities (443 | 9.3%), and visual & performing arts (422 | 8.8%) are the most common fields of study among 4,778 individuals in Waynesboro who have obtained a bachelor's degree or higher.
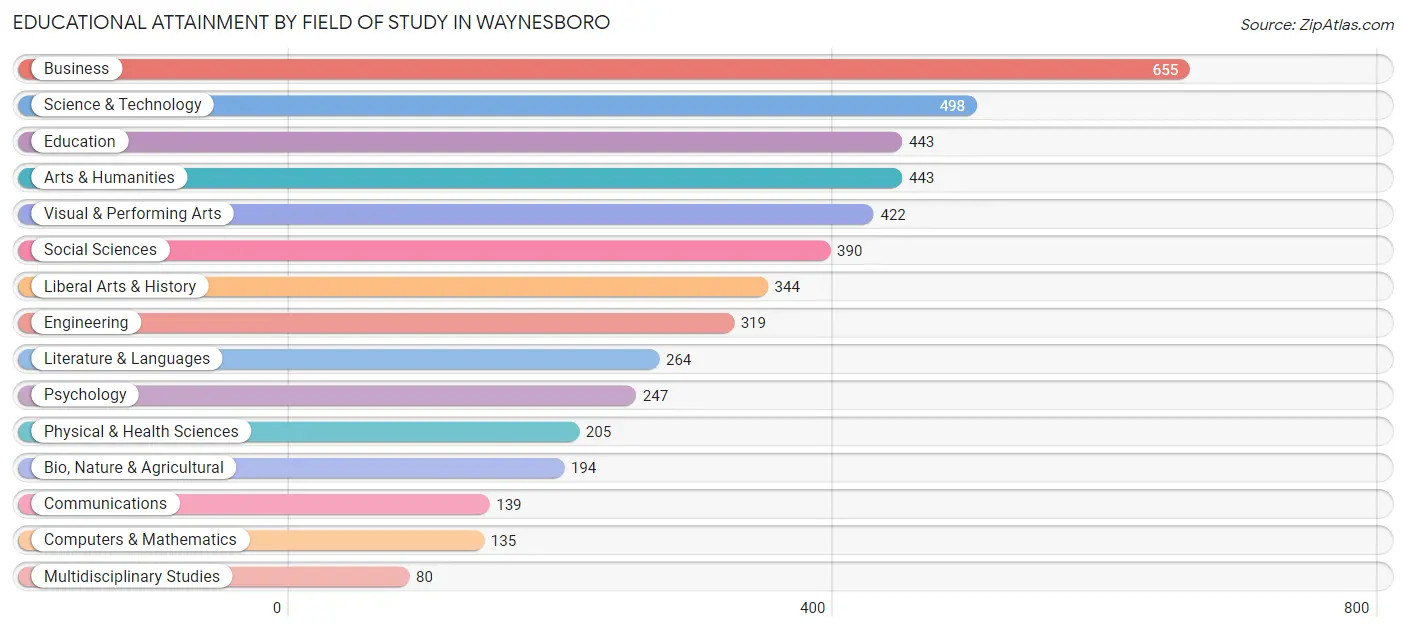
| Field of Study | # Graduates | % Graduates |
| Computers & Mathematics | 135 | 2.8% |
| Bio, Nature & Agricultural | 194 | 4.1% |
| Physical & Health Sciences | 205 | 4.3% |
| Psychology | 247 | 5.2% |
| Social Sciences | 390 | 8.2% |
| Engineering | 319 | 6.7% |
| Multidisciplinary Studies | 80 | 1.7% |
| Science & Technology | 498 | 10.4% |
| Business | 655 | 13.7% |
| Education | 443 | 9.3% |
| Literature & Languages | 264 | 5.5% |
| Liberal Arts & History | 344 | 7.2% |
| Visual & Performing Arts | 422 | 8.8% |
| Communications | 139 | 2.9% |
| Arts & Humanities | 443 | 9.3% |
| Total | 4,778 | 100.0% |
Transportation & Commute in Waynesboro
Vehicle Availability by Sex in Waynesboro
The most prevalent vehicle ownership categories in Waynesboro are males with 2 vehicles (2,377, accounting for 44.0%) and females with 2 vehicles (2,140, making up 43.6%).
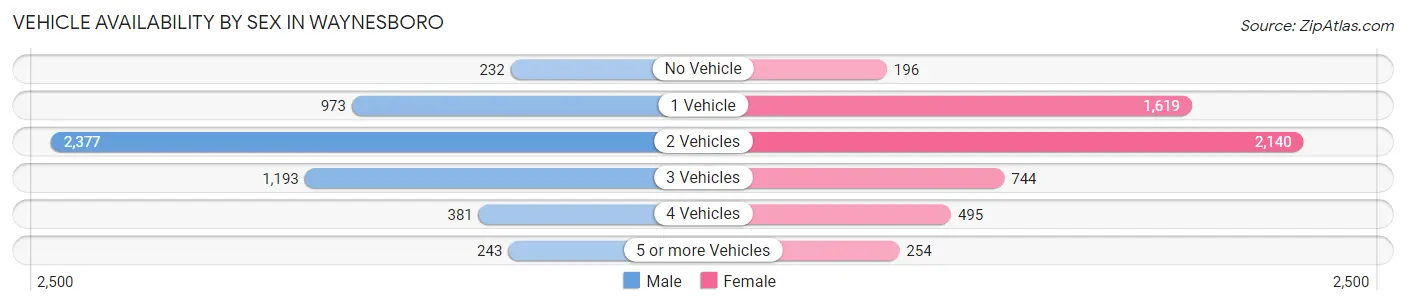
| Vehicles Available | Male | Female |
| No Vehicle | 232 (4.3%) | 196 (3.6%) |
| 1 Vehicle | 973 (18.0%) | 1,619 (29.7%) |
| 2 Vehicles | 2,377 (44.0%) | 2,140 (39.3%) |
| 3 Vehicles | 1,193 (22.1%) | 744 (13.7%) |
| 4 Vehicles | 381 (7.1%) | 495 (9.1%) |
| 5 or more Vehicles | 243 (4.5%) | 254 (4.7%) |
| Total | 5,399 (100.0%) | 5,448 (100.0%) |
Commute Time in Waynesboro
The most frequently occuring commute durations in Waynesboro are 10 to 14 minutes (1,711 commuters, 17.0%), 15 to 19 minutes (1,704 commuters, 16.9%), and 5 to 9 minutes (1,312 commuters, 13.0%).
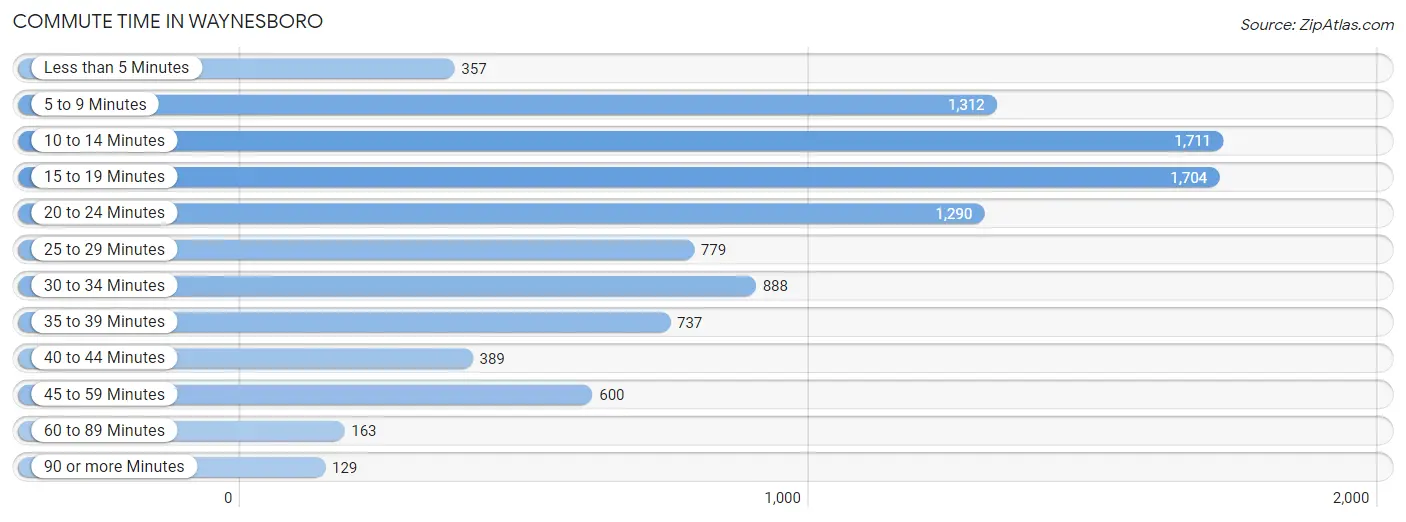
| Commute Time | # Commuters | % Commuters |
| Less than 5 Minutes | 357 | 3.5% |
| 5 to 9 Minutes | 1,312 | 13.0% |
| 10 to 14 Minutes | 1,711 | 17.0% |
| 15 to 19 Minutes | 1,704 | 16.9% |
| 20 to 24 Minutes | 1,290 | 12.8% |
| 25 to 29 Minutes | 779 | 7.7% |
| 30 to 34 Minutes | 888 | 8.8% |
| 35 to 39 Minutes | 737 | 7.3% |
| 40 to 44 Minutes | 389 | 3.9% |
| 45 to 59 Minutes | 600 | 6.0% |
| 60 to 89 Minutes | 163 | 1.6% |
| 90 or more Minutes | 129 | 1.3% |
Commute Time by Sex in Waynesboro
The most common commute times in Waynesboro are 10 to 14 minutes (901 commuters, 18.1%) for males and 15 to 19 minutes (888 commuters, 17.4%) for females.
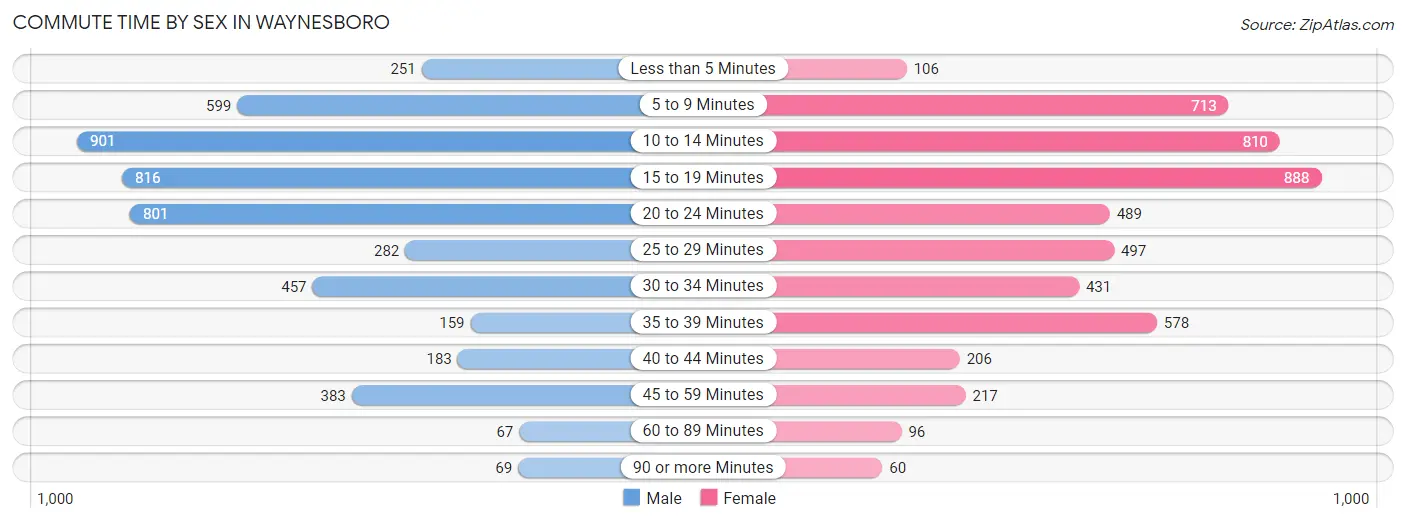
| Commute Time | Male | Female |
| Less than 5 Minutes | 251 (5.1%) | 106 (2.1%) |
| 5 to 9 Minutes | 599 (12.1%) | 713 (14.0%) |
| 10 to 14 Minutes | 901 (18.1%) | 810 (15.9%) |
| 15 to 19 Minutes | 816 (16.4%) | 888 (17.4%) |
| 20 to 24 Minutes | 801 (16.1%) | 489 (9.6%) |
| 25 to 29 Minutes | 282 (5.7%) | 497 (9.8%) |
| 30 to 34 Minutes | 457 (9.2%) | 431 (8.5%) |
| 35 to 39 Minutes | 159 (3.2%) | 578 (11.4%) |
| 40 to 44 Minutes | 183 (3.7%) | 206 (4.1%) |
| 45 to 59 Minutes | 383 (7.7%) | 217 (4.3%) |
| 60 to 89 Minutes | 67 (1.3%) | 96 (1.9%) |
| 90 or more Minutes | 69 (1.4%) | 60 (1.2%) |
Time of Departure to Work by Sex in Waynesboro
The most frequent times of departure to work in Waynesboro are 7:00 AM to 7:29 AM (717, 14.4%) for males and 8:00 AM to 8:29 AM (1,055, 20.7%) for females.
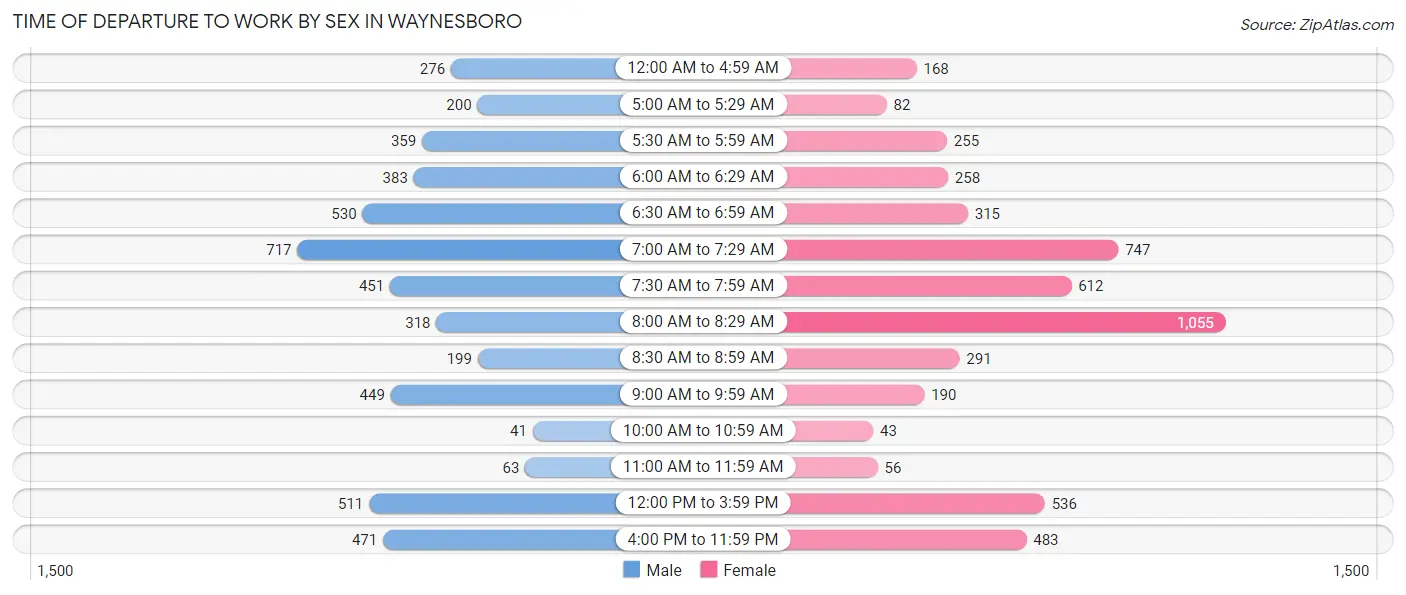
| Time of Departure | Male | Female |
| 12:00 AM to 4:59 AM | 276 (5.6%) | 168 (3.3%) |
| 5:00 AM to 5:29 AM | 200 (4.0%) | 82 (1.6%) |
| 5:30 AM to 5:59 AM | 359 (7.2%) | 255 (5.0%) |
| 6:00 AM to 6:29 AM | 383 (7.7%) | 258 (5.1%) |
| 6:30 AM to 6:59 AM | 530 (10.7%) | 315 (6.2%) |
| 7:00 AM to 7:29 AM | 717 (14.4%) | 747 (14.7%) |
| 7:30 AM to 7:59 AM | 451 (9.1%) | 612 (12.0%) |
| 8:00 AM to 8:29 AM | 318 (6.4%) | 1,055 (20.7%) |
| 8:30 AM to 8:59 AM | 199 (4.0%) | 291 (5.7%) |
| 9:00 AM to 9:59 AM | 449 (9.0%) | 190 (3.7%) |
| 10:00 AM to 10:59 AM | 41 (0.8%) | 43 (0.8%) |
| 11:00 AM to 11:59 AM | 63 (1.3%) | 56 (1.1%) |
| 12:00 PM to 3:59 PM | 511 (10.3%) | 536 (10.5%) |
| 4:00 PM to 11:59 PM | 471 (9.5%) | 483 (9.5%) |
| Total | 4,968 (100.0%) | 5,091 (100.0%) |
Housing Occupancy in Waynesboro
Occupancy by Ownership in Waynesboro
Of the total 9,431 dwellings in Waynesboro, owner-occupied units account for 5,363 (56.9%), while renter-occupied units make up 4,068 (43.1%).
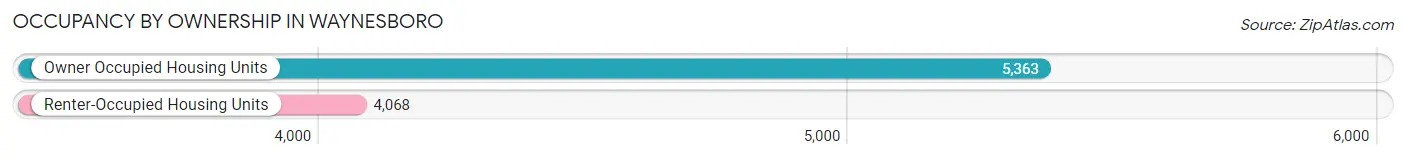
| Occupancy | # Housing Units | % Housing Units |
| Owner Occupied Housing Units | 5,363 | 56.9% |
| Renter-Occupied Housing Units | 4,068 | 43.1% |
| Total Occupied Housing Units | 9,431 | 100.0% |
Occupancy by Household Size in Waynesboro
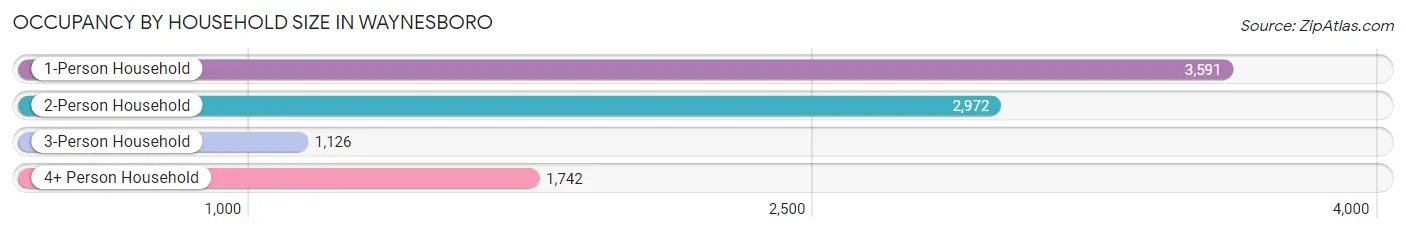
| Household Size | # Housing Units | % Housing Units |
| 1-Person Household | 3,591 | 38.1% |
| 2-Person Household | 2,972 | 31.5% |
| 3-Person Household | 1,126 | 11.9% |
| 4+ Person Household | 1,742 | 18.5% |
| Total Housing Units | 9,431 | 100.0% |
Occupancy by Ownership by Household Size in Waynesboro
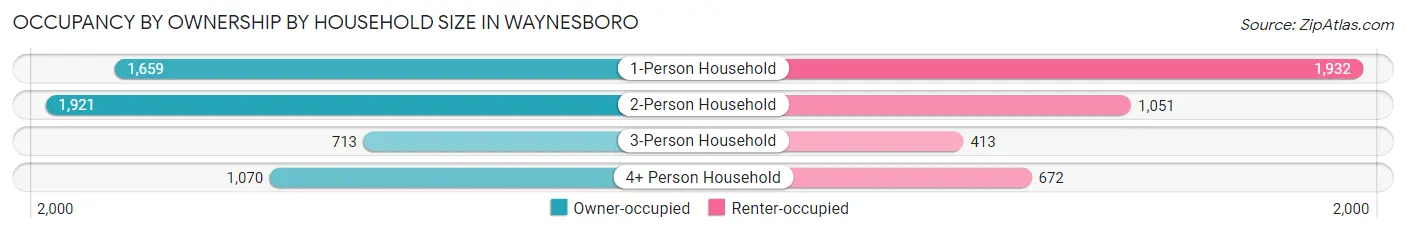
| Household Size | Owner-occupied | Renter-occupied |
| 1-Person Household | 1,659 (46.2%) | 1,932 (53.8%) |
| 2-Person Household | 1,921 (64.6%) | 1,051 (35.4%) |
| 3-Person Household | 713 (63.3%) | 413 (36.7%) |
| 4+ Person Household | 1,070 (61.4%) | 672 (38.6%) |
| Total Housing Units | 5,363 (56.9%) | 4,068 (43.1%) |
Occupancy by Educational Attainment in Waynesboro
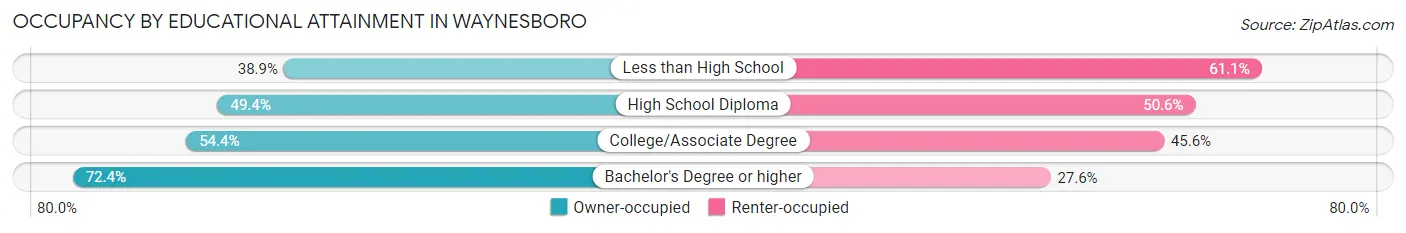
| Household Size | Owner-occupied | Renter-occupied |
| Less than High School | 294 (38.9%) | 462 (61.1%) |
| High School Diploma | 1,413 (49.4%) | 1,448 (50.6%) |
| College/Associate Degree | 1,664 (54.4%) | 1,397 (45.6%) |
| Bachelor's Degree or higher | 1,992 (72.4%) | 761 (27.6%) |
Occupancy by Age of Householder in Waynesboro
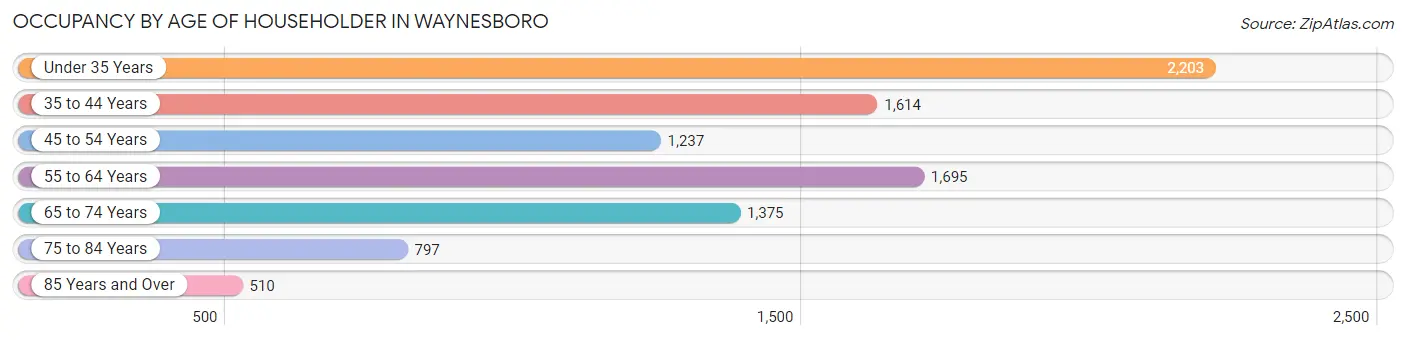
| Age Bracket | # Households | % Households |
| Under 35 Years | 2,203 | 23.4% |
| 35 to 44 Years | 1,614 | 17.1% |
| 45 to 54 Years | 1,237 | 13.1% |
| 55 to 64 Years | 1,695 | 18.0% |
| 65 to 74 Years | 1,375 | 14.6% |
| 75 to 84 Years | 797 | 8.5% |
| 85 Years and Over | 510 | 5.4% |
| Total | 9,431 | 100.0% |
Housing Finances in Waynesboro
Median Income by Occupancy in Waynesboro
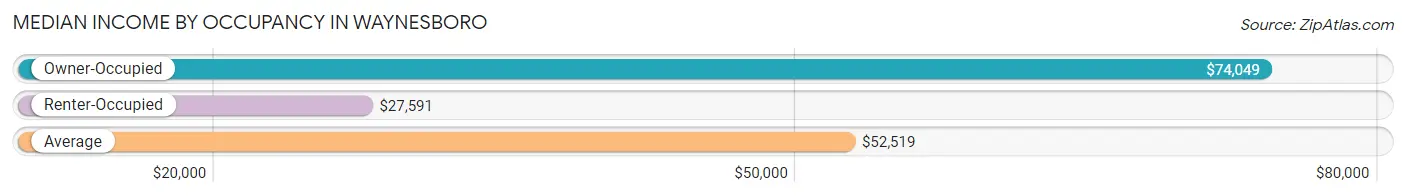
| Occupancy Type | # Households | Median Income |
| Owner-Occupied | 5,363 (56.9%) | $74,049 |
| Renter-Occupied | 4,068 (43.1%) | $27,591 |
| Average | 9,431 (100.0%) | $52,519 |
Occupancy by Householder Income Bracket in Waynesboro
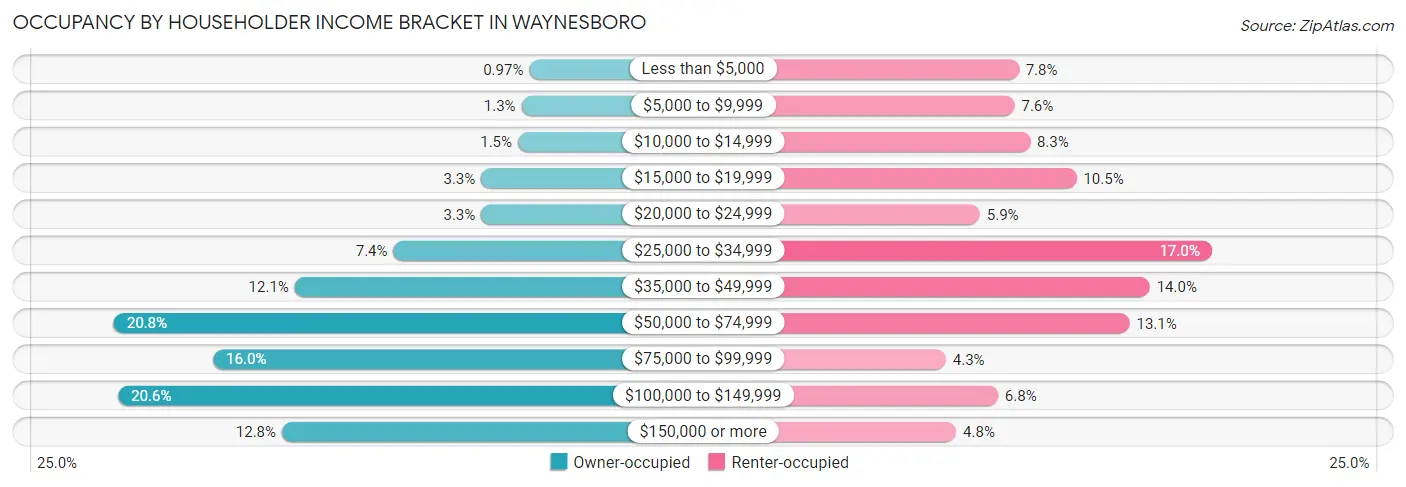
| Income Bracket | Owner-occupied | Renter-occupied |
| Less than $5,000 | 52 (1.0%) | 316 (7.8%) |
| $5,000 to $9,999 | 72 (1.3%) | 308 (7.6%) |
| $10,000 to $14,999 | 81 (1.5%) | 338 (8.3%) |
| $15,000 to $19,999 | 175 (3.3%) | 428 (10.5%) |
| $20,000 to $24,999 | 175 (3.3%) | 241 (5.9%) |
| $25,000 to $34,999 | 399 (7.4%) | 690 (17.0%) |
| $35,000 to $49,999 | 651 (12.1%) | 570 (14.0%) |
| $50,000 to $74,999 | 1,113 (20.7%) | 531 (13.1%) |
| $75,000 to $99,999 | 859 (16.0%) | 175 (4.3%) |
| $100,000 to $149,999 | 1,102 (20.5%) | 276 (6.8%) |
| $150,000 or more | 684 (12.8%) | 195 (4.8%) |
| Total | 5,363 (100.0%) | 4,068 (100.0%) |
Monthly Housing Cost Tiers in Waynesboro
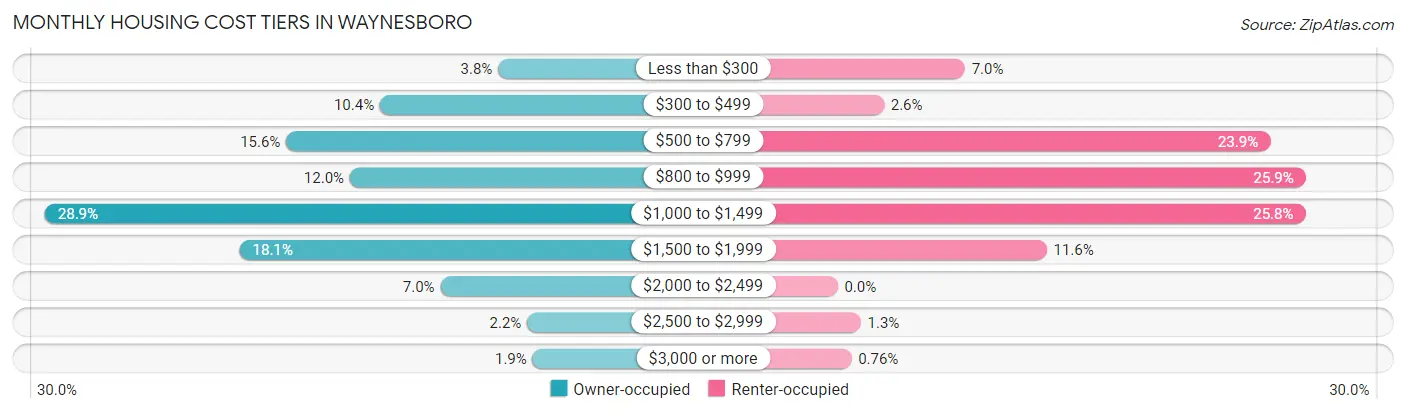
| Monthly Cost | Owner-occupied | Renter-occupied |
| Less than $300 | 206 (3.8%) | 286 (7.0%) |
| $300 to $499 | 556 (10.4%) | 104 (2.6%) |
| $500 to $799 | 834 (15.5%) | 972 (23.9%) |
| $800 to $999 | 645 (12.0%) | 1,052 (25.9%) |
| $1,000 to $1,499 | 1,549 (28.9%) | 1,051 (25.8%) |
| $1,500 to $1,999 | 972 (18.1%) | 470 (11.6%) |
| $2,000 to $2,499 | 377 (7.0%) | 0 (0.0%) |
| $2,500 to $2,999 | 120 (2.2%) | 52 (1.3%) |
| $3,000 or more | 104 (1.9%) | 31 (0.8%) |
| Total | 5,363 (100.0%) | 4,068 (100.0%) |
Physical Housing Characteristics in Waynesboro
Housing Structures in Waynesboro
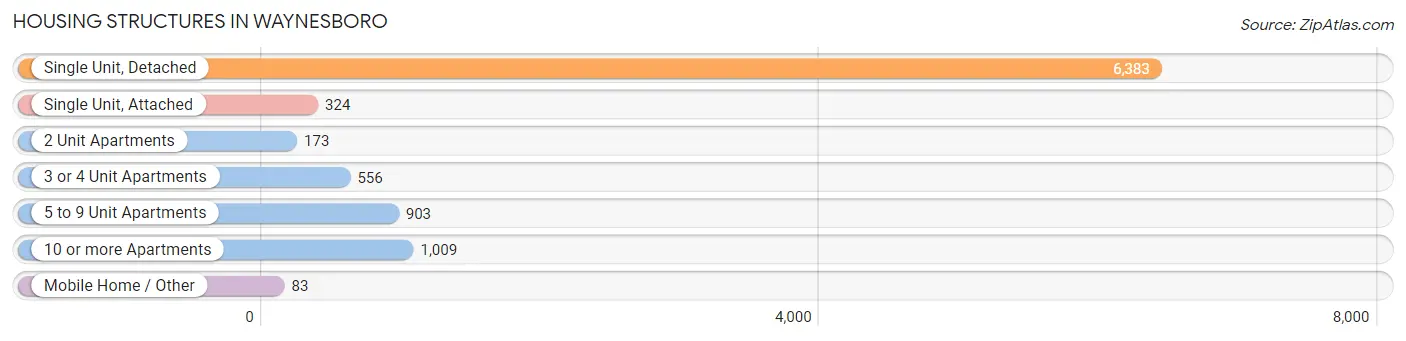
| Structure Type | # Housing Units | % Housing Units |
| Single Unit, Detached | 6,383 | 67.7% |
| Single Unit, Attached | 324 | 3.4% |
| 2 Unit Apartments | 173 | 1.8% |
| 3 or 4 Unit Apartments | 556 | 5.9% |
| 5 to 9 Unit Apartments | 903 | 9.6% |
| 10 or more Apartments | 1,009 | 10.7% |
| Mobile Home / Other | 83 | 0.9% |
| Total | 9,431 | 100.0% |
Housing Structures by Occupancy in Waynesboro
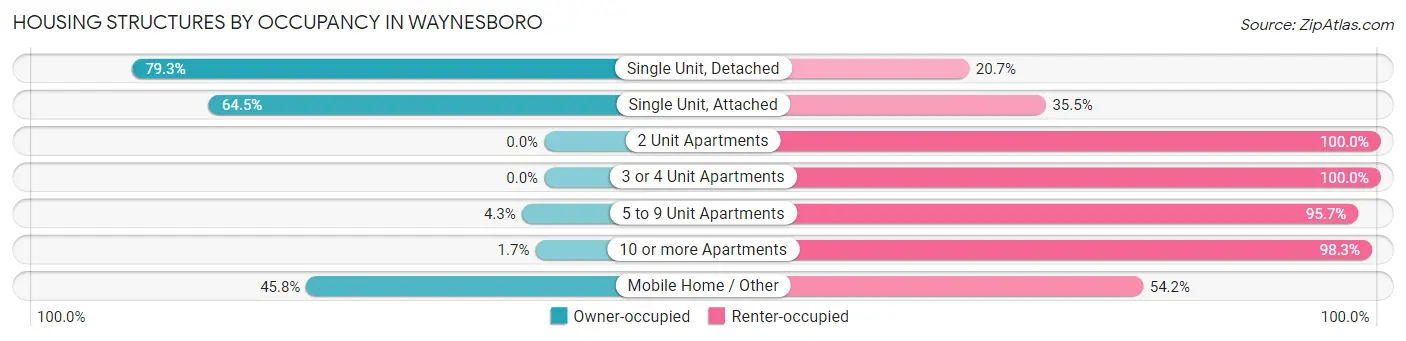
| Structure Type | Owner-occupied | Renter-occupied |
| Single Unit, Detached | 5,060 (79.3%) | 1,323 (20.7%) |
| Single Unit, Attached | 209 (64.5%) | 115 (35.5%) |
| 2 Unit Apartments | 0 (0.0%) | 173 (100.0%) |
| 3 or 4 Unit Apartments | 0 (0.0%) | 556 (100.0%) |
| 5 to 9 Unit Apartments | 39 (4.3%) | 864 (95.7%) |
| 10 or more Apartments | 17 (1.7%) | 992 (98.3%) |
| Mobile Home / Other | 38 (45.8%) | 45 (54.2%) |
| Total | 5,363 (56.9%) | 4,068 (43.1%) |
Housing Structures by Number of Rooms in Waynesboro
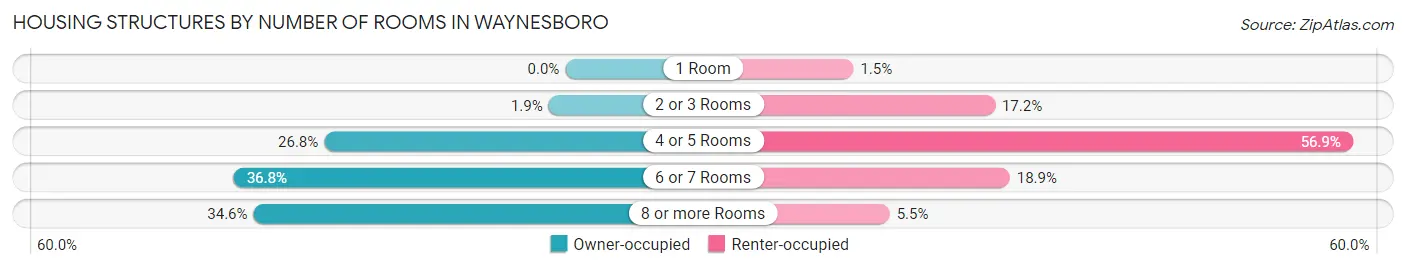
| Number of Rooms | Owner-occupied | Renter-occupied |
| 1 Room | 0 (0.0%) | 61 (1.5%) |
| 2 or 3 Rooms | 99 (1.8%) | 700 (17.2%) |
| 4 or 5 Rooms | 1,435 (26.8%) | 2,315 (56.9%) |
| 6 or 7 Rooms | 1,973 (36.8%) | 767 (18.9%) |
| 8 or more Rooms | 1,856 (34.6%) | 225 (5.5%) |
| Total | 5,363 (100.0%) | 4,068 (100.0%) |
Housing Structure by Heating Type in Waynesboro
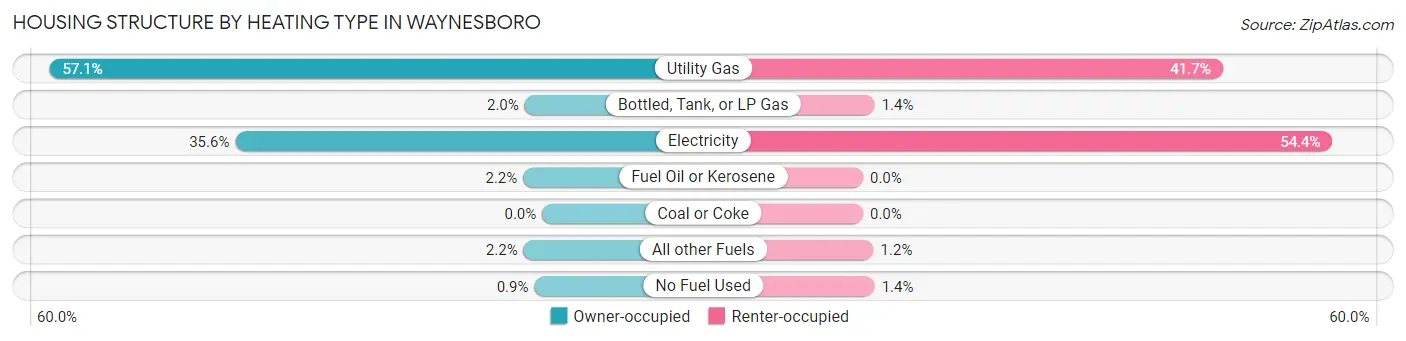
| Heating Type | Owner-occupied | Renter-occupied |
| Utility Gas | 3,064 (57.1%) | 1,695 (41.7%) |
| Bottled, Tank, or LP Gas | 109 (2.0%) | 55 (1.3%) |
| Electricity | 1,908 (35.6%) | 2,213 (54.4%) |
| Fuel Oil or Kerosene | 118 (2.2%) | 0 (0.0%) |
| Coal or Coke | 0 (0.0%) | 0 (0.0%) |
| All other Fuels | 116 (2.2%) | 50 (1.2%) |
| No Fuel Used | 48 (0.9%) | 55 (1.3%) |
| Total | 5,363 (100.0%) | 4,068 (100.0%) |
Household Vehicle Usage in Waynesboro
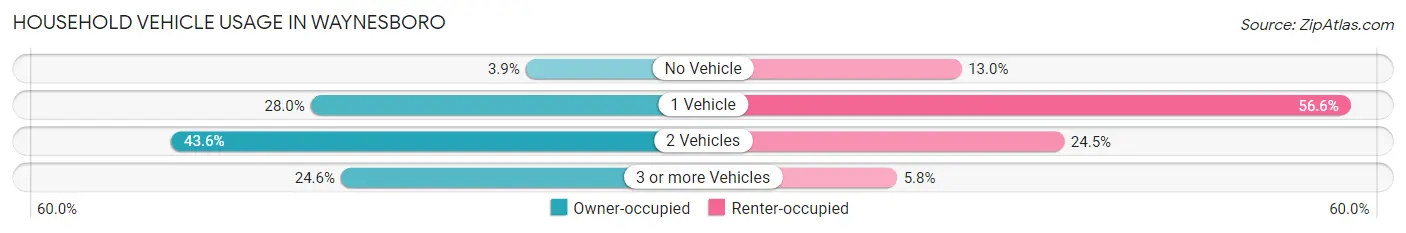
| Vehicles per Household | Owner-occupied | Renter-occupied |
| No Vehicle | 208 (3.9%) | 530 (13.0%) |
| 1 Vehicle | 1,500 (28.0%) | 2,304 (56.6%) |
| 2 Vehicles | 2,337 (43.6%) | 998 (24.5%) |
| 3 or more Vehicles | 1,318 (24.6%) | 236 (5.8%) |
| Total | 5,363 (100.0%) | 4,068 (100.0%) |
Real Estate & Mortgages in Waynesboro
Real Estate and Mortgage Overview in Waynesboro
| Characteristic | Without Mortgage | With Mortgage |
| Housing Units | 1,537 | 3,826 |
| Median Property Value | $196,500 | $235,200 |
| Median Household Income | $54,861 | $640 |
| Monthly Housing Costs | $505 | $104 |
| Real Estate Taxes | $1,653 | $46 |
Property Value by Mortgage Status in Waynesboro
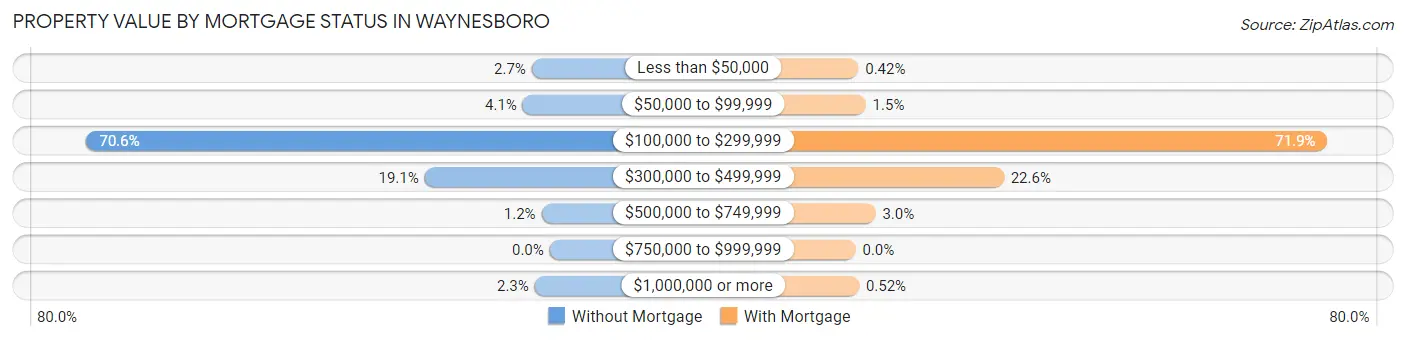
| Property Value | Without Mortgage | With Mortgage |
| Less than $50,000 | 42 (2.7%) | 16 (0.4%) |
| $50,000 to $99,999 | 63 (4.1%) | 59 (1.5%) |
| $100,000 to $299,999 | 1,085 (70.6%) | 2,751 (71.9%) |
| $300,000 to $499,999 | 293 (19.1%) | 864 (22.6%) |
| $500,000 to $749,999 | 19 (1.2%) | 116 (3.0%) |
| $750,000 to $999,999 | 0 (0.0%) | 0 (0.0%) |
| $1,000,000 or more | 35 (2.3%) | 20 (0.5%) |
| Total | 1,537 (100.0%) | 3,826 (100.0%) |
Household Income by Mortgage Status in Waynesboro
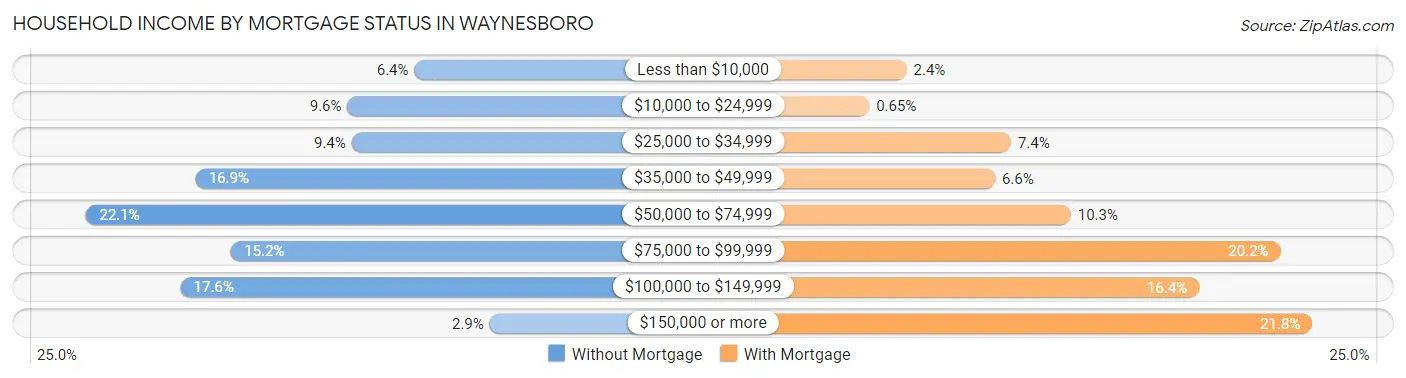
| Household Income | Without Mortgage | With Mortgage |
| Less than $10,000 | 99 (6.4%) | 93 (2.4%) |
| $10,000 to $24,999 | 148 (9.6%) | 25 (0.6%) |
| $25,000 to $34,999 | 145 (9.4%) | 283 (7.4%) |
| $35,000 to $49,999 | 259 (16.9%) | 254 (6.6%) |
| $50,000 to $74,999 | 339 (22.1%) | 392 (10.2%) |
| $75,000 to $99,999 | 233 (15.2%) | 774 (20.2%) |
| $100,000 to $149,999 | 270 (17.6%) | 626 (16.4%) |
| $150,000 or more | 44 (2.9%) | 832 (21.7%) |
| Total | 1,537 (100.0%) | 3,826 (100.0%) |
Property Value to Household Income Ratio in Waynesboro
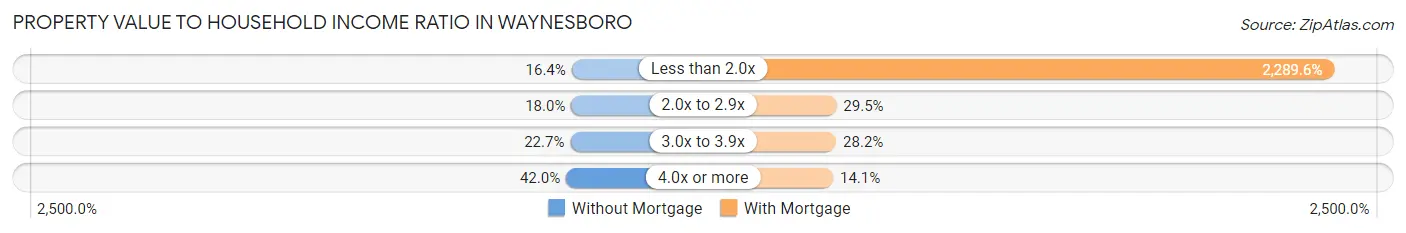
| Value-to-Income Ratio | Without Mortgage | With Mortgage |
| Less than 2.0x | 252 (16.4%) | 87,601 (2,289.6%) |
| 2.0x to 2.9x | 277 (18.0%) | 1,127 (29.5%) |
| 3.0x to 3.9x | 349 (22.7%) | 1,079 (28.2%) |
| 4.0x or more | 646 (42.0%) | 539 (14.1%) |
| Total | 1,537 (100.0%) | 3,826 (100.0%) |
Real Estate Taxes by Mortgage Status in Waynesboro
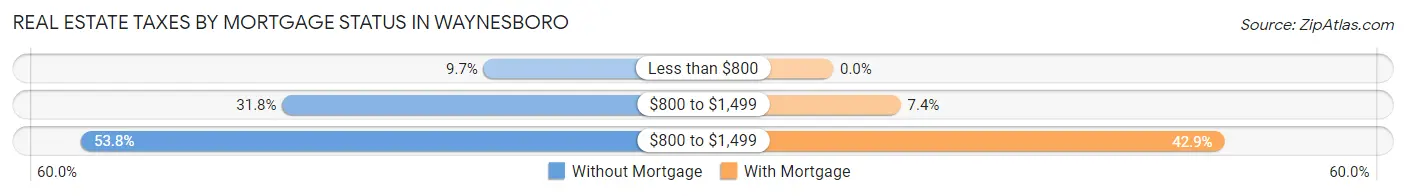
| Property Taxes | Without Mortgage | With Mortgage |
| Less than $800 | 149 (9.7%) | 0 (0.0%) |
| $800 to $1,499 | 488 (31.8%) | 283 (7.4%) |
| $800 to $1,499 | 827 (53.8%) | 1,641 (42.9%) |
| Total | 1,537 (100.0%) | 3,826 (100.0%) |
Health & Disability in Waynesboro
Health Insurance Coverage by Age in Waynesboro
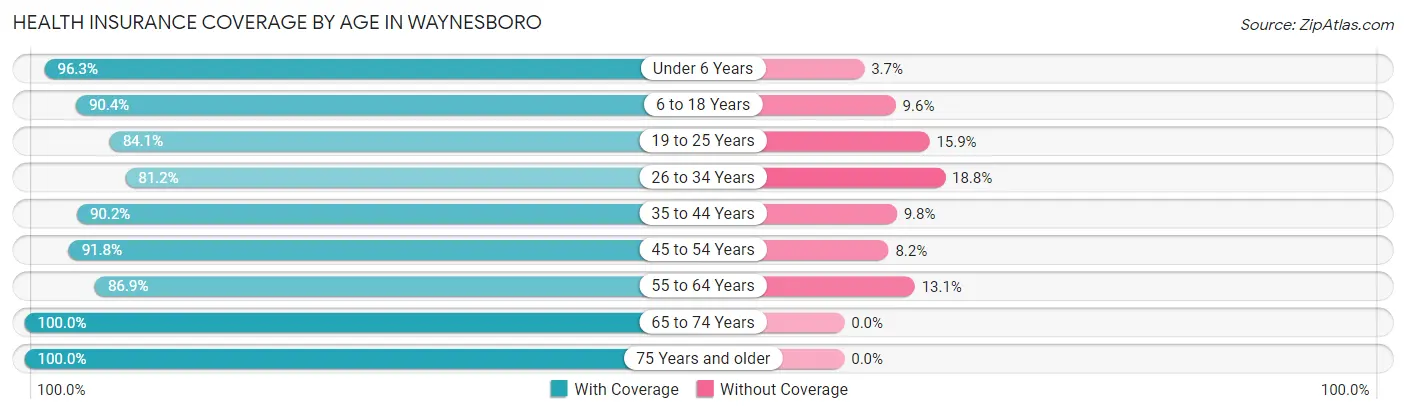
| Age Bracket | With Coverage | Without Coverage |
| Under 6 Years | 1,684 (96.3%) | 65 (3.7%) |
| 6 to 18 Years | 3,088 (90.4%) | 327 (9.6%) |
| 19 to 25 Years | 1,298 (84.1%) | 245 (15.9%) |
| 26 to 34 Years | 2,693 (81.2%) | 623 (18.8%) |
| 35 to 44 Years | 2,558 (90.2%) | 277 (9.8%) |
| 45 to 54 Years | 2,362 (91.8%) | 212 (8.2%) |
| 55 to 64 Years | 2,560 (86.9%) | 387 (13.1%) |
| 65 to 74 Years | 2,037 (100.0%) | 0 (0.0%) |
| 75 Years and older | 1,702 (100.0%) | 0 (0.0%) |
| Total | 19,982 (90.3%) | 2,136 (9.7%) |
Health Insurance Coverage by Citizenship Status in Waynesboro
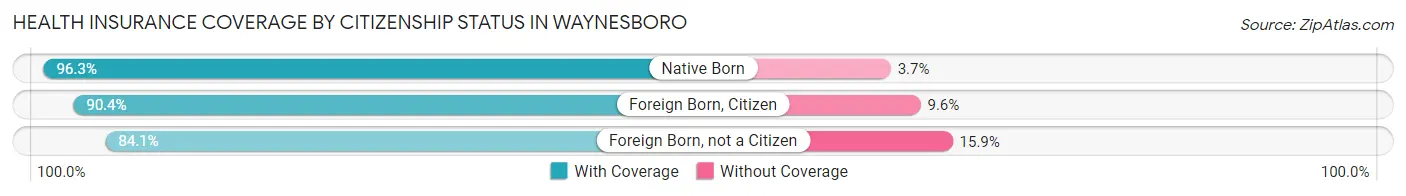
| Citizenship Status | With Coverage | Without Coverage |
| Native Born | 1,684 (96.3%) | 65 (3.7%) |
| Foreign Born, Citizen | 3,088 (90.4%) | 327 (9.6%) |
| Foreign Born, not a Citizen | 1,298 (84.1%) | 245 (15.9%) |
Health Insurance Coverage by Household Income in Waynesboro
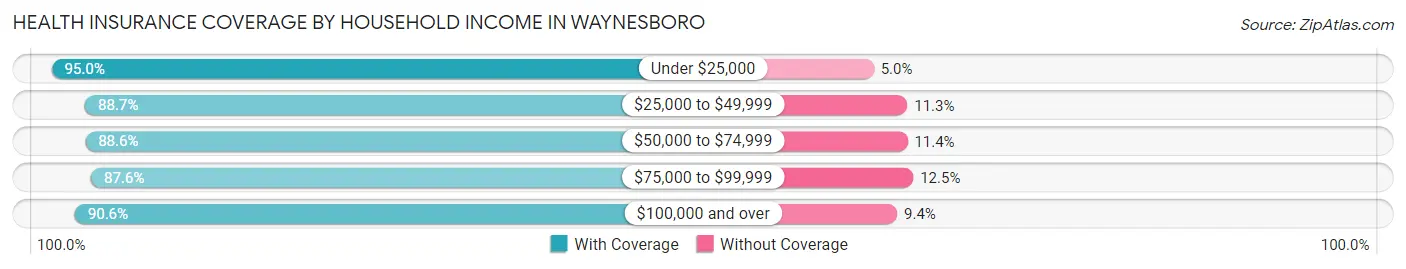
| Household Income | With Coverage | Without Coverage |
| Under $25,000 | 3,752 (95.0%) | 199 (5.0%) |
| $25,000 to $49,999 | 3,669 (88.7%) | 469 (11.3%) |
| $50,000 to $74,999 | 3,122 (88.6%) | 400 (11.4%) |
| $75,000 to $99,999 | 2,413 (87.5%) | 343 (12.4%) |
| $100,000 and over | 6,970 (90.6%) | 725 (9.4%) |
Public vs Private Health Insurance Coverage by Age in Waynesboro
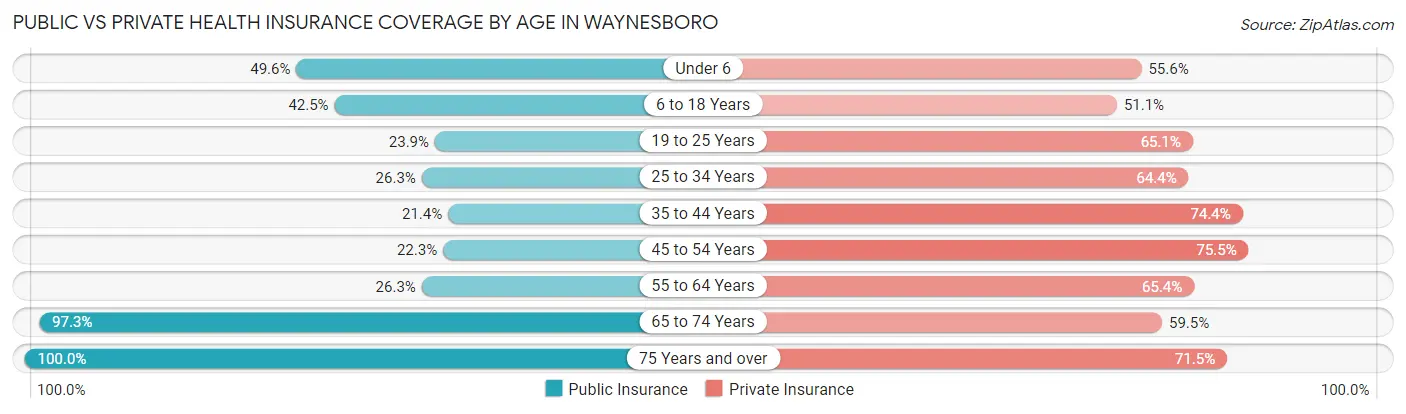
| Age Bracket | Public Insurance | Private Insurance |
| Under 6 | 867 (49.6%) | 973 (55.6%) |
| 6 to 18 Years | 1,451 (42.5%) | 1,744 (51.1%) |
| 19 to 25 Years | 368 (23.8%) | 1,005 (65.1%) |
| 25 to 34 Years | 872 (26.3%) | 2,134 (64.3%) |
| 35 to 44 Years | 607 (21.4%) | 2,109 (74.4%) |
| 45 to 54 Years | 575 (22.3%) | 1,943 (75.5%) |
| 55 to 64 Years | 775 (26.3%) | 1,927 (65.4%) |
| 65 to 74 Years | 1,982 (97.3%) | 1,211 (59.5%) |
| 75 Years and over | 1,702 (100.0%) | 1,217 (71.5%) |
| Total | 9,199 (41.6%) | 14,263 (64.5%) |
Disability Status by Sex by Age in Waynesboro
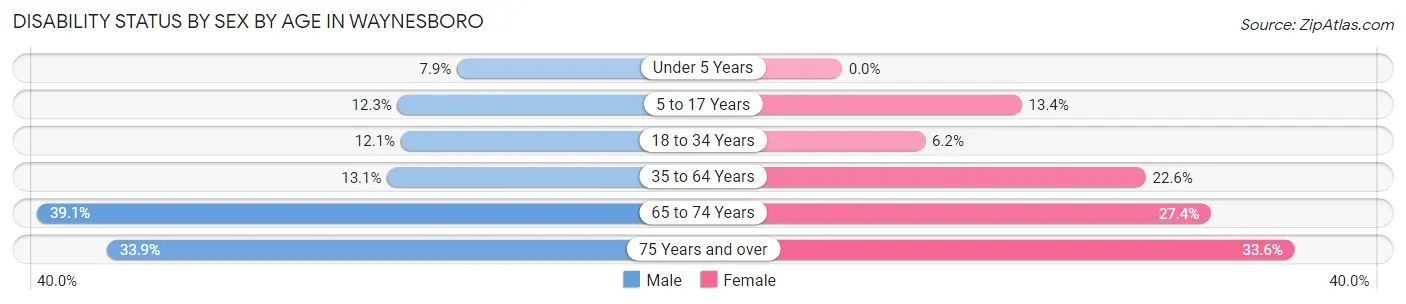
| Age Bracket | Male | Female |
| Under 5 Years | 63 (7.9%) | 0 (0.0%) |
| 5 to 17 Years | 255 (12.3%) | 200 (13.4%) |
| 18 to 34 Years | 287 (12.1%) | 165 (6.2%) |
| 35 to 64 Years | 529 (13.1%) | 972 (22.6%) |
| 65 to 74 Years | 374 (39.1%) | 296 (27.4%) |
| 75 Years and over | 222 (33.9%) | 352 (33.6%) |
Disability Class by Sex by Age in Waynesboro
Disability Class: Hearing Difficulty
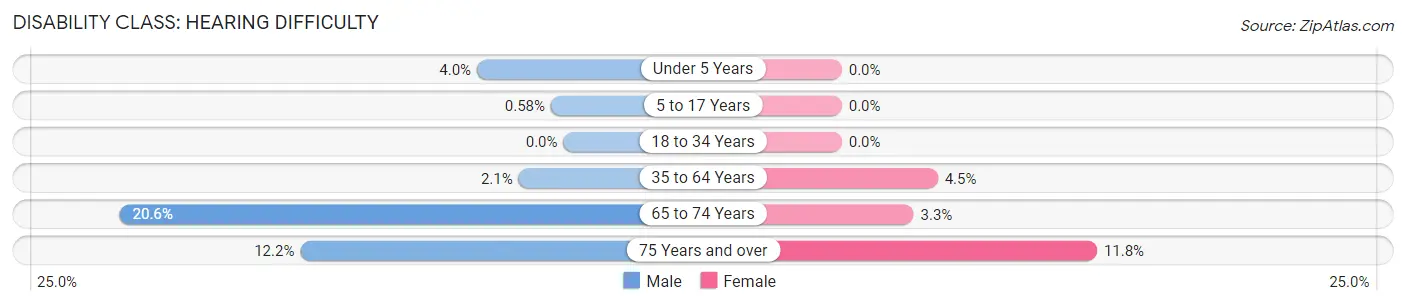
| Age Bracket | Male | Female |
| Under 5 Years | 32 (4.0%) | 0 (0.0%) |
| 5 to 17 Years | 12 (0.6%) | 0 (0.0%) |
| 18 to 34 Years | 0 (0.0%) | 0 (0.0%) |
| 35 to 64 Years | 84 (2.1%) | 192 (4.4%) |
| 65 to 74 Years | 197 (20.6%) | 36 (3.3%) |
| 75 Years and over | 80 (12.2%) | 124 (11.8%) |
Disability Class: Vision Difficulty
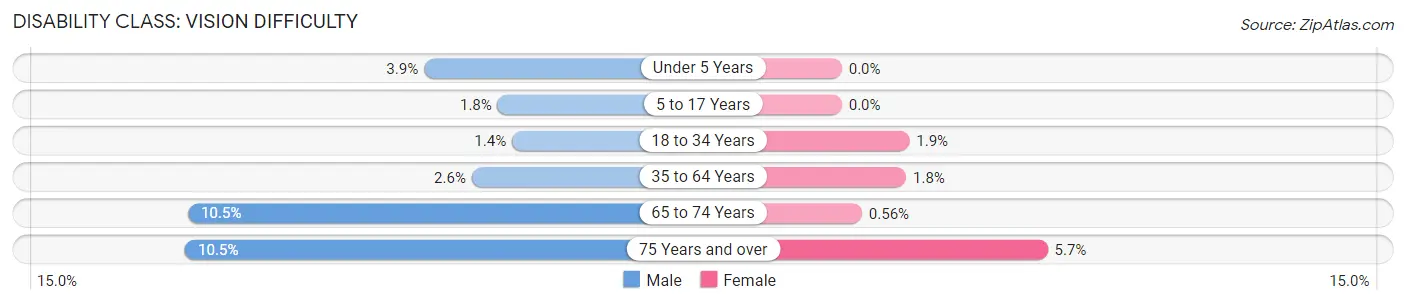
| Age Bracket | Male | Female |
| Under 5 Years | 31 (3.9%) | 0 (0.0%) |
| 5 to 17 Years | 38 (1.8%) | 0 (0.0%) |
| 18 to 34 Years | 34 (1.4%) | 50 (1.9%) |
| 35 to 64 Years | 103 (2.5%) | 77 (1.8%) |
| 65 to 74 Years | 100 (10.4%) | 6 (0.6%) |
| 75 Years and over | 69 (10.5%) | 60 (5.7%) |
Disability Class: Cognitive Difficulty
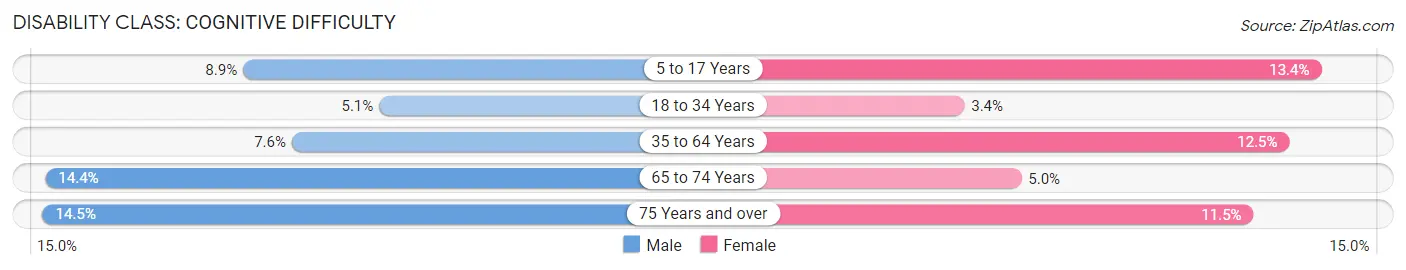
| Age Bracket | Male | Female |
| 5 to 17 Years | 185 (8.9%) | 200 (13.4%) |
| 18 to 34 Years | 122 (5.1%) | 91 (3.4%) |
| 35 to 64 Years | 306 (7.6%) | 537 (12.5%) |
| 65 to 74 Years | 138 (14.4%) | 54 (5.0%) |
| 75 Years and over | 95 (14.5%) | 120 (11.5%) |
Disability Class: Ambulatory Difficulty
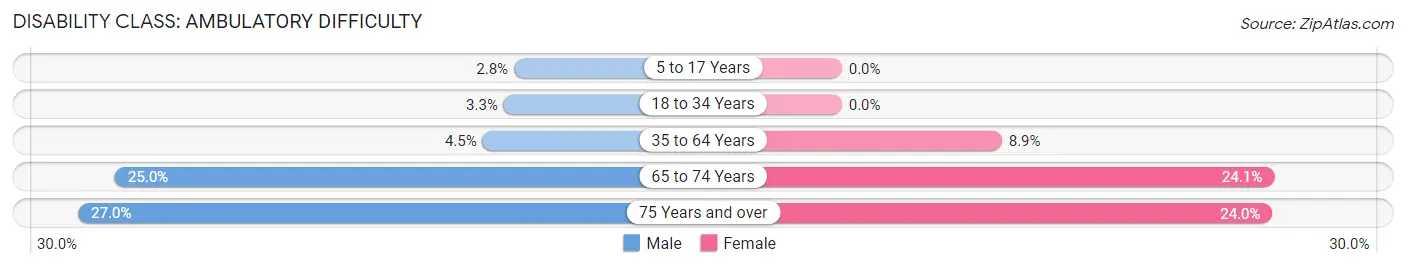
| Age Bracket | Male | Female |
| 5 to 17 Years | 57 (2.8%) | 0 (0.0%) |
| 18 to 34 Years | 79 (3.3%) | 0 (0.0%) |
| 35 to 64 Years | 182 (4.5%) | 384 (8.9%) |
| 65 to 74 Years | 239 (25.0%) | 260 (24.1%) |
| 75 Years and over | 177 (27.0%) | 251 (24.0%) |
Disability Class: Self-Care Difficulty
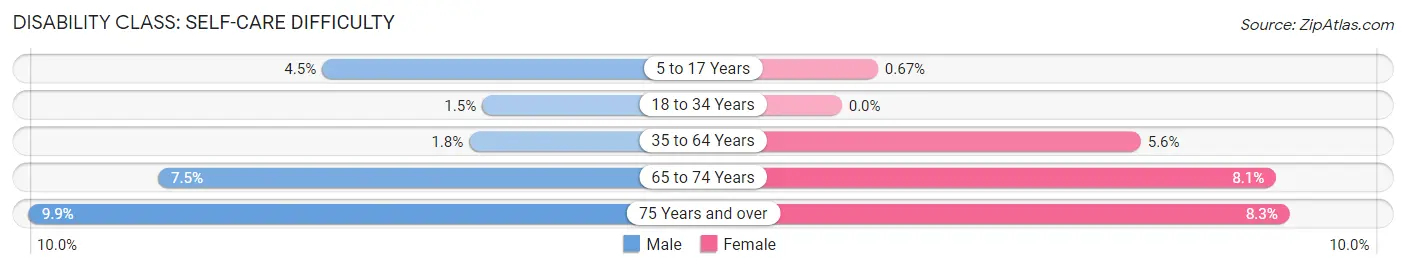
| Age Bracket | Male | Female |
| 5 to 17 Years | 93 (4.5%) | 10 (0.7%) |
| 18 to 34 Years | 36 (1.5%) | 0 (0.0%) |
| 35 to 64 Years | 71 (1.8%) | 239 (5.6%) |
| 65 to 74 Years | 72 (7.5%) | 87 (8.1%) |
| 75 Years and over | 65 (9.9%) | 87 (8.3%) |
Technology Access in Waynesboro
Computing Device Access in Waynesboro
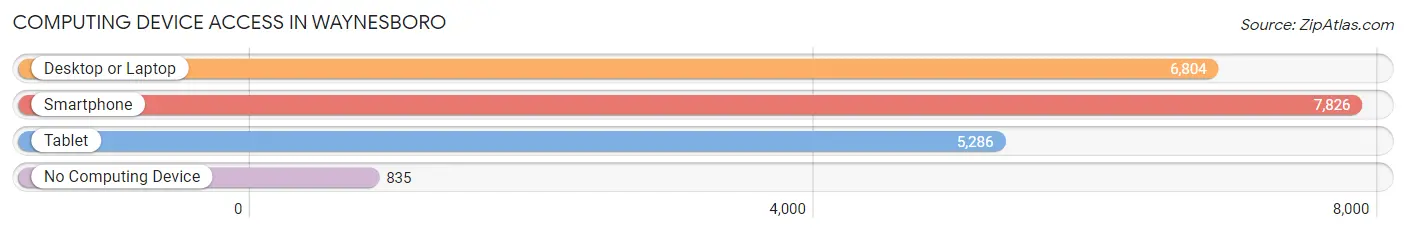
| Device Type | # Households | % Households |
| Desktop or Laptop | 6,804 | 72.2% |
| Smartphone | 7,826 | 83.0% |
| Tablet | 5,286 | 56.0% |
| No Computing Device | 835 | 8.8% |
| Total | 9,431 | 100.0% |
Internet Access in Waynesboro
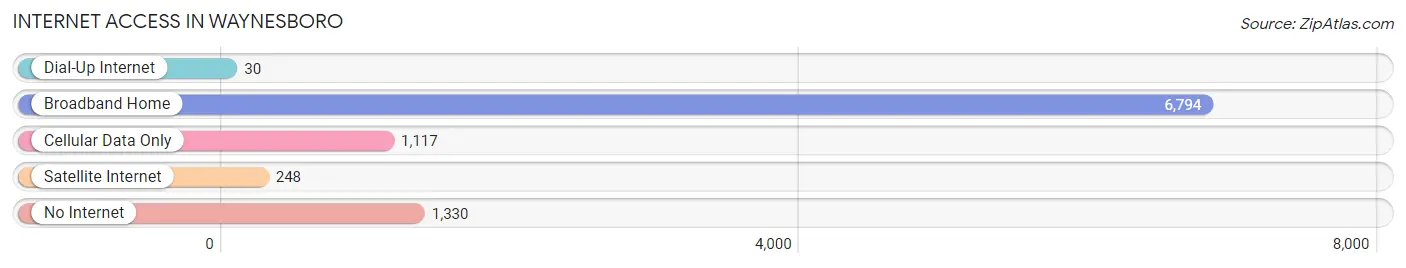
| Internet Type | # Households | % Households |
| Dial-Up Internet | 30 | 0.3% |
| Broadband Home | 6,794 | 72.0% |
| Cellular Data Only | 1,117 | 11.8% |
| Satellite Internet | 248 | 2.6% |
| No Internet | 1,330 | 14.1% |
| Total | 9,431 | 100.0% |
Waynesboro Summary
Waynesboro, Virginia is a city located in the Shenandoah Valley region of the Commonwealth of Virginia. It is the county seat of Augusta County and is situated in the foothills of the Blue Ridge Mountains. The city is located approximately 70 miles west of Richmond and 90 miles northwest of Washington, D.C. Waynesboro is the fifth largest city in Virginia with a population of 21,006 as of the 2010 census.
History
The area that is now Waynesboro was first settled in 1732 by William Wallace, who established a homestead near the confluence of the South River and Middle River. The area was known as Wallace’s Crossroads and was a popular stop for travelers on the Great Wagon Road. In 1797, the town was officially established and named after General Anthony Wayne, a Revolutionary War hero.
In the early 19th century, Waynesboro was a major stop on the Valley Turnpike, a major transportation route connecting the Shenandoah Valley to the Tidewater region of Virginia. The town was also a major stop on the Staunton-Parkersburg Turnpike, which connected the Shenandoah Valley to the Ohio River Valley.
Waynesboro was an important center of industry in the 19th century. The town was home to several mills, including a woolen mill, a paper mill, and a flour mill. The town was also home to several iron foundries and a tannery.
In the late 19th century, Waynesboro became a popular tourist destination. The town was home to several resorts, including the Grand Hotel and the Waynesboro Hotel. The town was also home to several amusement parks, including the Waynesboro Amusement Park and the Waynesboro Zoo.
Geography
Waynesboro is located in the Shenandoah Valley region of Virginia. The city is situated in the foothills of the Blue Ridge Mountains and is located approximately 70 miles west of Richmond and 90 miles northwest of Washington, D.C. The city is located at the confluence of the South River and Middle River.
The city has a total area of 11.3 square miles, of which 11.2 square miles is land and 0.1 square miles is water. The city is located at an elevation of 1,068 feet above sea level.
Economy
Waynesboro’s economy is largely based on manufacturing and tourism. The city is home to several manufacturing companies, including DuPont, General Electric, and Invista. The city is also home to several tourist attractions, including the Waynesboro Heritage Museum, the P. Buckley Moss Museum, and the Waynesboro Country Club.
The city is also home to several educational institutions, including the University of Virginia’s College at Wise, Blue Ridge Community College, and the Virginia School for the Deaf and Blind.
Demographics
As of the 2010 census, the population of Waynesboro was 21,006. The racial makeup of the city was 79.2% White, 15.3% African American, 0.4% Native American, 1.2% Asian, 0.1% Pacific Islander, 1.3% from other races, and 2.5% from two or more races. Hispanic or Latino of any race were 3.7% of the population.
The median income for a household in the city was $37,837, and the median income for a family was $45,945. The per capita income for the city was $20,945. About 11.2% of families and 14.3% of the population were below the poverty line, including 19.2% of those under age 18 and 10.2% of those age 65 or over.
Common Questions
What is Per Capita Income in Waynesboro?
Per Capita income in Waynesboro is $30,380.
What is the Median Family Income in Waynesboro?
Median Family Income in Waynesboro is $69,708.
What is the Median Household income in Waynesboro?
Median Household Income in Waynesboro is $52,519.
What is Income or Wage Gap in Waynesboro?
Income or Wage Gap in Waynesboro is 28.6%.
Women in Waynesboro earn 71.4 cents for every dollar earned by a man.
What is Family Income Deficit in Waynesboro?
Family Income Deficit in Waynesboro is $12,674.
Families that are below poverty line in Waynesboro earn $12,674 less on average than the poverty threshold level.
What is Inequality or Gini Index in Waynesboro?
Inequality or Gini Index in Waynesboro is 0.45.
What is the Total Population of Waynesboro?
Total Population of Waynesboro is 22,341.
What is the Total Male Population of Waynesboro?
Total Male Population of Waynesboro is 10,995.
What is the Total Female Population of Waynesboro?
Total Female Population of Waynesboro is 11,346.
What is the Ratio of Males per 100 Females in Waynesboro?
There are 96.91 Males per 100 Females in Waynesboro.
What is the Ratio of Females per 100 Males in Waynesboro?
There are 103.19 Females per 100 Males in Waynesboro.
What is the Median Population Age in Waynesboro?
Median Population Age in Waynesboro is 38.7 Years.
What is the Average Family Size in Waynesboro
Average Family Size in Waynesboro is 3.1 People.
What is the Average Household Size in Waynesboro
Average Household Size in Waynesboro is 2.4 People.
How Large is the Labor Force in Waynesboro?
There are 11,502 People in the Labor Forcein in Waynesboro.
What is the Percentage of People in the Labor Force in Waynesboro?
64.8% of People are in the Labor Force in Waynesboro.
What is the Unemployment Rate in Waynesboro?
Unemployment Rate in Waynesboro is 4.7%.