Fishersville, VA Map & Demographics
Fishersville Map
Fishersville Overview
$40,156
PER CAPITA INCOME
$103,083
AVG FAMILY INCOME
$77,134
AVG HOUSEHOLD INCOME
43.1%
WAGE / INCOME GAP [ % ]
56.9¢/ $1
WAGE / INCOME GAP [ $ ]
$9,456
FAMILY INCOME DEFICIT
0.42
INEQUALITY / GINI INDEX
9,422
TOTAL POPULATION
4,349
MALE POPULATION
5,073
FEMALE POPULATION
85.73
MALES / 100 FEMALES
116.65
FEMALES / 100 MALES
42.4
MEDIAN AGE
2.8
AVG FAMILY SIZE
2.3
AVG HOUSEHOLD SIZE
4,221
LABOR FORCE [ PEOPLE ]
53.4%
PERCENT IN LABOR FORCE
6.1%
UNEMPLOYMENT RATE
Fishersville Zip Codes
Fishersville Area Codes
Income in Fishersville
Income Overview in Fishersville
Per Capita Income in Fishersville is $40,156, while median incomes of families and households are $103,083 and $77,134 respectively.
| Characteristic | Number | Measure |
| Per Capita Income | 9,422 | $40,156 |
| Median Family Income | 2,520 | $103,083 |
| Mean Family Income | 2,520 | $116,556 |
| Median Household Income | 3,831 | $77,134 |
| Mean Household Income | 3,831 | $95,712 |
| Income Deficit | 2,520 | $9,456 |
| Wage / Income Gap (%) | 9,422 | 43.07% |
| Wage / Income Gap ($) | 9,422 | 56.93¢ per $1 |
| Gini / Inequality Index | 9,422 | 0.42 |
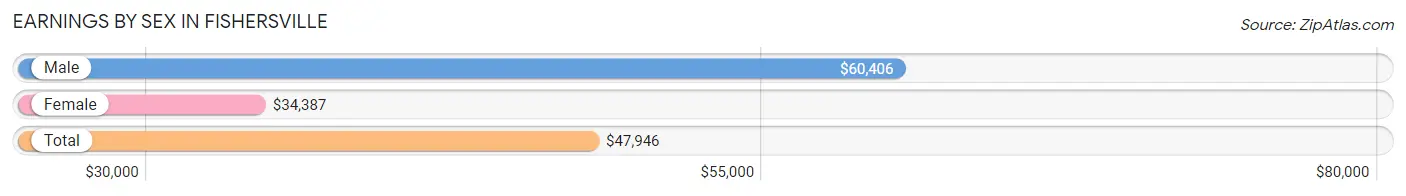
Earnings by Sex in Fishersville
Average Earnings in Fishersville are $47,946, $60,406 for men and $34,387 for women, a difference of 43.1%.
| Sex | Number | Average Earnings |
| Male | 2,345 (51.2%) | $60,406 |
| Female | 2,231 (48.7%) | $34,387 |
| Total | 4,576 (100.0%) | $47,946 |
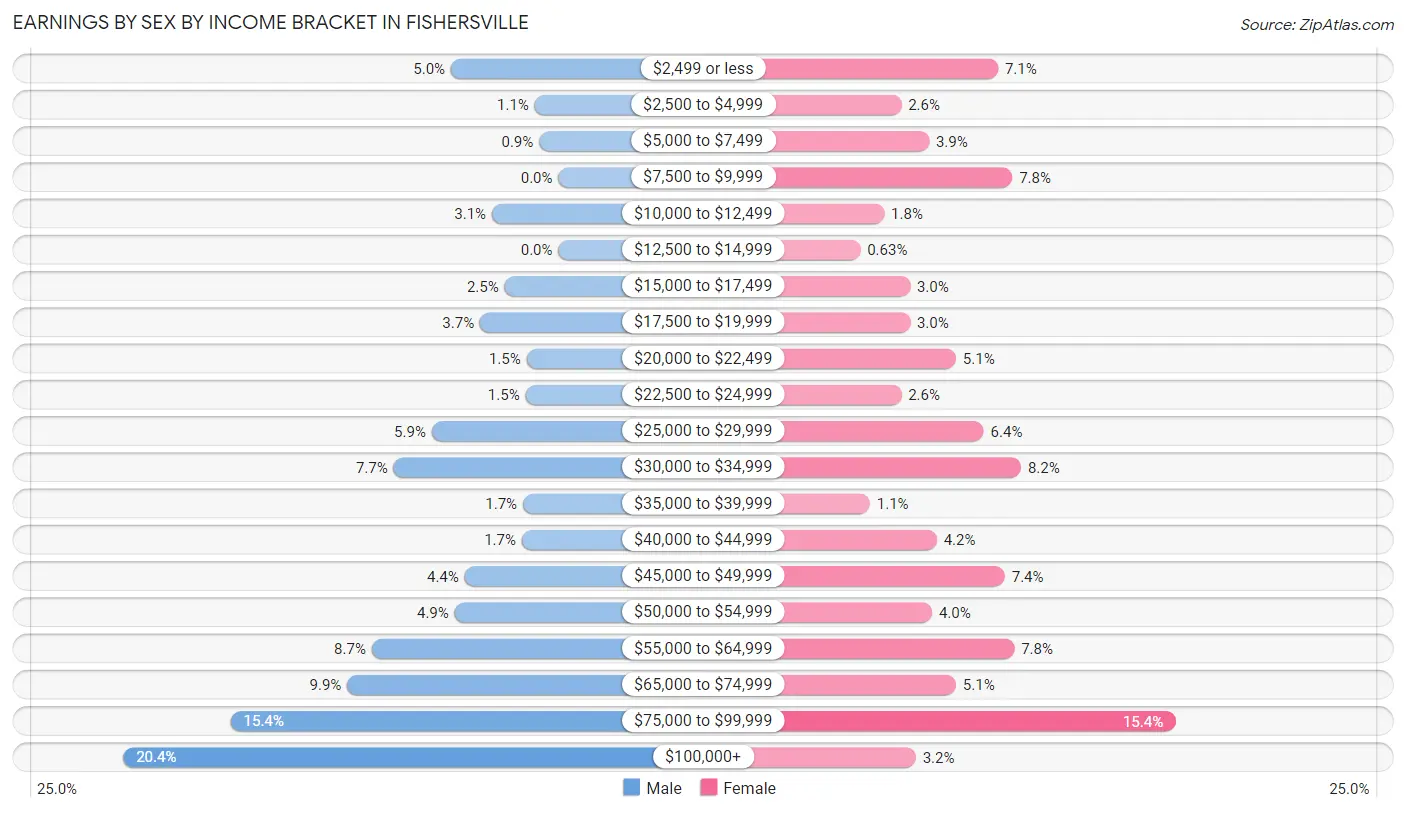
Earnings by Sex by Income Bracket in Fishersville
The most common earnings brackets in Fishersville are $100,000+ for men (478 | 20.4%) and $75,000 to $99,999 for women (343 | 15.4%).
| Income | Male | Female |
| $2,499 or less | 118 (5.0%) | 158 (7.1%) |
| $2,500 to $4,999 | 26 (1.1%) | 57 (2.5%) |
| $5,000 to $7,499 | 21 (0.9%) | 86 (3.8%) |
| $7,500 to $9,999 | 0 (0.0%) | 173 (7.7%) |
| $10,000 to $12,499 | 73 (3.1%) | 39 (1.8%) |
| $12,500 to $14,999 | 0 (0.0%) | 14 (0.6%) |
| $15,000 to $17,499 | 59 (2.5%) | 66 (3.0%) |
| $17,500 to $19,999 | 86 (3.7%) | 66 (3.0%) |
| $20,000 to $22,499 | 35 (1.5%) | 114 (5.1%) |
| $22,500 to $24,999 | 36 (1.5%) | 57 (2.5%) |
| $25,000 to $29,999 | 139 (5.9%) | 143 (6.4%) |
| $30,000 to $34,999 | 181 (7.7%) | 182 (8.2%) |
| $35,000 to $39,999 | 39 (1.7%) | 24 (1.1%) |
| $40,000 to $44,999 | 40 (1.7%) | 94 (4.2%) |
| $45,000 to $49,999 | 103 (4.4%) | 165 (7.4%) |
| $50,000 to $54,999 | 114 (4.9%) | 89 (4.0%) |
| $55,000 to $64,999 | 205 (8.7%) | 175 (7.8%) |
| $65,000 to $74,999 | 232 (9.9%) | 114 (5.1%) |
| $75,000 to $99,999 | 360 (15.3%) | 343 (15.4%) |
| $100,000+ | 478 (20.4%) | 72 (3.2%) |
| Total | 2,345 (100.0%) | 2,231 (100.0%) |
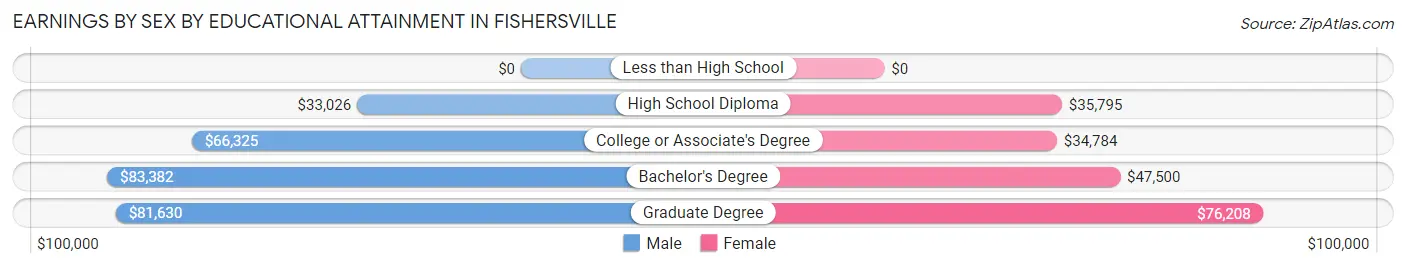
Earnings by Sex by Educational Attainment in Fishersville
Average earnings in Fishersville are $64,438 for men and $43,734 for women, a difference of 32.1%. Men with an educational attainment of bachelor's degree enjoy the highest average annual earnings of $83,382, while those with high school diploma education earn the least with $33,026. Women with an educational attainment of graduate degree earn the most with the average annual earnings of $76,208, while those with college or associate's degree education have the smallest earnings of $34,784.
| Educational Attainment | Male Income | Female Income |
| Less than High School | - | - |
| High School Diploma | $33,026 | $35,795 |
| College or Associate's Degree | $66,325 | $34,784 |
| Bachelor's Degree | $83,382 | $47,500 |
| Graduate Degree | $81,630 | $76,208 |
| Total | $64,438 | $43,734 |
Family Income in Fishersville
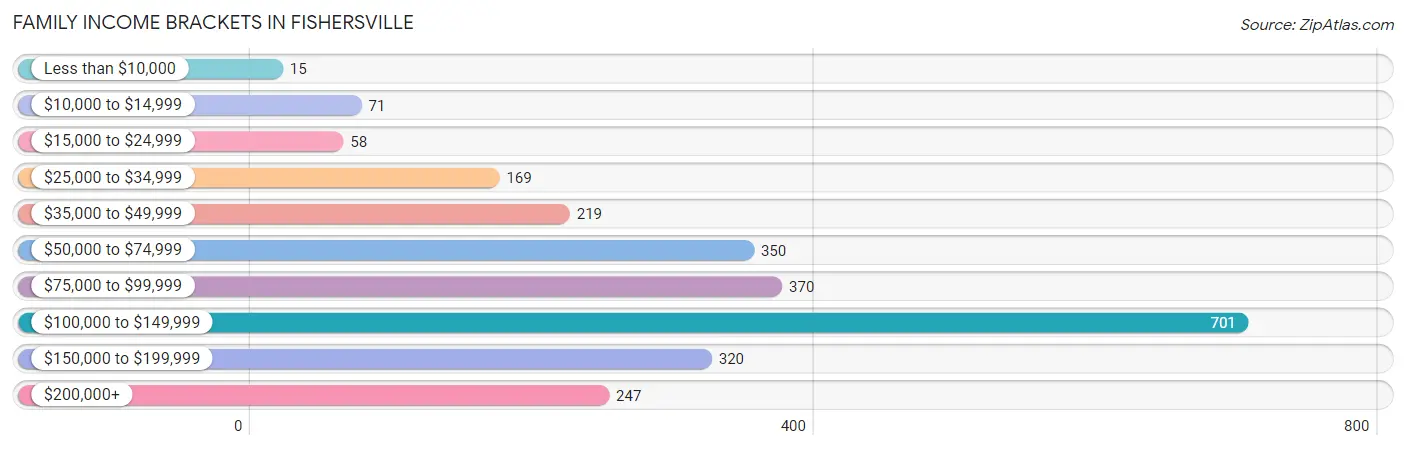
Family Income Brackets in Fishersville
According to the Fishersville family income data, there are 701 families falling into the $100,000 to $149,999 income range, which is the most common income bracket and makes up 27.8% of all families. Conversely, the less than $10,000 income bracket is the least frequent group with only 15 families (0.6%) belonging to this category.
| Income Bracket | # Families | % Families |
| Less than $10,000 | 15 | 0.6% |
| $10,000 to $14,999 | 71 | 2.8% |
| $15,000 to $24,999 | 58 | 2.3% |
| $25,000 to $34,999 | 169 | 6.7% |
| $35,000 to $49,999 | 219 | 8.7% |
| $50,000 to $74,999 | 350 | 13.9% |
| $75,000 to $99,999 | 370 | 14.7% |
| $100,000 to $149,999 | 701 | 27.8% |
| $150,000 to $199,999 | 320 | 12.7% |
| $200,000+ | 247 | 9.8% |
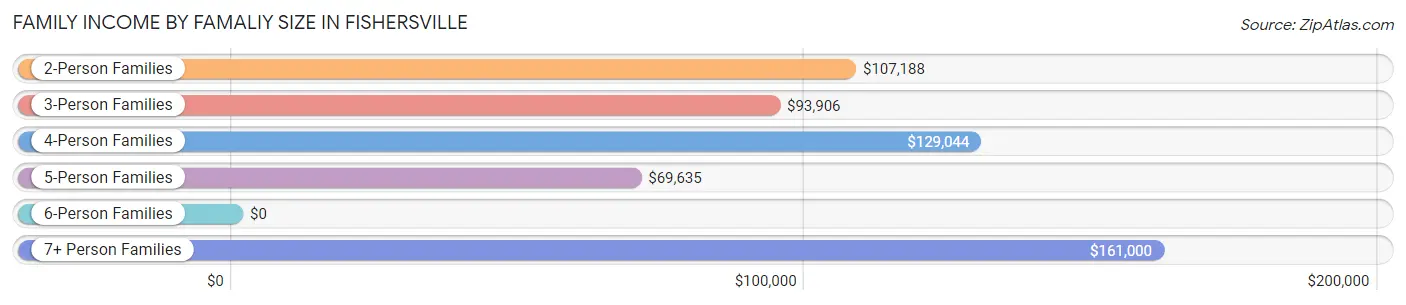
Family Income by Famaliy Size in Fishersville
7+ person families (30 | 1.2%) account for the highest median family income in Fishersville with $161,000 per family, while 2-person families (1,388 | 55.1%) have the highest median income of $53,594 per family member.
| Income Bracket | # Families | Median Income |
| 2-Person Families | 1,388 (55.1%) | $107,188 |
| 3-Person Families | 587 (23.3%) | $93,906 |
| 4-Person Families | 221 (8.8%) | $129,044 |
| 5-Person Families | 125 (5.0%) | $69,635 |
| 6-Person Families | 169 (6.7%) | $0 |
| 7+ Person Families | 30 (1.2%) | $161,000 |
| Total | 2,520 (100.0%) | $103,083 |
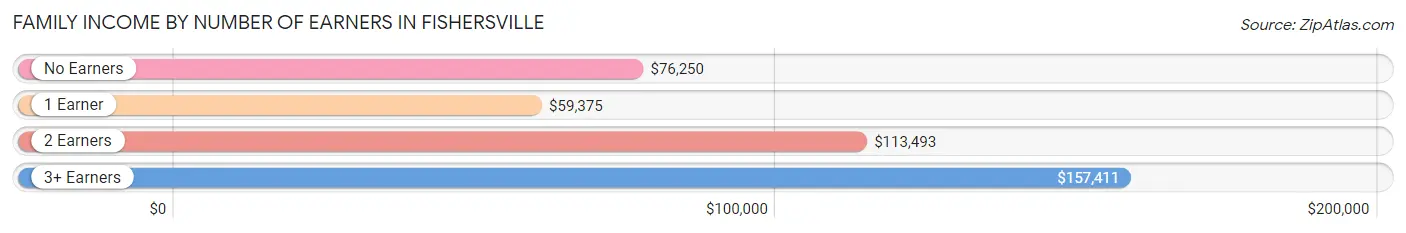
Family Income by Number of Earners in Fishersville
The median family income in Fishersville is $103,083, with families comprising 3+ earners (159) having the highest median family income of $157,411, while families with 1 earner (703) have the lowest median family income of $59,375, accounting for 6.3% and 27.9% of families, respectively.
| Number of Earners | # Families | Median Income |
| No Earners | 530 (21.0%) | $76,250 |
| 1 Earner | 703 (27.9%) | $59,375 |
| 2 Earners | 1,128 (44.8%) | $113,493 |
| 3+ Earners | 159 (6.3%) | $157,411 |
| Total | 2,520 (100.0%) | $103,083 |
Household Income in Fishersville
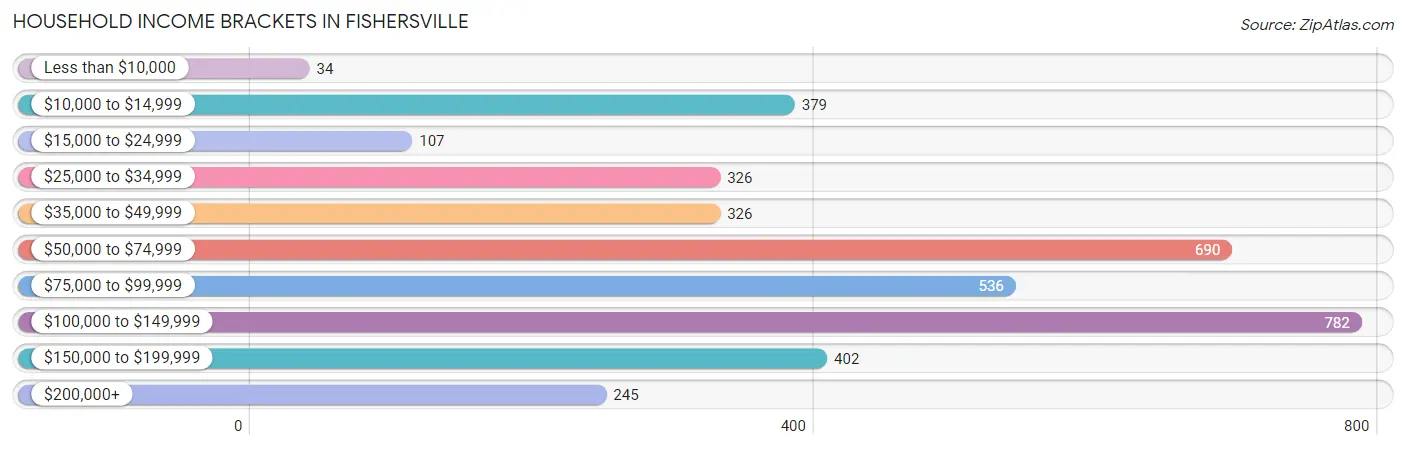
Household Income Brackets in Fishersville
With 782 households falling in the category, the $100,000 to $149,999 income range is the most frequent in Fishersville, accounting for 20.4% of all households. In contrast, only 34 households (0.9%) fall into the less than $10,000 income bracket, making it the least populous group.
| Income Bracket | # Households | % Households |
| Less than $10,000 | 34 | 0.9% |
| $10,000 to $14,999 | 379 | 9.9% |
| $15,000 to $24,999 | 107 | 2.8% |
| $25,000 to $34,999 | 326 | 8.5% |
| $35,000 to $49,999 | 326 | 8.5% |
| $50,000 to $74,999 | 690 | 18.0% |
| $75,000 to $99,999 | 536 | 14.0% |
| $100,000 to $149,999 | 782 | 20.4% |
| $150,000 to $199,999 | 402 | 10.5% |
| $200,000+ | 245 | 6.4% |
Household Income by Householder Age in Fishersville
The median household income in Fishersville is $77,134, with the highest median household income of $97,298 found in the 45 to 64 years age bracket for the primary householder. A total of 1,211 households (31.6%) fall into this category. Meanwhile, the 15 to 24 years age bracket for the primary householder has the lowest median household income of $0, with 93 households (2.4%) in this group.
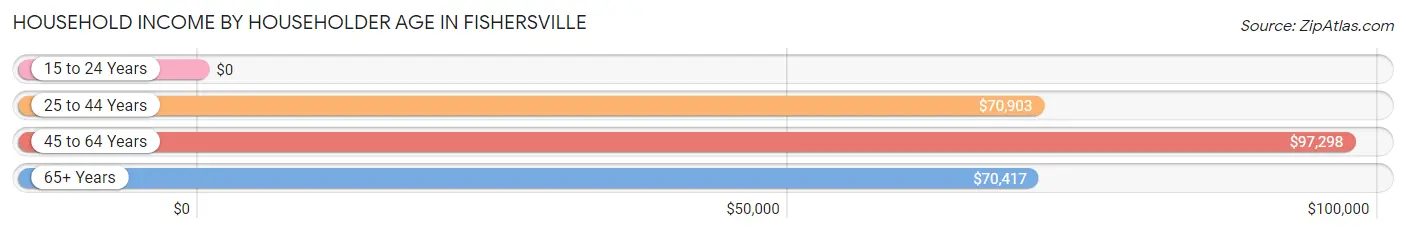
| Income Bracket | # Households | Median Income |
| 15 to 24 Years | 93 (2.4%) | $0 |
| 25 to 44 Years | 1,145 (29.9%) | $70,903 |
| 45 to 64 Years | 1,211 (31.6%) | $97,298 |
| 65+ Years | 1,382 (36.1%) | $70,417 |
| Total | 3,831 (100.0%) | $77,134 |
Poverty in Fishersville
Income Below Poverty by Sex and Age in Fishersville
With 12.1% poverty level for males and 15.1% for females among the residents of Fishersville, 5 year old males and 16 and 17 year old females are the most vulnerable to poverty, with 47 males (77.0%) and 27 females (36.0%) in their respective age groups living below the poverty level.
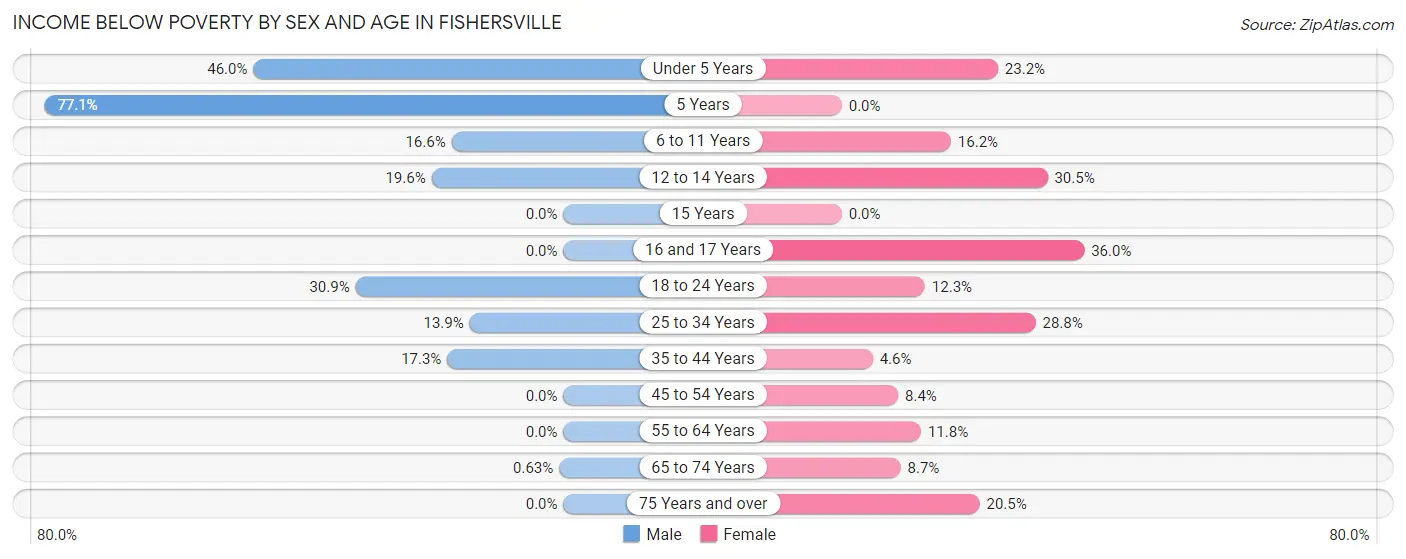
| Age Bracket | Male | Female |
| Under 5 Years | 122 (46.0%) | 54 (23.2%) |
| 5 Years | 47 (77.0%) | 0 (0.0%) |
| 6 to 11 Years | 51 (16.6%) | 23 (16.2%) |
| 12 to 14 Years | 28 (19.6%) | 62 (30.5%) |
| 15 Years | 0 (0.0%) | 0 (0.0%) |
| 16 and 17 Years | 0 (0.0%) | 27 (36.0%) |
| 18 to 24 Years | 71 (30.9%) | 48 (12.3%) |
| 25 to 34 Years | 56 (13.9%) | 206 (28.8%) |
| 35 to 44 Years | 123 (17.2%) | 28 (4.6%) |
| 45 to 54 Years | 0 (0.0%) | 32 (8.4%) |
| 55 to 64 Years | 0 (0.0%) | 76 (11.8%) |
| 65 to 74 Years | 3 (0.6%) | 68 (8.7%) |
| 75 Years and over | 0 (0.0%) | 100 (20.4%) |
| Total | 501 (12.1%) | 724 (15.1%) |
Income Above Poverty by Sex and Age in Fishersville
According to the poverty statistics in Fishersville, males aged 15 years and females aged 5 years are the age groups that are most secure financially, with 100.0% of males and 100.0% of females in these age groups living above the poverty line.
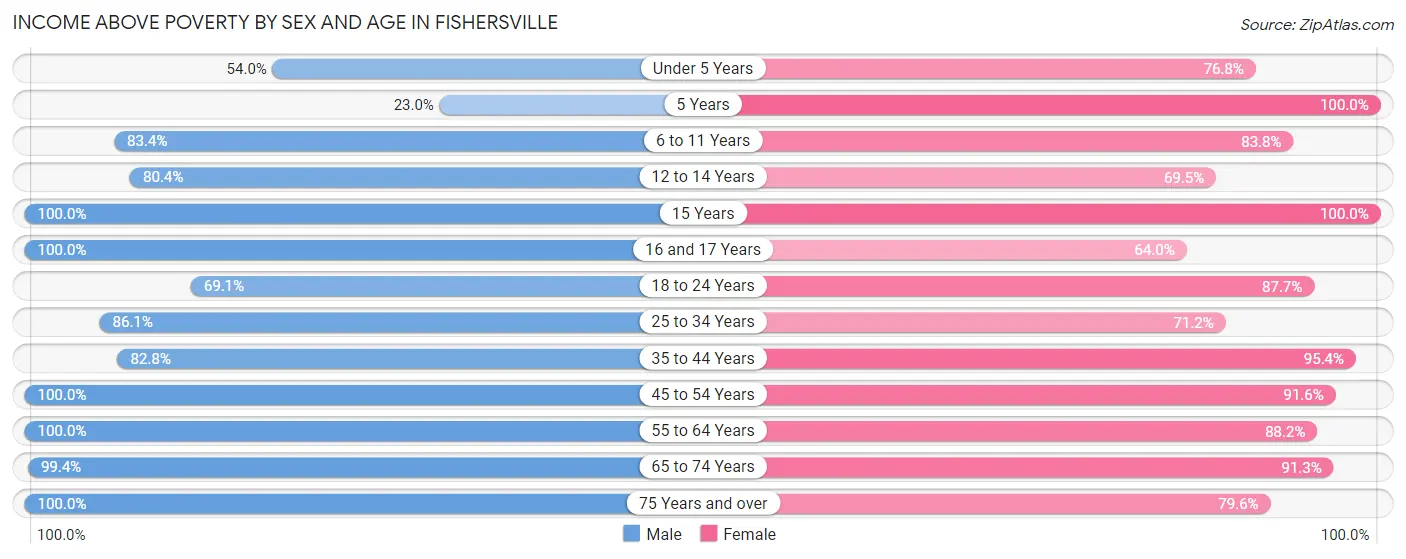
| Age Bracket | Male | Female |
| Under 5 Years | 143 (54.0%) | 179 (76.8%) |
| 5 Years | 14 (23.0%) | 78 (100.0%) |
| 6 to 11 Years | 256 (83.4%) | 119 (83.8%) |
| 12 to 14 Years | 115 (80.4%) | 141 (69.5%) |
| 15 Years | 22 (100.0%) | 63 (100.0%) |
| 16 and 17 Years | 96 (100.0%) | 48 (64.0%) |
| 18 to 24 Years | 159 (69.1%) | 341 (87.7%) |
| 25 to 34 Years | 346 (86.1%) | 510 (71.2%) |
| 35 to 44 Years | 590 (82.8%) | 582 (95.4%) |
| 45 to 54 Years | 641 (100.0%) | 351 (91.6%) |
| 55 to 64 Years | 425 (100.0%) | 570 (88.2%) |
| 65 to 74 Years | 476 (99.4%) | 711 (91.3%) |
| 75 Years and over | 371 (100.0%) | 389 (79.5%) |
| Total | 3,654 (87.9%) | 4,082 (84.9%) |
Income Below Poverty Among Married-Couple Families in Fishersville
The poverty statistics for married-couple families in Fishersville show that 6.4% or 127 of the total 1,992 families live below the poverty line. Families with 3 or 4 children have the highest poverty rate of 38.8%, comprising of 87 families. On the other hand, families with 5 or more children have the lowest poverty rate of 0.0%, which includes 0 families.
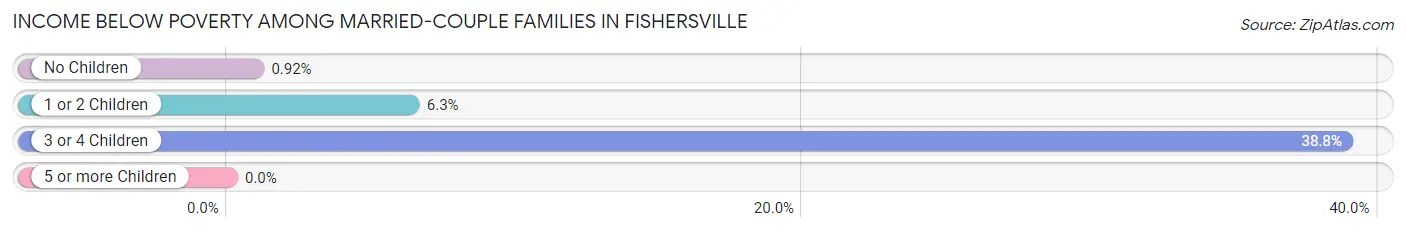
| Children | Above Poverty | Below Poverty |
| No Children | 1,286 (99.1%) | 12 (0.9%) |
| 1 or 2 Children | 414 (93.7%) | 28 (6.3%) |
| 3 or 4 Children | 137 (61.2%) | 87 (38.8%) |
| 5 or more Children | 28 (100.0%) | 0 (0.0%) |
| Total | 1,865 (93.6%) | 127 (6.4%) |
Income Below Poverty Among Single-Parent Households in Fishersville
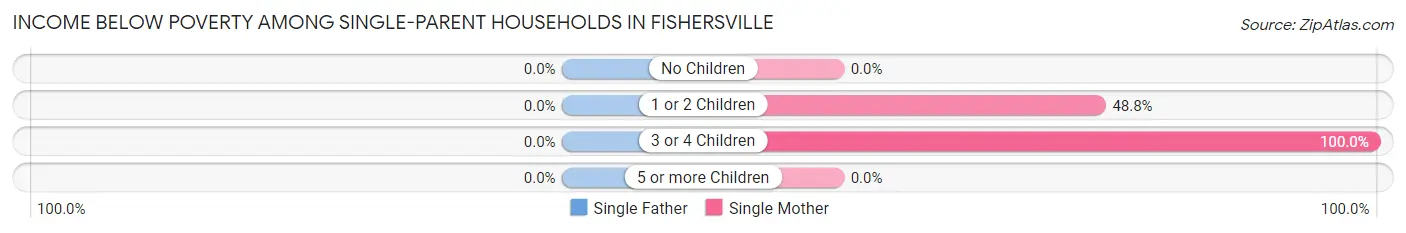
| Children | Single Father | Single Mother |
| No Children | 0 (0.0%) | 0 (0.0%) |
| 1 or 2 Children | 0 (0.0%) | 59 (48.8%) |
| 3 or 4 Children | 0 (0.0%) | 44 (100.0%) |
| 5 or more Children | 0 (0.0%) | 0 (0.0%) |
| Total | 0 (0.0%) | 103 (29.8%) |
Income Below Poverty Among Married-Couple vs Single-Parent Households in Fishersville
The poverty data for Fishersville shows that 127 of the married-couple family households (6.4%) and 103 of the single-parent households (19.5%) are living below the poverty level. Within the married-couple family households, those with 3 or 4 children have the highest poverty rate, with 87 households (38.8%) falling below the poverty line. Among the single-parent households, those with 3 or 4 children have the highest poverty rate, with 44 household (84.6%) living below poverty.
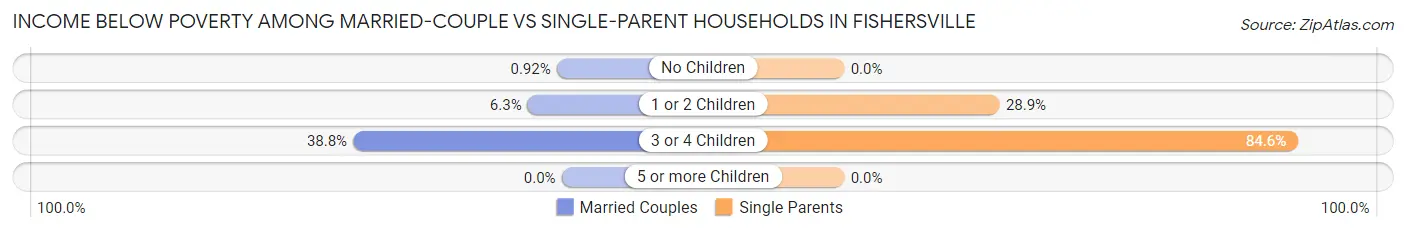
| Children | Married-Couple Families | Single-Parent Households |
| No Children | 12 (0.9%) | 0 (0.0%) |
| 1 or 2 Children | 28 (6.3%) | 59 (28.9%) |
| 3 or 4 Children | 87 (38.8%) | 44 (84.6%) |
| 5 or more Children | 0 (0.0%) | 0 (0.0%) |
| Total | 127 (6.4%) | 103 (19.5%) |
Race in Fishersville
The most populous races in Fishersville are White / Caucasian (7,870 | 83.5%), Black / African American (813 | 8.6%), and Hispanic or Latino (524 | 5.6%).
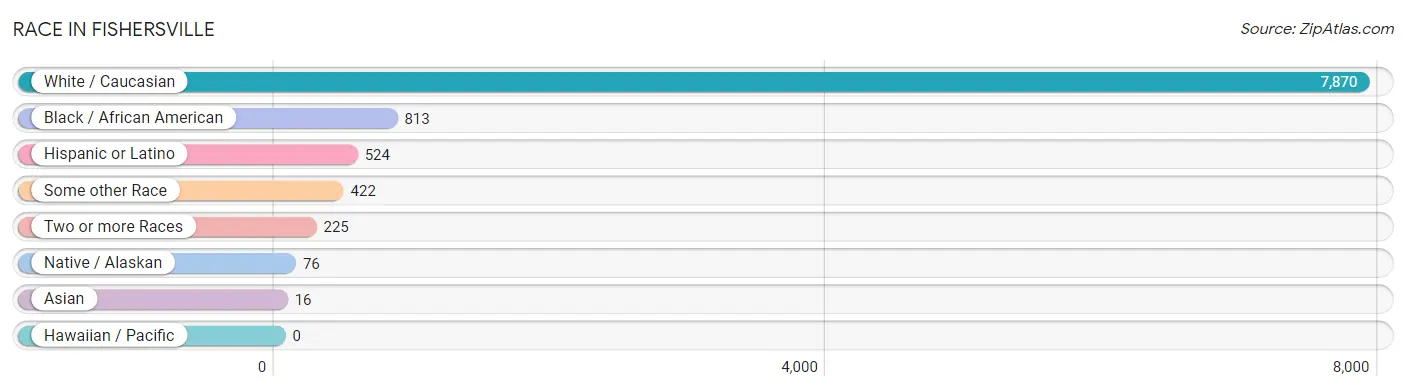
| Race | # Population | % Population |
| Asian | 16 | 0.2% |
| Black / African American | 813 | 8.6% |
| Hawaiian / Pacific | 0 | 0.0% |
| Hispanic or Latino | 524 | 5.6% |
| Native / Alaskan | 76 | 0.8% |
| White / Caucasian | 7,870 | 83.5% |
| Two or more Races | 225 | 2.4% |
| Some other Race | 422 | 4.5% |
| Total | 9,422 | 100.0% |
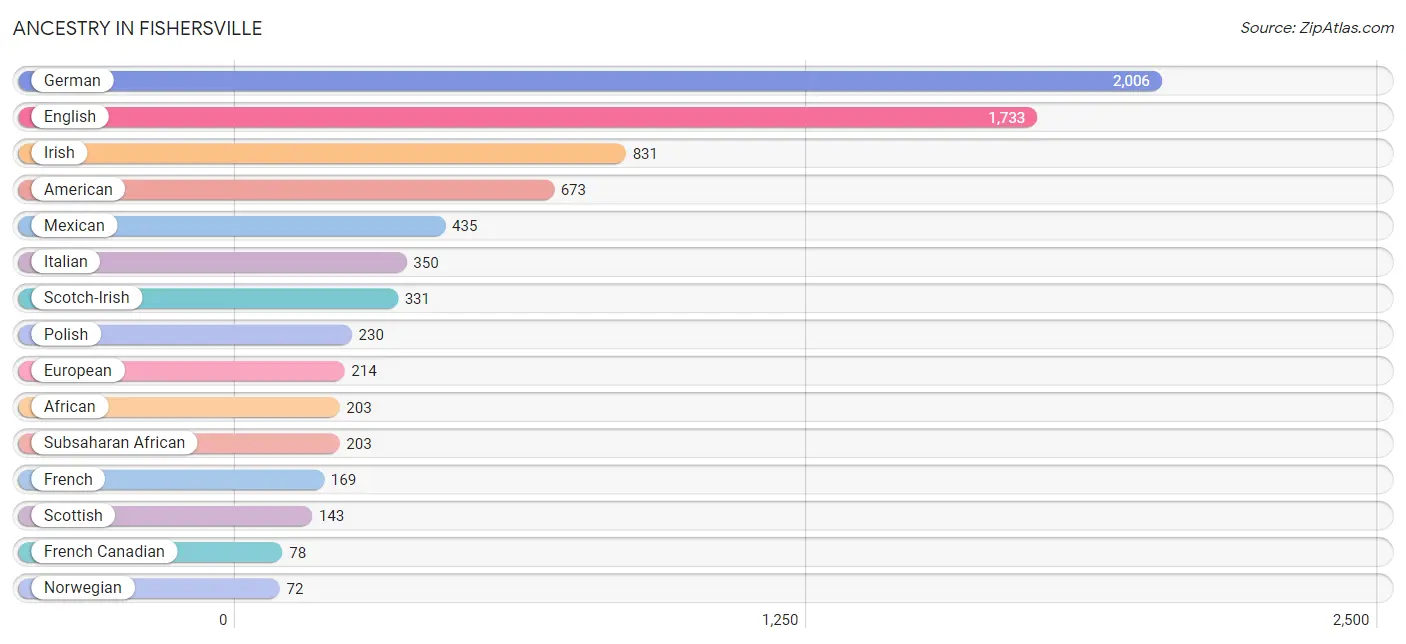
Ancestry in Fishersville
The most populous ancestries reported in Fishersville are German (2,006 | 21.3%), English (1,733 | 18.4%), Irish (831 | 8.8%), American (673 | 7.1%), and Mexican (435 | 4.6%), together accounting for 60.3% of all Fishersville residents.
| Ancestry | # Population | % Population |
| African | 203 | 2.1% |
| American | 673 | 7.1% |
| Blackfeet | 19 | 0.2% |
| British | 31 | 0.3% |
| Central American | 22 | 0.2% |
| Central American Indian | 22 | 0.2% |
| Cherokee | 44 | 0.5% |
| Cuban | 12 | 0.1% |
| Czech | 35 | 0.4% |
| Czechoslovakian | 32 | 0.3% |
| Danish | 46 | 0.5% |
| Dutch | 37 | 0.4% |
| English | 1,733 | 18.4% |
| European | 214 | 2.3% |
| French | 169 | 1.8% |
| French Canadian | 78 | 0.8% |
| German | 2,006 | 21.3% |
| Greek | 7 | 0.1% |
| Guatemalan | 22 | 0.2% |
| Hungarian | 61 | 0.6% |
| Indian (Asian) | 7 | 0.1% |
| Irish | 831 | 8.8% |
| Italian | 350 | 3.7% |
| Jamaican | 26 | 0.3% |
| Korean | 7 | 0.1% |
| Latvian | 58 | 0.6% |
| Mexican | 435 | 4.6% |
| Northern European | 36 | 0.4% |
| Norwegian | 72 | 0.8% |
| Pakistani | 32 | 0.3% |
| Peruvian | 37 | 0.4% |
| Polish | 230 | 2.4% |
| Russian | 49 | 0.5% |
| Scandinavian | 54 | 0.6% |
| Scotch-Irish | 331 | 3.5% |
| Scottish | 143 | 1.5% |
| South American | 37 | 0.4% |
| South American Indian | 34 | 0.4% |
| Spanish | 11 | 0.1% |
| Subsaharan African | 203 | 2.1% |
| Swedish | 27 | 0.3% |
| Swiss | 56 | 0.6% |
| Thai | 3 | 0.0% |
| Welsh | 71 | 0.7% | View All 44 Rows |
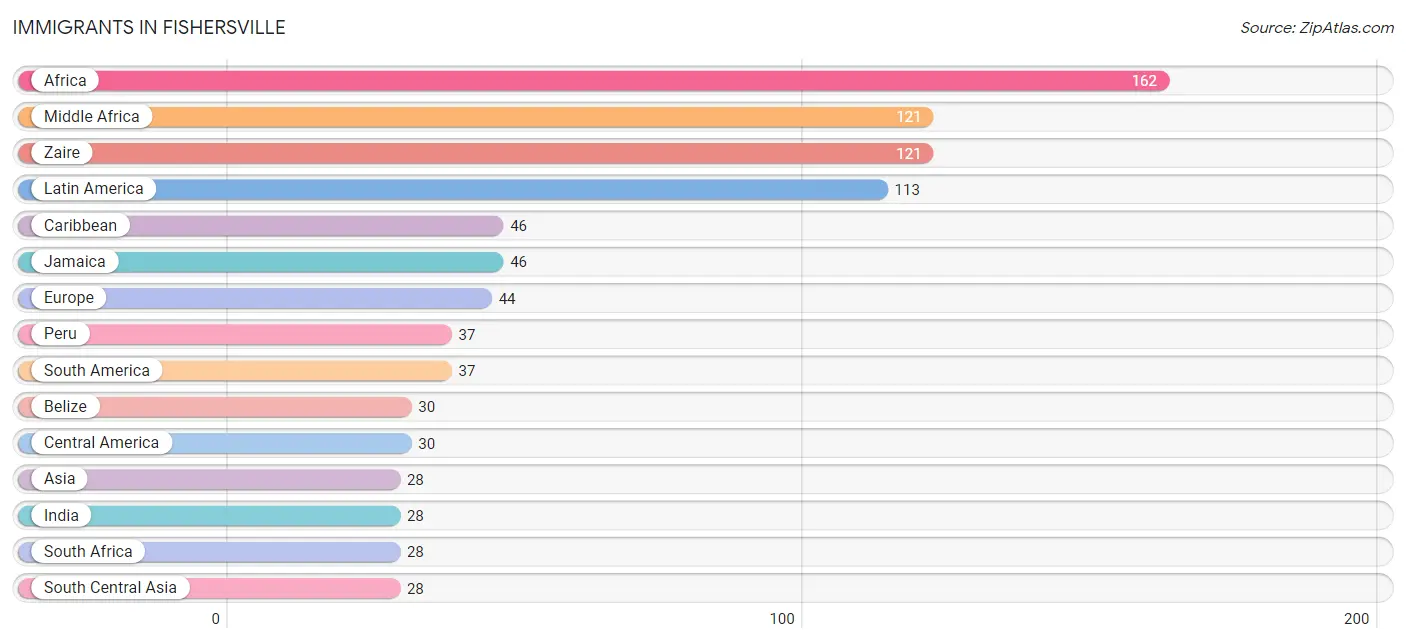
Immigrants in Fishersville
The most numerous immigrant groups reported in Fishersville came from Africa (162 | 1.7%), Middle Africa (121 | 1.3%), Zaire (121 | 1.3%), Latin America (113 | 1.2%), and Caribbean (46 | 0.5%), together accounting for 6.0% of all Fishersville residents.
| Immigration Origin | # Population | % Population |
| Africa | 162 | 1.7% |
| Asia | 28 | 0.3% |
| Belize | 30 | 0.3% |
| Caribbean | 46 | 0.5% |
| Central America | 30 | 0.3% |
| Eastern Africa | 13 | 0.1% |
| Eastern Europe | 15 | 0.2% |
| Ethiopia | 13 | 0.1% |
| Europe | 44 | 0.5% |
| France | 8 | 0.1% |
| Hungary | 15 | 0.2% |
| India | 28 | 0.3% |
| Jamaica | 46 | 0.5% |
| Latin America | 113 | 1.2% |
| Middle Africa | 121 | 1.3% |
| Northern Europe | 21 | 0.2% |
| Peru | 37 | 0.4% |
| South Africa | 28 | 0.3% |
| South America | 37 | 0.4% |
| South Central Asia | 28 | 0.3% |
| Western Europe | 8 | 0.1% |
| Zaire | 121 | 1.3% | View All 22 Rows |
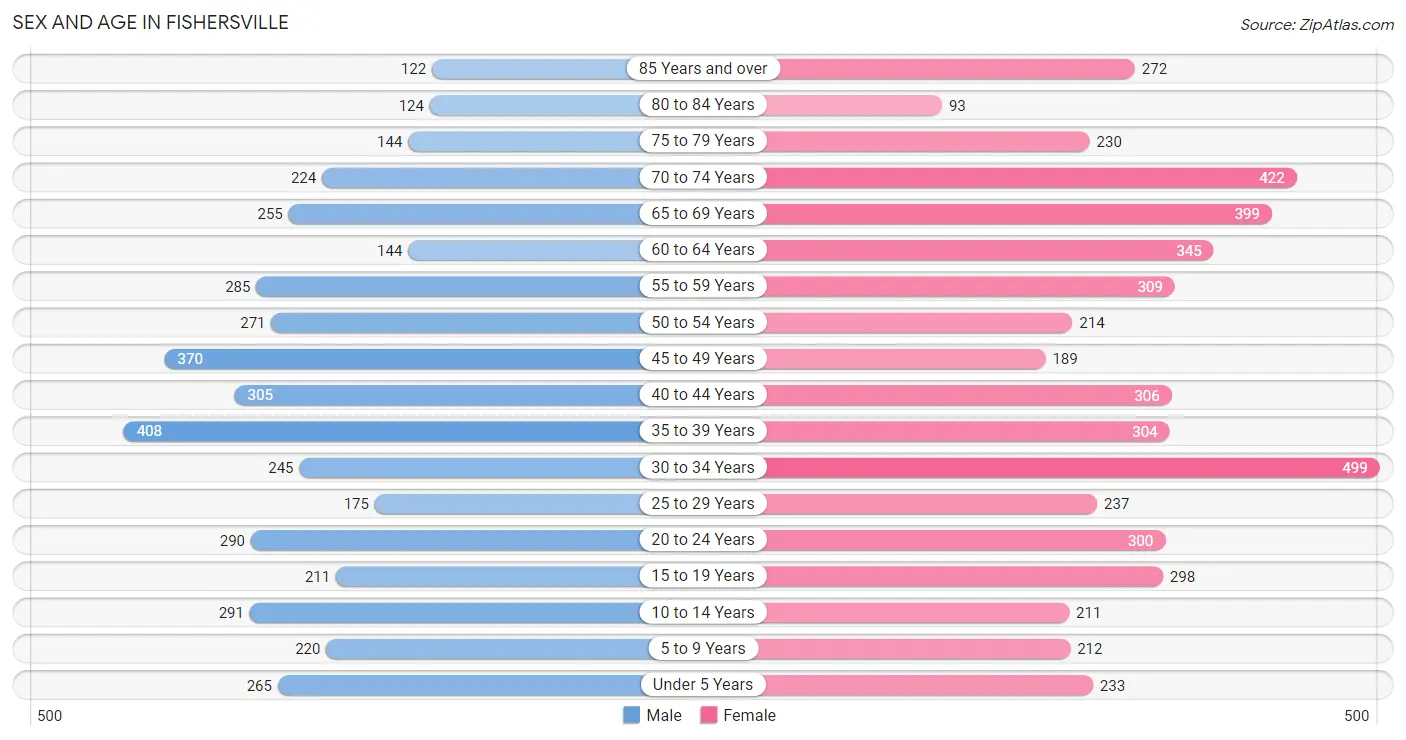
Sex and Age in Fishersville
Sex and Age in Fishersville
The most populous age groups in Fishersville are 35 to 39 Years (408 | 9.4%) for men and 30 to 34 Years (499 | 9.8%) for women.
| Age Bracket | Male | Female |
| Under 5 Years | 265 (6.1%) | 233 (4.6%) |
| 5 to 9 Years | 220 (5.1%) | 212 (4.2%) |
| 10 to 14 Years | 291 (6.7%) | 211 (4.2%) |
| 15 to 19 Years | 211 (4.9%) | 298 (5.9%) |
| 20 to 24 Years | 290 (6.7%) | 300 (5.9%) |
| 25 to 29 Years | 175 (4.0%) | 237 (4.7%) |
| 30 to 34 Years | 245 (5.6%) | 499 (9.8%) |
| 35 to 39 Years | 408 (9.4%) | 304 (6.0%) |
| 40 to 44 Years | 305 (7.0%) | 306 (6.0%) |
| 45 to 49 Years | 370 (8.5%) | 189 (3.7%) |
| 50 to 54 Years | 271 (6.2%) | 214 (4.2%) |
| 55 to 59 Years | 285 (6.6%) | 309 (6.1%) |
| 60 to 64 Years | 144 (3.3%) | 345 (6.8%) |
| 65 to 69 Years | 255 (5.9%) | 399 (7.9%) |
| 70 to 74 Years | 224 (5.1%) | 422 (8.3%) |
| 75 to 79 Years | 144 (3.3%) | 230 (4.5%) |
| 80 to 84 Years | 124 (2.9%) | 93 (1.8%) |
| 85 Years and over | 122 (2.8%) | 272 (5.4%) |
| Total | 4,349 (100.0%) | 5,073 (100.0%) |
Families and Households in Fishersville
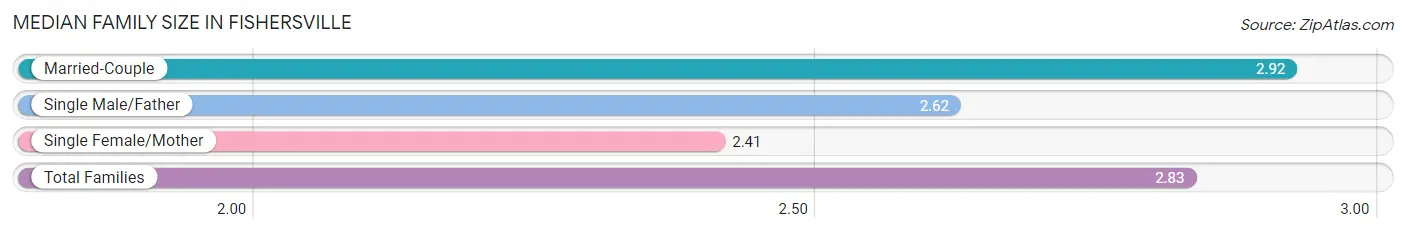
Median Family Size in Fishersville
The median family size in Fishersville is 2.83 persons per family, with married-couple families (1,992 | 79.0%) accounting for the largest median family size of 2.92 persons per family. On the other hand, single female/mother families (346 | 13.7%) represent the smallest median family size with 2.41 persons per family.
| Family Type | # Families | Family Size |
| Married-Couple | 1,992 (79.0%) | 2.92 |
| Single Male/Father | 182 (7.2%) | 2.62 |
| Single Female/Mother | 346 (13.7%) | 2.41 |
| Total Families | 2,520 (100.0%) | 2.83 |
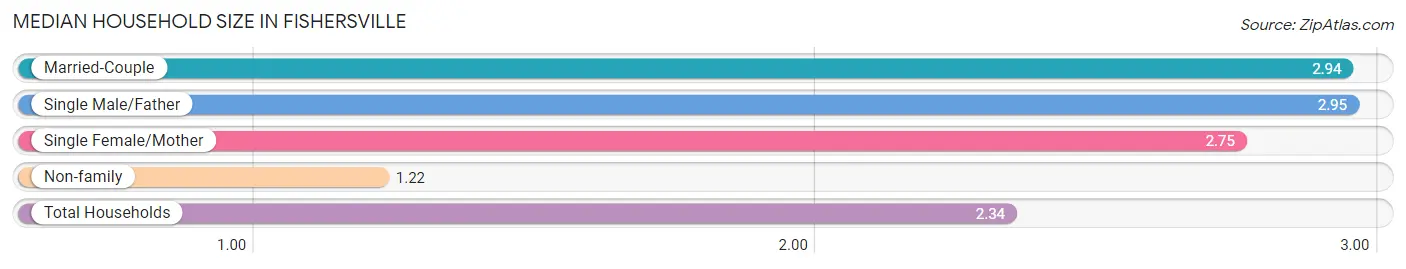
Median Household Size in Fishersville
The median household size in Fishersville is 2.34 persons per household, with single male/father households (182 | 4.8%) accounting for the largest median household size of 2.95 persons per household. non-family households (1,311 | 34.2%) represent the smallest median household size with 1.22 persons per household.
| Household Type | # Households | Household Size |
| Married-Couple | 1,992 (52.0%) | 2.94 |
| Single Male/Father | 182 (4.8%) | 2.95 |
| Single Female/Mother | 346 (9.0%) | 2.75 |
| Non-family | 1,311 (34.2%) | 1.22 |
| Total Households | 3,831 (100.0%) | 2.34 |
Household Size by Marriage Status in Fishersville
Out of a total of 3,831 households in Fishersville, 2,520 (65.8%) are family households, while 1,311 (34.2%) are nonfamily households. The most numerous type of family households are 2-person households, comprising 1,355, and the most common type of nonfamily households are 1-person households, comprising 1,022.
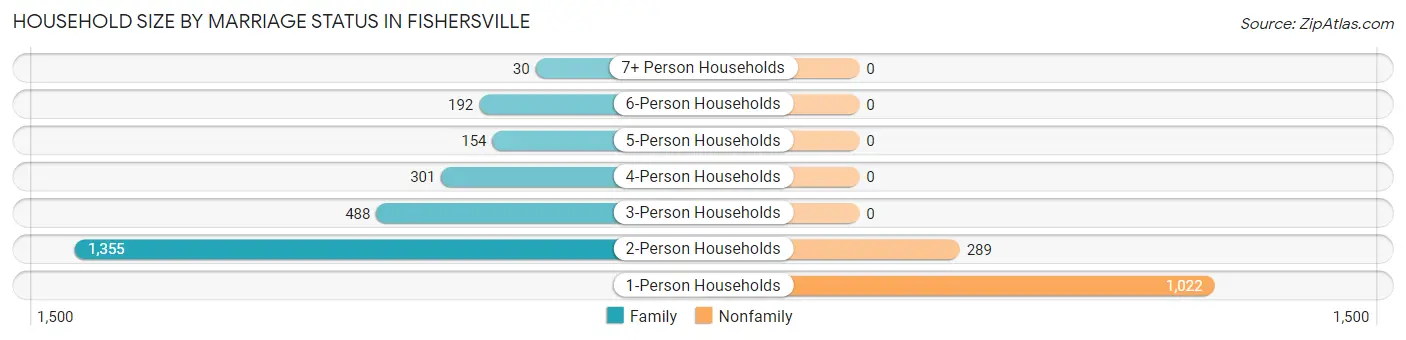
| Household Size | Family Households | Nonfamily Households |
| 1-Person Households | - | 1,022 (26.7%) |
| 2-Person Households | 1,355 (35.4%) | 289 (7.5%) |
| 3-Person Households | 488 (12.7%) | 0 (0.0%) |
| 4-Person Households | 301 (7.9%) | 0 (0.0%) |
| 5-Person Households | 154 (4.0%) | 0 (0.0%) |
| 6-Person Households | 192 (5.0%) | 0 (0.0%) |
| 7+ Person Households | 30 (0.8%) | 0 (0.0%) |
| Total | 2,520 (65.8%) | 1,311 (34.2%) |
Female Fertility in Fishersville
Fertility by Age in Fishersville
Average fertility rate in Fishersville is 54.0 births per 1,000 women. Women in the age bracket of 20 to 34 years have the highest fertility rate with 95.0 births per 1,000 women. Women in the age bracket of 20 to 34 years acount for 83.1% of all women with births.
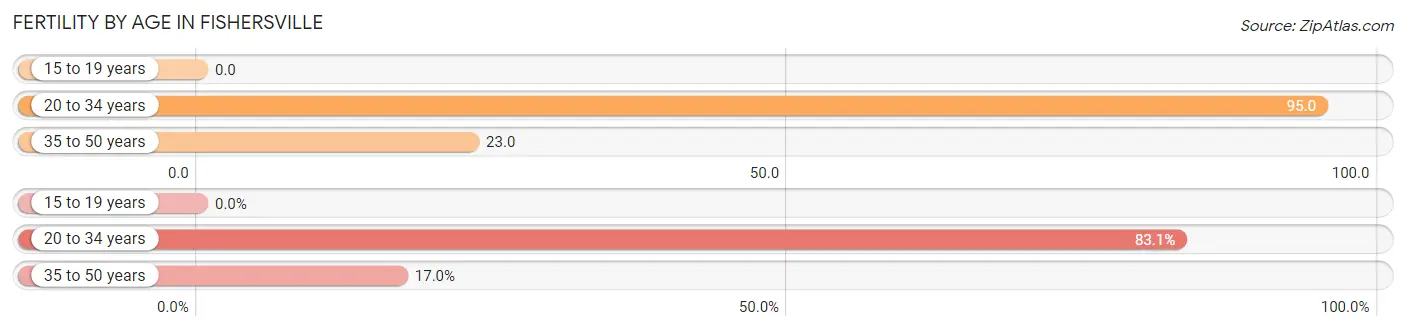
| Age Bracket | Women with Births | Births / 1,000 Women |
| 15 to 19 years | 0 (0.0%) | 0.0 |
| 20 to 34 years | 98 (83.1%) | 95.0 |
| 35 to 50 years | 20 (17.0%) | 23.0 |
| Total | 118 (100.0%) | 54.0 |
Fertility by Age by Marriage Status in Fishersville
50.0% of women with births (118) in Fishersville are married. The highest percentage of unmarried women with births falls into 20 to 34 years age bracket with 60.2% of them unmarried at the time of birth, while the lowest percentage of unmarried women with births belong to 35 to 50 years age bracket with 0.0% of them unmarried.
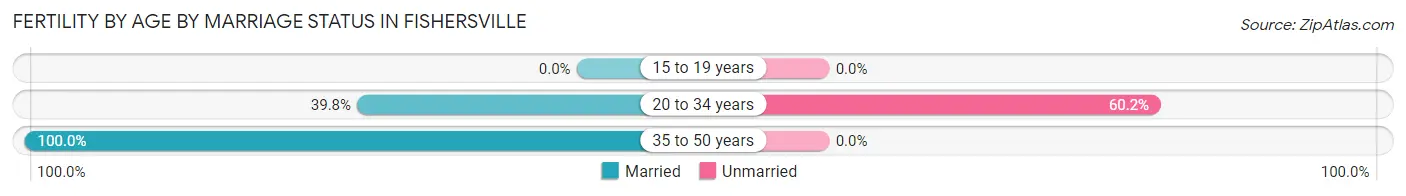
| Age Bracket | Married | Unmarried |
| 15 to 19 years | 0 (0.0%) | 0 (0.0%) |
| 20 to 34 years | 39 (39.8%) | 59 (60.2%) |
| 35 to 50 years | 20 (100.0%) | 0 (0.0%) |
| Total | 59 (50.0%) | 59 (50.0%) |
Fertility by Education in Fishersville
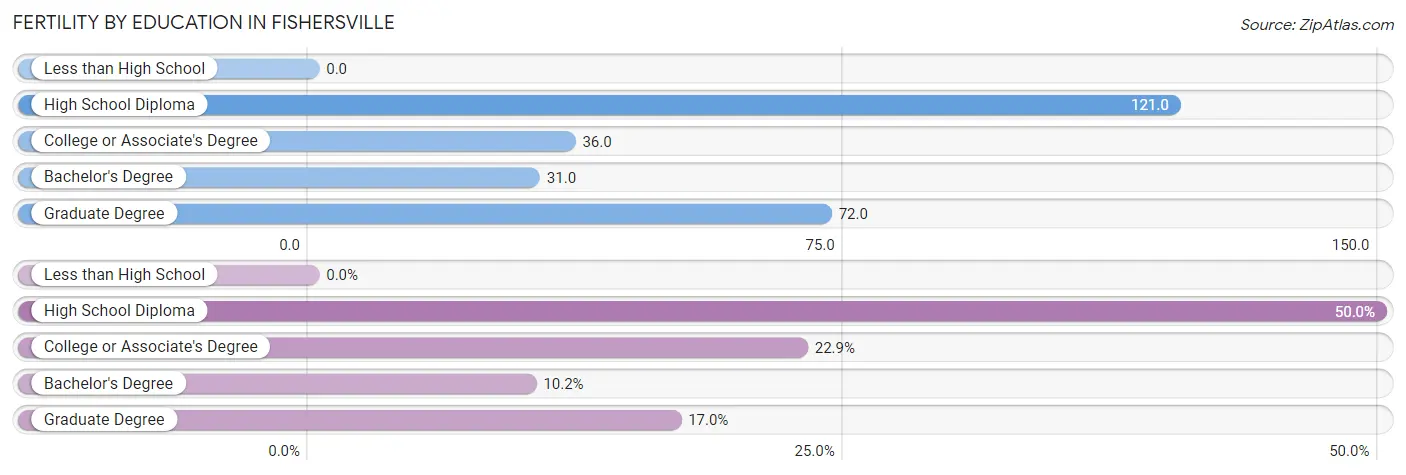
| Educational Attainment | Women with Births | Births / 1,000 Women |
| Less than High School | 0 (0.0%) | 0.0 |
| High School Diploma | 59 (50.0%) | 121.0 |
| College or Associate's Degree | 27 (22.9%) | 36.0 |
| Bachelor's Degree | 12 (10.2%) | 31.0 |
| Graduate Degree | 20 (17.0%) | 72.0 |
| Total | 118 (100.0%) | 54.0 |
Fertility by Education by Marriage Status in Fishersville
50.0% of women with births in Fishersville are unmarried. Women with the educational attainment of college or associate's degree are most likely to be married with 100.0% of them married at childbirth, while women with the educational attainment of high school diploma are least likely to be married with 100.0% of them unmarried at childbirth.
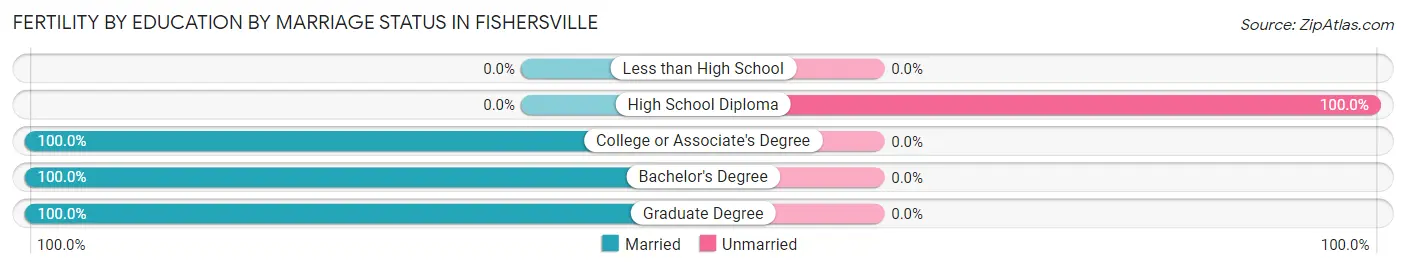
| Educational Attainment | Married | Unmarried |
| Less than High School | 0 (0.0%) | 0 (0.0%) |
| High School Diploma | 0 (0.0%) | 59 (100.0%) |
| College or Associate's Degree | 27 (100.0%) | 0 (0.0%) |
| Bachelor's Degree | 12 (100.0%) | 0 (0.0%) |
| Graduate Degree | 20 (100.0%) | 0 (0.0%) |
| Total | 59 (50.0%) | 59 (50.0%) |
Employment Characteristics in Fishersville
Employment by Class of Employer in Fishersville
Among the 3,881 employed individuals in Fishersville, private company employees (2,787 | 71.8%), state government employees (338 | 8.7%), and local government employees (308 | 7.9%) make up the most common classes of employment.
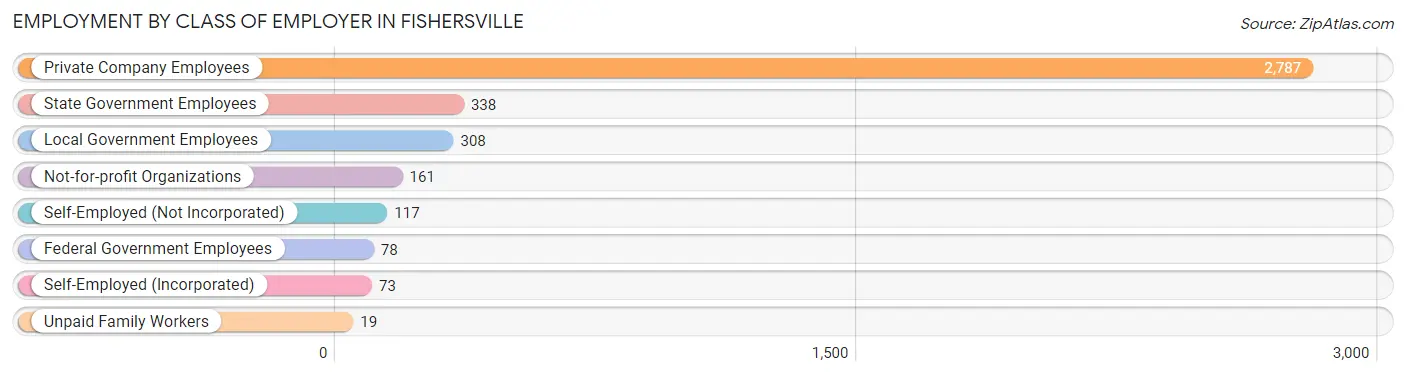
| Employer Class | # Employees | % Employees |
| Private Company Employees | 2,787 | 71.8% |
| Self-Employed (Incorporated) | 73 | 1.9% |
| Self-Employed (Not Incorporated) | 117 | 3.0% |
| Not-for-profit Organizations | 161 | 4.2% |
| Local Government Employees | 308 | 7.9% |
| State Government Employees | 338 | 8.7% |
| Federal Government Employees | 78 | 2.0% |
| Unpaid Family Workers | 19 | 0.5% |
| Total | 3,881 | 100.0% |
Employment Status by Age in Fishersville
According to the labor force statistics for Fishersville, out of the total population over 16 years of age (7,905), 53.4% or 4,221 individuals are in the labor force, with 6.1% or 257 of them unemployed. The age group with the highest labor force participation rate is 30 to 34 years, with 93.7% or 697 individuals in the labor force. Within the labor force, the 16 to 19 years age range has the highest percentage of unemployed individuals, with 17.3% or 9 of them being unemployed.
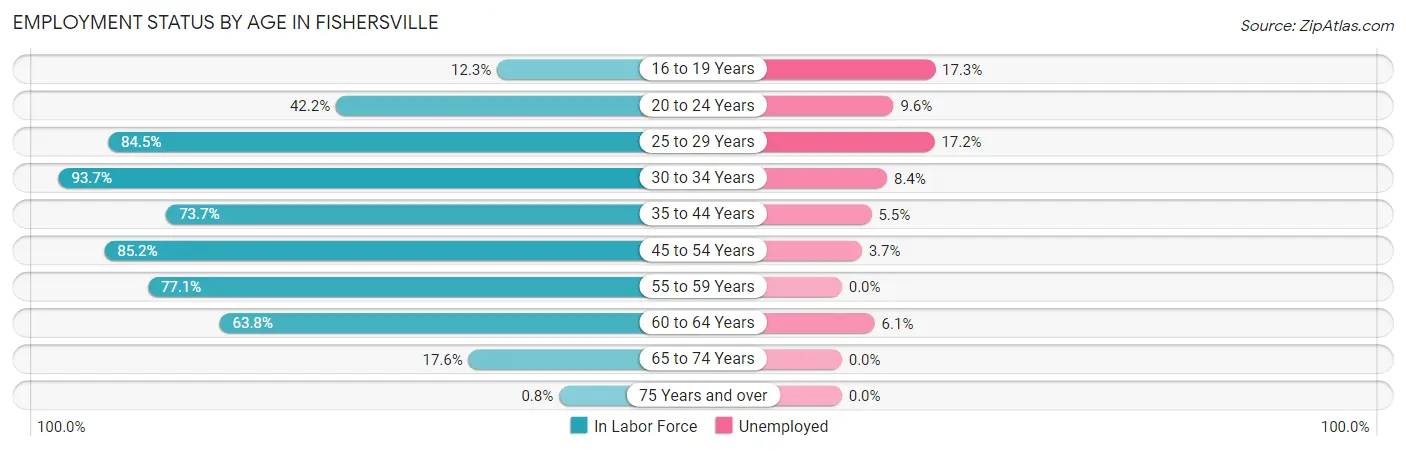
| Age Bracket | In Labor Force | Unemployed |
| 16 to 19 Years | 52 (12.3%) | 9 (17.3%) |
| 20 to 24 Years | 249 (42.2%) | 24 (9.6%) |
| 25 to 29 Years | 348 (84.5%) | 60 (17.2%) |
| 30 to 34 Years | 697 (93.7%) | 59 (8.4%) |
| 35 to 44 Years | 975 (73.7%) | 54 (5.5%) |
| 45 to 54 Years | 889 (85.2%) | 33 (3.7%) |
| 55 to 59 Years | 458 (77.1%) | 0 (0.0%) |
| 60 to 64 Years | 312 (63.8%) | 19 (6.1%) |
| 65 to 74 Years | 229 (17.6%) | 0 (0.0%) |
| 75 Years and over | 8 (0.8%) | 0 (0.0%) |
| Total | 4,221 (53.4%) | 257 (6.1%) |
Employment Status by Educational Attainment in Fishersville
According to labor force statistics for Fishersville, 79.9% of individuals (3,680) out of the total population between 25 and 64 years of age (4,606) are in the labor force, with 6.1% or 224 of them being unemployed. The group with the highest labor force participation rate are those with the educational attainment of high school diploma, with 86.0% or 1,121 individuals in the labor force. Within the labor force, individuals with college / associate degree education have the highest percentage of unemployment, with 8.3% or 115 of them being unemployed.
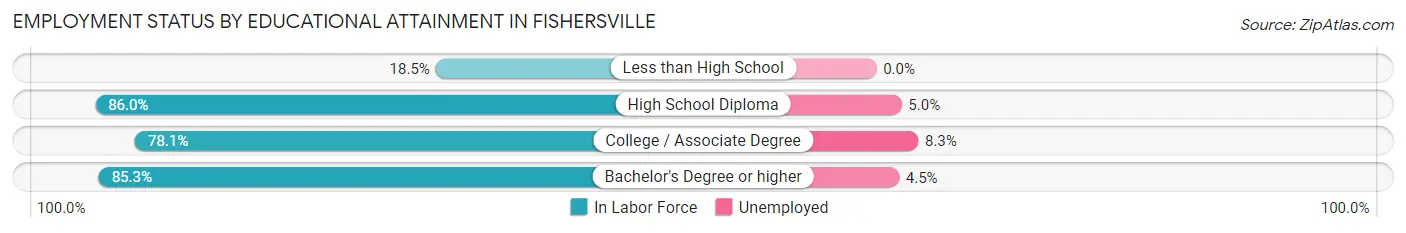
| Educational Attainment | In Labor Force | Unemployed |
| Less than High School | 36 (18.5%) | 0 (0.0%) |
| High School Diploma | 1,121 (86.0%) | 65 (5.0%) |
| College / Associate Degree | 1,382 (78.1%) | 147 (8.3%) |
| Bachelor's Degree or higher | 1,141 (85.3%) | 60 (4.5%) |
| Total | 3,680 (79.9%) | 281 (6.1%) |
Employment Occupations by Sex in Fishersville
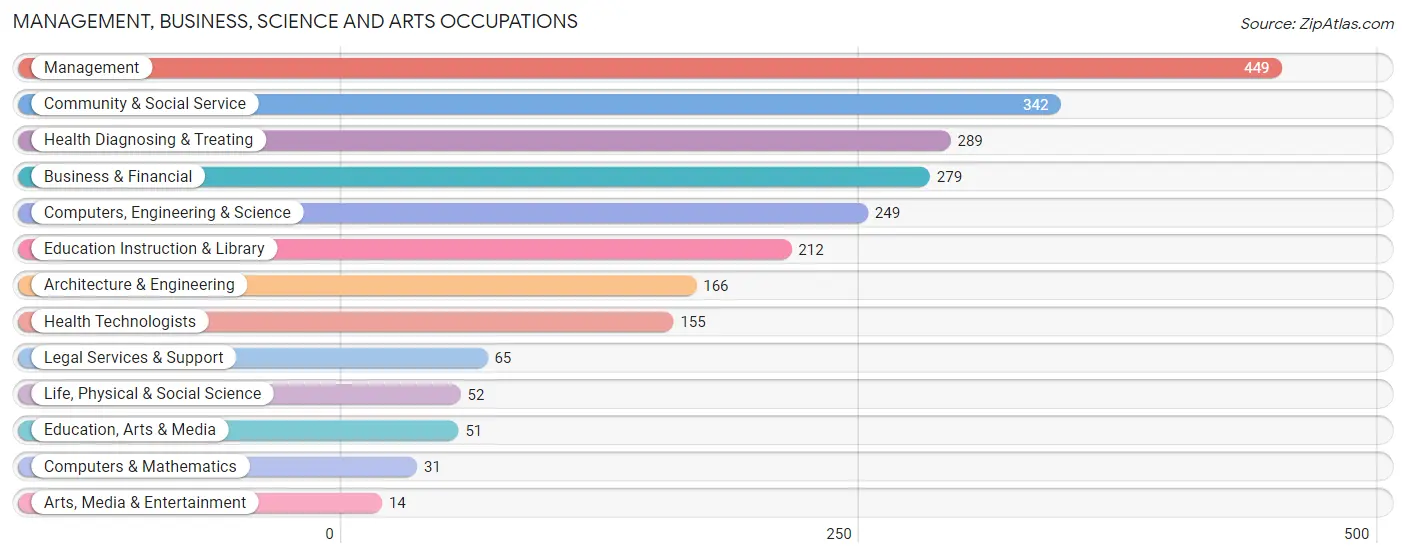
Management, Business, Science and Arts Occupations
The most common Management, Business, Science and Arts occupations in Fishersville are Management (449 | 11.4%), Community & Social Service (342 | 8.7%), Health Diagnosing & Treating (289 | 7.4%), Business & Financial (279 | 7.1%), and Computers, Engineering & Science (249 | 6.3%).
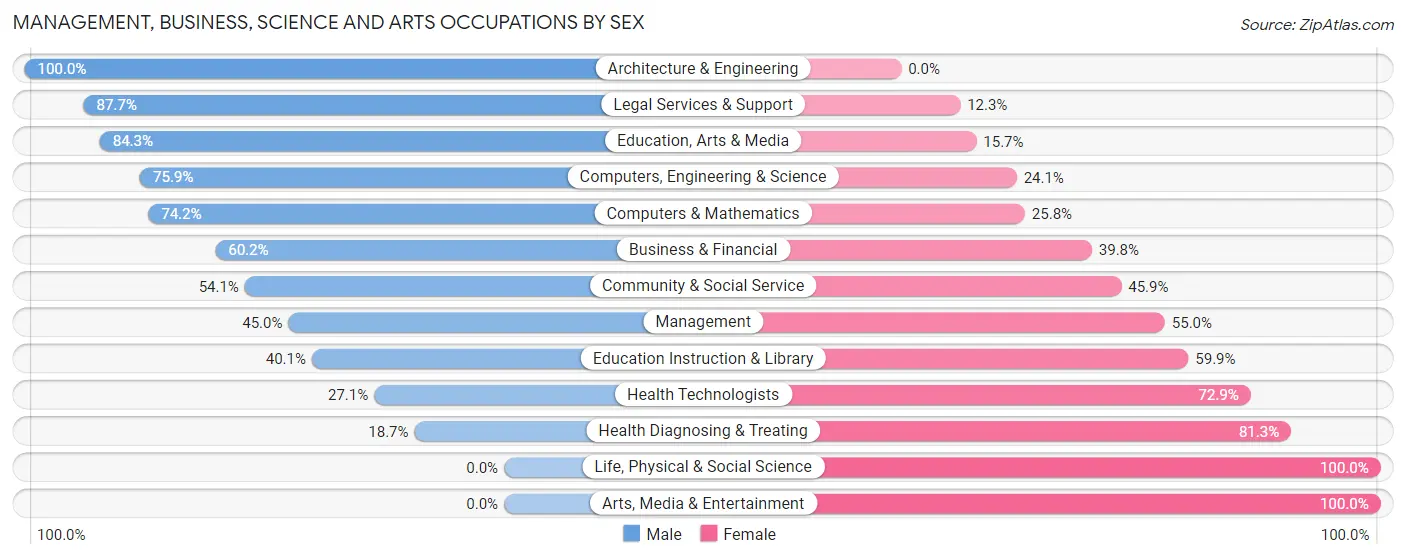
Management, Business, Science and Arts Occupations by Sex
Within the Management, Business, Science and Arts occupations in Fishersville, the most male-oriented occupations are Architecture & Engineering (100.0%), Legal Services & Support (87.7%), and Education, Arts & Media (84.3%), while the most female-oriented occupations are Life, Physical & Social Science (100.0%), Arts, Media & Entertainment (100.0%), and Health Diagnosing & Treating (81.3%).
| Occupation | Male | Female |
| Management | 202 (45.0%) | 247 (55.0%) |
| Business & Financial | 168 (60.2%) | 111 (39.8%) |
| Computers, Engineering & Science | 189 (75.9%) | 60 (24.1%) |
| Computers & Mathematics | 23 (74.2%) | 8 (25.8%) |
| Architecture & Engineering | 166 (100.0%) | 0 (0.0%) |
| Life, Physical & Social Science | 0 (0.0%) | 52 (100.0%) |
| Community & Social Service | 185 (54.1%) | 157 (45.9%) |
| Education, Arts & Media | 43 (84.3%) | 8 (15.7%) |
| Legal Services & Support | 57 (87.7%) | 8 (12.3%) |
| Education Instruction & Library | 85 (40.1%) | 127 (59.9%) |
| Arts, Media & Entertainment | 0 (0.0%) | 14 (100.0%) |
| Health Diagnosing & Treating | 54 (18.7%) | 235 (81.3%) |
| Health Technologists | 42 (27.1%) | 113 (72.9%) |
| Total (Category) | 798 (49.6%) | 810 (50.4%) |
| Total (Overall) | 2,016 (51.3%) | 1,910 (48.6%) |
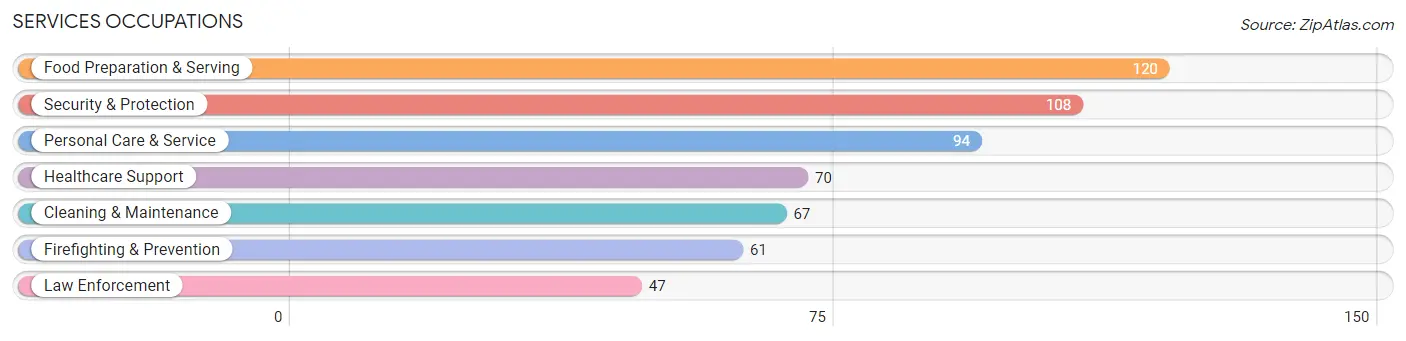
Services Occupations
The most common Services occupations in Fishersville are Food Preparation & Serving (120 | 3.1%), Security & Protection (108 | 2.8%), Personal Care & Service (94 | 2.4%), Healthcare Support (70 | 1.8%), and Cleaning & Maintenance (67 | 1.7%).
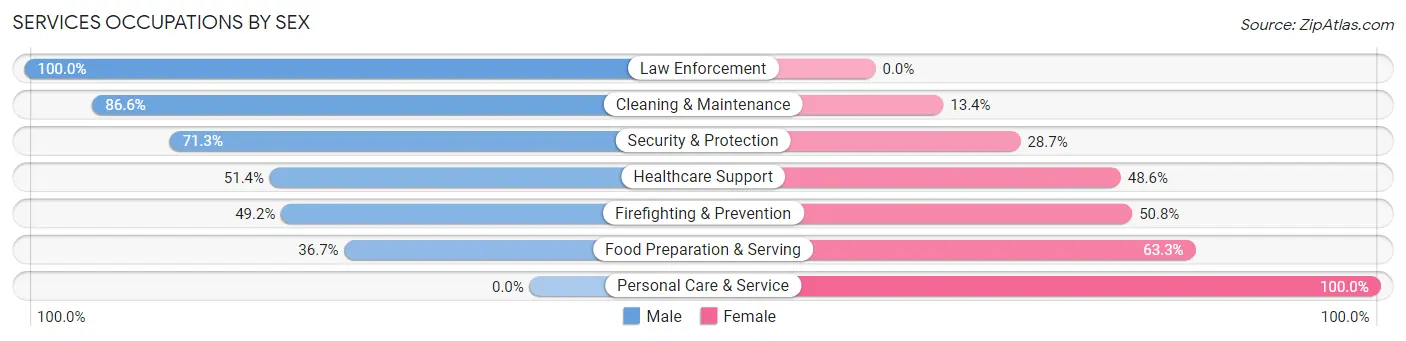
Services Occupations by Sex
Within the Services occupations in Fishersville, the most male-oriented occupations are Law Enforcement (100.0%), Cleaning & Maintenance (86.6%), and Security & Protection (71.3%), while the most female-oriented occupations are Personal Care & Service (100.0%), Food Preparation & Serving (63.3%), and Firefighting & Prevention (50.8%).
| Occupation | Male | Female |
| Healthcare Support | 36 (51.4%) | 34 (48.6%) |
| Security & Protection | 77 (71.3%) | 31 (28.7%) |
| Firefighting & Prevention | 30 (49.2%) | 31 (50.8%) |
| Law Enforcement | 47 (100.0%) | 0 (0.0%) |
| Food Preparation & Serving | 44 (36.7%) | 76 (63.3%) |
| Cleaning & Maintenance | 58 (86.6%) | 9 (13.4%) |
| Personal Care & Service | 0 (0.0%) | 94 (100.0%) |
| Total (Category) | 215 (46.8%) | 244 (53.2%) |
| Total (Overall) | 2,016 (51.3%) | 1,910 (48.6%) |
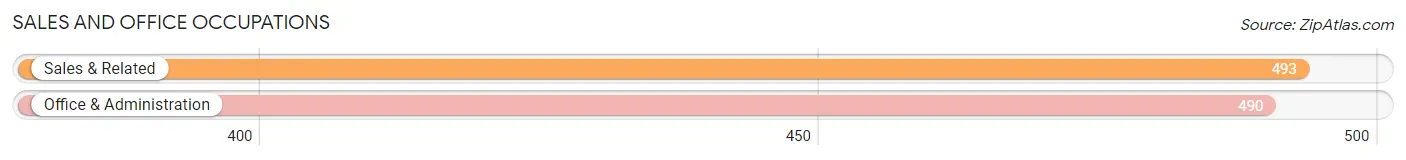
Sales and Office Occupations
The most common Sales and Office occupations in Fishersville are Sales & Related (493 | 12.6%), and Office & Administration (490 | 12.5%).
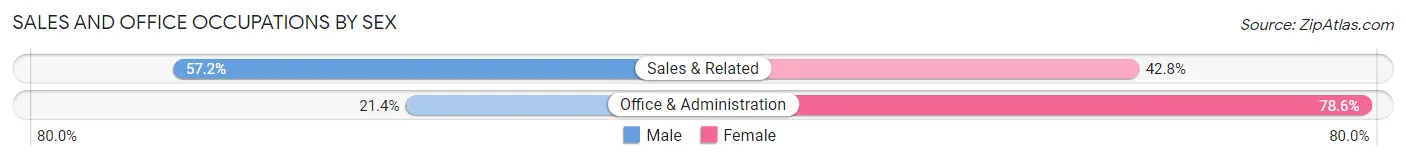
Sales and Office Occupations by Sex
| Occupation | Male | Female |
| Sales & Related | 282 (57.2%) | 211 (42.8%) |
| Office & Administration | 105 (21.4%) | 385 (78.6%) |
| Total (Category) | 387 (39.4%) | 596 (60.6%) |
| Total (Overall) | 2,016 (51.3%) | 1,910 (48.6%) |
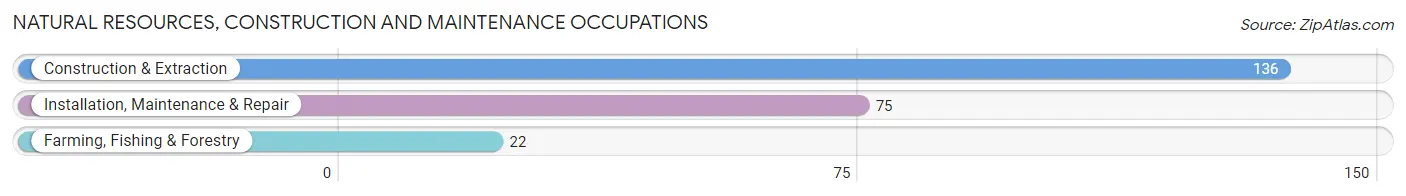
Natural Resources, Construction and Maintenance Occupations
The most common Natural Resources, Construction and Maintenance occupations in Fishersville are Construction & Extraction (136 | 3.5%), Installation, Maintenance & Repair (75 | 1.9%), and Farming, Fishing & Forestry (22 | 0.6%).
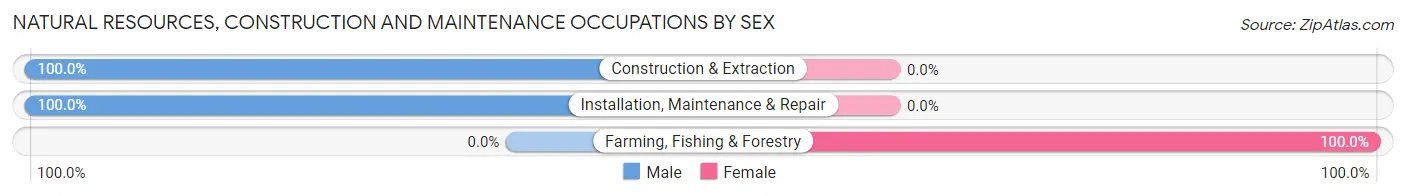
Natural Resources, Construction and Maintenance Occupations by Sex
| Occupation | Male | Female |
| Farming, Fishing & Forestry | 0 (0.0%) | 22 (100.0%) |
| Construction & Extraction | 136 (100.0%) | 0 (0.0%) |
| Installation, Maintenance & Repair | 75 (100.0%) | 0 (0.0%) |
| Total (Category) | 211 (90.6%) | 22 (9.4%) |
| Total (Overall) | 2,016 (51.3%) | 1,910 (48.6%) |
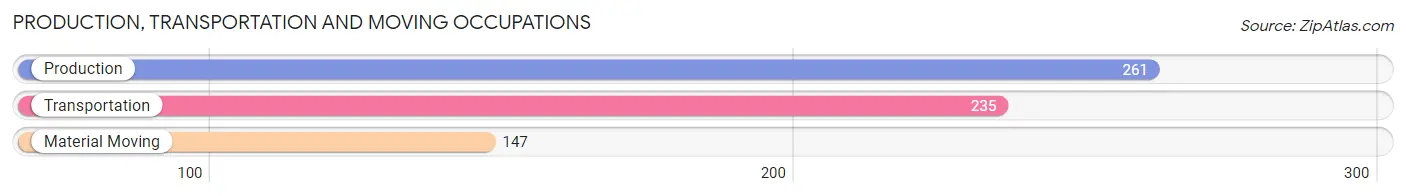
Production, Transportation and Moving Occupations
The most common Production, Transportation and Moving occupations in Fishersville are Production (261 | 6.7%), Transportation (235 | 6.0%), and Material Moving (147 | 3.7%).
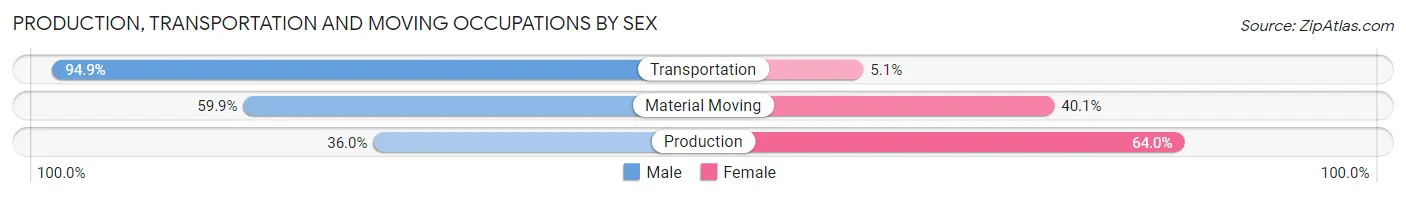
Production, Transportation and Moving Occupations by Sex
| Occupation | Male | Female |
| Production | 94 (36.0%) | 167 (64.0%) |
| Transportation | 223 (94.9%) | 12 (5.1%) |
| Material Moving | 88 (59.9%) | 59 (40.1%) |
| Total (Category) | 405 (63.0%) | 238 (37.0%) |
| Total (Overall) | 2,016 (51.3%) | 1,910 (48.6%) |
Employment Industries by Sex in Fishersville
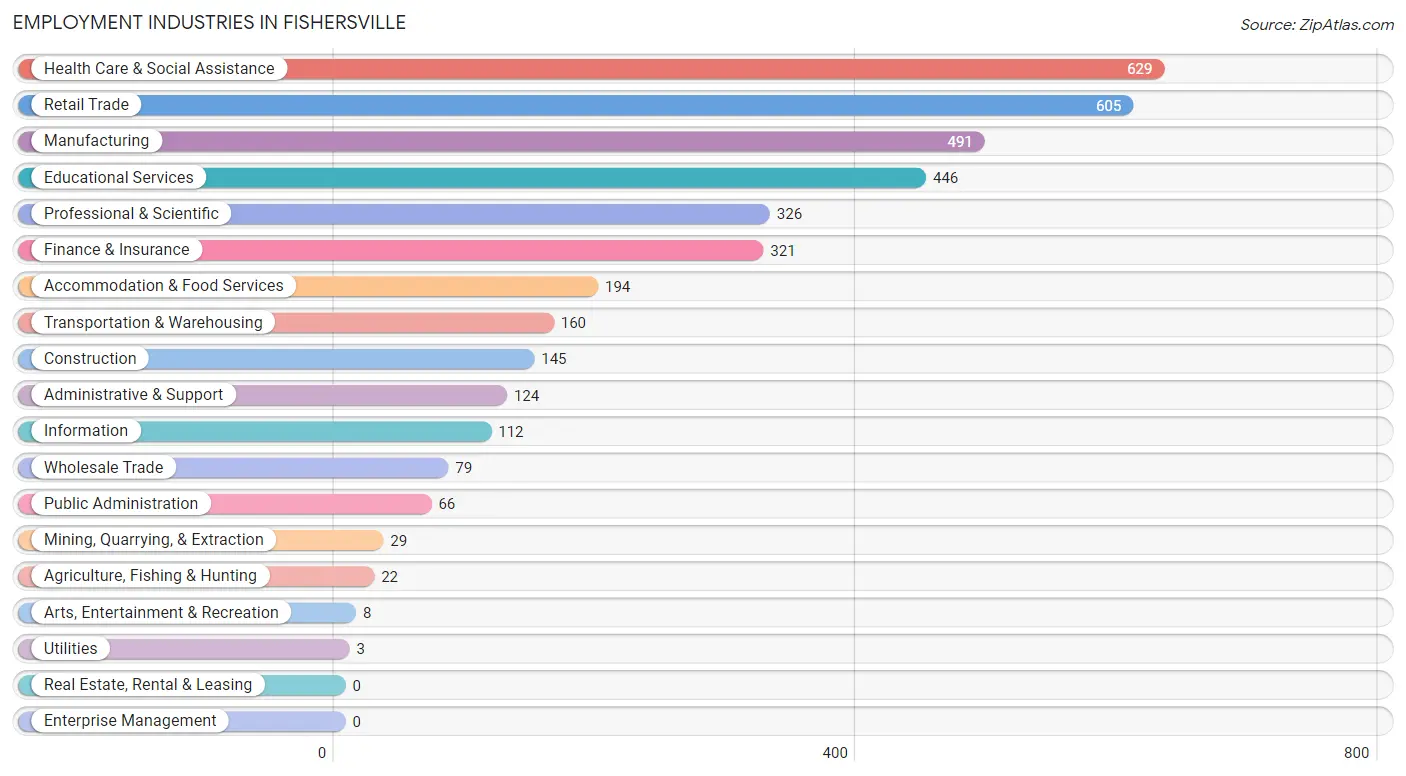
Employment Industries in Fishersville
The major employment industries in Fishersville include Health Care & Social Assistance (629 | 16.0%), Retail Trade (605 | 15.4%), Manufacturing (491 | 12.5%), Educational Services (446 | 11.4%), and Professional & Scientific (326 | 8.3%).
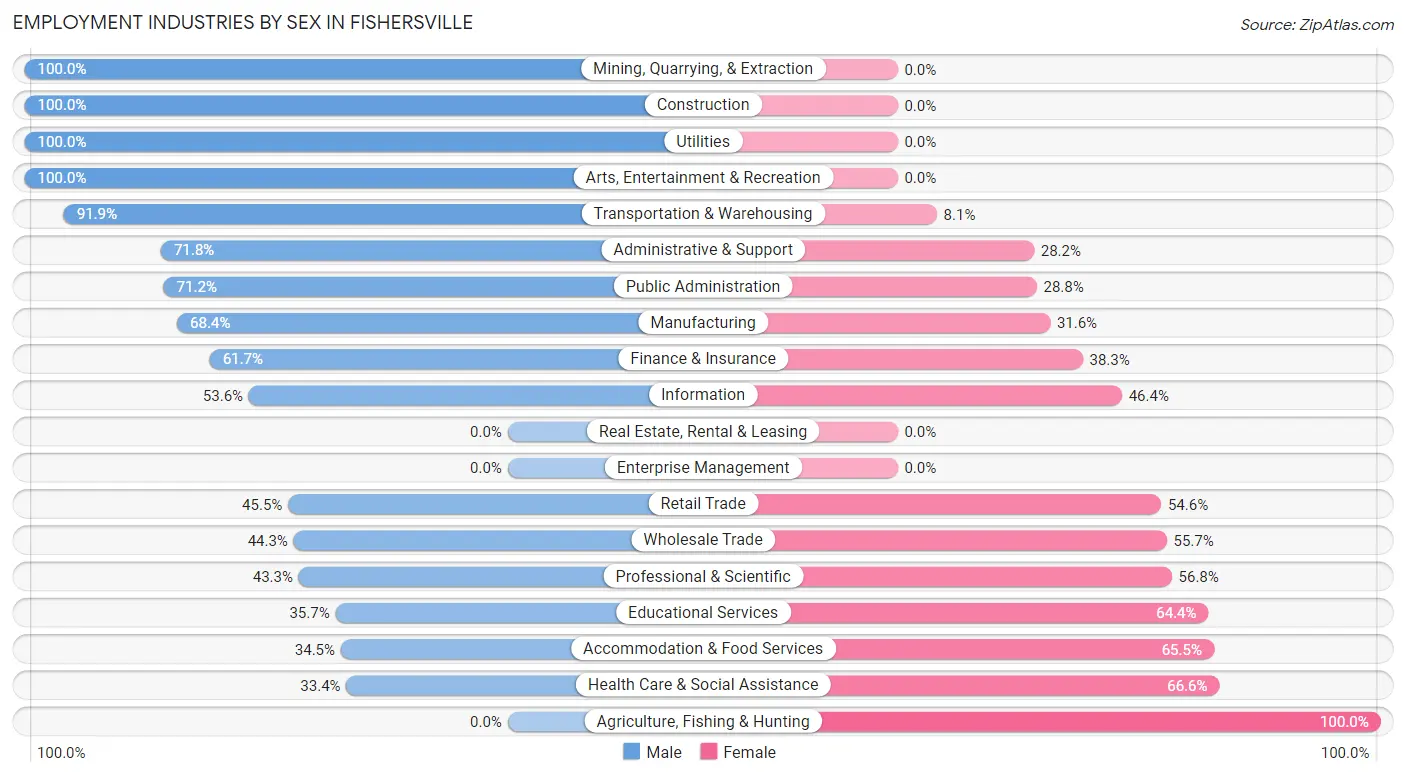
Employment Industries by Sex in Fishersville
The Fishersville industries that see more men than women are Mining, Quarrying, & Extraction (100.0%), Construction (100.0%), and Utilities (100.0%), whereas the industries that tend to have a higher number of women are Agriculture, Fishing & Hunting (100.0%), Health Care & Social Assistance (66.6%), and Accommodation & Food Services (65.5%).
| Industry | Male | Female |
| Agriculture, Fishing & Hunting | 0 (0.0%) | 22 (100.0%) |
| Mining, Quarrying, & Extraction | 29 (100.0%) | 0 (0.0%) |
| Construction | 145 (100.0%) | 0 (0.0%) |
| Manufacturing | 336 (68.4%) | 155 (31.6%) |
| Wholesale Trade | 35 (44.3%) | 44 (55.7%) |
| Retail Trade | 275 (45.5%) | 330 (54.5%) |
| Transportation & Warehousing | 147 (91.9%) | 13 (8.1%) |
| Utilities | 3 (100.0%) | 0 (0.0%) |
| Information | 60 (53.6%) | 52 (46.4%) |
| Finance & Insurance | 198 (61.7%) | 123 (38.3%) |
| Real Estate, Rental & Leasing | 0 (0.0%) | 0 (0.0%) |
| Professional & Scientific | 141 (43.2%) | 185 (56.8%) |
| Enterprise Management | 0 (0.0%) | 0 (0.0%) |
| Administrative & Support | 89 (71.8%) | 35 (28.2%) |
| Educational Services | 159 (35.6%) | 287 (64.3%) |
| Health Care & Social Assistance | 210 (33.4%) | 419 (66.6%) |
| Arts, Entertainment & Recreation | 8 (100.0%) | 0 (0.0%) |
| Accommodation & Food Services | 67 (34.5%) | 127 (65.5%) |
| Public Administration | 47 (71.2%) | 19 (28.8%) |
| Total | 2,016 (51.3%) | 1,910 (48.6%) |
Education in Fishersville
School Enrollment in Fishersville
The most common levels of schooling among the 1,878 students in Fishersville are college / undergraduate (450 | 24.0%), high school (370 | 19.7%), and middle school (351 | 18.7%).
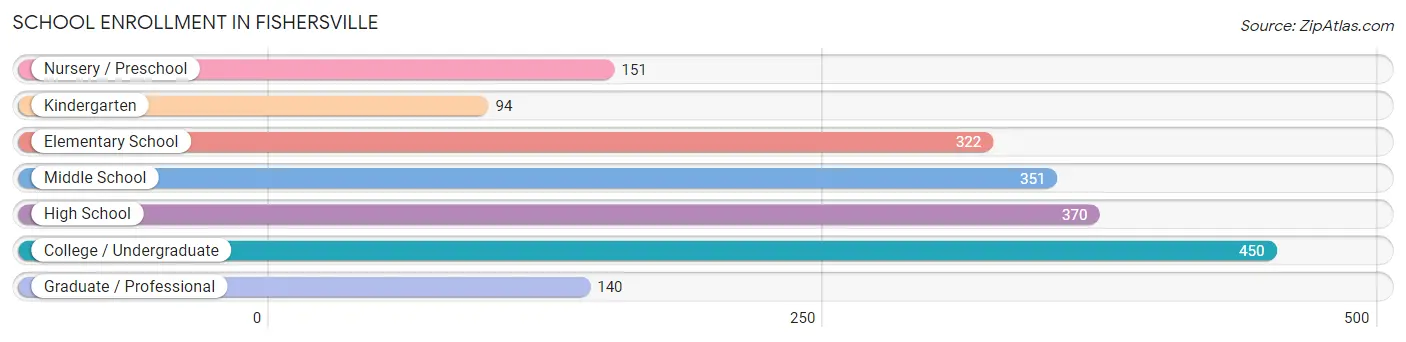
| School Level | # Students | % Students |
| Nursery / Preschool | 151 | 8.0% |
| Kindergarten | 94 | 5.0% |
| Elementary School | 322 | 17.2% |
| Middle School | 351 | 18.7% |
| High School | 370 | 19.7% |
| College / Undergraduate | 450 | 24.0% |
| Graduate / Professional | 140 | 7.4% |
| Total | 1,878 | 100.0% |
School Enrollment by Age by Funding Source in Fishersville
Out of a total of 1,878 students who are enrolled in schools in Fishersville, 411 (21.9%) attend a private institution, while the remaining 1,467 (78.1%) are enrolled in public schools. The age group of 35 years and over has the highest likelihood of being enrolled in private schools, with 48 (57.8% in the age bracket) enrolled. Conversely, the age group of 15 to 17 year olds has the lowest likelihood of being enrolled in a private school, with 280 (100.0% in the age bracket) attending a public institution.
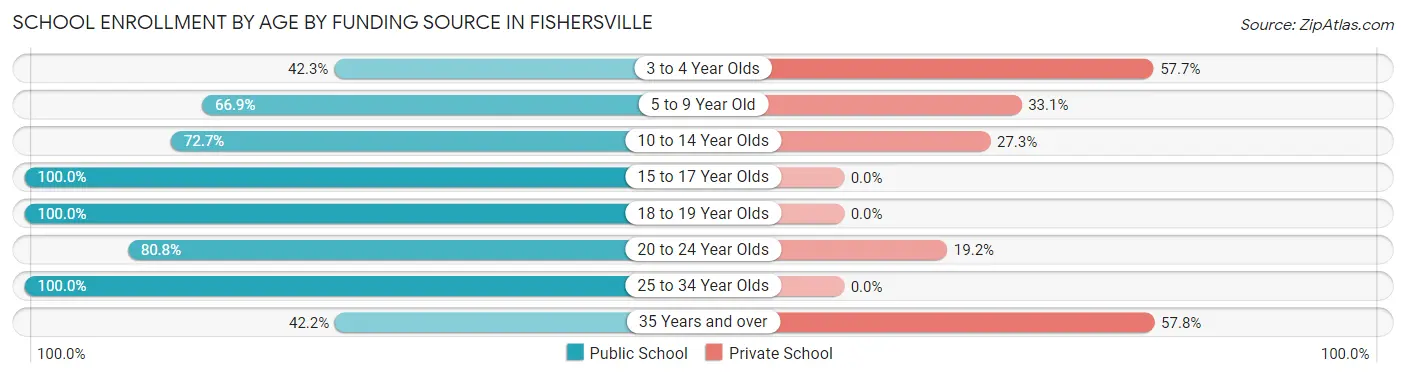
| Age Bracket | Public School | Private School |
| 3 to 4 Year Olds | 47 (42.3%) | 64 (57.7%) |
| 5 to 9 Year Old | 253 (66.9%) | 125 (33.1%) |
| 10 to 14 Year Olds | 320 (72.7%) | 120 (27.3%) |
| 15 to 17 Year Olds | 280 (100.0%) | 0 (0.0%) |
| 18 to 19 Year Olds | 113 (100.0%) | 0 (0.0%) |
| 20 to 24 Year Olds | 231 (80.8%) | 55 (19.2%) |
| 25 to 34 Year Olds | 187 (100.0%) | 0 (0.0%) |
| 35 Years and over | 35 (42.2%) | 48 (57.8%) |
| Total | 1,467 (78.1%) | 411 (21.9%) |
Educational Attainment by Field of Study in Fishersville
Business (529 | 23.3%), education (292 | 12.8%), liberal arts & history (242 | 10.6%), engineering (241 | 10.6%), and bio, nature & agricultural (190 | 8.4%) are the most common fields of study among 2,275 individuals in Fishersville who have obtained a bachelor's degree or higher.
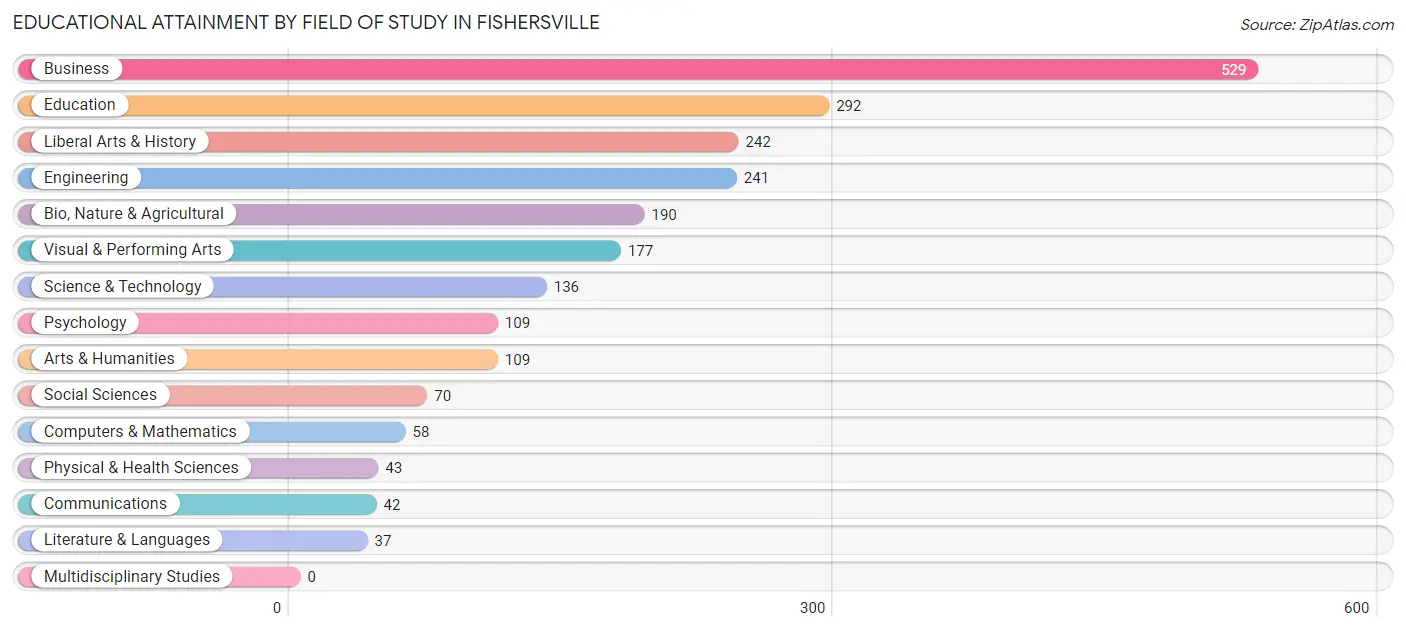
| Field of Study | # Graduates | % Graduates |
| Computers & Mathematics | 58 | 2.5% |
| Bio, Nature & Agricultural | 190 | 8.4% |
| Physical & Health Sciences | 43 | 1.9% |
| Psychology | 109 | 4.8% |
| Social Sciences | 70 | 3.1% |
| Engineering | 241 | 10.6% |
| Multidisciplinary Studies | 0 | 0.0% |
| Science & Technology | 136 | 6.0% |
| Business | 529 | 23.3% |
| Education | 292 | 12.8% |
| Literature & Languages | 37 | 1.6% |
| Liberal Arts & History | 242 | 10.6% |
| Visual & Performing Arts | 177 | 7.8% |
| Communications | 42 | 1.8% |
| Arts & Humanities | 109 | 4.8% |
| Total | 2,275 | 100.0% |
Transportation & Commute in Fishersville
Vehicle Availability by Sex in Fishersville
The most prevalent vehicle ownership categories in Fishersville are males with 2 vehicles (812, accounting for 41.0%) and females with 2 vehicles (910, making up 42.7%).
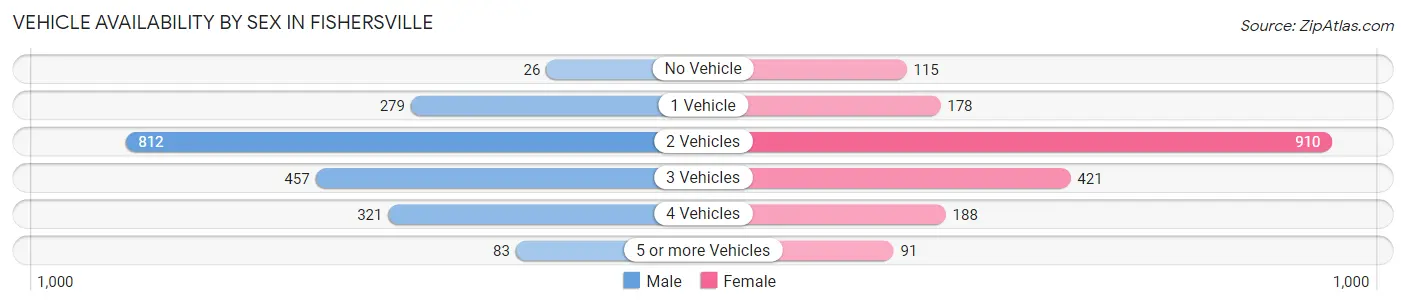
| Vehicles Available | Male | Female |
| No Vehicle | 26 (1.3%) | 115 (6.0%) |
| 1 Vehicle | 279 (14.1%) | 178 (9.3%) |
| 2 Vehicles | 812 (41.0%) | 910 (47.8%) |
| 3 Vehicles | 457 (23.1%) | 421 (22.1%) |
| 4 Vehicles | 321 (16.2%) | 188 (9.9%) |
| 5 or more Vehicles | 83 (4.2%) | 91 (4.8%) |
| Total | 1,978 (100.0%) | 1,903 (100.0%) |
Commute Time in Fishersville
The most frequently occuring commute durations in Fishersville are 10 to 14 minutes (765 commuters, 21.1%), 20 to 24 minutes (551 commuters, 15.2%), and 5 to 9 minutes (495 commuters, 13.7%).
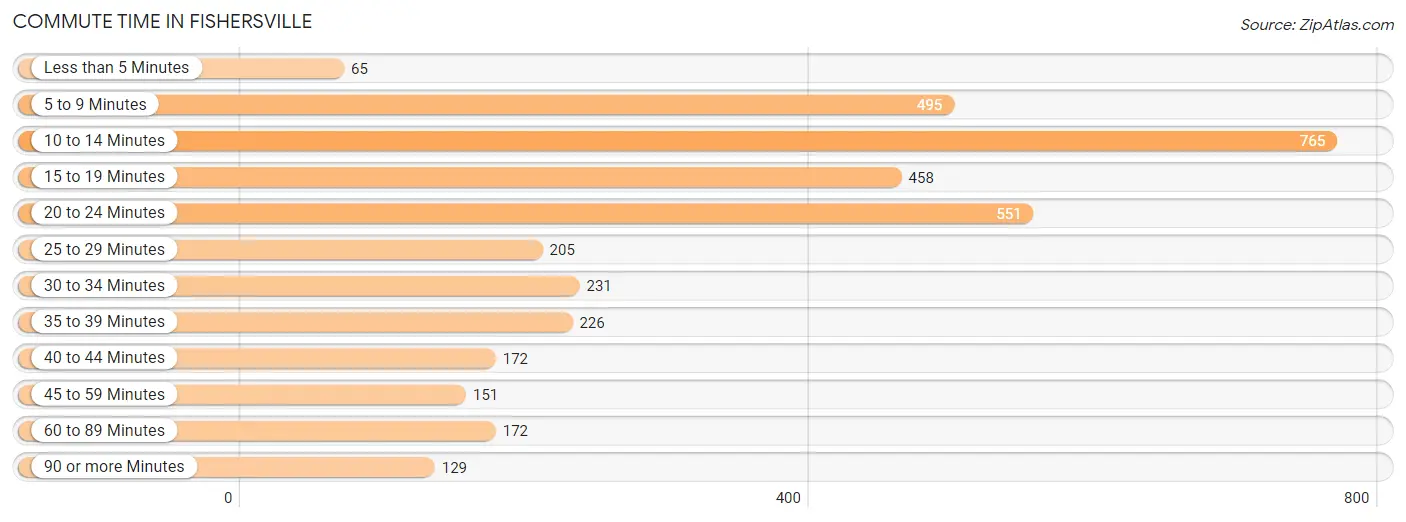
| Commute Time | # Commuters | % Commuters |
| Less than 5 Minutes | 65 | 1.8% |
| 5 to 9 Minutes | 495 | 13.7% |
| 10 to 14 Minutes | 765 | 21.1% |
| 15 to 19 Minutes | 458 | 12.7% |
| 20 to 24 Minutes | 551 | 15.2% |
| 25 to 29 Minutes | 205 | 5.7% |
| 30 to 34 Minutes | 231 | 6.4% |
| 35 to 39 Minutes | 226 | 6.2% |
| 40 to 44 Minutes | 172 | 4.8% |
| 45 to 59 Minutes | 151 | 4.2% |
| 60 to 89 Minutes | 172 | 4.8% |
| 90 or more Minutes | 129 | 3.6% |
Commute Time by Sex in Fishersville
The most common commute times in Fishersville are 10 to 14 minutes (461 commuters, 24.8%) for males and 5 to 9 minutes (395 commuters, 22.4%) for females.
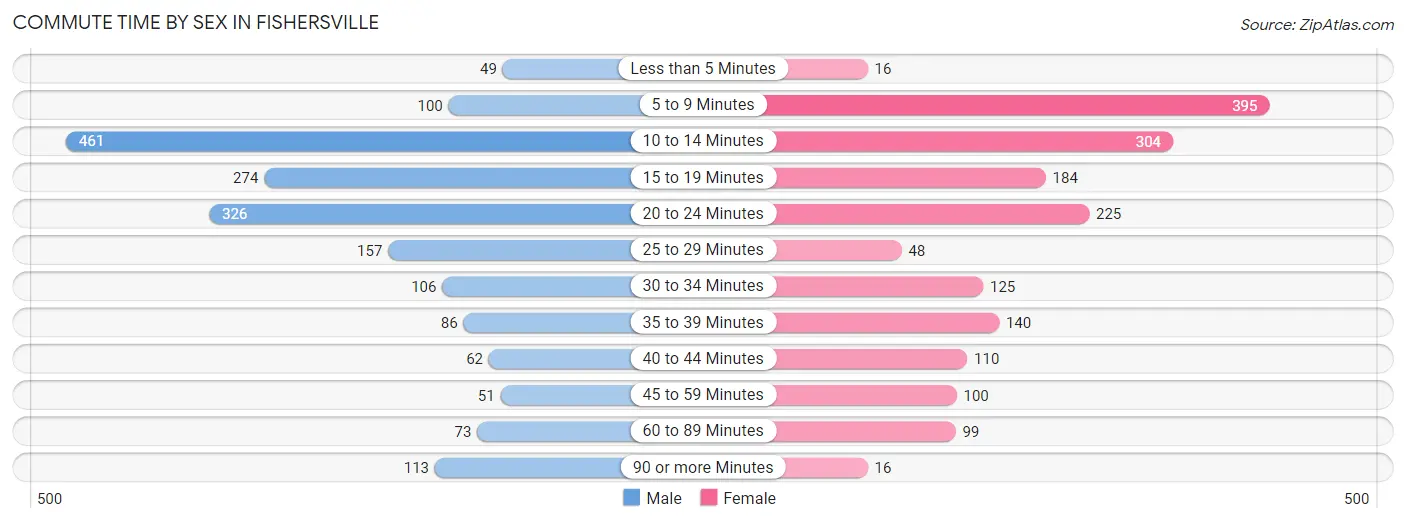
| Commute Time | Male | Female |
| Less than 5 Minutes | 49 (2.6%) | 16 (0.9%) |
| 5 to 9 Minutes | 100 (5.4%) | 395 (22.4%) |
| 10 to 14 Minutes | 461 (24.8%) | 304 (17.2%) |
| 15 to 19 Minutes | 274 (14.7%) | 184 (10.4%) |
| 20 to 24 Minutes | 326 (17.5%) | 225 (12.8%) |
| 25 to 29 Minutes | 157 (8.5%) | 48 (2.7%) |
| 30 to 34 Minutes | 106 (5.7%) | 125 (7.1%) |
| 35 to 39 Minutes | 86 (4.6%) | 140 (8.0%) |
| 40 to 44 Minutes | 62 (3.3%) | 110 (6.2%) |
| 45 to 59 Minutes | 51 (2.7%) | 100 (5.7%) |
| 60 to 89 Minutes | 73 (3.9%) | 99 (5.6%) |
| 90 or more Minutes | 113 (6.1%) | 16 (0.9%) |
Time of Departure to Work by Sex in Fishersville
The most frequent times of departure to work in Fishersville are 7:30 AM to 7:59 AM (351, 18.9%) for males and 7:00 AM to 7:29 AM (502, 28.5%) for females.
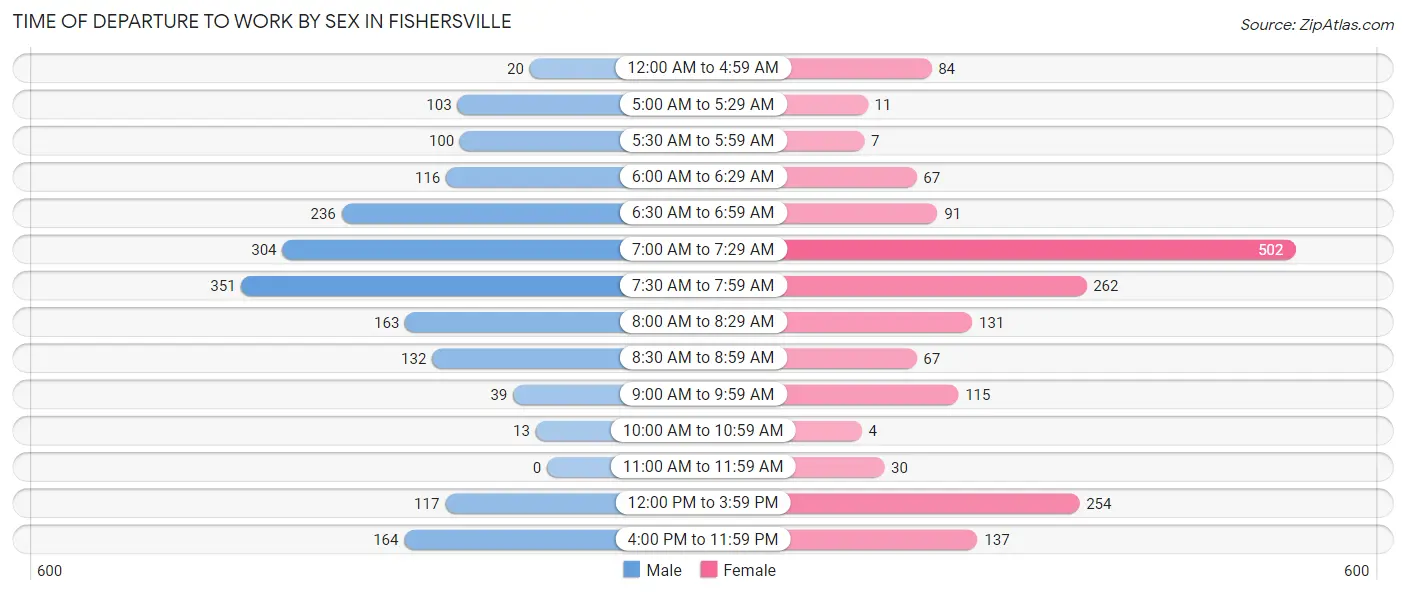
| Time of Departure | Male | Female |
| 12:00 AM to 4:59 AM | 20 (1.1%) | 84 (4.8%) |
| 5:00 AM to 5:29 AM | 103 (5.5%) | 11 (0.6%) |
| 5:30 AM to 5:59 AM | 100 (5.4%) | 7 (0.4%) |
| 6:00 AM to 6:29 AM | 116 (6.2%) | 67 (3.8%) |
| 6:30 AM to 6:59 AM | 236 (12.7%) | 91 (5.2%) |
| 7:00 AM to 7:29 AM | 304 (16.4%) | 502 (28.5%) |
| 7:30 AM to 7:59 AM | 351 (18.9%) | 262 (14.9%) |
| 8:00 AM to 8:29 AM | 163 (8.8%) | 131 (7.4%) |
| 8:30 AM to 8:59 AM | 132 (7.1%) | 67 (3.8%) |
| 9:00 AM to 9:59 AM | 39 (2.1%) | 115 (6.5%) |
| 10:00 AM to 10:59 AM | 13 (0.7%) | 4 (0.2%) |
| 11:00 AM to 11:59 AM | 0 (0.0%) | 30 (1.7%) |
| 12:00 PM to 3:59 PM | 117 (6.3%) | 254 (14.4%) |
| 4:00 PM to 11:59 PM | 164 (8.8%) | 137 (7.8%) |
| Total | 1,858 (100.0%) | 1,762 (100.0%) |
Housing Occupancy in Fishersville
Occupancy by Ownership in Fishersville
Of the total 3,831 dwellings in Fishersville, owner-occupied units account for 2,458 (64.2%), while renter-occupied units make up 1,373 (35.8%).
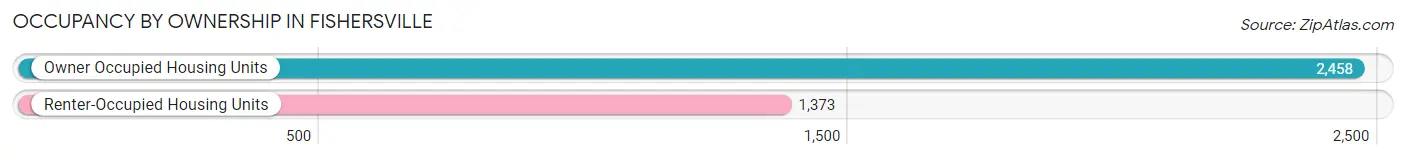
| Occupancy | # Housing Units | % Housing Units |
| Owner Occupied Housing Units | 2,458 | 64.2% |
| Renter-Occupied Housing Units | 1,373 | 35.8% |
| Total Occupied Housing Units | 3,831 | 100.0% |
Occupancy by Household Size in Fishersville
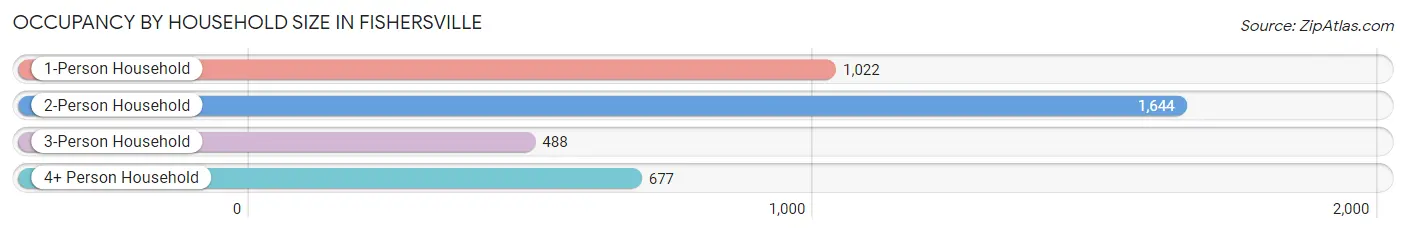
| Household Size | # Housing Units | % Housing Units |
| 1-Person Household | 1,022 | 26.7% |
| 2-Person Household | 1,644 | 42.9% |
| 3-Person Household | 488 | 12.7% |
| 4+ Person Household | 677 | 17.7% |
| Total Housing Units | 3,831 | 100.0% |
Occupancy by Ownership by Household Size in Fishersville
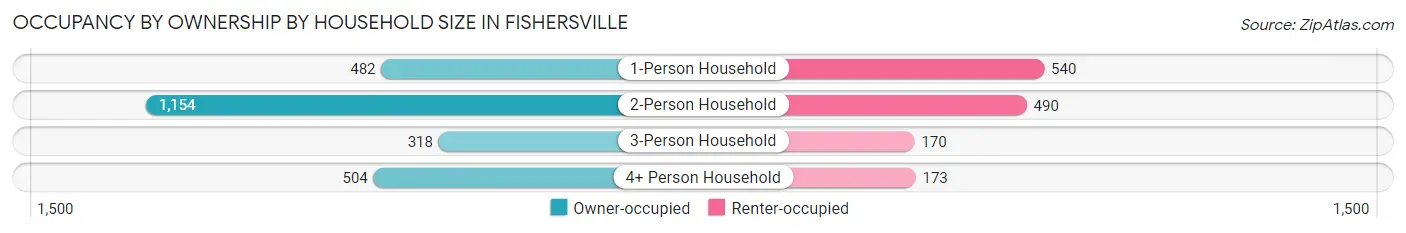
| Household Size | Owner-occupied | Renter-occupied |
| 1-Person Household | 482 (47.2%) | 540 (52.8%) |
| 2-Person Household | 1,154 (70.2%) | 490 (29.8%) |
| 3-Person Household | 318 (65.2%) | 170 (34.8%) |
| 4+ Person Household | 504 (74.5%) | 173 (25.6%) |
| Total Housing Units | 2,458 (64.2%) | 1,373 (35.8%) |
Occupancy by Educational Attainment in Fishersville
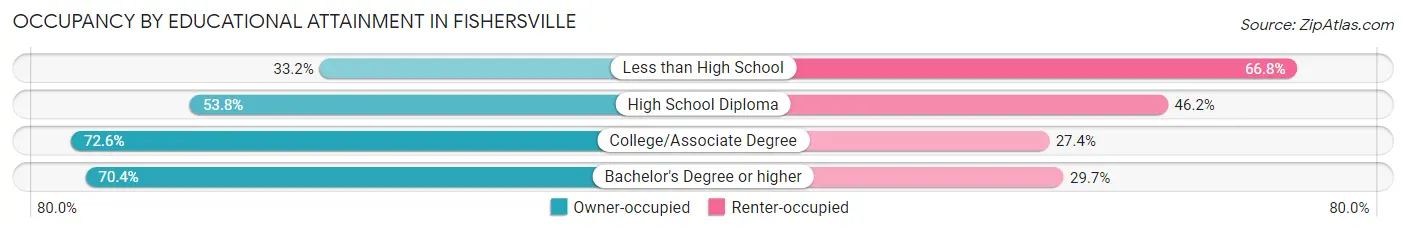
| Household Size | Owner-occupied | Renter-occupied |
| Less than High School | 95 (33.2%) | 191 (66.8%) |
| High School Diploma | 521 (53.8%) | 448 (46.2%) |
| College/Associate Degree | 950 (72.6%) | 358 (27.4%) |
| Bachelor's Degree or higher | 892 (70.4%) | 376 (29.6%) |
Occupancy by Age of Householder in Fishersville
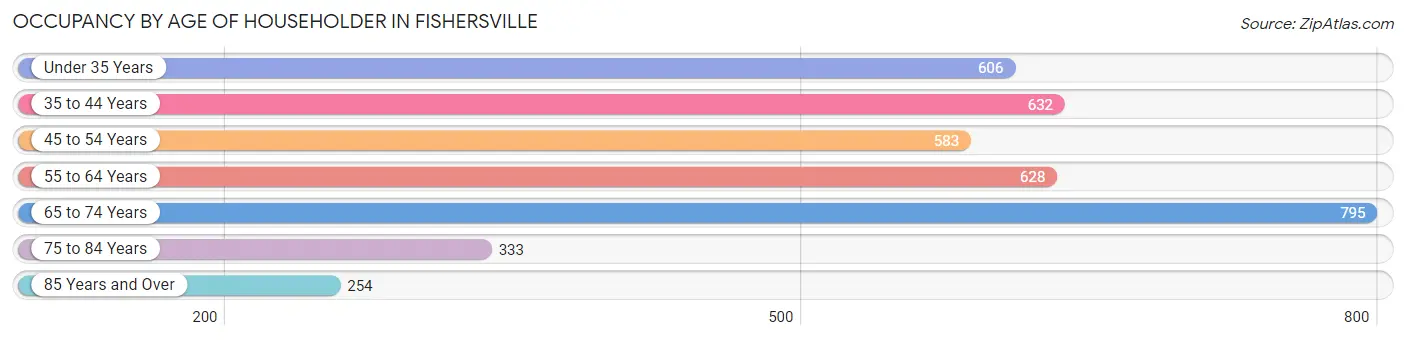
| Age Bracket | # Households | % Households |
| Under 35 Years | 606 | 15.8% |
| 35 to 44 Years | 632 | 16.5% |
| 45 to 54 Years | 583 | 15.2% |
| 55 to 64 Years | 628 | 16.4% |
| 65 to 74 Years | 795 | 20.7% |
| 75 to 84 Years | 333 | 8.7% |
| 85 Years and Over | 254 | 6.6% |
| Total | 3,831 | 100.0% |
Housing Finances in Fishersville
Median Income by Occupancy in Fishersville
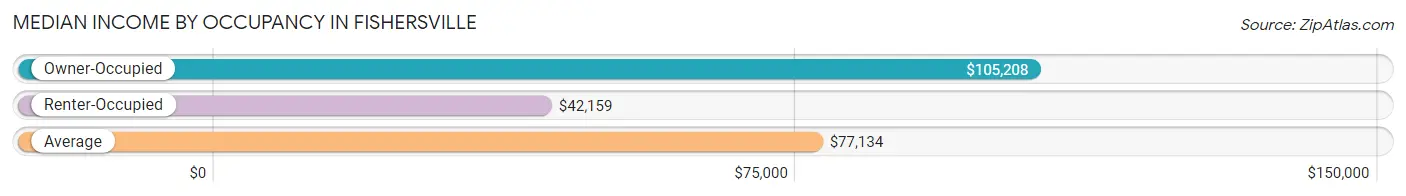
| Occupancy Type | # Households | Median Income |
| Owner-Occupied | 2,458 (64.2%) | $105,208 |
| Renter-Occupied | 1,373 (35.8%) | $42,159 |
| Average | 3,831 (100.0%) | $77,134 |
Occupancy by Householder Income Bracket in Fishersville
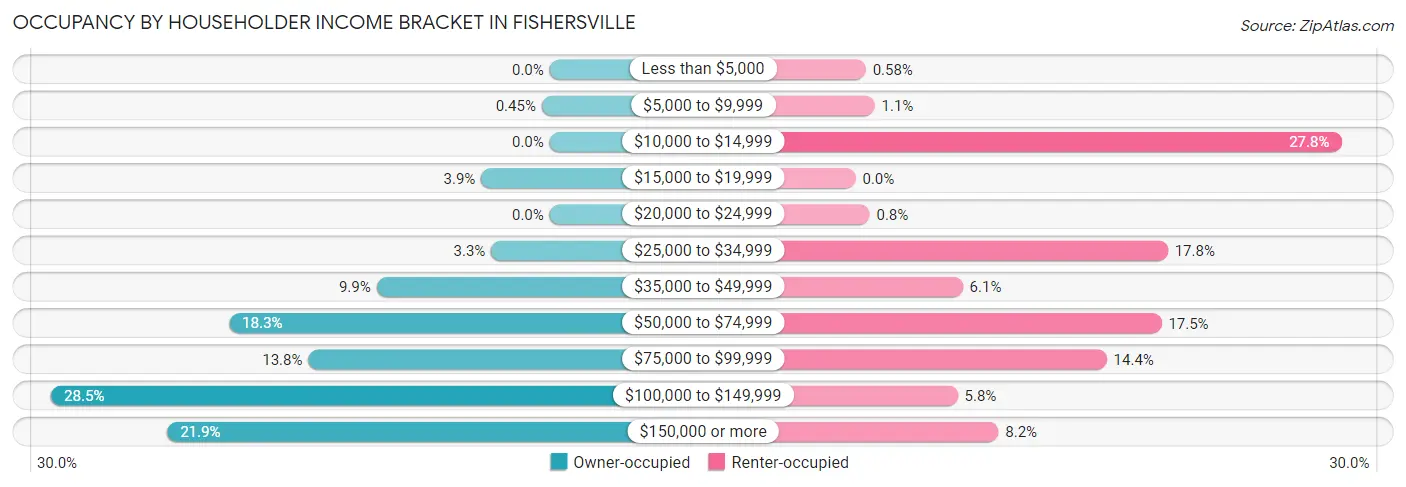
| Income Bracket | Owner-occupied | Renter-occupied |
| Less than $5,000 | 0 (0.0%) | 8 (0.6%) |
| $5,000 to $9,999 | 11 (0.4%) | 15 (1.1%) |
| $10,000 to $14,999 | 0 (0.0%) | 381 (27.8%) |
| $15,000 to $19,999 | 96 (3.9%) | 0 (0.0%) |
| $20,000 to $24,999 | 0 (0.0%) | 11 (0.8%) |
| $25,000 to $34,999 | 82 (3.3%) | 245 (17.8%) |
| $35,000 to $49,999 | 243 (9.9%) | 84 (6.1%) |
| $50,000 to $74,999 | 450 (18.3%) | 240 (17.5%) |
| $75,000 to $99,999 | 339 (13.8%) | 197 (14.3%) |
| $100,000 to $149,999 | 700 (28.5%) | 80 (5.8%) |
| $150,000 or more | 537 (21.8%) | 112 (8.2%) |
| Total | 2,458 (100.0%) | 1,373 (100.0%) |
Monthly Housing Cost Tiers in Fishersville
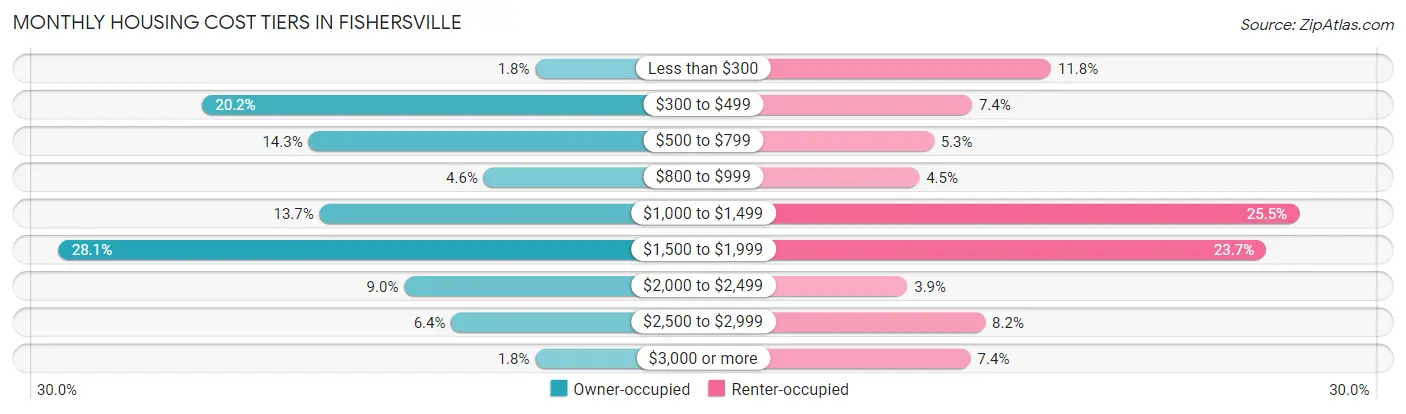
| Monthly Cost | Owner-occupied | Renter-occupied |
| Less than $300 | 44 (1.8%) | 162 (11.8%) |
| $300 to $499 | 496 (20.2%) | 102 (7.4%) |
| $500 to $799 | 352 (14.3%) | 73 (5.3%) |
| $800 to $999 | 114 (4.6%) | 62 (4.5%) |
| $1,000 to $1,499 | 337 (13.7%) | 350 (25.5%) |
| $1,500 to $1,999 | 691 (28.1%) | 325 (23.7%) |
| $2,000 to $2,499 | 222 (9.0%) | 53 (3.9%) |
| $2,500 to $2,999 | 158 (6.4%) | 112 (8.2%) |
| $3,000 or more | 44 (1.8%) | 101 (7.4%) |
| Total | 2,458 (100.0%) | 1,373 (100.0%) |
Physical Housing Characteristics in Fishersville
Housing Structures in Fishersville
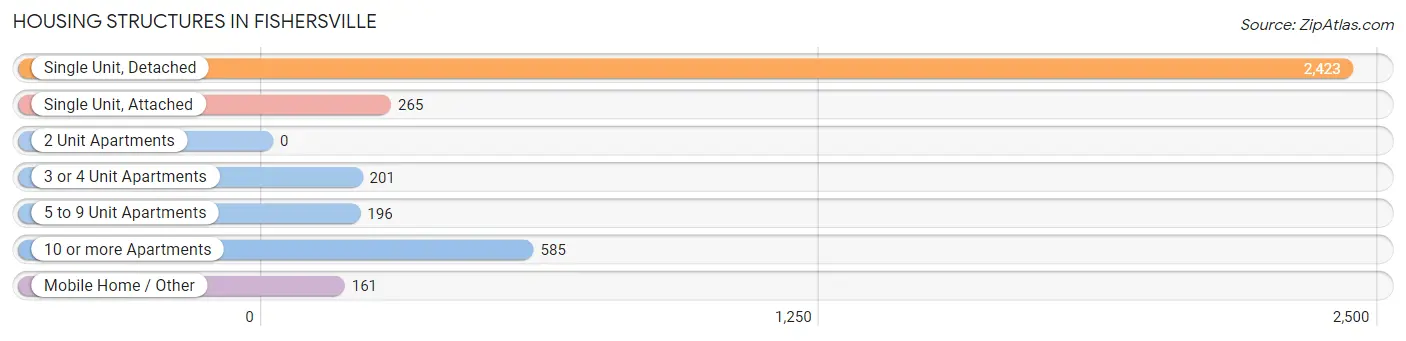
| Structure Type | # Housing Units | % Housing Units |
| Single Unit, Detached | 2,423 | 63.2% |
| Single Unit, Attached | 265 | 6.9% |
| 2 Unit Apartments | 0 | 0.0% |
| 3 or 4 Unit Apartments | 201 | 5.2% |
| 5 to 9 Unit Apartments | 196 | 5.1% |
| 10 or more Apartments | 585 | 15.3% |
| Mobile Home / Other | 161 | 4.2% |
| Total | 3,831 | 100.0% |
Housing Structures by Occupancy in Fishersville
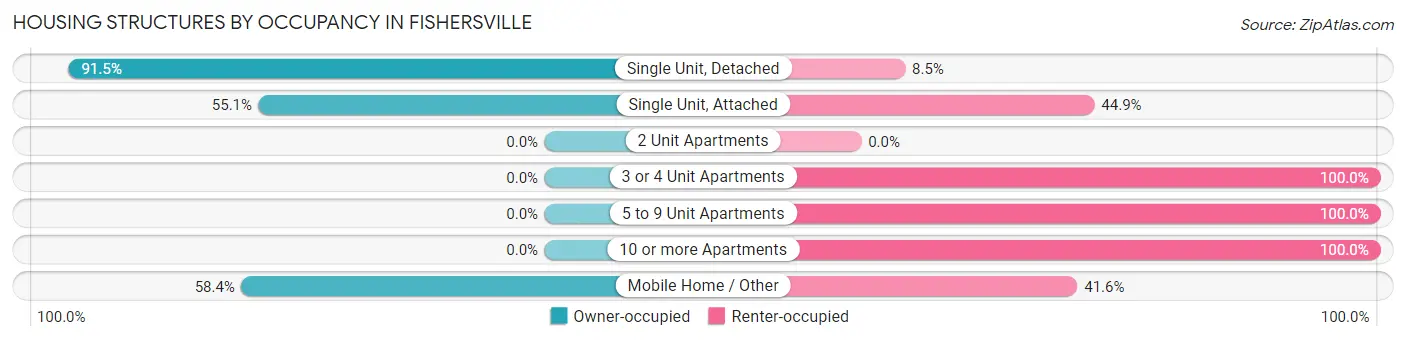
| Structure Type | Owner-occupied | Renter-occupied |
| Single Unit, Detached | 2,218 (91.5%) | 205 (8.5%) |
| Single Unit, Attached | 146 (55.1%) | 119 (44.9%) |
| 2 Unit Apartments | 0 (0.0%) | 0 (0.0%) |
| 3 or 4 Unit Apartments | 0 (0.0%) | 201 (100.0%) |
| 5 to 9 Unit Apartments | 0 (0.0%) | 196 (100.0%) |
| 10 or more Apartments | 0 (0.0%) | 585 (100.0%) |
| Mobile Home / Other | 94 (58.4%) | 67 (41.6%) |
| Total | 2,458 (64.2%) | 1,373 (35.8%) |
Housing Structures by Number of Rooms in Fishersville
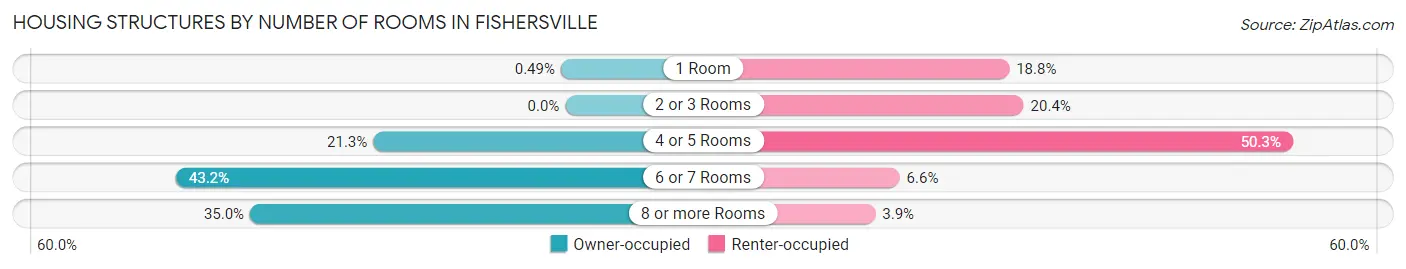
| Number of Rooms | Owner-occupied | Renter-occupied |
| 1 Room | 12 (0.5%) | 258 (18.8%) |
| 2 or 3 Rooms | 0 (0.0%) | 280 (20.4%) |
| 4 or 5 Rooms | 524 (21.3%) | 690 (50.2%) |
| 6 or 7 Rooms | 1,062 (43.2%) | 91 (6.6%) |
| 8 or more Rooms | 860 (35.0%) | 54 (3.9%) |
| Total | 2,458 (100.0%) | 1,373 (100.0%) |
Housing Structure by Heating Type in Fishersville
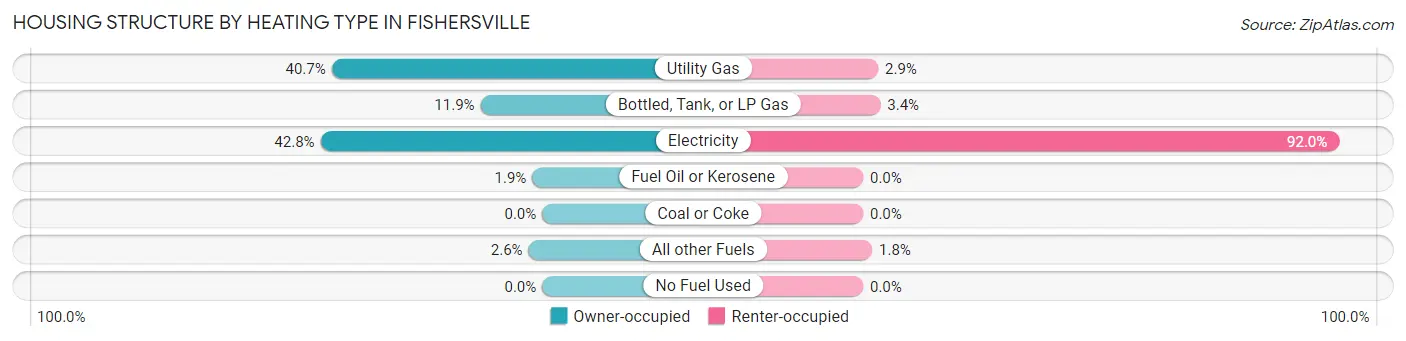
| Heating Type | Owner-occupied | Renter-occupied |
| Utility Gas | 1,000 (40.7%) | 40 (2.9%) |
| Bottled, Tank, or LP Gas | 293 (11.9%) | 46 (3.4%) |
| Electricity | 1,053 (42.8%) | 1,263 (92.0%) |
| Fuel Oil or Kerosene | 47 (1.9%) | 0 (0.0%) |
| Coal or Coke | 0 (0.0%) | 0 (0.0%) |
| All other Fuels | 65 (2.6%) | 24 (1.8%) |
| No Fuel Used | 0 (0.0%) | 0 (0.0%) |
| Total | 2,458 (100.0%) | 1,373 (100.0%) |
Household Vehicle Usage in Fishersville
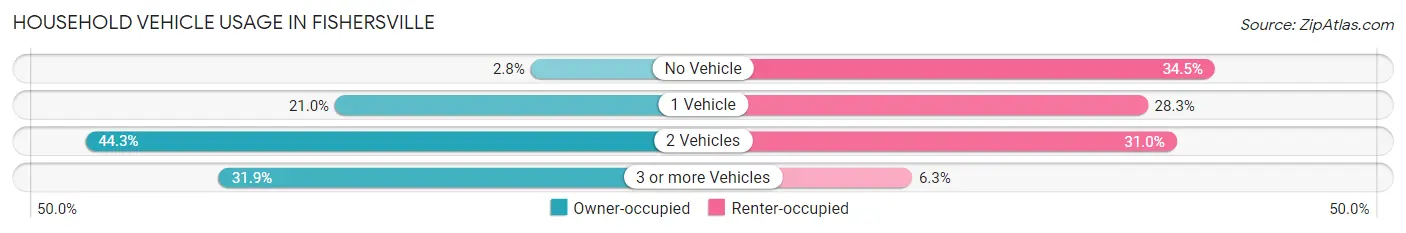
| Vehicles per Household | Owner-occupied | Renter-occupied |
| No Vehicle | 68 (2.8%) | 474 (34.5%) |
| 1 Vehicle | 517 (21.0%) | 388 (28.3%) |
| 2 Vehicles | 1,090 (44.3%) | 425 (30.9%) |
| 3 or more Vehicles | 783 (31.9%) | 86 (6.3%) |
| Total | 2,458 (100.0%) | 1,373 (100.0%) |
Real Estate & Mortgages in Fishersville
Real Estate and Mortgage Overview in Fishersville
| Characteristic | Without Mortgage | With Mortgage |
| Housing Units | 830 | 1,628 |
| Median Property Value | $280,000 | $311,400 |
| Median Household Income | $82,404 | $371 |
| Monthly Housing Costs | $460 | $44 |
| Real Estate Taxes | $1,550 | $139 |
Property Value by Mortgage Status in Fishersville
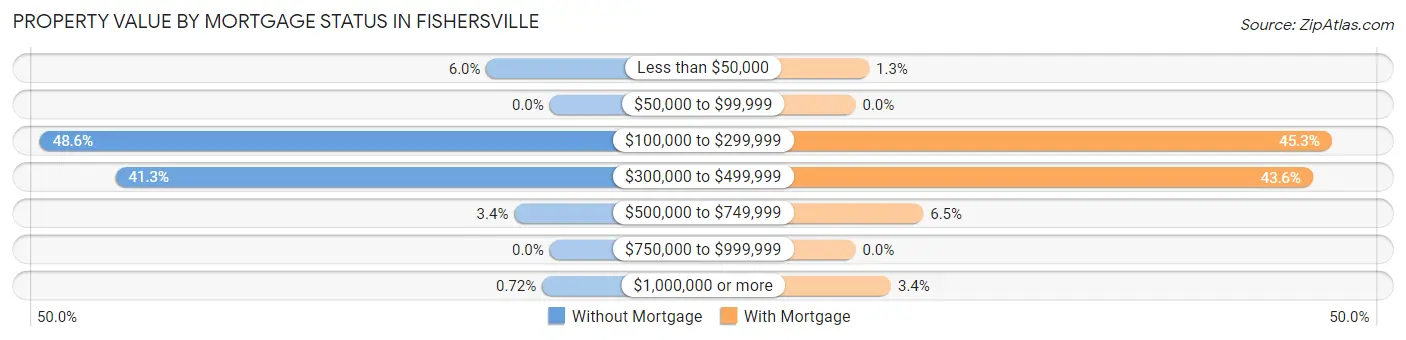
| Property Value | Without Mortgage | With Mortgage |
| Less than $50,000 | 50 (6.0%) | 21 (1.3%) |
| $50,000 to $99,999 | 0 (0.0%) | 0 (0.0%) |
| $100,000 to $299,999 | 403 (48.5%) | 738 (45.3%) |
| $300,000 to $499,999 | 343 (41.3%) | 709 (43.5%) |
| $500,000 to $749,999 | 28 (3.4%) | 105 (6.5%) |
| $750,000 to $999,999 | 0 (0.0%) | 0 (0.0%) |
| $1,000,000 or more | 6 (0.7%) | 55 (3.4%) |
| Total | 830 (100.0%) | 1,628 (100.0%) |
Household Income by Mortgage Status in Fishersville
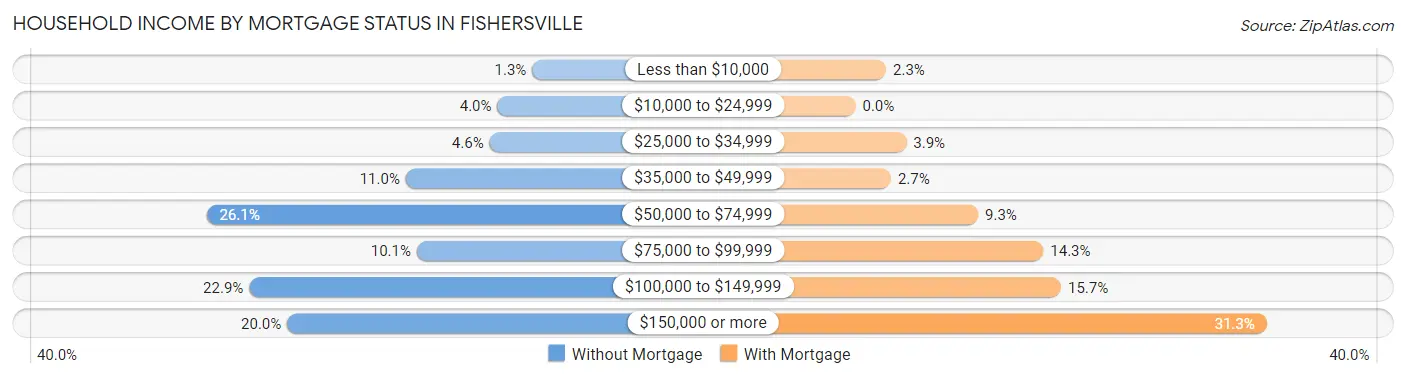
| Household Income | Without Mortgage | With Mortgage |
| Less than $10,000 | 11 (1.3%) | 38 (2.3%) |
| $10,000 to $24,999 | 33 (4.0%) | 0 (0.0%) |
| $25,000 to $34,999 | 38 (4.6%) | 63 (3.9%) |
| $35,000 to $49,999 | 91 (11.0%) | 44 (2.7%) |
| $50,000 to $74,999 | 217 (26.1%) | 152 (9.3%) |
| $75,000 to $99,999 | 84 (10.1%) | 233 (14.3%) |
| $100,000 to $149,999 | 190 (22.9%) | 255 (15.7%) |
| $150,000 or more | 166 (20.0%) | 510 (31.3%) |
| Total | 830 (100.0%) | 1,628 (100.0%) |
Property Value to Household Income Ratio in Fishersville
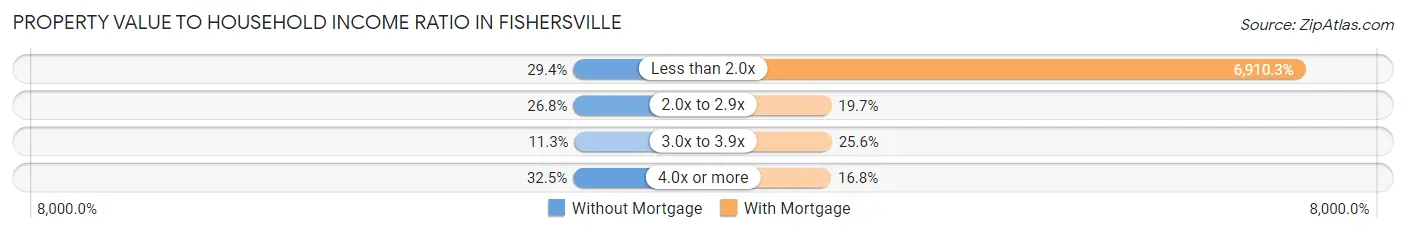
| Value-to-Income Ratio | Without Mortgage | With Mortgage |
| Less than 2.0x | 244 (29.4%) | 112,500 (6,910.3%) |
| 2.0x to 2.9x | 222 (26.8%) | 320 (19.7%) |
| 3.0x to 3.9x | 94 (11.3%) | 416 (25.6%) |
| 4.0x or more | 270 (32.5%) | 273 (16.8%) |
| Total | 830 (100.0%) | 1,628 (100.0%) |
Real Estate Taxes by Mortgage Status in Fishersville
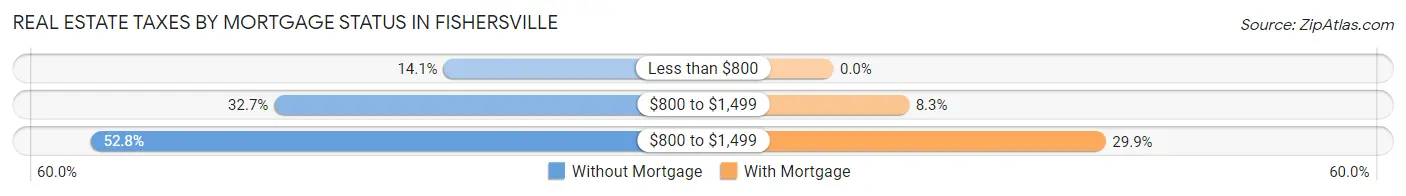
| Property Taxes | Without Mortgage | With Mortgage |
| Less than $800 | 117 (14.1%) | 0 (0.0%) |
| $800 to $1,499 | 271 (32.7%) | 135 (8.3%) |
| $800 to $1,499 | 438 (52.8%) | 486 (29.8%) |
| Total | 830 (100.0%) | 1,628 (100.0%) |
Health & Disability in Fishersville
Health Insurance Coverage by Age in Fishersville
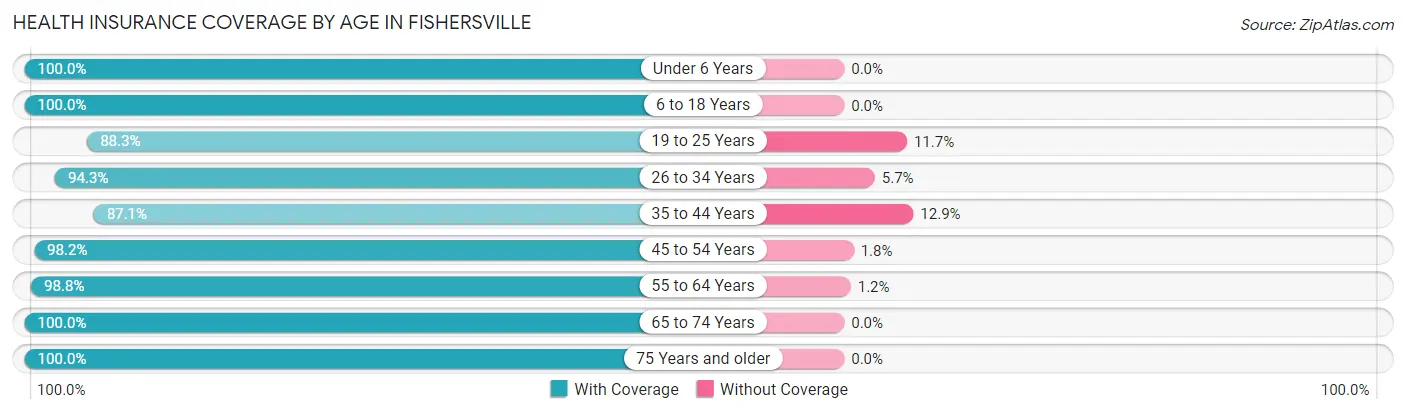
| Age Bracket | With Coverage | Without Coverage |
| Under 6 Years | 637 (100.0%) | 0 (0.0%) |
| 6 to 18 Years | 1,214 (100.0%) | 0 (0.0%) |
| 19 to 25 Years | 491 (88.3%) | 65 (11.7%) |
| 26 to 34 Years | 928 (94.3%) | 56 (5.7%) |
| 35 to 44 Years | 1,149 (87.1%) | 170 (12.9%) |
| 45 to 54 Years | 1,006 (98.2%) | 18 (1.8%) |
| 55 to 64 Years | 1,058 (98.8%) | 13 (1.2%) |
| 65 to 74 Years | 1,258 (100.0%) | 0 (0.0%) |
| 75 Years and older | 860 (100.0%) | 0 (0.0%) |
| Total | 8,601 (96.4%) | 322 (3.6%) |
Health Insurance Coverage by Citizenship Status in Fishersville
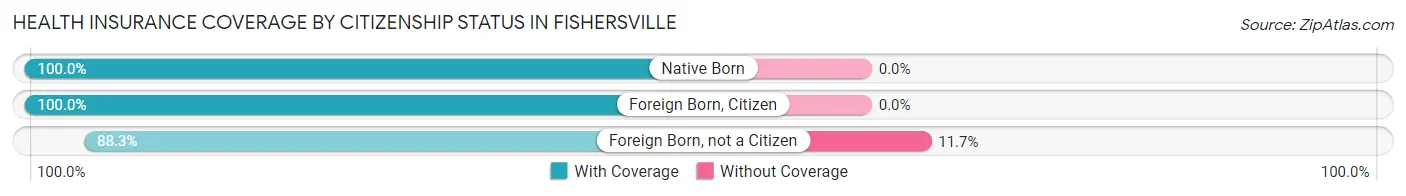
| Citizenship Status | With Coverage | Without Coverage |
| Native Born | 637 (100.0%) | 0 (0.0%) |
| Foreign Born, Citizen | 1,214 (100.0%) | 0 (0.0%) |
| Foreign Born, not a Citizen | 491 (88.3%) | 65 (11.7%) |
Health Insurance Coverage by Household Income in Fishersville
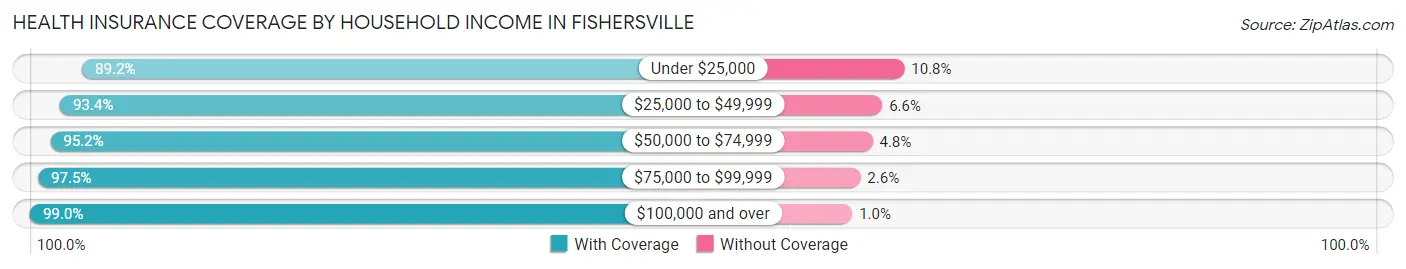
| Household Income | With Coverage | Without Coverage |
| Under $25,000 | 670 (89.2%) | 81 (10.8%) |
| $25,000 to $49,999 | 1,251 (93.4%) | 89 (6.6%) |
| $50,000 to $74,999 | 1,599 (95.2%) | 81 (4.8%) |
| $75,000 to $99,999 | 1,186 (97.5%) | 31 (2.5%) |
| $100,000 and over | 3,882 (99.0%) | 40 (1.0%) |
Public vs Private Health Insurance Coverage by Age in Fishersville
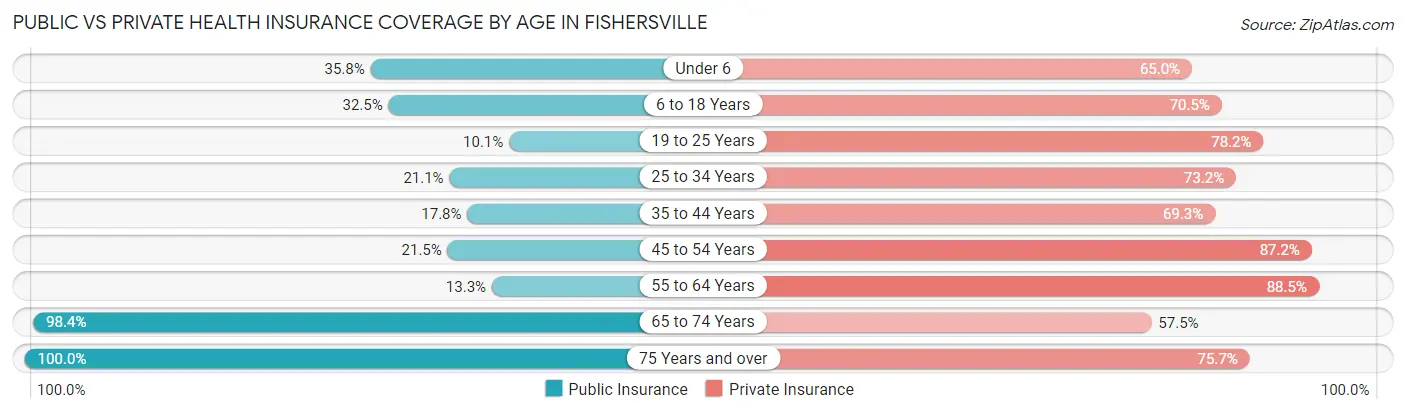
| Age Bracket | Public Insurance | Private Insurance |
| Under 6 | 228 (35.8%) | 414 (65.0%) |
| 6 to 18 Years | 394 (32.5%) | 856 (70.5%) |
| 19 to 25 Years | 56 (10.1%) | 435 (78.2%) |
| 25 to 34 Years | 208 (21.1%) | 720 (73.2%) |
| 35 to 44 Years | 235 (17.8%) | 914 (69.3%) |
| 45 to 54 Years | 220 (21.5%) | 893 (87.2%) |
| 55 to 64 Years | 142 (13.3%) | 948 (88.5%) |
| 65 to 74 Years | 1,238 (98.4%) | 723 (57.5%) |
| 75 Years and over | 860 (100.0%) | 651 (75.7%) |
| Total | 3,581 (40.1%) | 6,554 (73.5%) |
Disability Status by Sex by Age in Fishersville
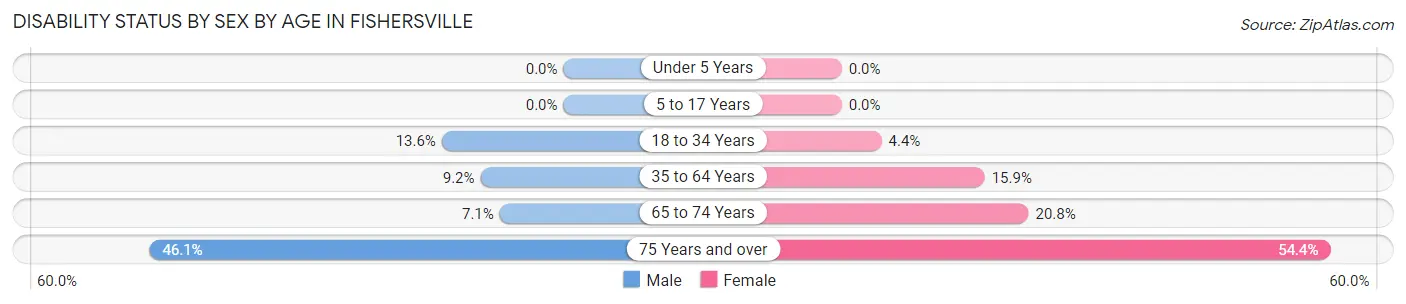
| Age Bracket | Male | Female |
| Under 5 Years | 0 (0.0%) | 0 (0.0%) |
| 5 to 17 Years | 0 (0.0%) | 0 (0.0%) |
| 18 to 34 Years | 81 (13.6%) | 49 (4.4%) |
| 35 to 64 Years | 164 (9.2%) | 261 (15.9%) |
| 65 to 74 Years | 34 (7.1%) | 162 (20.8%) |
| 75 Years and over | 171 (46.1%) | 266 (54.4%) |
Disability Class by Sex by Age in Fishersville
Disability Class: Hearing Difficulty
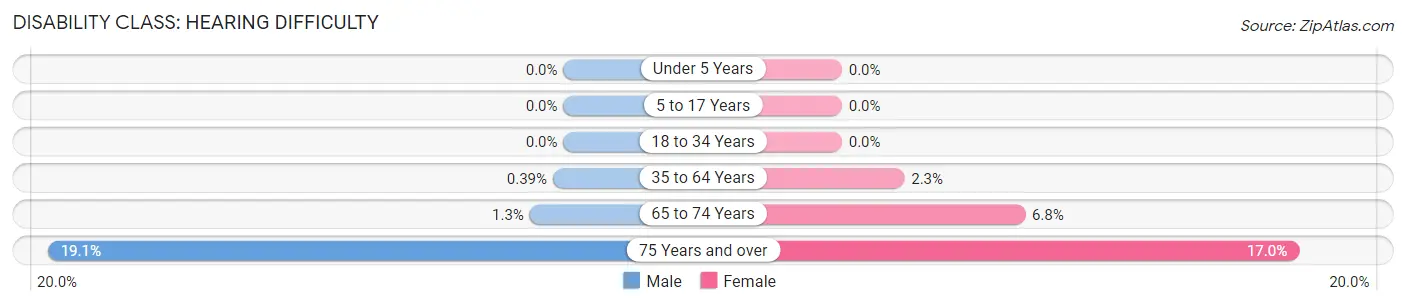
| Age Bracket | Male | Female |
| Under 5 Years | 0 (0.0%) | 0 (0.0%) |
| 5 to 17 Years | 0 (0.0%) | 0 (0.0%) |
| 18 to 34 Years | 0 (0.0%) | 0 (0.0%) |
| 35 to 64 Years | 7 (0.4%) | 38 (2.3%) |
| 65 to 74 Years | 6 (1.3%) | 53 (6.8%) |
| 75 Years and over | 71 (19.1%) | 83 (17.0%) |
Disability Class: Vision Difficulty
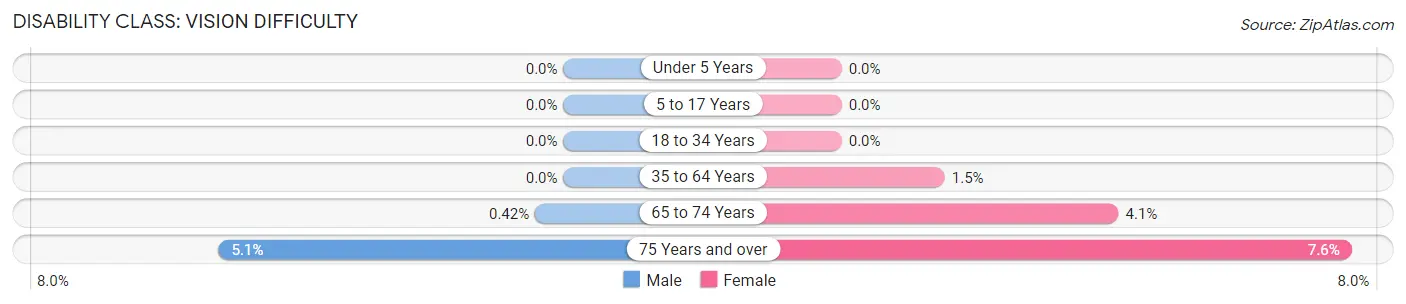
| Age Bracket | Male | Female |
| Under 5 Years | 0 (0.0%) | 0 (0.0%) |
| 5 to 17 Years | 0 (0.0%) | 0 (0.0%) |
| 18 to 34 Years | 0 (0.0%) | 0 (0.0%) |
| 35 to 64 Years | 0 (0.0%) | 25 (1.5%) |
| 65 to 74 Years | 2 (0.4%) | 32 (4.1%) |
| 75 Years and over | 19 (5.1%) | 37 (7.6%) |
Disability Class: Cognitive Difficulty
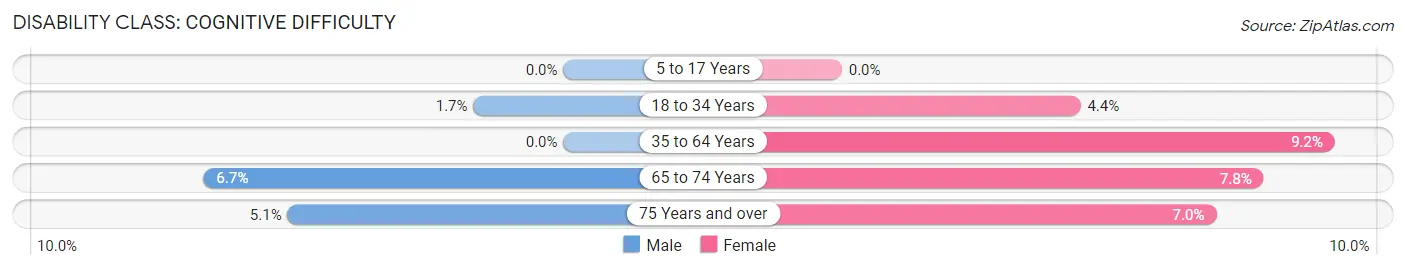
| Age Bracket | Male | Female |
| 5 to 17 Years | 0 (0.0%) | 0 (0.0%) |
| 18 to 34 Years | 10 (1.7%) | 49 (4.4%) |
| 35 to 64 Years | 0 (0.0%) | 150 (9.1%) |
| 65 to 74 Years | 32 (6.7%) | 61 (7.8%) |
| 75 Years and over | 19 (5.1%) | 34 (7.0%) |
Disability Class: Ambulatory Difficulty
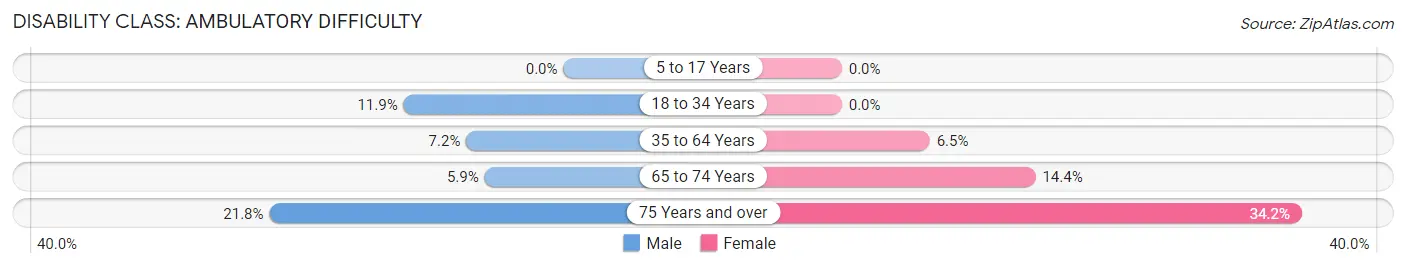
| Age Bracket | Male | Female |
| 5 to 17 Years | 0 (0.0%) | 0 (0.0%) |
| 18 to 34 Years | 71 (11.9%) | 0 (0.0%) |
| 35 to 64 Years | 128 (7.2%) | 107 (6.5%) |
| 65 to 74 Years | 28 (5.9%) | 112 (14.4%) |
| 75 Years and over | 81 (21.8%) | 167 (34.2%) |
Disability Class: Self-Care Difficulty
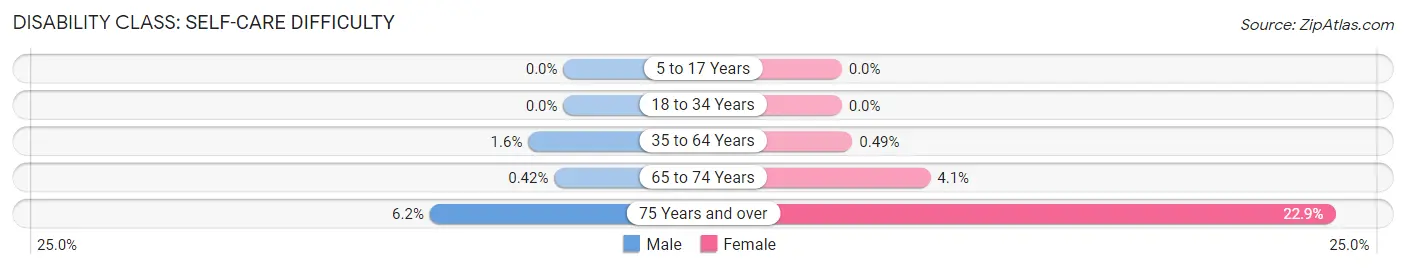
| Age Bracket | Male | Female |
| 5 to 17 Years | 0 (0.0%) | 0 (0.0%) |
| 18 to 34 Years | 0 (0.0%) | 0 (0.0%) |
| 35 to 64 Years | 29 (1.6%) | 8 (0.5%) |
| 65 to 74 Years | 2 (0.4%) | 32 (4.1%) |
| 75 Years and over | 23 (6.2%) | 112 (22.9%) |
Technology Access in Fishersville
Computing Device Access in Fishersville
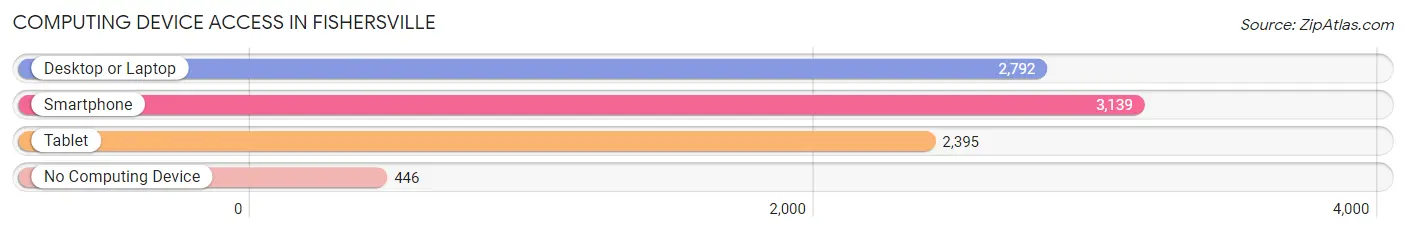
| Device Type | # Households | % Households |
| Desktop or Laptop | 2,792 | 72.9% |
| Smartphone | 3,139 | 81.9% |
| Tablet | 2,395 | 62.5% |
| No Computing Device | 446 | 11.6% |
| Total | 3,831 | 100.0% |
Internet Access in Fishersville
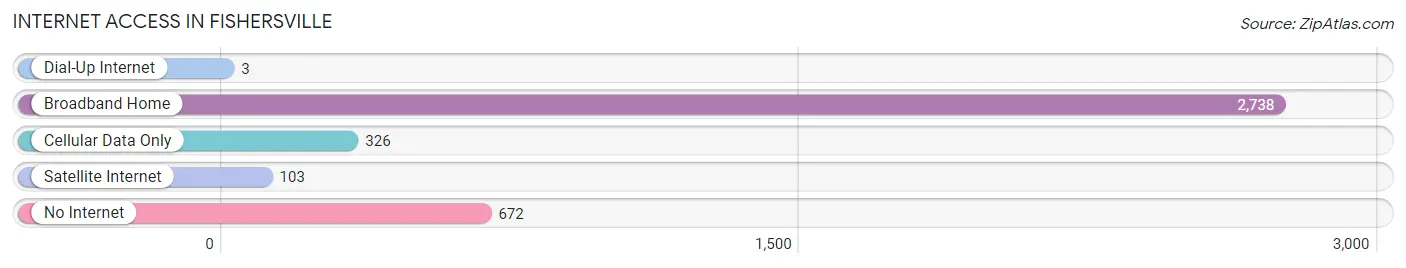
| Internet Type | # Households | % Households |
| Dial-Up Internet | 3 | 0.1% |
| Broadband Home | 2,738 | 71.5% |
| Cellular Data Only | 326 | 8.5% |
| Satellite Internet | 103 | 2.7% |
| No Internet | 672 | 17.5% |
| Total | 3,831 | 100.0% |
Fishersville Summary
Fishersville is an unincorporated community located in Augusta County, Virginia. It is situated in the Shenandoah Valley, approximately 10 miles north of Staunton and 15 miles south of Harrisonburg. The population of Fishersville was estimated to be 5,890 in 2019.
History
Fishersville was first settled in the late 1700s by German immigrants. The town was named after the Fisher family, who were among the first settlers. The town was officially established in 1817 and was incorporated in 1819.
The town was an important stop on the Valley Turnpike, which connected Staunton to Harrisonburg. The turnpike was a major transportation route for goods and people in the area.
Fishersville was also an important stop on the Virginia Central Railroad, which connected Richmond to the Shenandoah Valley. The railroad was completed in 1854 and was a major factor in the growth of the town.
The town was also home to a number of important industries, including a flour mill, a sawmill, a tannery, and a brickyard. These industries helped to fuel the growth of the town.
Geography
Fishersville is located in the Shenandoah Valley, approximately 10 miles north of Staunton and 15 miles south of Harrisonburg. The town is situated in the foothills of the Blue Ridge Mountains and is surrounded by rolling hills and farmland.
The town is located along the South River, which is a tributary of the Shenandoah River. The South River is a popular spot for fishing, canoeing, and kayaking.
Economy
Fishersville is home to a number of businesses, including restaurants, retail stores, and professional services. The town is also home to a number of manufacturing companies, including a furniture manufacturer, a plastics manufacturer, and a printing company.
The town is also home to a number of agricultural businesses, including a dairy farm, a beef farm, and a poultry farm.
Demographics
As of the 2010 census, the population of Fishersville was 5,890. The racial makeup of the town was 94.3% White, 2.3% African American, 0.4% Native American, 0.7% Asian, 0.1% Pacific Islander, 0.7% from other races, and 1.5% from two or more races. Hispanic or Latino of any race were 2.2% of the population.
The median household income in Fishersville was $45,938, and the median family income was $54,938. The per capita income was $22,938. About 8.3% of families and 10.3% of the population were below the poverty line, including 14.3% of those under age 18 and 8.3% of those age 65 or over.
Conclusion
Fishersville is a small town located in the Shenandoah Valley of Virginia. It has a rich history and is home to a number of businesses and industries. The town has a diverse population and a median household income that is slightly above the national average. Fishersville is a great place to live and work, and it is a great place to visit.
Common Questions
What is Per Capita Income in Fishersville?
Per Capita income in Fishersville is $40,156.
What is the Median Family Income in Fishersville?
Median Family Income in Fishersville is $103,083.
What is the Median Household income in Fishersville?
Median Household Income in Fishersville is $77,134.
What is Income or Wage Gap in Fishersville?
Income or Wage Gap in Fishersville is 43.1%.
Women in Fishersville earn 56.9 cents for every dollar earned by a man.
What is Family Income Deficit in Fishersville?
Family Income Deficit in Fishersville is $9,456.
Families that are below poverty line in Fishersville earn $9,456 less on average than the poverty threshold level.
What is Inequality or Gini Index in Fishersville?
Inequality or Gini Index in Fishersville is 0.42.
What is the Total Population of Fishersville?
Total Population of Fishersville is 9,422.
What is the Total Male Population of Fishersville?
Total Male Population of Fishersville is 4,349.
What is the Total Female Population of Fishersville?
Total Female Population of Fishersville is 5,073.
What is the Ratio of Males per 100 Females in Fishersville?
There are 85.73 Males per 100 Females in Fishersville.
What is the Ratio of Females per 100 Males in Fishersville?
There are 116.65 Females per 100 Males in Fishersville.
What is the Median Population Age in Fishersville?
Median Population Age in Fishersville is 42.4 Years.
What is the Average Family Size in Fishersville
Average Family Size in Fishersville is 2.8 People.
What is the Average Household Size in Fishersville
Average Household Size in Fishersville is 2.3 People.
How Large is the Labor Force in Fishersville?
There are 4,221 People in the Labor Forcein in Fishersville.
What is the Percentage of People in the Labor Force in Fishersville?
53.4% of People are in the Labor Force in Fishersville.
What is the Unemployment Rate in Fishersville?
Unemployment Rate in Fishersville is 6.1%.