Zip Codes with the Highest Percentage of Population Employed in Security & Protection in Weatherford, TX
RELATED REPORTS & OPTIONS
Security & Protection
Weatherford
Compare Zip Codes
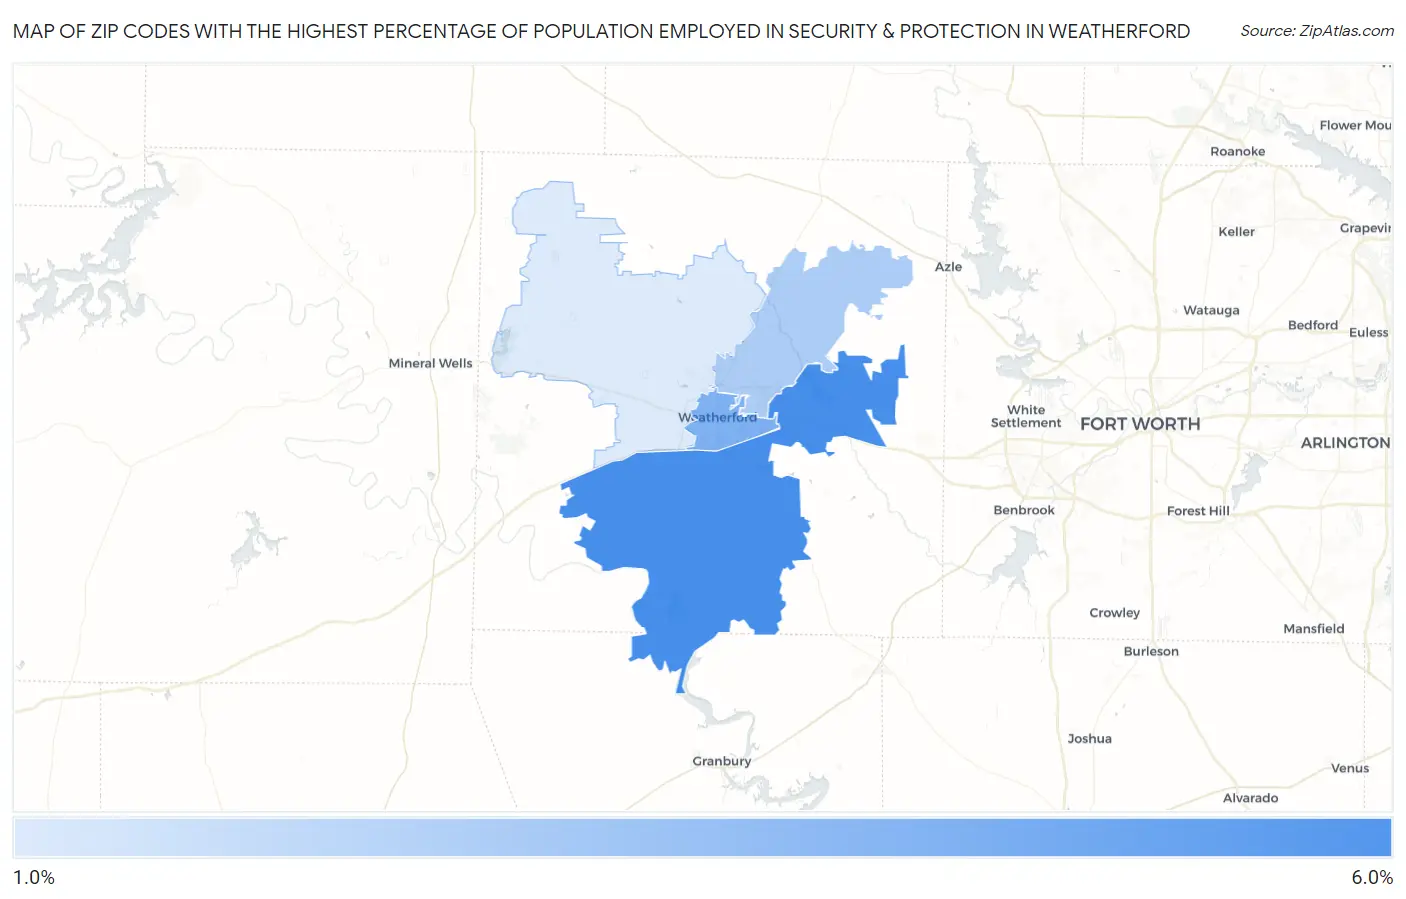
Map of Zip Codes with the Highest Percentage of Population Employed in Security & Protection in Weatherford
1.3%
5.3%
Zip Codes with the Highest Percentage of Population Employed in Security & Protection in Weatherford, TX
| Zip Code | % Employed | vs State | vs National | |
| 1. | 76087 | 5.3% | 2.2%(+3.09)#201 | 2.1%(+3.17)#2,623 |
| 2. | 76086 | 3.8% | 2.2%(+1.57)#359 | 2.1%(+1.65)#4,908 |
| 3. | 76085 | 2.6% | 2.2%(+0.331)#649 | 2.1%(+0.406)#9,222 |
| 4. | 76088 | 1.3% | 2.2%(-0.941)#1,174 | 2.1%(-0.866)#17,887 |
1
Common Questions
What are the Top 3 Zip Codes with the Highest Percentage of Population Employed in Security & Protection in Weatherford, TX?
Top 3 Zip Codes with the Highest Percentage of Population Employed in Security & Protection in Weatherford, TX are:
What zip code has the Highest Percentage of Population Employed in Security & Protection in Weatherford, TX?
76087 has the Highest Percentage of Population Employed in Security & Protection in Weatherford, TX with 5.3%.
What is the Percentage of Population Employed in Security & Protection in Weatherford, TX?
Percentage of Population Employed in Security & Protection in Weatherford is 3.6%.
What is the Percentage of Population Employed in Security & Protection in Texas?
Percentage of Population Employed in Security & Protection in Texas is 2.2%.
What is the Percentage of Population Employed in Security & Protection in the United States?
Percentage of Population Employed in Security & Protection in the United States is 2.1%.