Zip Codes with the Highest Percentage of Immigrants from Eastern Asia in Weatherford, TX
RELATED REPORTS & OPTIONS
Eastern Asia
Weatherford
Compare Zip Codes
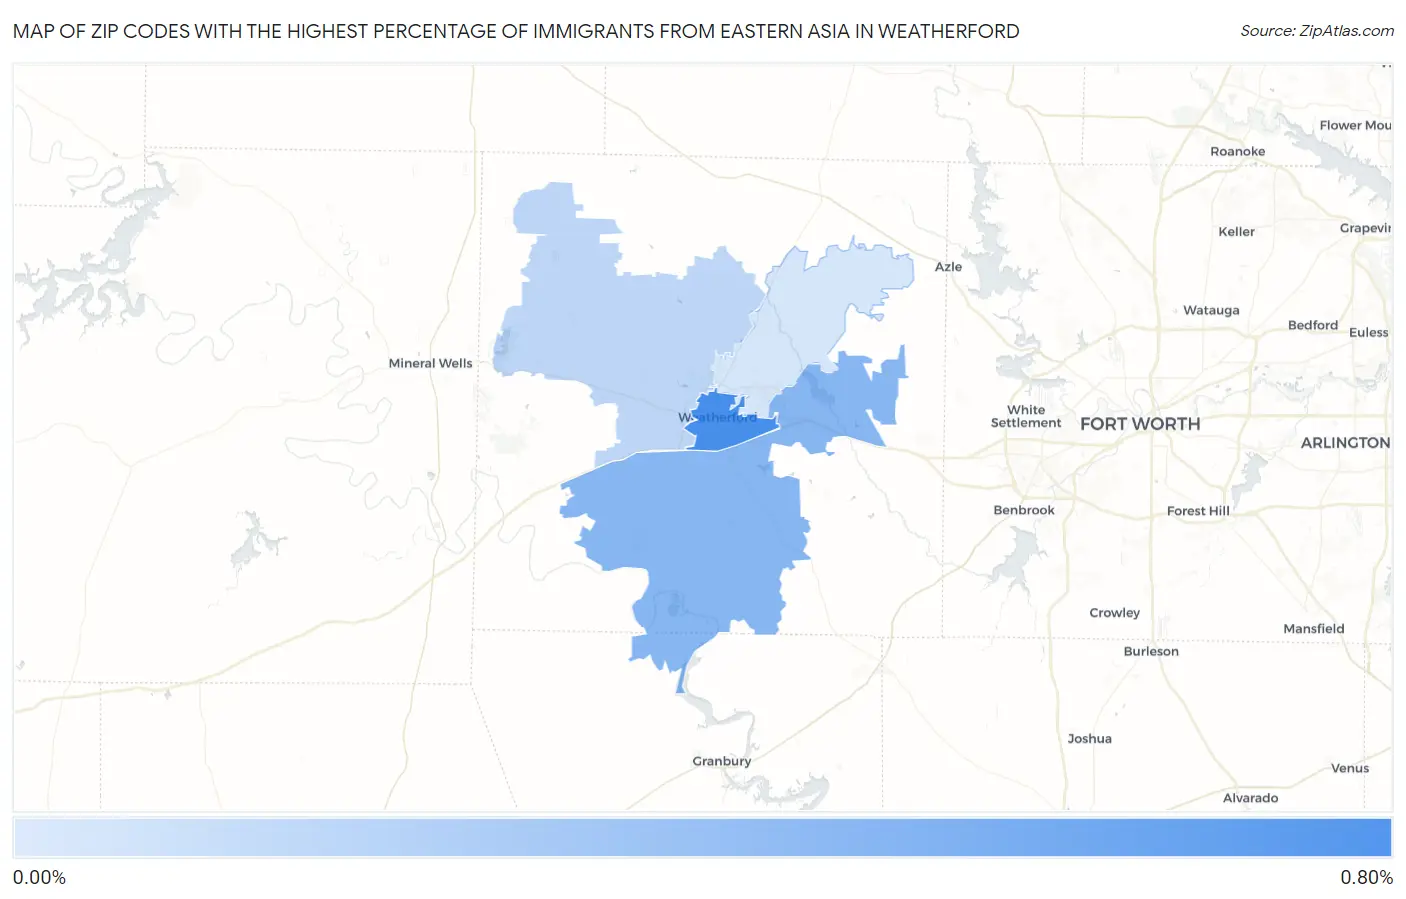
Map of Zip Codes with the Highest Percentage of Immigrants from Eastern Asia in Weatherford
0.034%
0.74%
Zip Codes with the Highest Percentage of Immigrants from Eastern Asia in Weatherford, TX
| Zip Code | Eastern Asia | vs State | vs National | |
| 1. | 76086 | 0.74% | 0.79%(-0.050)#265 | 1.28%(-0.534)#5,002 |
| 2. | 76087 | 0.42% | 0.79%(-0.370)#393 | 1.28%(-0.855)#7,341 |
| 3. | 76088 | 0.16% | 0.79%(-0.628)#611 | 1.28%(-1.11)#10,940 |
| 4. | 76085 | 0.034% | 0.79%(-0.757)#806 | 1.28%(-1.24)#13,591 |
1
Common Questions
What are the Top 3 Zip Codes with the Highest Percentage of Immigrants from Eastern Asia in Weatherford, TX?
Top 3 Zip Codes with the Highest Percentage of Immigrants from Eastern Asia in Weatherford, TX are:
What zip code has the Highest Percentage of Immigrants from Eastern Asia in Weatherford, TX?
76086 has the Highest Percentage of Immigrants from Eastern Asia in Weatherford, TX with 0.74%.
What is the Percentage of Immigrants from Eastern Asia in Weatherford, TX?
Percentage of Immigrants from Eastern Asia in Weatherford is 0.67%.
What is the Percentage of Immigrants from Eastern Asia in Texas?
Percentage of Immigrants from Eastern Asia in Texas is 0.79%.
What is the Percentage of Immigrants from Eastern Asia in the United States?
Percentage of Immigrants from Eastern Asia in the United States is 1.28%.