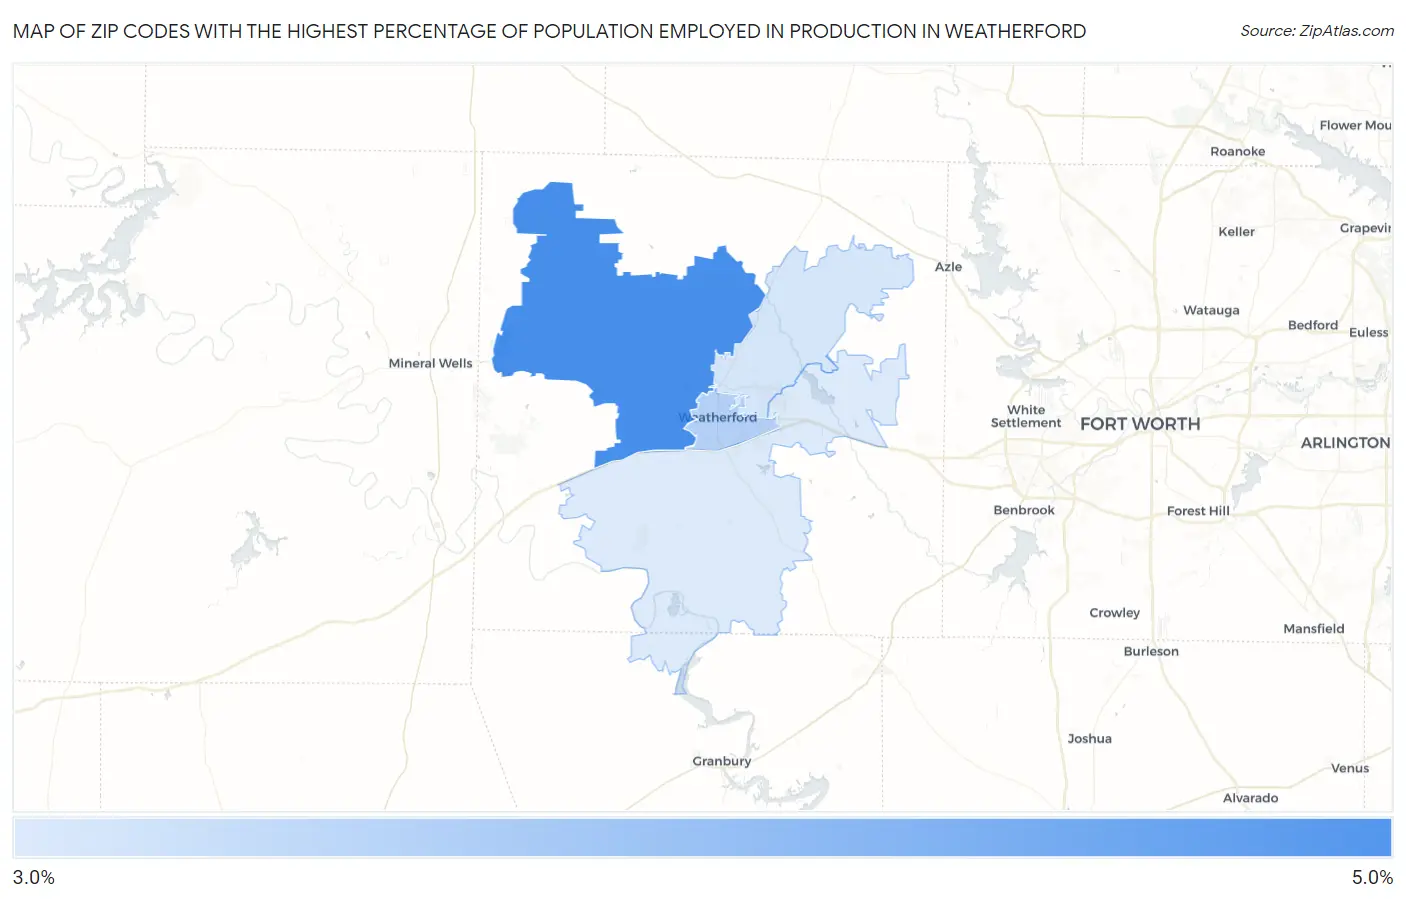
Zip Codes with the Highest Percentage of Population Employed in Production in Weatherford, TX
RELATED REPORTS & OPTIONS
Production
Weatherford
Compare Zip Codes
Map of Zip Codes with the Highest Percentage of Population Employed in Production in Weatherford
3.9%
4.8%
Zip Codes with the Highest Percentage of Population Employed in Production in Weatherford, TX
| Zip Code | % Employed | vs State | vs National | |
| 1. | 76088 | 4.8% | 4.9%(-0.111)#944 | 5.5%(-0.699)#18,233 |
| 2. | 76086 | 4.1% | 4.9%(-0.737)#1,074 | 5.5%(-1.33)#19,963 |
| 3. | 76085 | 3.9% | 4.9%(-0.945)#1,119 | 5.5%(-1.53)#20,521 |
| 4. | 76087 | 3.9% | 4.9%(-0.983)#1,128 | 5.5%(-1.57)#20,622 |
1
Common Questions
What are the Top 3 Zip Codes with the Highest Percentage of Population Employed in Production in Weatherford, TX?
Top 3 Zip Codes with the Highest Percentage of Population Employed in Production in Weatherford, TX are:
What zip code has the Highest Percentage of Population Employed in Production in Weatherford, TX?
76088 has the Highest Percentage of Population Employed in Production in Weatherford, TX with 4.8%.
What is the Percentage of Population Employed in Production in Weatherford, TX?
Percentage of Population Employed in Production in Weatherford is 3.8%.
What is the Percentage of Population Employed in Production in Texas?
Percentage of Population Employed in Production in Texas is 4.9%.
What is the Percentage of Population Employed in Production in the United States?
Percentage of Population Employed in Production in the United States is 5.5%.