Zip Codes with the Highest Percentage of Population Employed in Legal Services & Support in Weatherford, TX
RELATED REPORTS & OPTIONS
Legal Services & Support
Weatherford
Compare Zip Codes
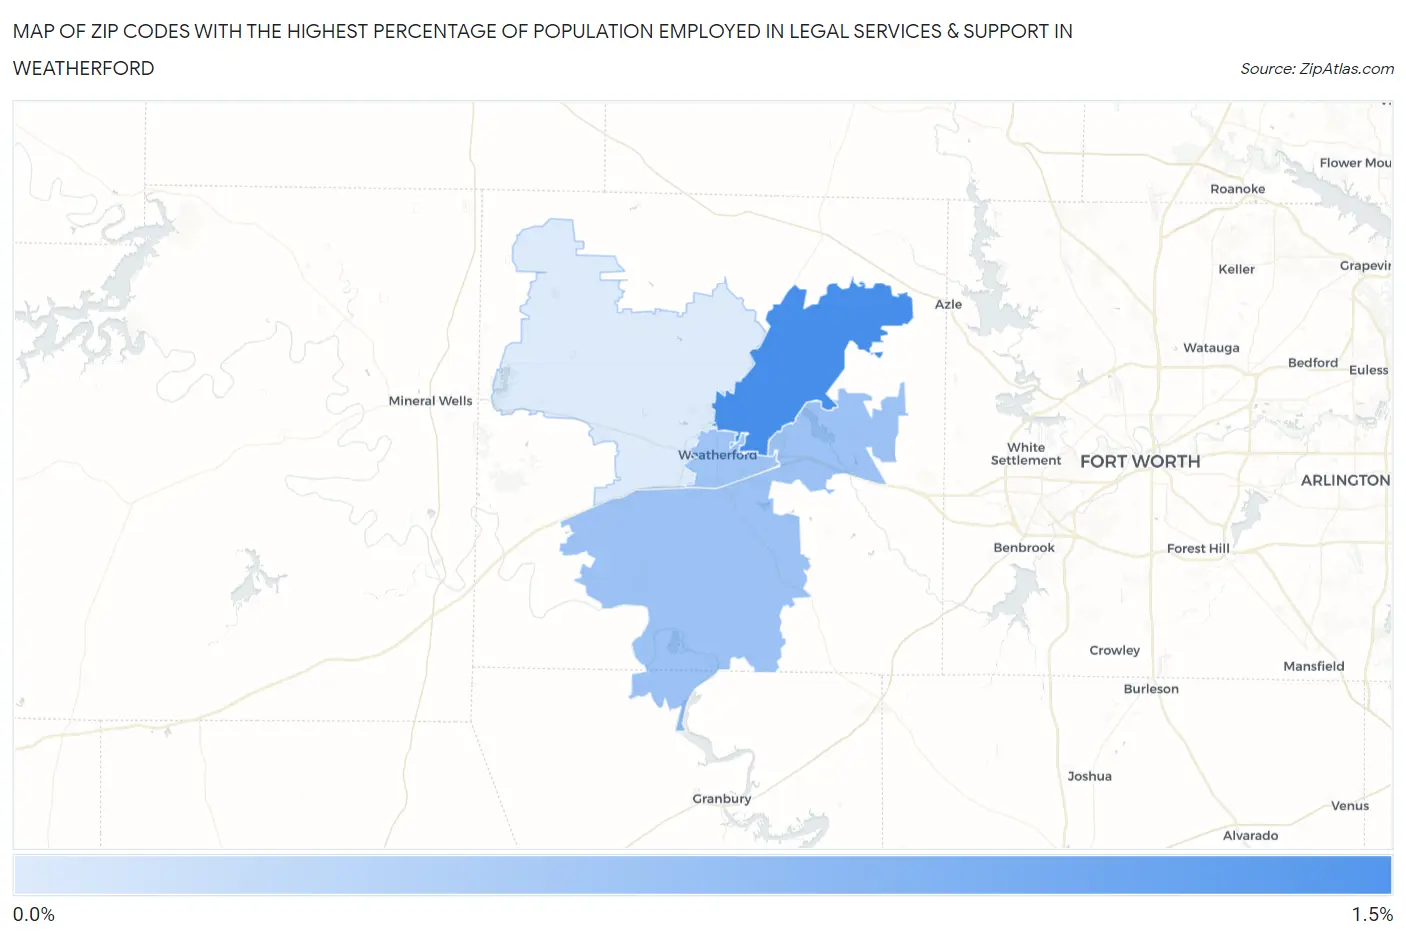
Map of Zip Codes with the Highest Percentage of Population Employed in Legal Services & Support in Weatherford
0.30%
1.4%
Zip Codes with the Highest Percentage of Population Employed in Legal Services & Support in Weatherford, TX
| Zip Code | % Employed | vs State | vs National | |
| 1. | 76085 | 1.4% | 1.0%(+0.356)#307 | 1.2%(+0.180)#5,636 |
| 2. | 76087 | 0.78% | 1.0%(-0.230)#541 | 1.2%(-0.406)#9,660 |
| 3. | 76086 | 0.75% | 1.0%(-0.262)#565 | 1.2%(-0.437)#9,964 |
| 4. | 76088 | 0.30% | 1.0%(-0.706)#922 | 1.2%(-0.881)#15,006 |
1
Common Questions
What are the Top 3 Zip Codes with the Highest Percentage of Population Employed in Legal Services & Support in Weatherford, TX?
Top 3 Zip Codes with the Highest Percentage of Population Employed in Legal Services & Support in Weatherford, TX are:
What zip code has the Highest Percentage of Population Employed in Legal Services & Support in Weatherford, TX?
76085 has the Highest Percentage of Population Employed in Legal Services & Support in Weatherford, TX with 1.4%.
What is the Percentage of Population Employed in Legal Services & Support in Weatherford, TX?
Percentage of Population Employed in Legal Services & Support in Weatherford is 0.74%.
What is the Percentage of Population Employed in Legal Services & Support in Texas?
Percentage of Population Employed in Legal Services & Support in Texas is 1.0%.
What is the Percentage of Population Employed in Legal Services & Support in the United States?
Percentage of Population Employed in Legal Services & Support in the United States is 1.2%.