Zip Codes with the Highest Percentage of Population Employed in Food Preparation & Serving in Harlingen, TX
RELATED REPORTS & OPTIONS
Food Preparation & Serving
Harlingen
Compare Zip Codes
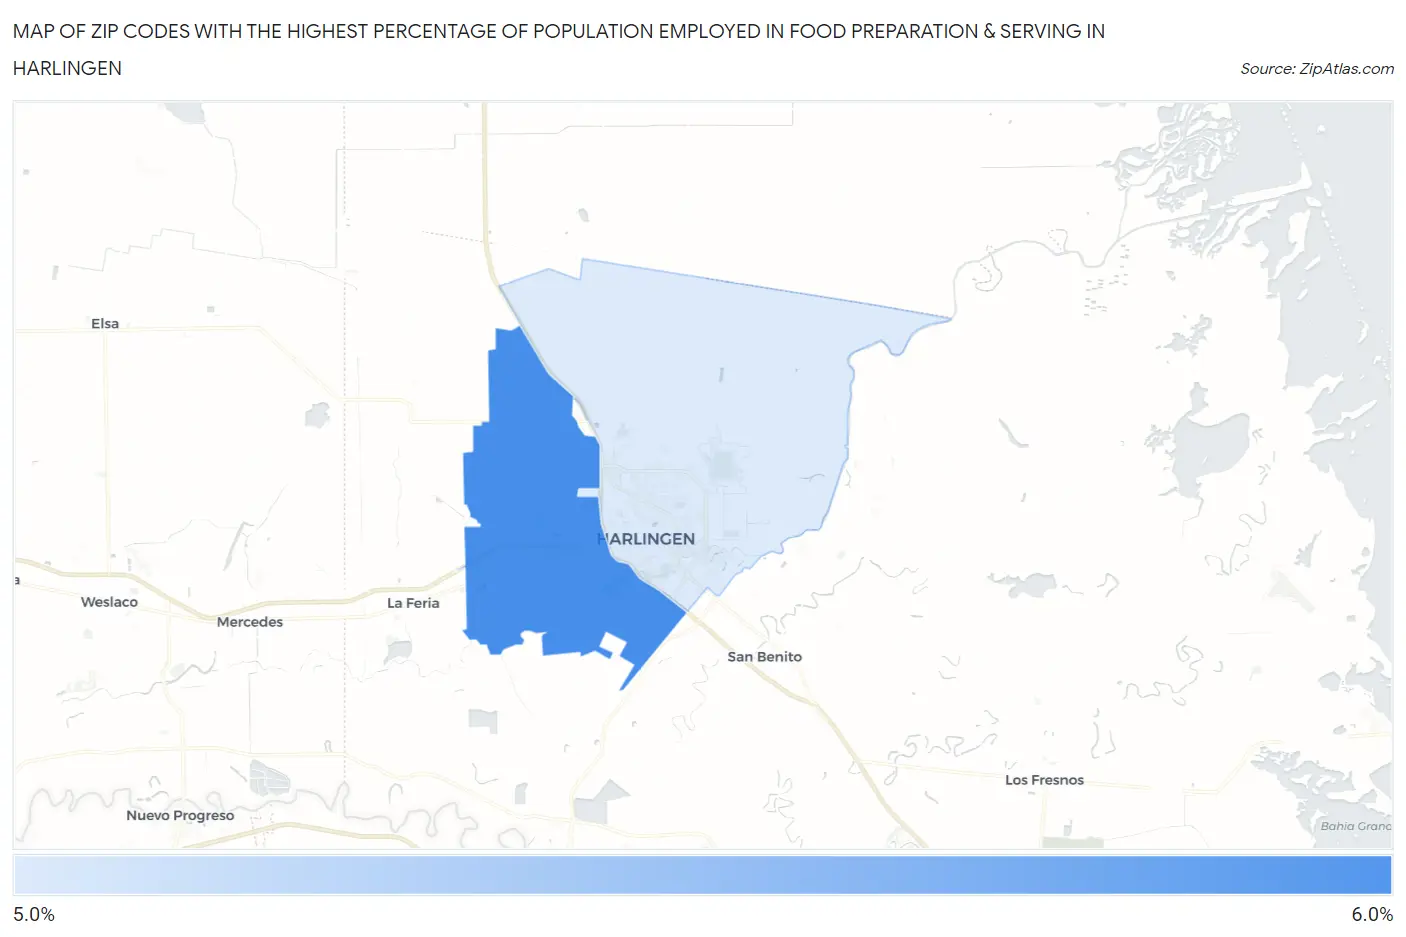
Map of Zip Codes with the Highest Percentage of Population Employed in Food Preparation & Serving in Harlingen
5.1%
5.9%
Zip Codes with the Highest Percentage of Population Employed in Food Preparation & Serving in Harlingen, TX
| Zip Code | % Employed | vs State | vs National | |
| 1. | 78552 | 5.9% | 5.4%(+0.587)#580 | 5.3%(+0.652)#9,548 |
| 2. | 78550 | 5.1% | 5.4%(-0.259)#784 | 5.3%(-0.194)#12,571 |
1
Common Questions
What are the Top Zip Codes with the Highest Percentage of Population Employed in Food Preparation & Serving in Harlingen, TX?
Top Zip Codes with the Highest Percentage of Population Employed in Food Preparation & Serving in Harlingen, TX are:
What zip code has the Highest Percentage of Population Employed in Food Preparation & Serving in Harlingen, TX?
78552 has the Highest Percentage of Population Employed in Food Preparation & Serving in Harlingen, TX with 5.9%.
What is the Percentage of Population Employed in Food Preparation & Serving in Harlingen, TX?
Percentage of Population Employed in Food Preparation & Serving in Harlingen is 5.9%.
What is the Percentage of Population Employed in Food Preparation & Serving in Texas?
Percentage of Population Employed in Food Preparation & Serving in Texas is 5.4%.
What is the Percentage of Population Employed in Food Preparation & Serving in the United States?
Percentage of Population Employed in Food Preparation & Serving in the United States is 5.3%.