Zip Codes with the Highest Percentage of Population Employed in Arts, Media & Entertainment in Harlingen, TX
RELATED REPORTS & OPTIONS
Arts, Media & Entertainment
Harlingen
Compare Zip Codes
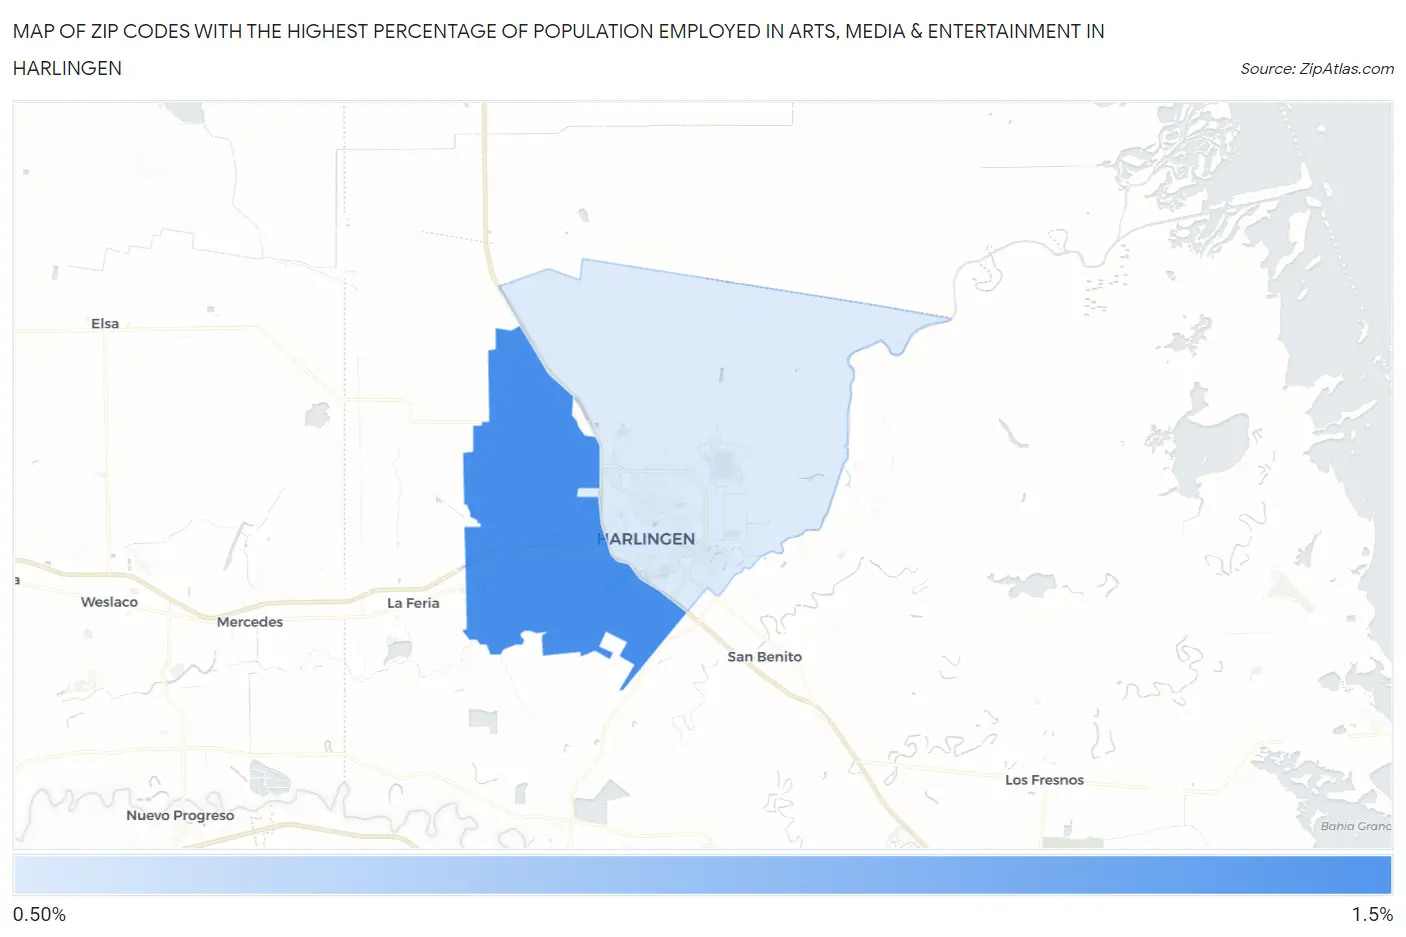
Map of Zip Codes with the Highest Percentage of Population Employed in Arts, Media & Entertainment in Harlingen
1.1%
1.5%
Zip Codes with the Highest Percentage of Population Employed in Arts, Media & Entertainment in Harlingen, TX
| Zip Code | % Employed | vs State | vs National | |
| 1. | 78552 | 1.5% | 1.7%(-0.195)#585 | 2.1%(-0.600)#11,255 |
| 2. | 78550 | 1.1% | 1.7%(-0.511)#728 | 2.1%(-0.916)#13,634 |
1
Common Questions
What are the Top Zip Codes with the Highest Percentage of Population Employed in Arts, Media & Entertainment in Harlingen, TX?
Top Zip Codes with the Highest Percentage of Population Employed in Arts, Media & Entertainment in Harlingen, TX are:
What zip code has the Highest Percentage of Population Employed in Arts, Media & Entertainment in Harlingen, TX?
78552 has the Highest Percentage of Population Employed in Arts, Media & Entertainment in Harlingen, TX with 1.5%.
What is the Percentage of Population Employed in Arts, Media & Entertainment in Harlingen, TX?
Percentage of Population Employed in Arts, Media & Entertainment in Harlingen is 1.1%.
What is the Percentage of Population Employed in Arts, Media & Entertainment in Texas?
Percentage of Population Employed in Arts, Media & Entertainment in Texas is 1.7%.
What is the Percentage of Population Employed in Arts, Media & Entertainment in the United States?
Percentage of Population Employed in Arts, Media & Entertainment in the United States is 2.1%.