Zip Codes with the Highest Percentage of Population with a Degree in Science and Engineering in Harlingen, TX
RELATED REPORTS & OPTIONS
Science and Engineering
Harlingen
Compare Zip Codes
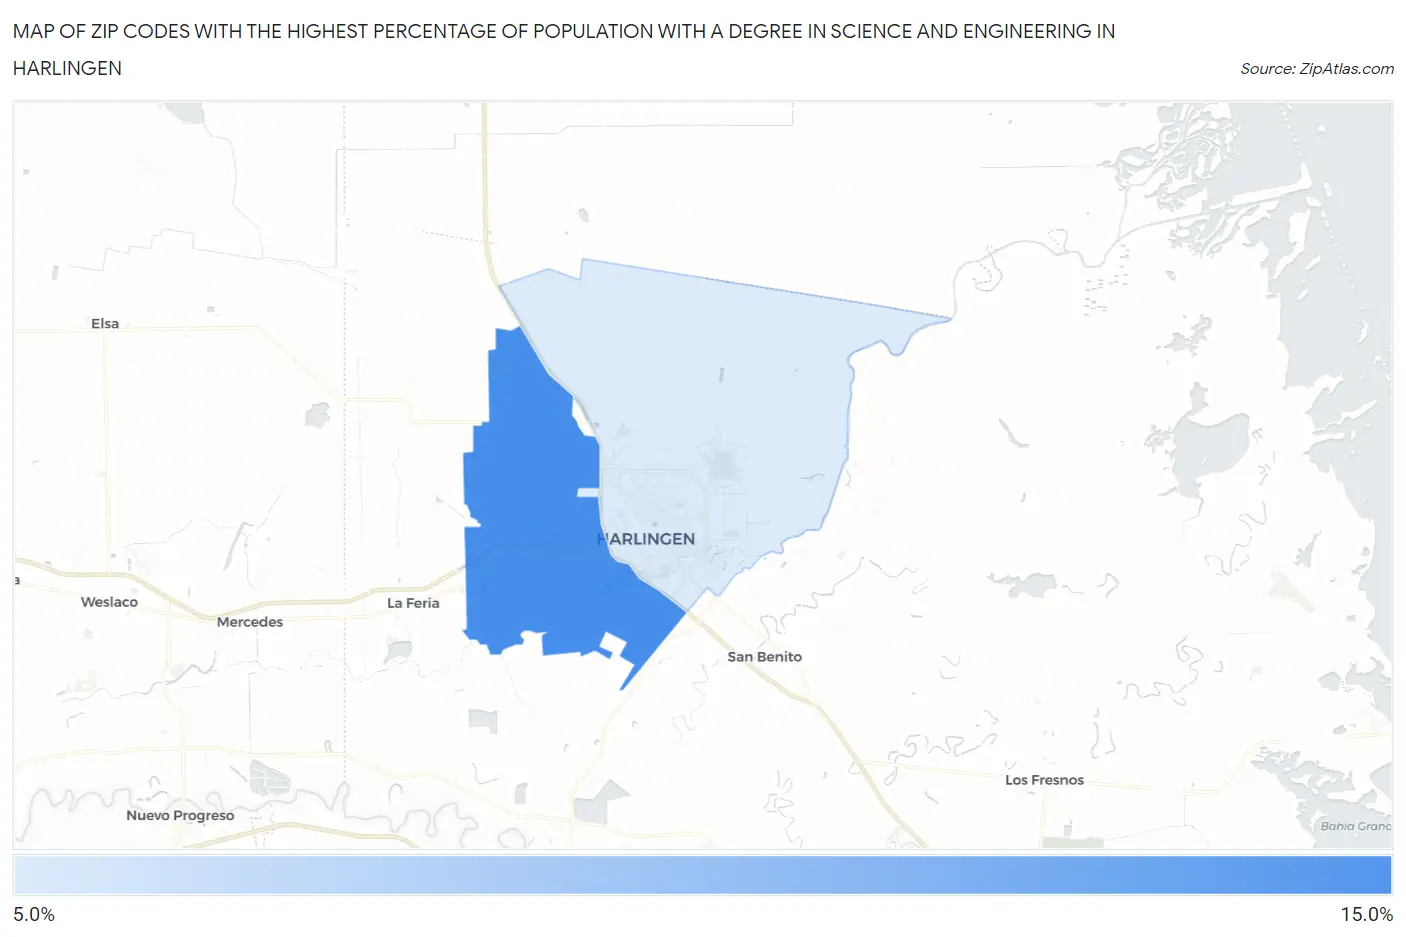
Map of Zip Codes with the Highest Percentage of Population with a Degree in Science and Engineering in Harlingen
11.0%
14.6%
Zip Codes with the Highest Percentage of Population with a Degree in Science and Engineering in Harlingen, TX
| Zip Code | % Graduates | vs State | vs National | |
| 1. | 78552 | 14.6% | 9.5%(+5.06)#291 | 9.8%(+4.80)#7,153 |
| 2. | 78550 | 11.0% | 9.5%(+1.52)#592 | 9.8%(+1.26)#12,771 |
1
Common Questions
What are the Top Zip Codes with the Highest Percentage of Population with a Degree in Science and Engineering in Harlingen, TX?
Top Zip Codes with the Highest Percentage of Population with a Degree in Science and Engineering in Harlingen, TX are:
What zip code has the Highest Percentage of Population with a Degree in Science and Engineering in Harlingen, TX?
78552 has the Highest Percentage of Population with a Degree in Science and Engineering in Harlingen, TX with 14.6%.
What is the Percentage of Population with a Degree in Science and Engineering in Harlingen, TX?
Percentage of Population with a Degree in Science and Engineering in Harlingen is 12.2%.
What is the Percentage of Population with a Degree in Science and Engineering in Texas?
Percentage of Population with a Degree in Science and Engineering in Texas is 9.5%.
What is the Percentage of Population with a Degree in Science and Engineering in the United States?
Percentage of Population with a Degree in Science and Engineering in the United States is 9.8%.