Zip Codes with the Highest Percentage of Population Employed in Mining, Quarrying, & Extraction in Harlingen, TX
RELATED REPORTS & OPTIONS
Mining, Quarrying, & Extraction
Harlingen
Compare Zip Codes
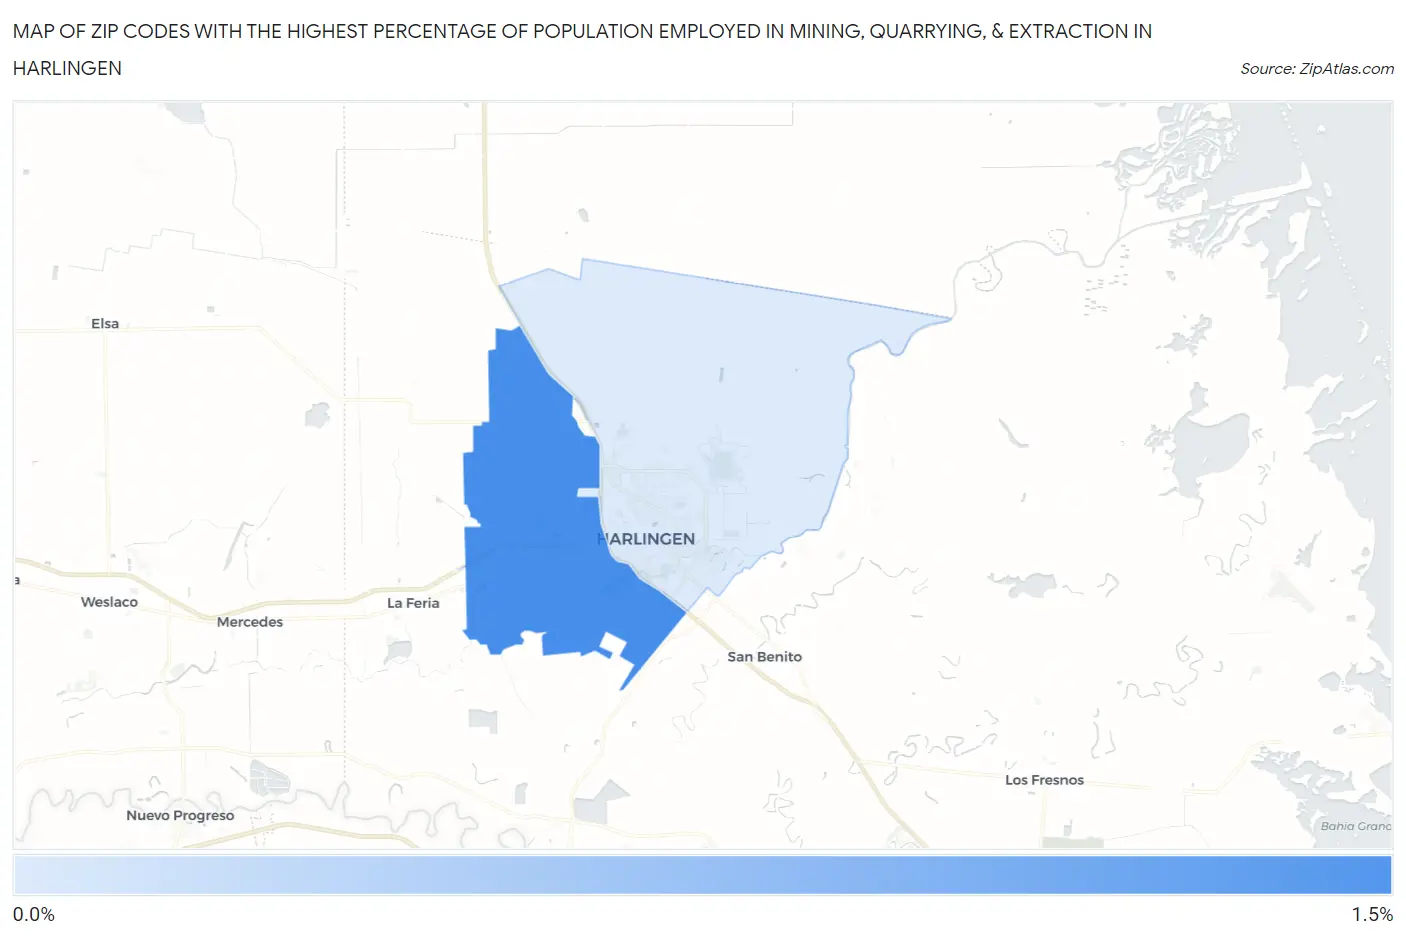
Map of Zip Codes with the Highest Percentage of Population Employed in Mining, Quarrying, & Extraction in Harlingen
0.28%
1.3%
Zip Codes with the Highest Percentage of Population Employed in Mining, Quarrying, & Extraction in Harlingen, TX
| Zip Code | % Employed | vs State | vs National | |
| 1. | 78552 | 1.3% | 1.9%(-0.592)#844 | 0.44%(+0.821)#4,779 |
| 2. | 78550 | 0.28% | 1.9%(-1.57)#1,357 | 0.44%(-0.161)#8,685 |
1
Common Questions
What are the Top Zip Codes with the Highest Percentage of Population Employed in Mining, Quarrying, & Extraction in Harlingen, TX?
Top Zip Codes with the Highest Percentage of Population Employed in Mining, Quarrying, & Extraction in Harlingen, TX are:
What zip code has the Highest Percentage of Population Employed in Mining, Quarrying, & Extraction in Harlingen, TX?
78552 has the Highest Percentage of Population Employed in Mining, Quarrying, & Extraction in Harlingen, TX with 1.3%.
What is the Percentage of Population Employed in Mining, Quarrying, & Extraction in Harlingen, TX?
Percentage of Population Employed in Mining, Quarrying, & Extraction in Harlingen is 0.21%.
What is the Percentage of Population Employed in Mining, Quarrying, & Extraction in Texas?
Percentage of Population Employed in Mining, Quarrying, & Extraction in Texas is 1.9%.
What is the Percentage of Population Employed in Mining, Quarrying, & Extraction in the United States?
Percentage of Population Employed in Mining, Quarrying, & Extraction in the United States is 0.44%.