Guayama, PR Map & Demographics
Guayama Map
Guayama Overview
$13,382
PER CAPITA INCOME
$25,774
AVG FAMILY INCOME
$20,445
AVG HOUSEHOLD INCOME
20.4%
WAGE / INCOME GAP [ % ]
79.6¢/ $1
WAGE / INCOME GAP [ $ ]
$15,000
FAMILY INCOME DEFICIT
0.54
INEQUALITY / GINI INDEX
18,153
TOTAL POPULATION
7,882
MALE POPULATION
10,271
FEMALE POPULATION
76.74
MALES / 100 FEMALES
130.31
FEMALES / 100 MALES
40.5
MEDIAN AGE
3.0
AVG FAMILY SIZE
2.3
AVG HOUSEHOLD SIZE
5,331
LABOR FORCE [ PEOPLE ]
35.6%
PERCENT IN LABOR FORCE
7.1%
UNEMPLOYMENT RATE
Guayama Zip Codes
Income in Guayama
Income Overview in Guayama
Per Capita Income in Guayama is $13,382, while median incomes of families and households are $25,774 and $20,445 respectively.
| Characteristic | Number | Measure |
| Per Capita Income | 18,153 | $13,382 |
| Median Family Income | 4,767 | $25,774 |
| Mean Family Income | 4,767 | $36,177 |
| Median Household Income | 7,912 | $20,445 |
| Mean Household Income | 7,912 | $29,787 |
| Income Deficit | 4,767 | $15,000 |
| Wage / Income Gap (%) | 18,153 | 20.42% |
| Wage / Income Gap ($) | 18,153 | 79.58¢ per $1 |
| Gini / Inequality Index | 18,153 | 0.54 |
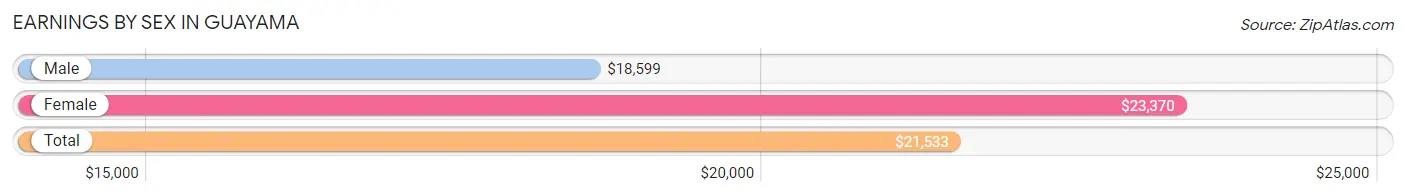
Earnings by Sex in Guayama
Average Earnings in Guayama are $21,533, $18,599 for men and $23,370 for women, a difference of 20.4%.
| Sex | Number | Average Earnings |
| Male | 2,601 (48.5%) | $18,599 |
| Female | 2,760 (51.5%) | $23,370 |
| Total | 5,361 (100.0%) | $21,533 |
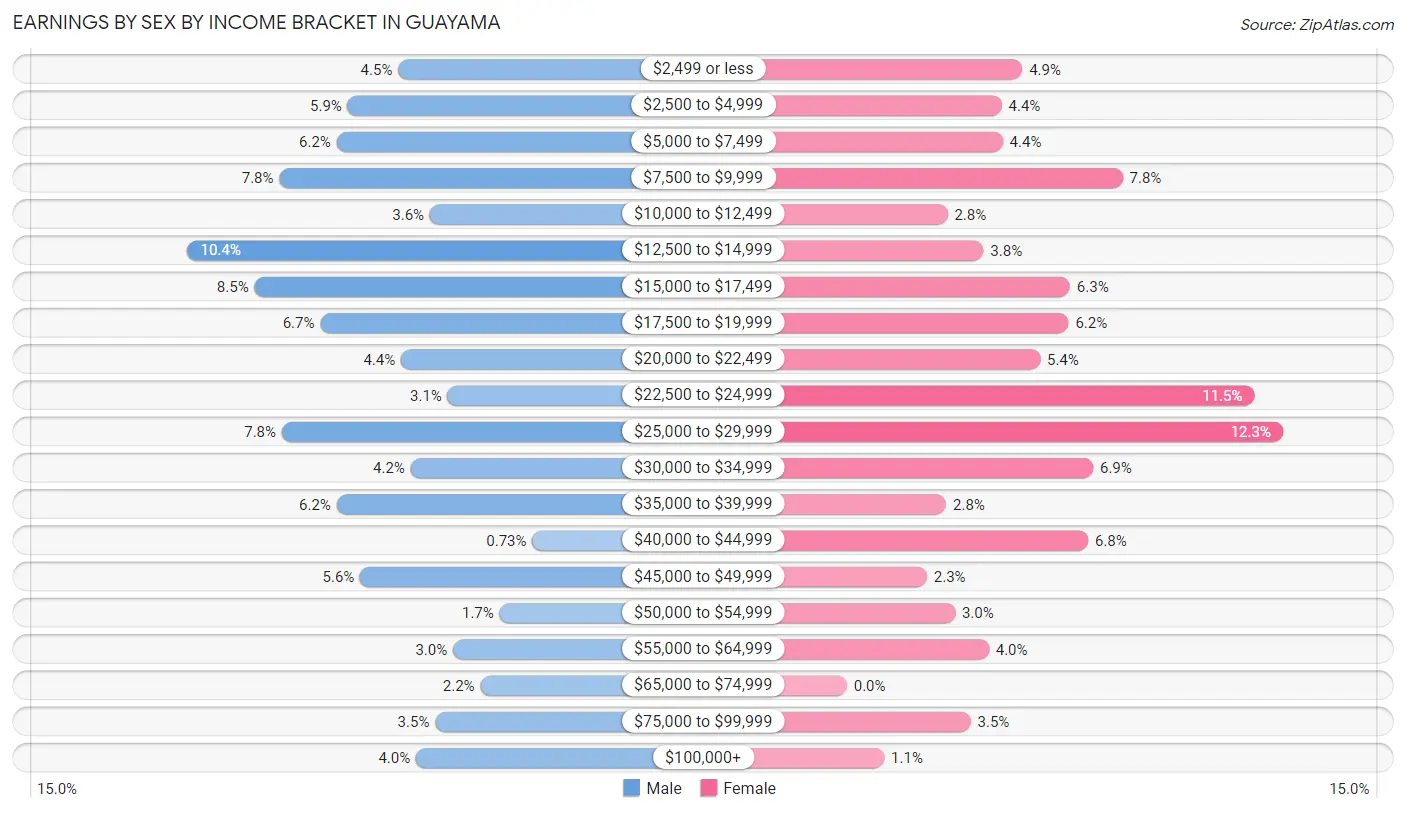
Earnings by Sex by Income Bracket in Guayama
The most common earnings brackets in Guayama are $12,500 to $14,999 for men (271 | 10.4%) and $25,000 to $29,999 for women (338 | 12.2%).
| Income | Male | Female |
| $2,499 or less | 117 (4.5%) | 136 (4.9%) |
| $2,500 to $4,999 | 154 (5.9%) | 120 (4.3%) |
| $5,000 to $7,499 | 162 (6.2%) | 121 (4.4%) |
| $7,500 to $9,999 | 204 (7.8%) | 214 (7.7%) |
| $10,000 to $12,499 | 94 (3.6%) | 78 (2.8%) |
| $12,500 to $14,999 | 271 (10.4%) | 106 (3.8%) |
| $15,000 to $17,499 | 222 (8.5%) | 173 (6.3%) |
| $17,500 to $19,999 | 174 (6.7%) | 172 (6.2%) |
| $20,000 to $22,499 | 115 (4.4%) | 150 (5.4%) |
| $22,500 to $24,999 | 81 (3.1%) | 316 (11.5%) |
| $25,000 to $29,999 | 202 (7.8%) | 338 (12.2%) |
| $30,000 to $34,999 | 108 (4.2%) | 191 (6.9%) |
| $35,000 to $39,999 | 162 (6.2%) | 77 (2.8%) |
| $40,000 to $44,999 | 19 (0.7%) | 187 (6.8%) |
| $45,000 to $49,999 | 145 (5.6%) | 62 (2.2%) |
| $50,000 to $54,999 | 43 (1.7%) | 84 (3.0%) |
| $55,000 to $64,999 | 77 (3.0%) | 110 (4.0%) |
| $65,000 to $74,999 | 57 (2.2%) | 0 (0.0%) |
| $75,000 to $99,999 | 90 (3.5%) | 96 (3.5%) |
| $100,000+ | 104 (4.0%) | 29 (1.1%) |
| Total | 2,601 (100.0%) | 2,760 (100.0%) |
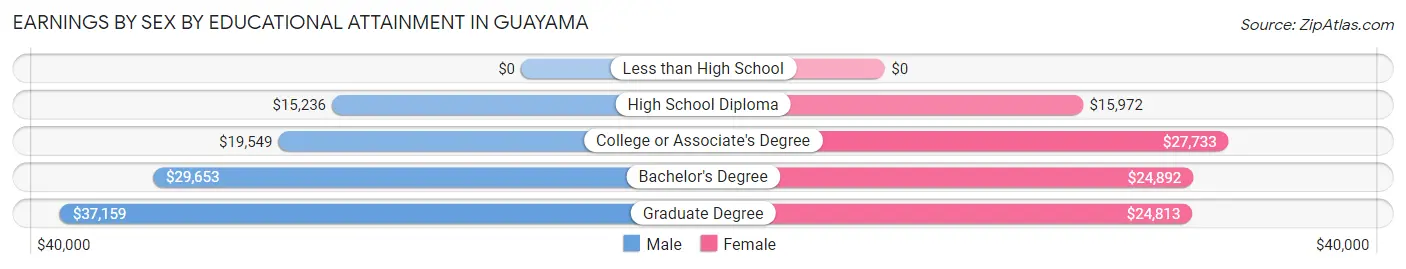
Earnings by Sex by Educational Attainment in Guayama
Average earnings in Guayama are $19,921 for men and $24,482 for women, a difference of 18.6%. Men with an educational attainment of graduate degree enjoy the highest average annual earnings of $37,159, while those with high school diploma education earn the least with $15,236. Women with an educational attainment of college or associate's degree earn the most with the average annual earnings of $27,733, while those with high school diploma education have the smallest earnings of $15,972.
| Educational Attainment | Male Income | Female Income |
| Less than High School | - | - |
| High School Diploma | $15,236 | $15,972 |
| College or Associate's Degree | $19,549 | $27,733 |
| Bachelor's Degree | $29,653 | $24,892 |
| Graduate Degree | $37,159 | $24,813 |
| Total | $19,921 | $24,482 |
Family Income in Guayama
Family Income Brackets in Guayama
According to the Guayama family income data, there are 1,492 families falling into the less than $10,000 income range, which is the most common income bracket and makes up 31.3% of all families. Conversely, the $200,000+ income bracket is the least frequent group with only 14 families (0.3%) belonging to this category.
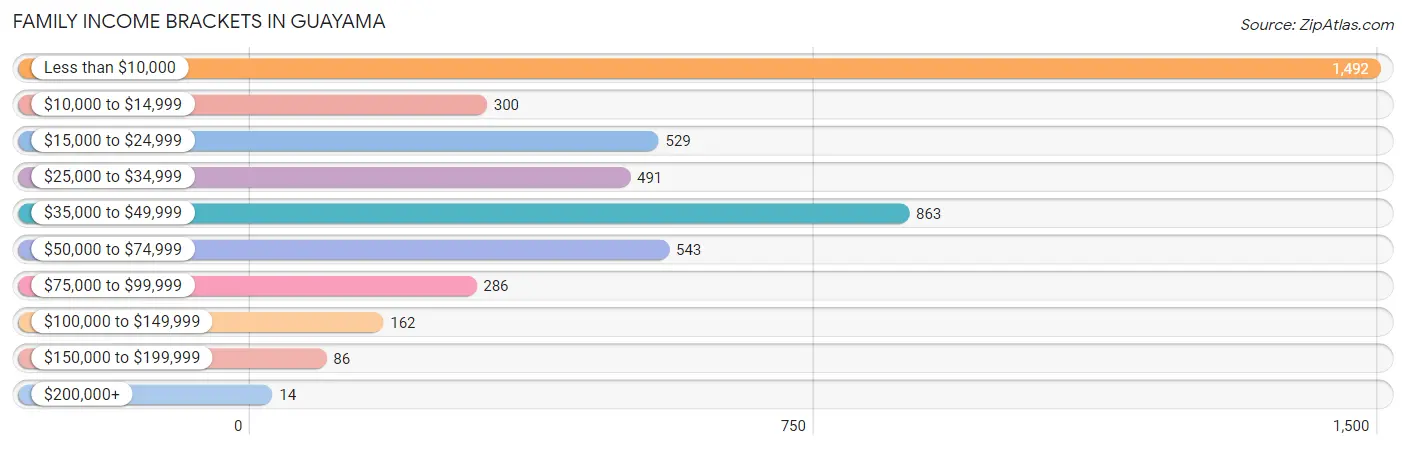
| Income Bracket | # Families | % Families |
| Less than $10,000 | 1,492 | 31.3% |
| $10,000 to $14,999 | 300 | 6.3% |
| $15,000 to $24,999 | 529 | 11.1% |
| $25,000 to $34,999 | 491 | 10.3% |
| $35,000 to $49,999 | 863 | 18.1% |
| $50,000 to $74,999 | 543 | 11.4% |
| $75,000 to $99,999 | 286 | 6.0% |
| $100,000 to $149,999 | 162 | 3.4% |
| $150,000 to $199,999 | 86 | 1.8% |
| $200,000+ | 14 | 0.3% |
Family Income by Famaliy Size in Guayama
5-person families (265 | 5.6%) account for the highest median family income in Guayama with $49,464 per family, while 2-person families (2,342 | 49.1%) have the highest median income of $13,372 per family member.
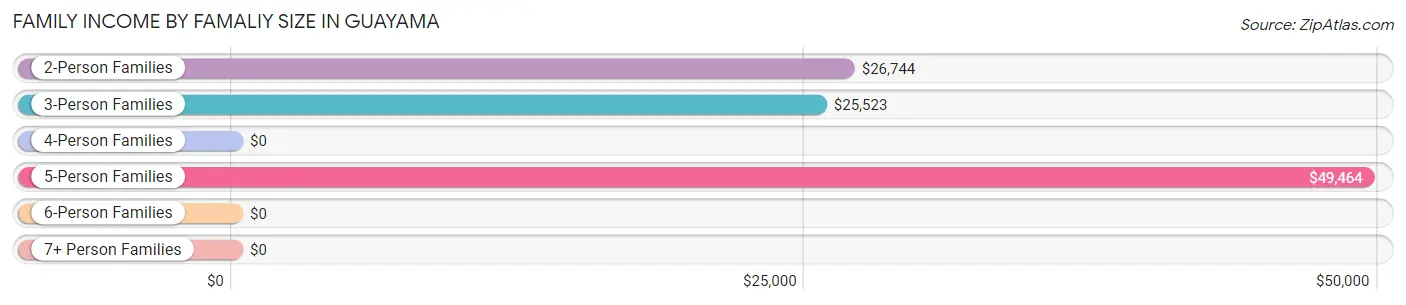
| Income Bracket | # Families | Median Income |
| 2-Person Families | 2,342 (49.1%) | $26,744 |
| 3-Person Families | 1,332 (27.9%) | $25,523 |
| 4-Person Families | 735 (15.4%) | $0 |
| 5-Person Families | 265 (5.6%) | $49,464 |
| 6-Person Families | 16 (0.3%) | $0 |
| 7+ Person Families | 77 (1.6%) | $0 |
| Total | 4,767 (100.0%) | $25,774 |
Family Income by Number of Earners in Guayama
The median family income in Guayama is $25,774, with families comprising 3+ earners (176) having the highest median family income of $71,250, while families with no earners (2,177) have the lowest median family income of $9,314, accounting for 3.7% and 45.7% of families, respectively.
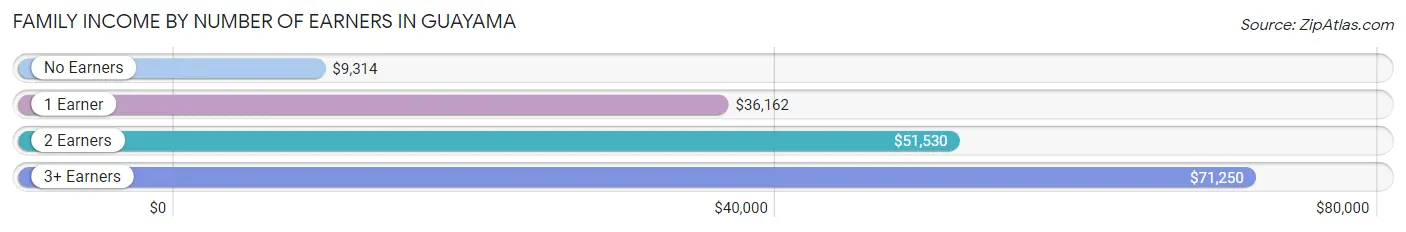
| Number of Earners | # Families | Median Income |
| No Earners | 2,177 (45.7%) | $9,314 |
| 1 Earner | 1,617 (33.9%) | $36,162 |
| 2 Earners | 797 (16.7%) | $51,530 |
| 3+ Earners | 176 (3.7%) | $71,250 |
| Total | 4,767 (100.0%) | $25,774 |
Household Income in Guayama
Household Income Brackets in Guayama
With 2,579 households falling in the category, the less than $10,000 income range is the most frequent in Guayama, accounting for 32.6% of all households. In contrast, only 16 households (0.2%) fall into the $200,000+ income bracket, making it the least populous group.
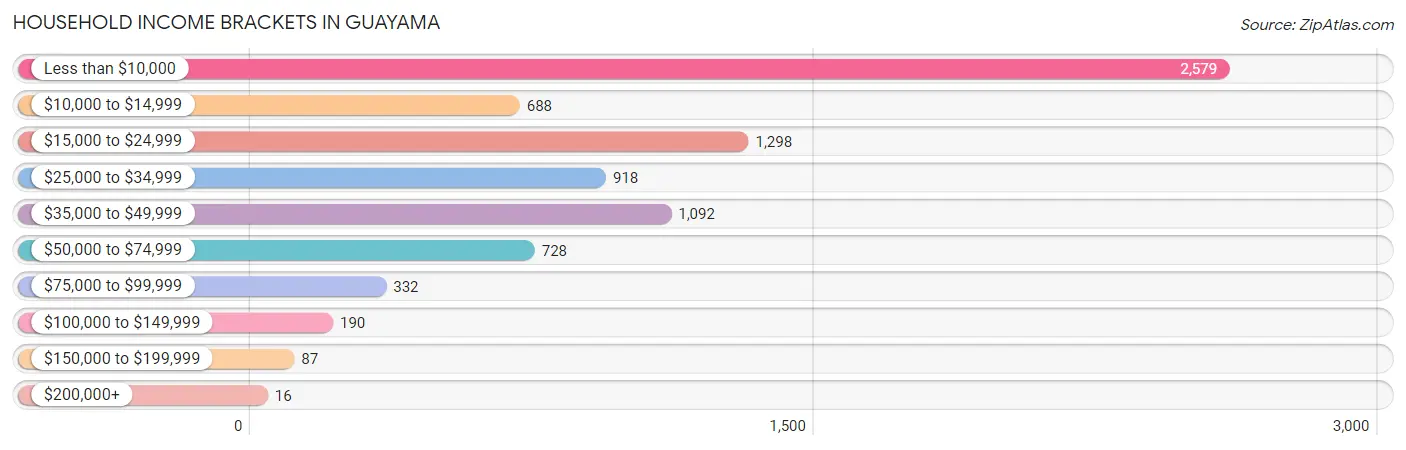
| Income Bracket | # Households | % Households |
| Less than $10,000 | 2,579 | 32.6% |
| $10,000 to $14,999 | 688 | 8.7% |
| $15,000 to $24,999 | 1,298 | 16.4% |
| $25,000 to $34,999 | 918 | 11.6% |
| $35,000 to $49,999 | 1,092 | 13.8% |
| $50,000 to $74,999 | 728 | 9.2% |
| $75,000 to $99,999 | 332 | 4.2% |
| $100,000 to $149,999 | 190 | 2.4% |
| $150,000 to $199,999 | 87 | 1.1% |
| $200,000+ | 16 | 0.2% |
Household Income by Householder Age in Guayama
The median household income in Guayama is $20,445, with the highest median household income of $25,359 found in the 45 to 64 years age bracket for the primary householder. A total of 2,477 households (31.3%) fall into this category. Meanwhile, the 15 to 24 years age bracket for the primary householder has the lowest median household income of $0, with 316 households (4.0%) in this group.
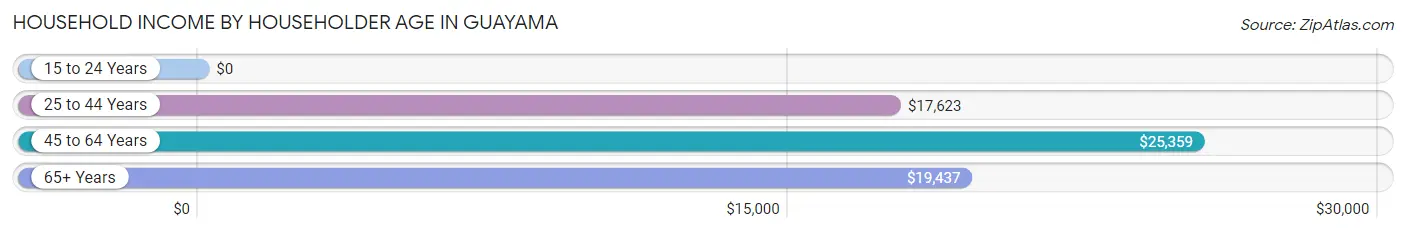
| Income Bracket | # Households | Median Income |
| 15 to 24 Years | 316 (4.0%) | $0 |
| 25 to 44 Years | 2,155 (27.2%) | $17,623 |
| 45 to 64 Years | 2,477 (31.3%) | $25,359 |
| 65+ Years | 2,964 (37.5%) | $19,437 |
| Total | 7,912 (100.0%) | $20,445 |
Poverty in Guayama
Income Below Poverty by Sex and Age in Guayama
With 44.3% poverty level for males and 47.6% for females among the residents of Guayama, 5 year old males and 16 and 17 year old females are the most vulnerable to poverty, with 53 males (100.0%) and 227 females (83.8%) in their respective age groups living below the poverty level.
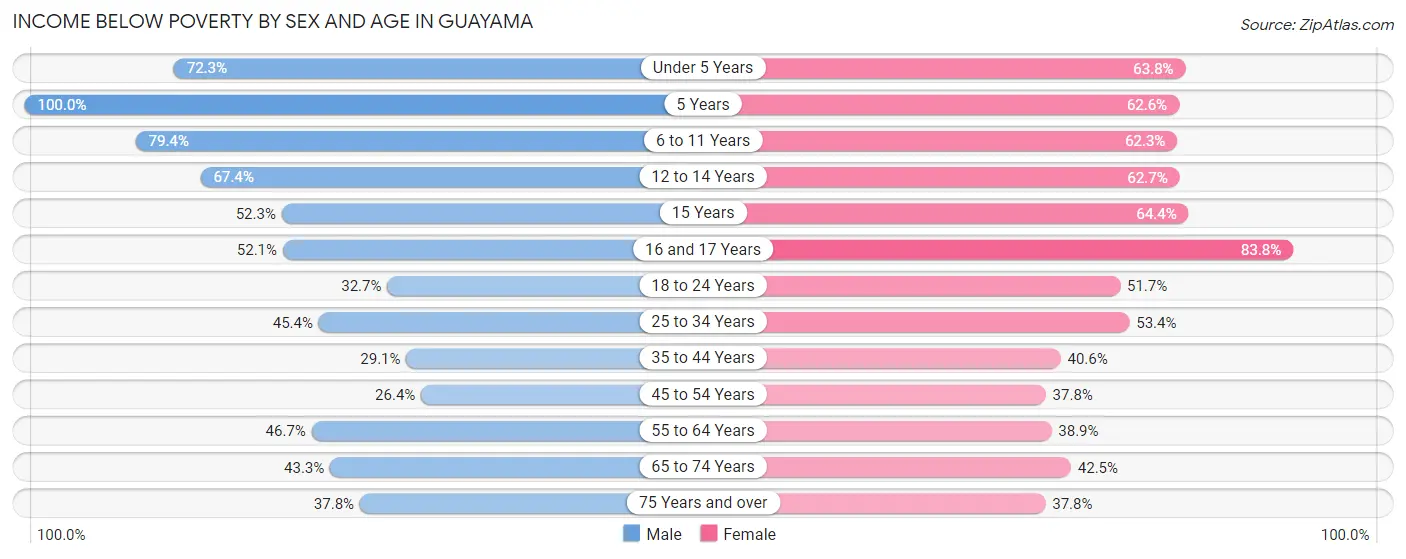
| Age Bracket | Male | Female |
| Under 5 Years | 274 (72.3%) | 169 (63.8%) |
| 5 Years | 53 (100.0%) | 117 (62.6%) |
| 6 to 11 Years | 443 (79.4%) | 371 (62.3%) |
| 12 to 14 Years | 196 (67.3%) | 378 (62.7%) |
| 15 Years | 69 (52.3%) | 74 (64.3%) |
| 16 and 17 Years | 101 (52.1%) | 227 (83.8%) |
| 18 to 24 Years | 368 (32.7%) | 437 (51.6%) |
| 25 to 34 Years | 512 (45.4%) | 760 (53.4%) |
| 35 to 44 Years | 197 (29.1%) | 491 (40.6%) |
| 45 to 54 Years | 242 (26.4%) | 470 (37.8%) |
| 55 to 64 Years | 385 (46.7%) | 426 (38.9%) |
| 65 to 74 Years | 361 (43.3%) | 509 (42.5%) |
| 75 Years and over | 287 (37.8%) | 451 (37.8%) |
| Total | 3,488 (44.3%) | 4,880 (47.6%) |
Income Above Poverty by Sex and Age in Guayama
According to the poverty statistics in Guayama, males aged 45 to 54 years and females aged 75 years and over are the age groups that are most secure financially, with 73.6% of males and 62.2% of females in these age groups living above the poverty line.
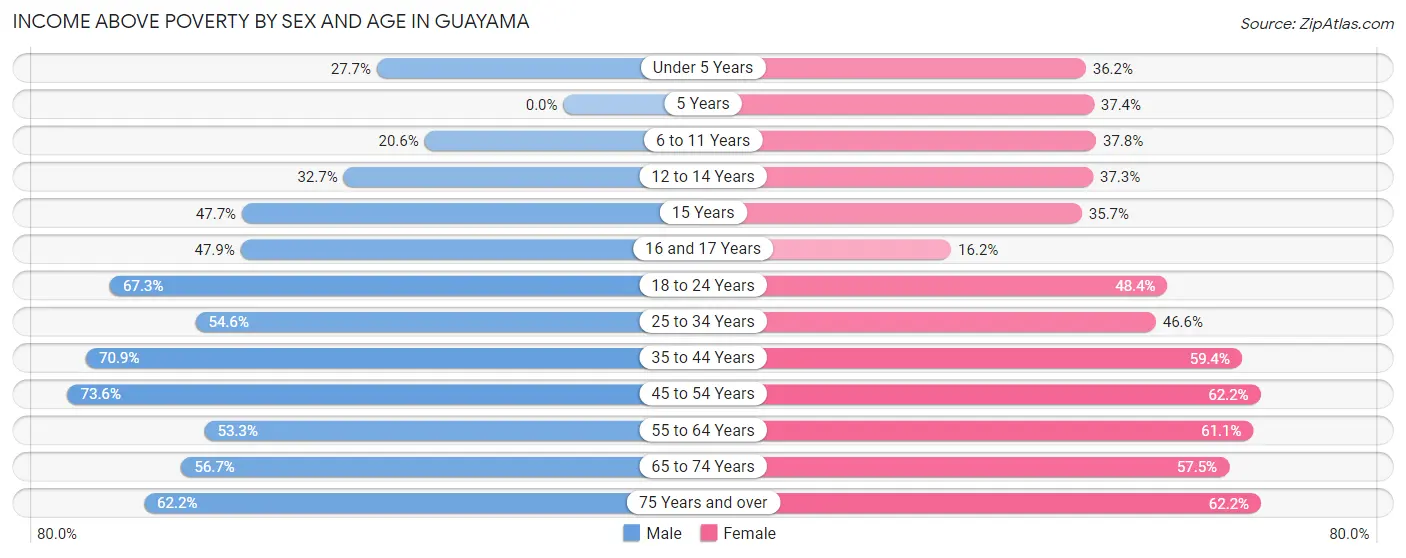
| Age Bracket | Male | Female |
| Under 5 Years | 105 (27.7%) | 96 (36.2%) |
| 5 Years | 0 (0.0%) | 70 (37.4%) |
| 6 to 11 Years | 115 (20.6%) | 225 (37.8%) |
| 12 to 14 Years | 95 (32.7%) | 225 (37.3%) |
| 15 Years | 63 (47.7%) | 41 (35.6%) |
| 16 and 17 Years | 93 (47.9%) | 44 (16.2%) |
| 18 to 24 Years | 758 (67.3%) | 409 (48.3%) |
| 25 to 34 Years | 616 (54.6%) | 664 (46.6%) |
| 35 to 44 Years | 479 (70.9%) | 718 (59.4%) |
| 45 to 54 Years | 675 (73.6%) | 772 (62.2%) |
| 55 to 64 Years | 439 (53.3%) | 669 (61.1%) |
| 65 to 74 Years | 473 (56.7%) | 688 (57.5%) |
| 75 Years and over | 473 (62.2%) | 743 (62.2%) |
| Total | 4,384 (55.7%) | 5,364 (52.4%) |
Income Below Poverty Among Married-Couple Families in Guayama
The poverty statistics for married-couple families in Guayama show that 25.9% or 561 of the total 2,170 families live below the poverty line. Families with 3 or 4 children have the highest poverty rate of 55.1%, comprising of 38 families. On the other hand, families with no children have the lowest poverty rate of 23.8%, which includes 377 families.
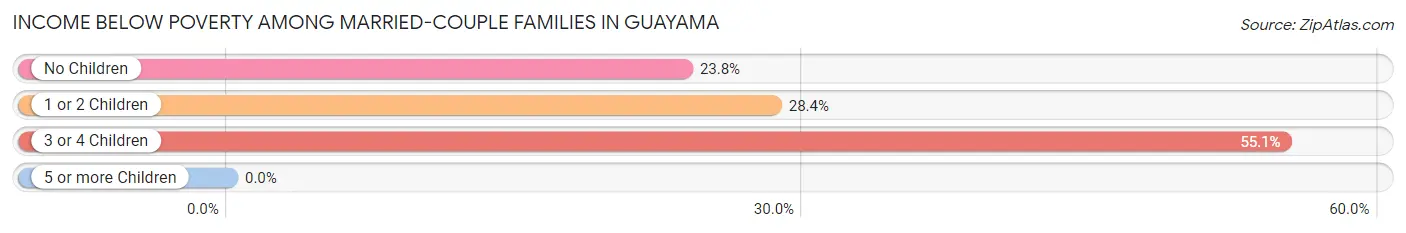
| Children | Above Poverty | Below Poverty |
| No Children | 1,210 (76.2%) | 377 (23.8%) |
| 1 or 2 Children | 368 (71.6%) | 146 (28.4%) |
| 3 or 4 Children | 31 (44.9%) | 38 (55.1%) |
| 5 or more Children | 0 (0.0%) | 0 (0.0%) |
| Total | 1,609 (74.2%) | 561 (25.9%) |
Income Below Poverty Among Single-Parent Households in Guayama
According to the poverty data in Guayama, 52.9% or 242 single-father households and 62.3% or 1,333 single-mother households are living below the poverty line. Among single-father households, those with 1 or 2 children have the highest poverty rate, with 135 households (79.4%) experiencing poverty. Likewise, among single-mother households, those with 3 or 4 children have the highest poverty rate, with 246 households (100.0%) falling below the poverty line.
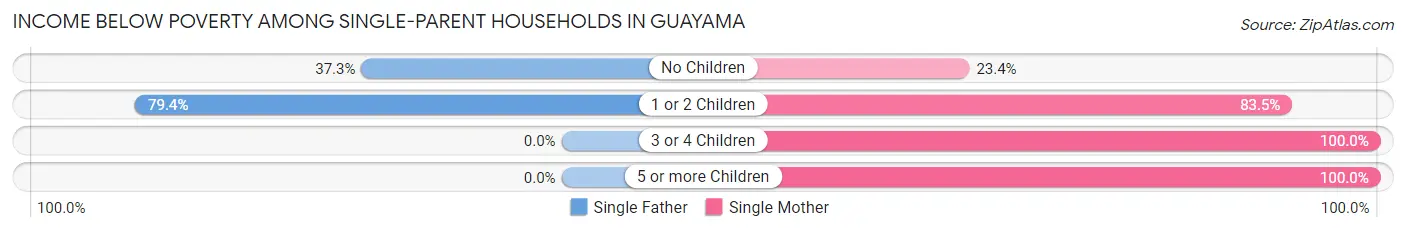
| Children | Single Father | Single Mother |
| No Children | 107 (37.3%) | 198 (23.4%) |
| 1 or 2 Children | 135 (79.4%) | 812 (83.5%) |
| 3 or 4 Children | 0 (0.0%) | 246 (100.0%) |
| 5 or more Children | 0 (0.0%) | 77 (100.0%) |
| Total | 242 (52.9%) | 1,333 (62.3%) |
Income Below Poverty Among Married-Couple vs Single-Parent Households in Guayama
The poverty data for Guayama shows that 561 of the married-couple family households (25.9%) and 1,575 of the single-parent households (60.7%) are living below the poverty level. Within the married-couple family households, those with 3 or 4 children have the highest poverty rate, with 38 households (55.1%) falling below the poverty line. Among the single-parent households, those with 3 or 4 children have the highest poverty rate, with 246 household (100.0%) living below poverty.
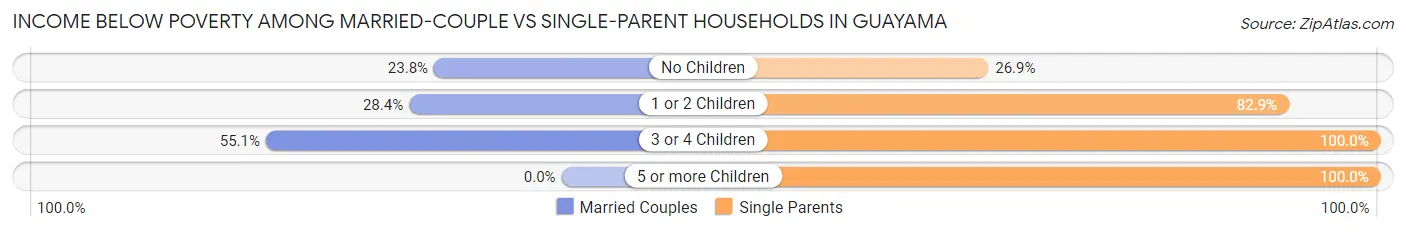
| Children | Married-Couple Families | Single-Parent Households |
| No Children | 377 (23.8%) | 305 (26.9%) |
| 1 or 2 Children | 146 (28.4%) | 947 (82.9%) |
| 3 or 4 Children | 38 (55.1%) | 246 (100.0%) |
| 5 or more Children | 0 (0.0%) | 77 (100.0%) |
| Total | 561 (25.9%) | 1,575 (60.7%) |
Race in Guayama
The most populous races in Guayama are Hispanic or Latino (18,001 | 99.2%), White / Caucasian (10,361 | 57.1%), and Two or more Races (3,840 | 21.1%).
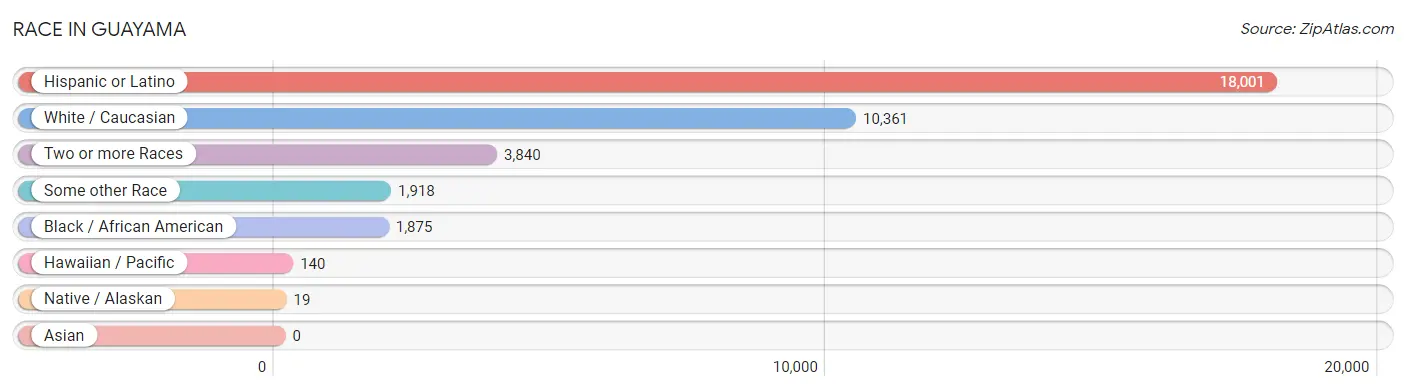
| Race | # Population | % Population |
| Asian | 0 | 0.0% |
| Black / African American | 1,875 | 10.3% |
| Hawaiian / Pacific | 140 | 0.8% |
| Hispanic or Latino | 18,001 | 99.2% |
| Native / Alaskan | 19 | 0.1% |
| White / Caucasian | 10,361 | 57.1% |
| Two or more Races | 3,840 | 21.1% |
| Some other Race | 1,918 | 10.6% |
| Total | 18,153 | 100.0% |
Ancestry in Guayama
The most populous ancestries reported in Guayama are Puerto Rican (17,768 | 97.9%), American (124 | 0.7%), Mexican (96 | 0.5%), Central American Indian (87 | 0.5%), and Spaniard (67 | 0.4%), together accounting for 99.9% of all Guayama residents.
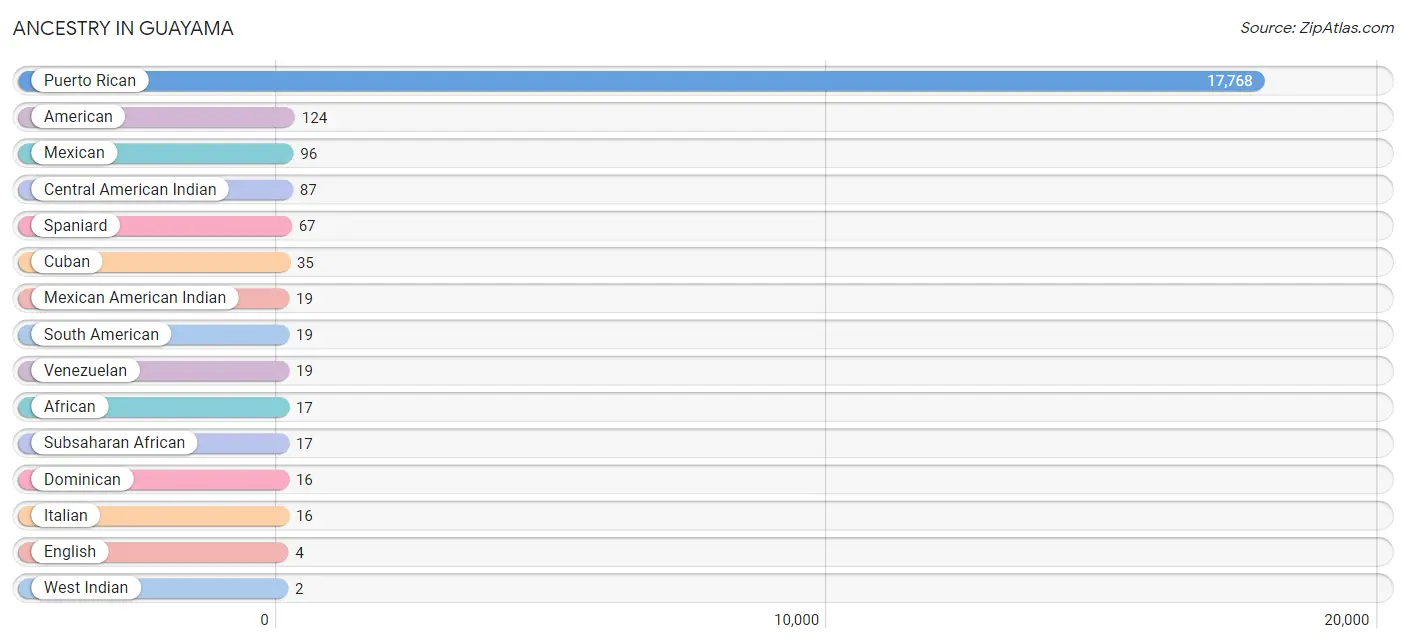
| Ancestry | # Population | % Population |
| African | 17 | 0.1% |
| American | 124 | 0.7% |
| Central American Indian | 87 | 0.5% |
| Cuban | 35 | 0.2% |
| Dominican | 16 | 0.1% |
| English | 4 | 0.0% |
| Italian | 16 | 0.1% |
| Mexican | 96 | 0.5% |
| Mexican American Indian | 19 | 0.1% |
| Puerto Rican | 17,768 | 97.9% |
| South American | 19 | 0.1% |
| Spaniard | 67 | 0.4% |
| Subsaharan African | 17 | 0.1% |
| Venezuelan | 19 | 0.1% |
| West Indian | 2 | 0.0% | View All 15 Rows |
Immigrants in Guayama

| Immigration Origin | # Population | % Population | View All 0 Rows |
Sex and Age in Guayama
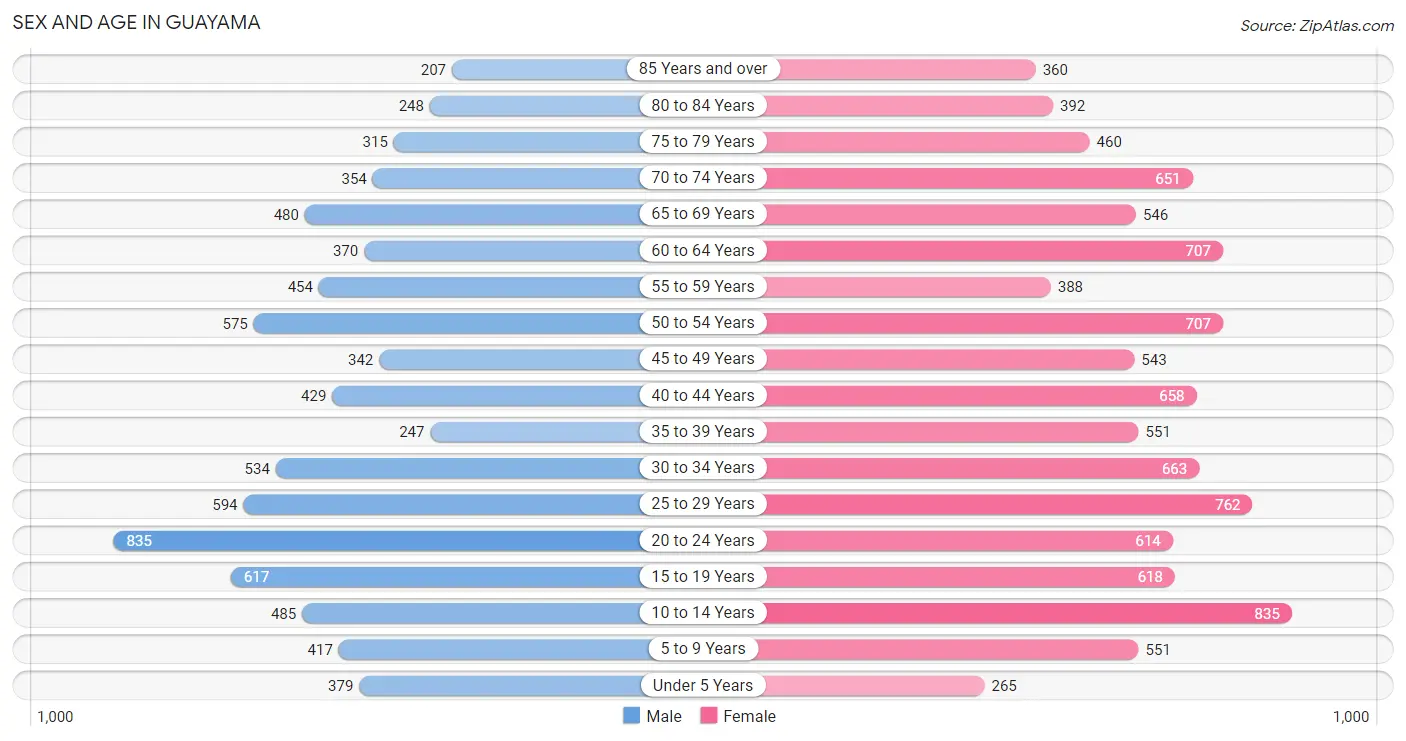
Sex and Age in Guayama
The most populous age groups in Guayama are 20 to 24 Years (835 | 10.6%) for men and 10 to 14 Years (835 | 8.1%) for women.
| Age Bracket | Male | Female |
| Under 5 Years | 379 (4.8%) | 265 (2.6%) |
| 5 to 9 Years | 417 (5.3%) | 551 (5.4%) |
| 10 to 14 Years | 485 (6.1%) | 835 (8.1%) |
| 15 to 19 Years | 617 (7.8%) | 618 (6.0%) |
| 20 to 24 Years | 835 (10.6%) | 614 (6.0%) |
| 25 to 29 Years | 594 (7.5%) | 762 (7.4%) |
| 30 to 34 Years | 534 (6.8%) | 663 (6.5%) |
| 35 to 39 Years | 247 (3.1%) | 551 (5.4%) |
| 40 to 44 Years | 429 (5.4%) | 658 (6.4%) |
| 45 to 49 Years | 342 (4.3%) | 543 (5.3%) |
| 50 to 54 Years | 575 (7.3%) | 707 (6.9%) |
| 55 to 59 Years | 454 (5.8%) | 388 (3.8%) |
| 60 to 64 Years | 370 (4.7%) | 707 (6.9%) |
| 65 to 69 Years | 480 (6.1%) | 546 (5.3%) |
| 70 to 74 Years | 354 (4.5%) | 651 (6.3%) |
| 75 to 79 Years | 315 (4.0%) | 460 (4.5%) |
| 80 to 84 Years | 248 (3.2%) | 392 (3.8%) |
| 85 Years and over | 207 (2.6%) | 360 (3.5%) |
| Total | 7,882 (100.0%) | 10,271 (100.0%) |
Families and Households in Guayama
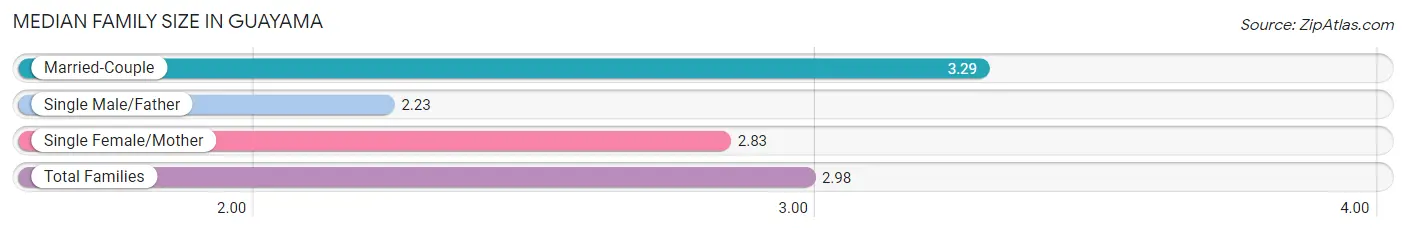
Median Family Size in Guayama
The median family size in Guayama is 2.98 persons per family, with married-couple families (2,170 | 45.5%) accounting for the largest median family size of 3.29 persons per family. On the other hand, single male/father families (457 | 9.6%) represent the smallest median family size with 2.23 persons per family.
| Family Type | # Families | Family Size |
| Married-Couple | 2,170 (45.5%) | 3.29 |
| Single Male/Father | 457 (9.6%) | 2.23 |
| Single Female/Mother | 2,140 (44.9%) | 2.83 |
| Total Families | 4,767 (100.0%) | 2.98 |
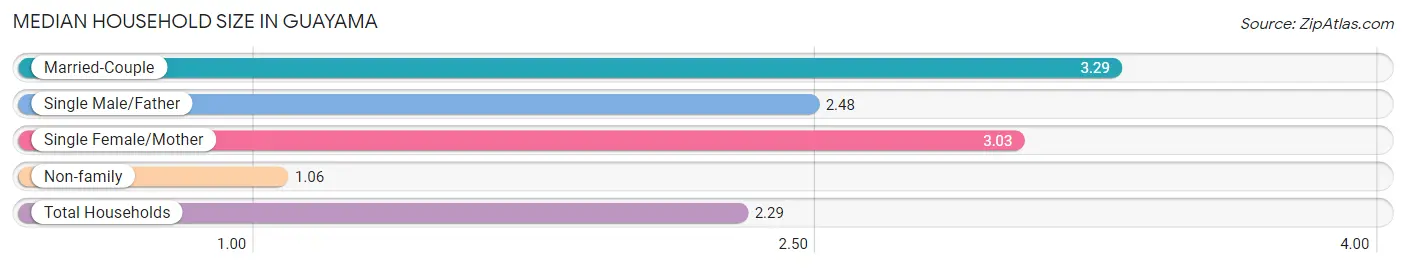
Median Household Size in Guayama
The median household size in Guayama is 2.29 persons per household, with married-couple households (2,170 | 27.4%) accounting for the largest median household size of 3.29 persons per household. non-family households (3,145 | 39.8%) represent the smallest median household size with 1.06 persons per household.
| Household Type | # Households | Household Size |
| Married-Couple | 2,170 (27.4%) | 3.29 |
| Single Male/Father | 457 (5.8%) | 2.48 |
| Single Female/Mother | 2,140 (27.1%) | 3.03 |
| Non-family | 3,145 (39.8%) | 1.06 |
| Total Households | 7,912 (100.0%) | 2.29 |
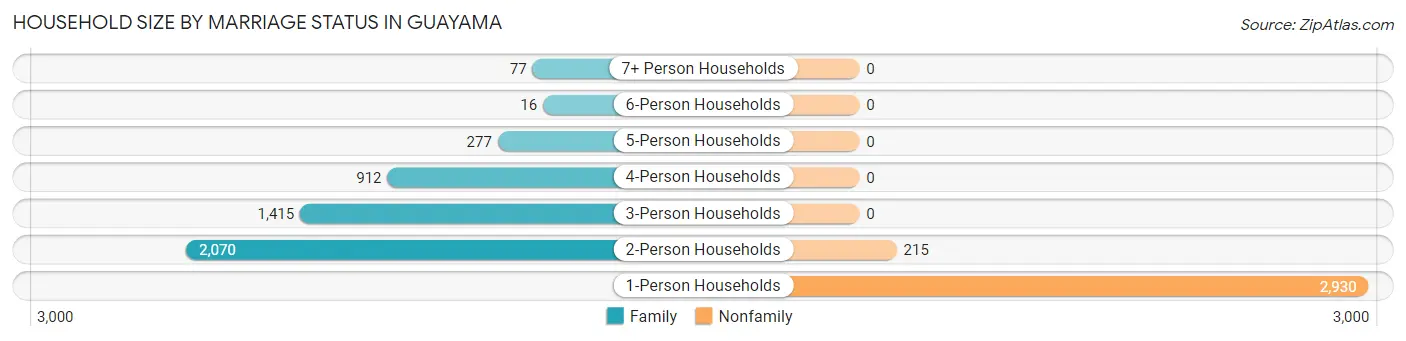
Household Size by Marriage Status in Guayama
Out of a total of 7,912 households in Guayama, 4,767 (60.3%) are family households, while 3,145 (39.8%) are nonfamily households. The most numerous type of family households are 2-person households, comprising 2,070, and the most common type of nonfamily households are 1-person households, comprising 2,930.
| Household Size | Family Households | Nonfamily Households |
| 1-Person Households | - | 2,930 (37.0%) |
| 2-Person Households | 2,070 (26.2%) | 215 (2.7%) |
| 3-Person Households | 1,415 (17.9%) | 0 (0.0%) |
| 4-Person Households | 912 (11.5%) | 0 (0.0%) |
| 5-Person Households | 277 (3.5%) | 0 (0.0%) |
| 6-Person Households | 16 (0.2%) | 0 (0.0%) |
| 7+ Person Households | 77 (1.0%) | 0 (0.0%) |
| Total | 4,767 (60.3%) | 3,145 (39.8%) |
Female Fertility in Guayama
Fertility by Age in Guayama
Average fertility rate in Guayama is 38.0 births per 1,000 women. Women in the age bracket of 35 to 50 years have the highest fertility rate with 64.0 births per 1,000 women. Women in the age bracket of 35 to 50 years acount for 68.2% of all women with births.
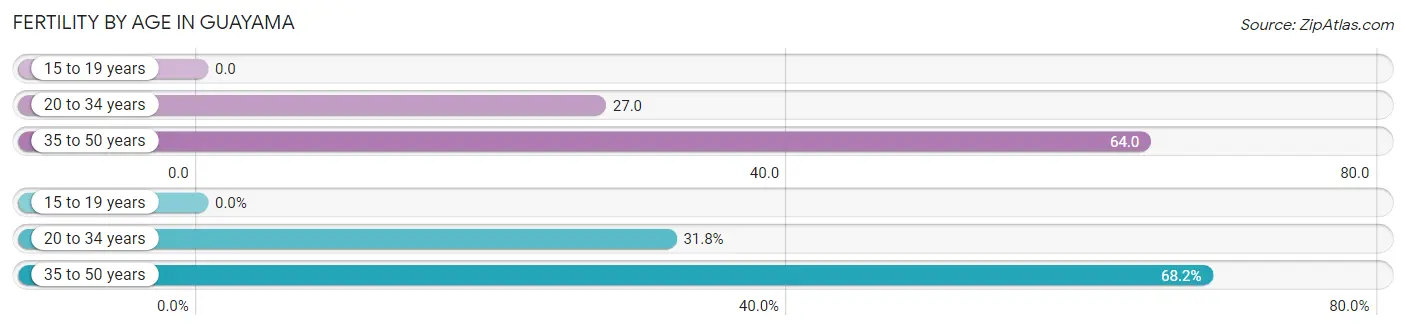
| Age Bracket | Women with Births | Births / 1,000 Women |
| 15 to 19 years | 0 (0.0%) | 0.0 |
| 20 to 34 years | 55 (31.8%) | 27.0 |
| 35 to 50 years | 118 (68.2%) | 64.0 |
| Total | 173 (100.0%) | 38.0 |
Fertility by Age by Marriage Status in Guayama
54.9% of women with births (173) in Guayama are married. The highest percentage of unmarried women with births falls into 20 to 34 years age bracket with 100.0% of them unmarried at the time of birth, while the lowest percentage of unmarried women with births belong to 35 to 50 years age bracket with 19.5% of them unmarried.
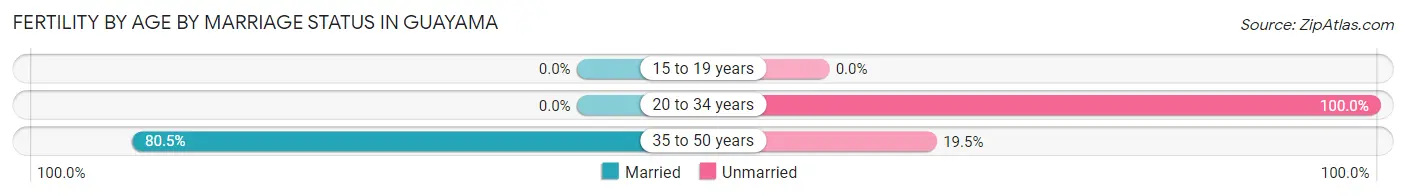
| Age Bracket | Married | Unmarried |
| 15 to 19 years | 0 (0.0%) | 0 (0.0%) |
| 20 to 34 years | 0 (0.0%) | 55 (100.0%) |
| 35 to 50 years | 95 (80.5%) | 23 (19.5%) |
| Total | 95 (54.9%) | 78 (45.1%) |
Fertility by Education in Guayama
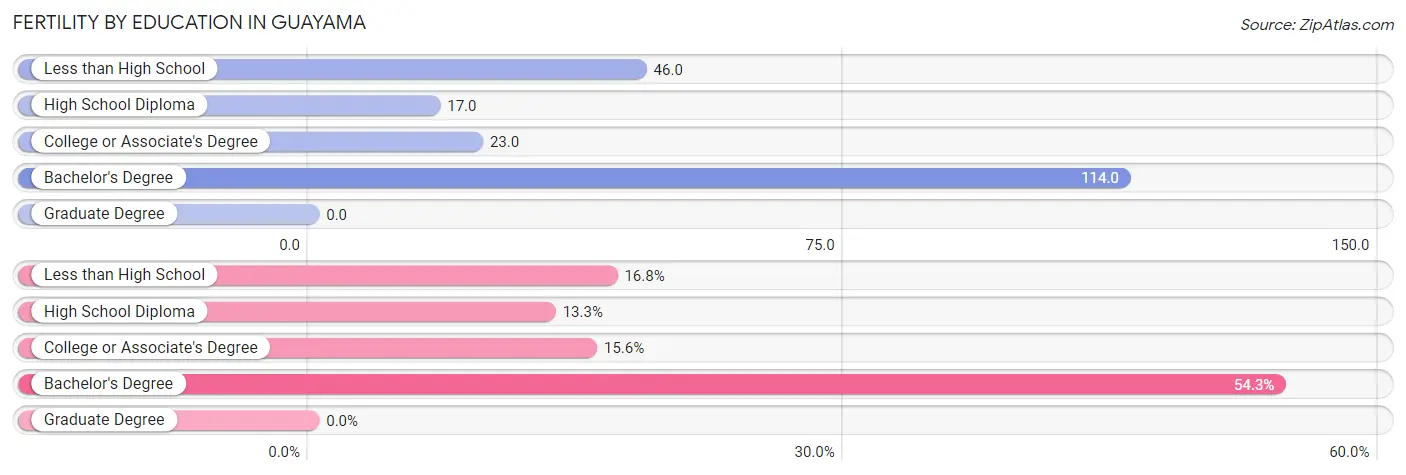
| Educational Attainment | Women with Births | Births / 1,000 Women |
| Less than High School | 29 (16.8%) | 46.0 |
| High School Diploma | 23 (13.3%) | 17.0 |
| College or Associate's Degree | 27 (15.6%) | 23.0 |
| Bachelor's Degree | 94 (54.3%) | 114.0 |
| Graduate Degree | 0 (0.0%) | 0.0 |
| Total | 173 (100.0%) | 38.0 |
Fertility by Education by Marriage Status in Guayama
45.1% of women with births in Guayama are unmarried. Women with the educational attainment of college or associate's degree are most likely to be married with 100.0% of them married at childbirth, while women with the educational attainment of less than high school are least likely to be married with 100.0% of them unmarried at childbirth.
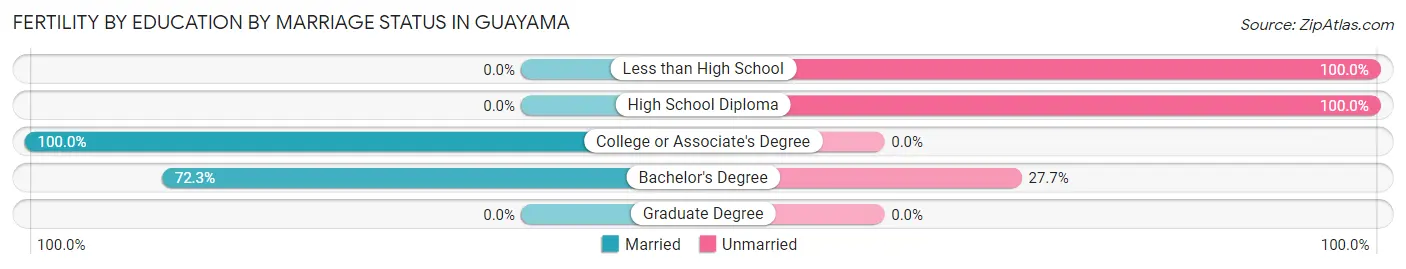
| Educational Attainment | Married | Unmarried |
| Less than High School | 0 (0.0%) | 29 (100.0%) |
| High School Diploma | 0 (0.0%) | 23 (100.0%) |
| College or Associate's Degree | 27 (100.0%) | 0 (0.0%) |
| Bachelor's Degree | 68 (72.3%) | 26 (27.7%) |
| Graduate Degree | 0 (0.0%) | 0 (0.0%) |
| Total | 95 (54.9%) | 78 (45.1%) |
Employment Characteristics in Guayama
Employment by Class of Employer in Guayama
Among the 4,771 employed individuals in Guayama, private company employees (3,438 | 72.1%), state government employees (612 | 12.8%), and self-employed (not incorporated) (223 | 4.7%) make up the most common classes of employment.
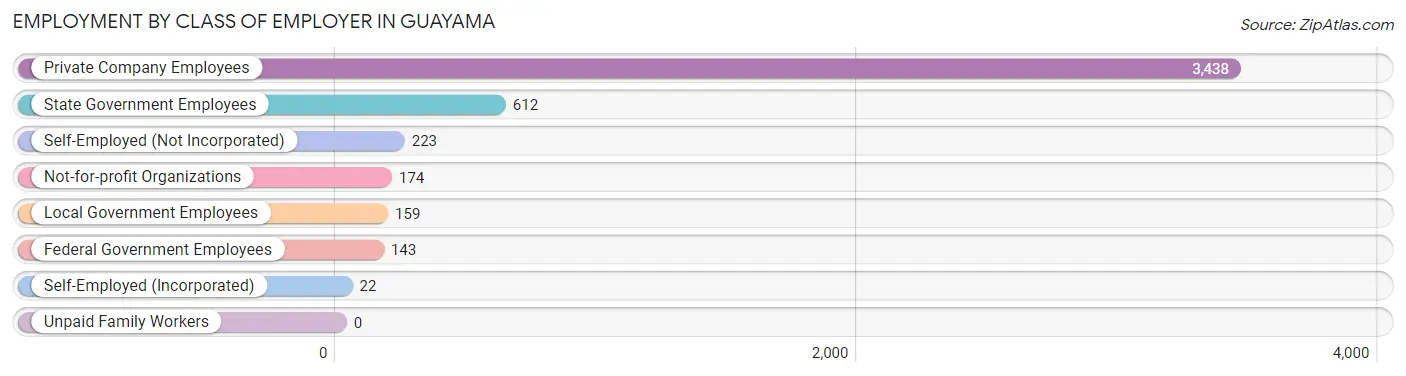
| Employer Class | # Employees | % Employees |
| Private Company Employees | 3,438 | 72.1% |
| Self-Employed (Incorporated) | 22 | 0.5% |
| Self-Employed (Not Incorporated) | 223 | 4.7% |
| Not-for-profit Organizations | 174 | 3.6% |
| Local Government Employees | 159 | 3.3% |
| State Government Employees | 612 | 12.8% |
| Federal Government Employees | 143 | 3.0% |
| Unpaid Family Workers | 0 | 0.0% |
| Total | 4,771 | 100.0% |
Employment Status by Age in Guayama
According to the labor force statistics for Guayama, out of the total population over 16 years of age (14,974), 35.6% or 5,331 individuals are in the labor force, with 7.1% or 379 of them unemployed. The age group with the highest labor force participation rate is 35 to 44 years, with 72.8% or 1,372 individuals in the labor force. Within the labor force, the 16 to 19 years age range has the highest percentage of unemployed individuals, with 22.8% or 31 of them being unemployed.
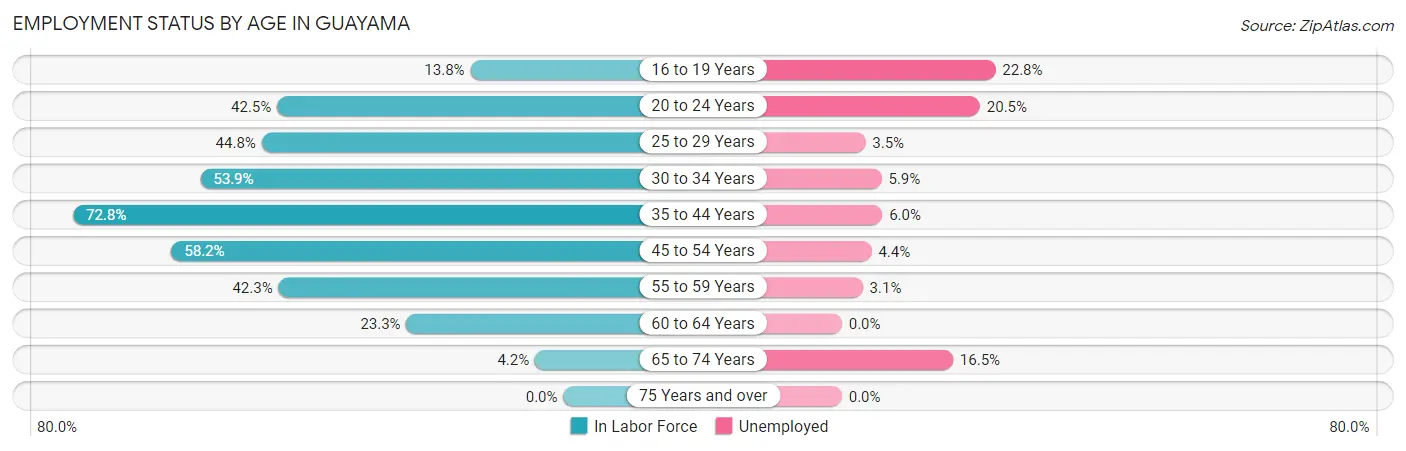
| Age Bracket | In Labor Force | Unemployed |
| 16 to 19 Years | 136 (13.8%) | 31 (22.8%) |
| 20 to 24 Years | 616 (42.5%) | 126 (20.5%) |
| 25 to 29 Years | 607 (44.8%) | 21 (3.5%) |
| 30 to 34 Years | 645 (53.9%) | 38 (5.9%) |
| 35 to 44 Years | 1,372 (72.8%) | 82 (6.0%) |
| 45 to 54 Years | 1,261 (58.2%) | 55 (4.4%) |
| 55 to 59 Years | 356 (42.3%) | 11 (3.1%) |
| 60 to 64 Years | 251 (23.3%) | 0 (0.0%) |
| 65 to 74 Years | 85 (4.2%) | 14 (16.5%) |
| 75 Years and over | 0 (0.0%) | 0 (0.0%) |
| Total | 5,331 (35.6%) | 379 (7.1%) |
Employment Status by Educational Attainment in Guayama
According to labor force statistics for Guayama, 52.7% of individuals (4,492) out of the total population between 25 and 64 years of age (8,524) are in the labor force, with 4.6% or 207 of them being unemployed. The group with the highest labor force participation rate are those with the educational attainment of bachelor's degree or higher, with 75.2% or 2,163 individuals in the labor force. Within the labor force, individuals with less than high school education have the highest percentage of unemployment, with 21.6% or 56 of them being unemployed.
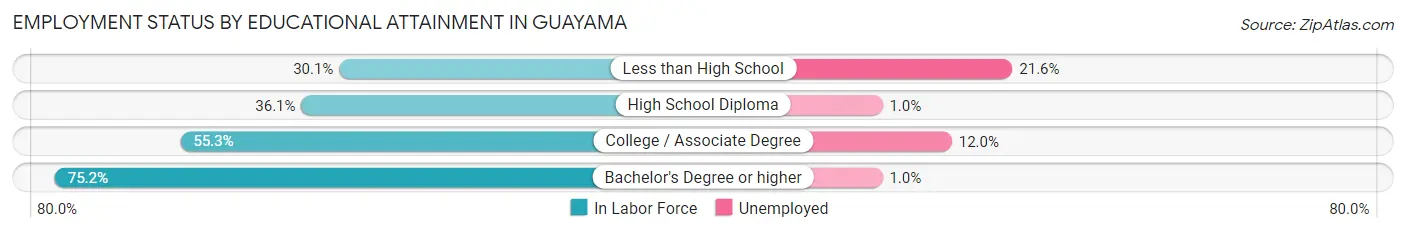
| Educational Attainment | In Labor Force | Unemployed |
| Less than High School | 259 (30.1%) | 186 (21.6%) |
| High School Diploma | 1,081 (36.1%) | 30 (1.0%) |
| College / Associate Degree | 992 (55.3%) | 215 (12.0%) |
| Bachelor's Degree or higher | 2,163 (75.2%) | 29 (1.0%) |
| Total | 4,492 (52.7%) | 392 (4.6%) |
Employment Occupations by Sex in Guayama
Management, Business, Science and Arts Occupations
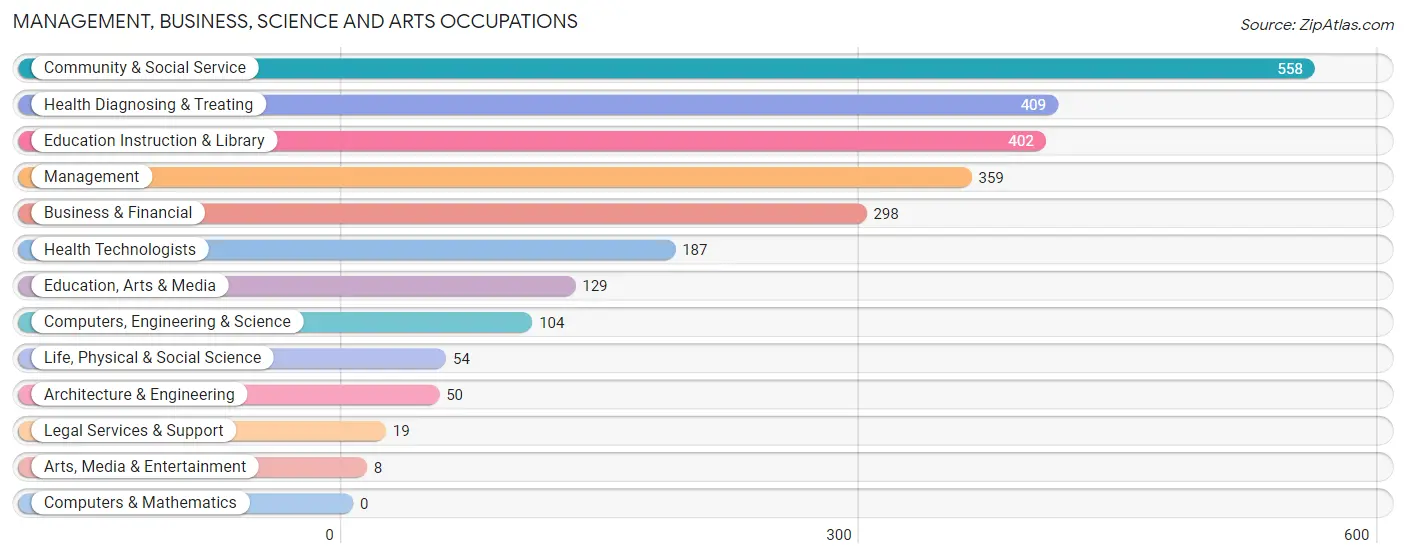
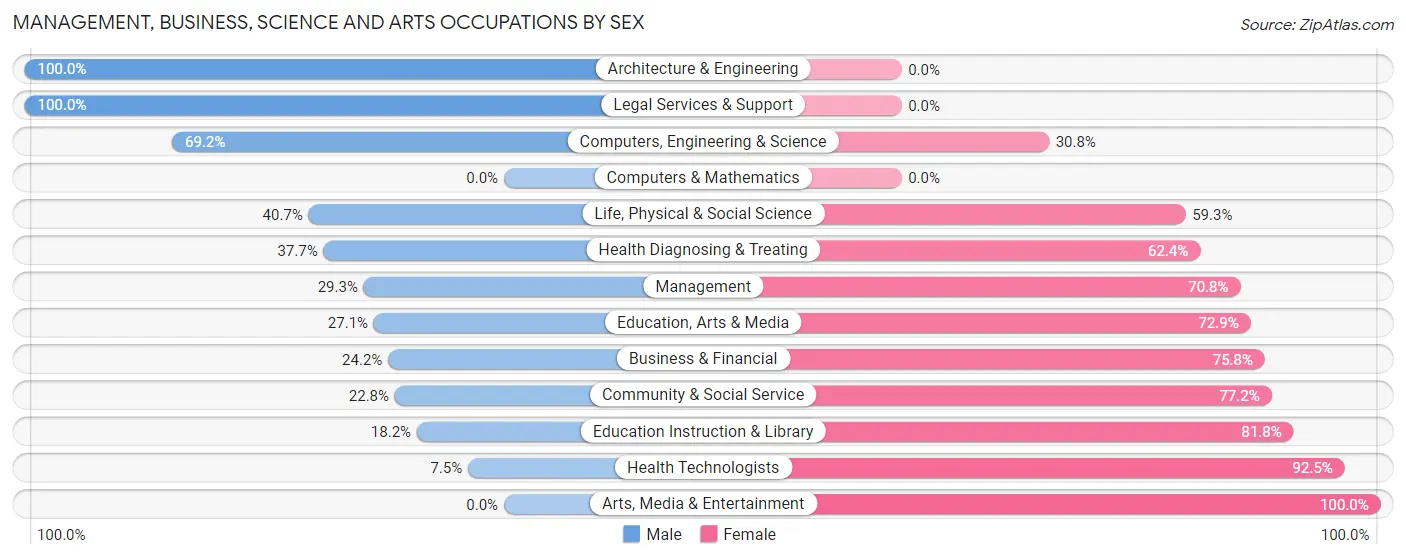
The most common Management, Business, Science and Arts occupations in Guayama are Community & Social Service (558 | 11.3%), Health Diagnosing & Treating (409 | 8.3%), Education Instruction & Library (402 | 8.1%), Management (359 | 7.2%), and Business & Financial (298 | 6.0%).
Management, Business, Science and Arts Occupations by Sex
Within the Management, Business, Science and Arts occupations in Guayama, the most male-oriented occupations are Architecture & Engineering (100.0%), Legal Services & Support (100.0%), and Computers, Engineering & Science (69.2%), while the most female-oriented occupations are Arts, Media & Entertainment (100.0%), Health Technologists (92.5%), and Education Instruction & Library (81.8%).
| Occupation | Male | Female |
| Management | 105 (29.2%) | 254 (70.8%) |
| Business & Financial | 72 (24.2%) | 226 (75.8%) |
| Computers, Engineering & Science | 72 (69.2%) | 32 (30.8%) |
| Computers & Mathematics | 0 (0.0%) | 0 (0.0%) |
| Architecture & Engineering | 50 (100.0%) | 0 (0.0%) |
| Life, Physical & Social Science | 22 (40.7%) | 32 (59.3%) |
| Community & Social Service | 127 (22.8%) | 431 (77.2%) |
| Education, Arts & Media | 35 (27.1%) | 94 (72.9%) |
| Legal Services & Support | 19 (100.0%) | 0 (0.0%) |
| Education Instruction & Library | 73 (18.2%) | 329 (81.8%) |
| Arts, Media & Entertainment | 0 (0.0%) | 8 (100.0%) |
| Health Diagnosing & Treating | 154 (37.7%) | 255 (62.4%) |
| Health Technologists | 14 (7.5%) | 173 (92.5%) |
| Total (Category) | 530 (30.7%) | 1,198 (69.3%) |
| Total (Overall) | 2,345 (47.3%) | 2,608 (52.6%) |
Services Occupations
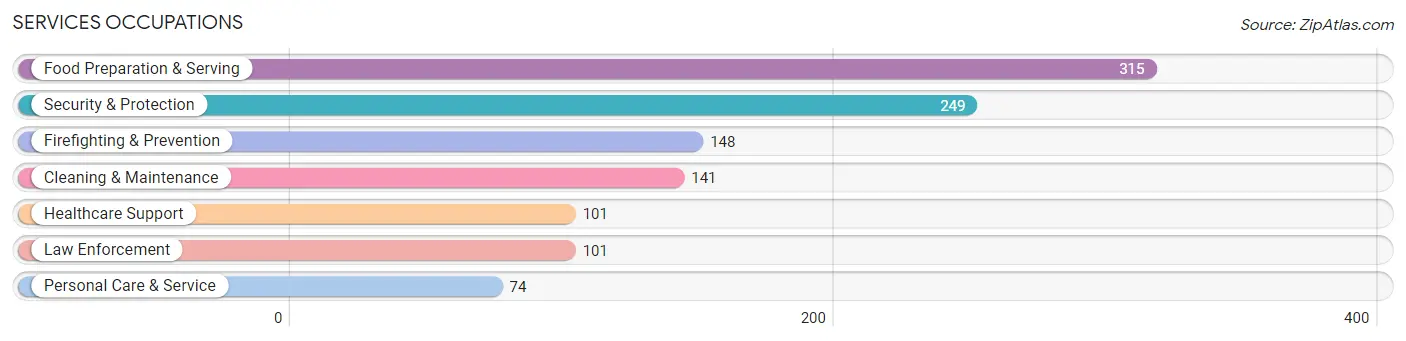
The most common Services occupations in Guayama are Food Preparation & Serving (315 | 6.4%), Security & Protection (249 | 5.0%), Firefighting & Prevention (148 | 3.0%), Cleaning & Maintenance (141 | 2.9%), and Healthcare Support (101 | 2.0%).
Services Occupations by Sex
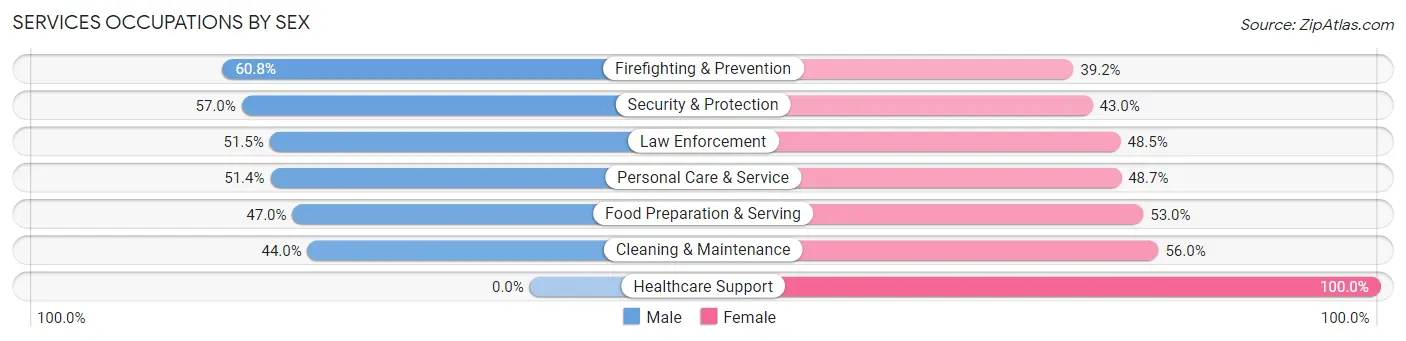
Within the Services occupations in Guayama, the most male-oriented occupations are Firefighting & Prevention (60.8%), Security & Protection (57.0%), and Law Enforcement (51.5%), while the most female-oriented occupations are Healthcare Support (100.0%), Cleaning & Maintenance (56.0%), and Food Preparation & Serving (53.0%).
| Occupation | Male | Female |
| Healthcare Support | 0 (0.0%) | 101 (100.0%) |
| Security & Protection | 142 (57.0%) | 107 (43.0%) |
| Firefighting & Prevention | 90 (60.8%) | 58 (39.2%) |
| Law Enforcement | 52 (51.5%) | 49 (48.5%) |
| Food Preparation & Serving | 148 (47.0%) | 167 (53.0%) |
| Cleaning & Maintenance | 62 (44.0%) | 79 (56.0%) |
| Personal Care & Service | 38 (51.3%) | 36 (48.6%) |
| Total (Category) | 390 (44.3%) | 490 (55.7%) |
| Total (Overall) | 2,345 (47.3%) | 2,608 (52.6%) |
Sales and Office Occupations
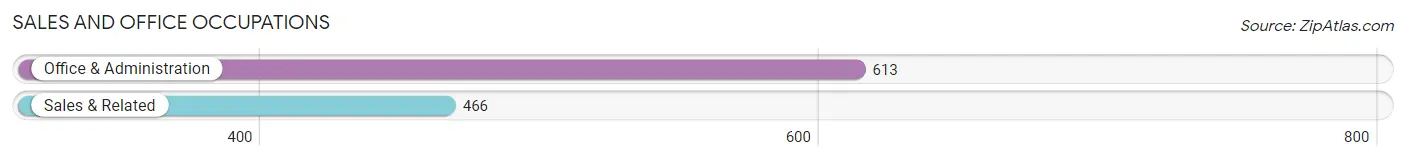
The most common Sales and Office occupations in Guayama are Office & Administration (613 | 12.4%), and Sales & Related (466 | 9.4%).
Sales and Office Occupations by Sex
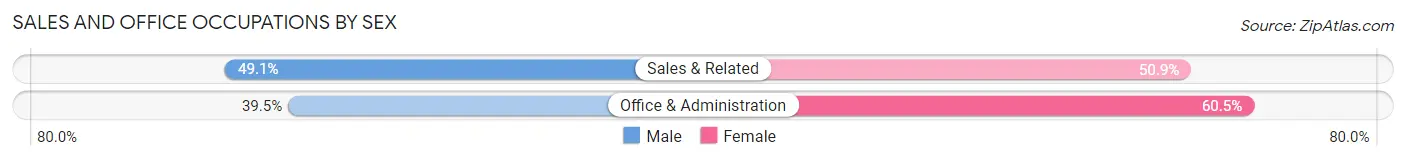
| Occupation | Male | Female |
| Sales & Related | 229 (49.1%) | 237 (50.9%) |
| Office & Administration | 242 (39.5%) | 371 (60.5%) |
| Total (Category) | 471 (43.6%) | 608 (56.4%) |
| Total (Overall) | 2,345 (47.3%) | 2,608 (52.6%) |
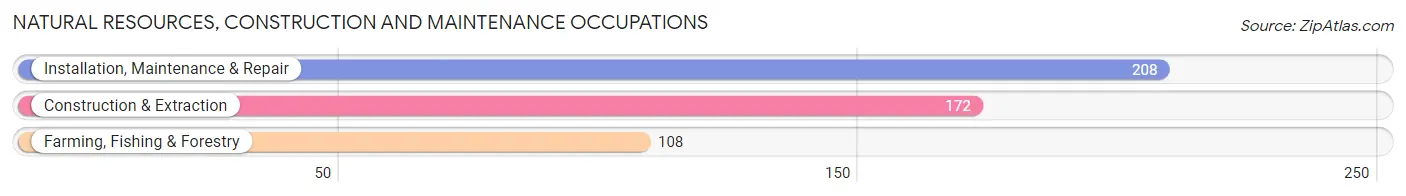
Natural Resources, Construction and Maintenance Occupations
The most common Natural Resources, Construction and Maintenance occupations in Guayama are Installation, Maintenance & Repair (208 | 4.2%), Construction & Extraction (172 | 3.5%), and Farming, Fishing & Forestry (108 | 2.2%).
Natural Resources, Construction and Maintenance Occupations by Sex
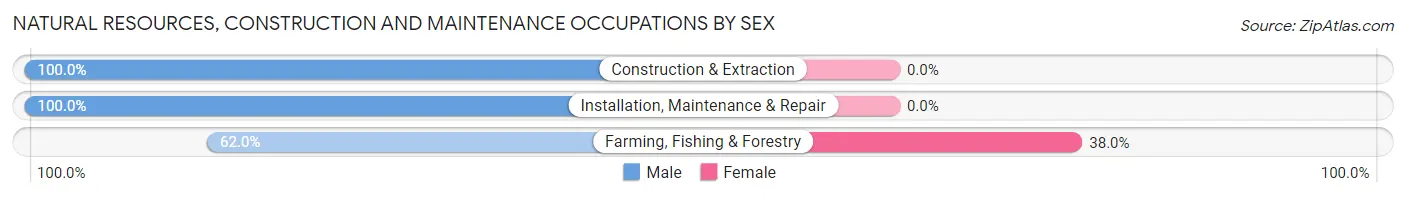
| Occupation | Male | Female |
| Farming, Fishing & Forestry | 67 (62.0%) | 41 (38.0%) |
| Construction & Extraction | 172 (100.0%) | 0 (0.0%) |
| Installation, Maintenance & Repair | 208 (100.0%) | 0 (0.0%) |
| Total (Category) | 447 (91.6%) | 41 (8.4%) |
| Total (Overall) | 2,345 (47.3%) | 2,608 (52.6%) |
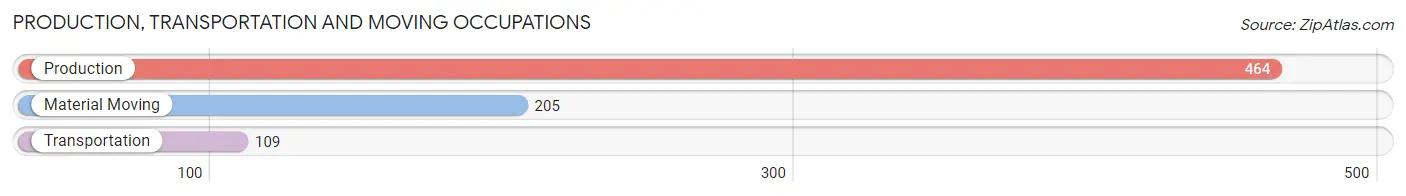
Production, Transportation and Moving Occupations
The most common Production, Transportation and Moving occupations in Guayama are Production (464 | 9.4%), Material Moving (205 | 4.1%), and Transportation (109 | 2.2%).
Production, Transportation and Moving Occupations by Sex
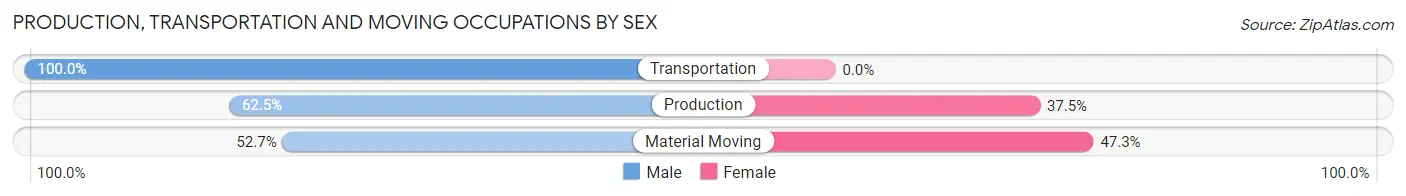
| Occupation | Male | Female |
| Production | 290 (62.5%) | 174 (37.5%) |
| Transportation | 109 (100.0%) | 0 (0.0%) |
| Material Moving | 108 (52.7%) | 97 (47.3%) |
| Total (Category) | 507 (65.2%) | 271 (34.8%) |
| Total (Overall) | 2,345 (47.3%) | 2,608 (52.6%) |
Employment Industries by Sex in Guayama
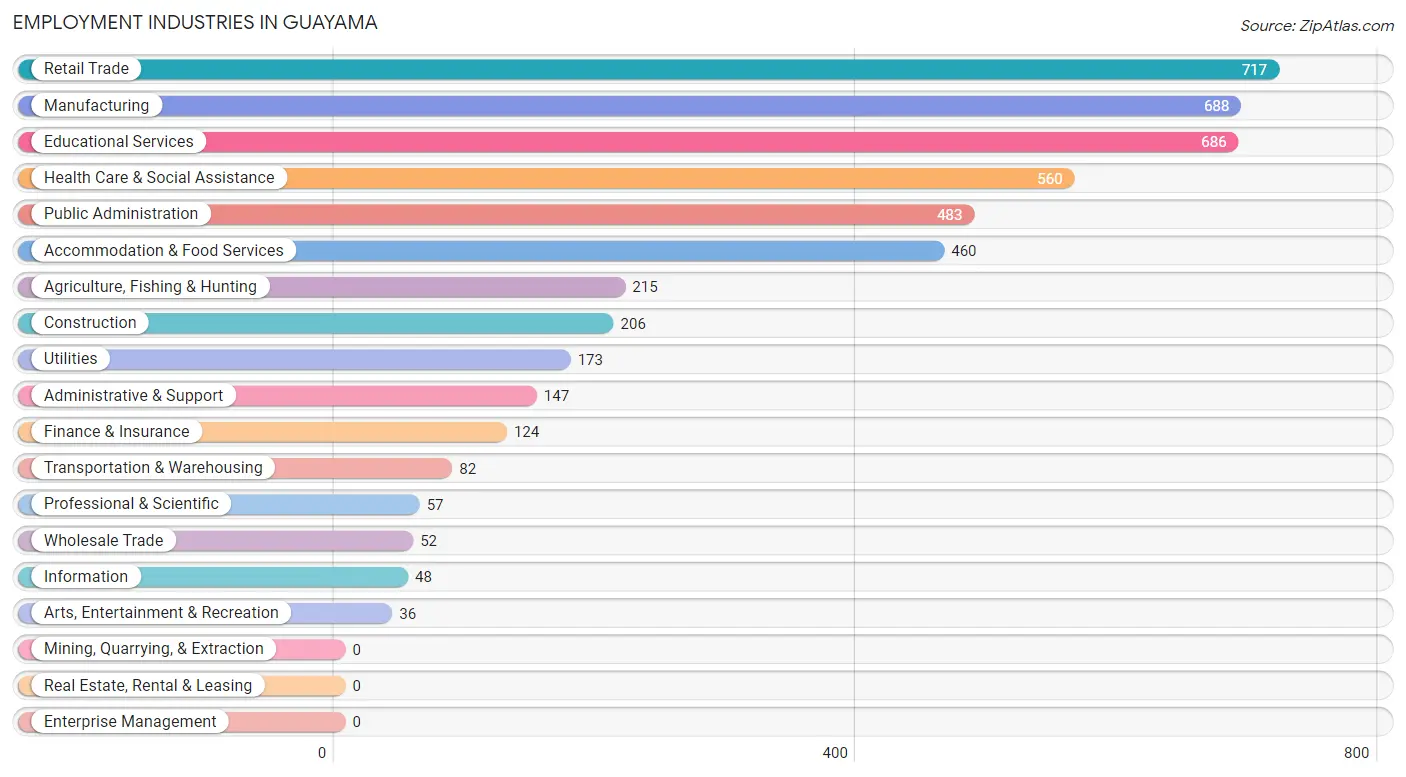
Employment Industries in Guayama
The major employment industries in Guayama include Retail Trade (717 | 14.5%), Manufacturing (688 | 13.9%), Educational Services (686 | 13.9%), Health Care & Social Assistance (560 | 11.3%), and Public Administration (483 | 9.8%).
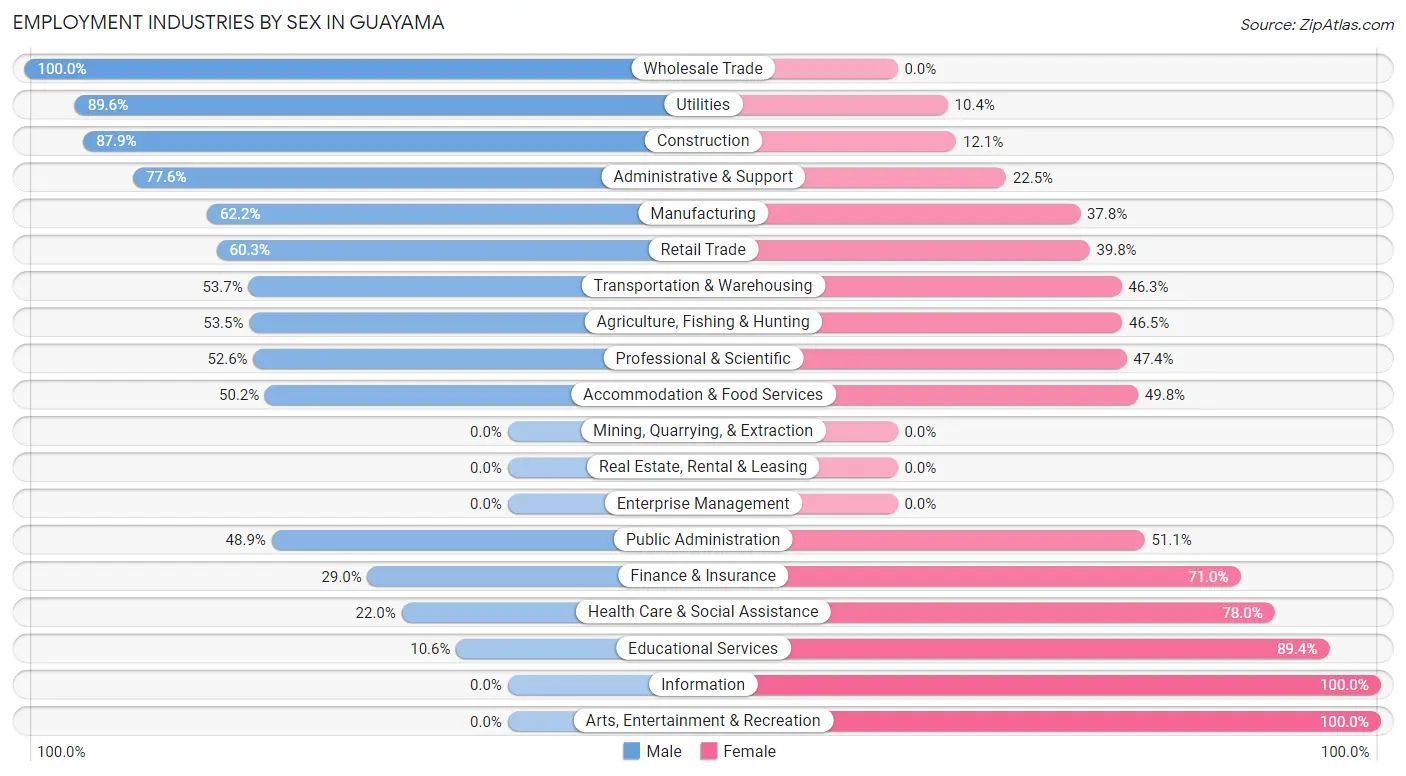
Employment Industries by Sex in Guayama
The Guayama industries that see more men than women are Wholesale Trade (100.0%), Utilities (89.6%), and Construction (87.9%), whereas the industries that tend to have a higher number of women are Information (100.0%), Arts, Entertainment & Recreation (100.0%), and Educational Services (89.4%).
| Industry | Male | Female |
| Agriculture, Fishing & Hunting | 115 (53.5%) | 100 (46.5%) |
| Mining, Quarrying, & Extraction | 0 (0.0%) | 0 (0.0%) |
| Construction | 181 (87.9%) | 25 (12.1%) |
| Manufacturing | 428 (62.2%) | 260 (37.8%) |
| Wholesale Trade | 52 (100.0%) | 0 (0.0%) |
| Retail Trade | 432 (60.3%) | 285 (39.8%) |
| Transportation & Warehousing | 44 (53.7%) | 38 (46.3%) |
| Utilities | 155 (89.6%) | 18 (10.4%) |
| Information | 0 (0.0%) | 48 (100.0%) |
| Finance & Insurance | 36 (29.0%) | 88 (71.0%) |
| Real Estate, Rental & Leasing | 0 (0.0%) | 0 (0.0%) |
| Professional & Scientific | 30 (52.6%) | 27 (47.4%) |
| Enterprise Management | 0 (0.0%) | 0 (0.0%) |
| Administrative & Support | 114 (77.5%) | 33 (22.5%) |
| Educational Services | 73 (10.6%) | 613 (89.4%) |
| Health Care & Social Assistance | 123 (22.0%) | 437 (78.0%) |
| Arts, Entertainment & Recreation | 0 (0.0%) | 36 (100.0%) |
| Accommodation & Food Services | 231 (50.2%) | 229 (49.8%) |
| Public Administration | 236 (48.9%) | 247 (51.1%) |
| Total | 2,345 (47.3%) | 2,608 (52.6%) |
Education in Guayama
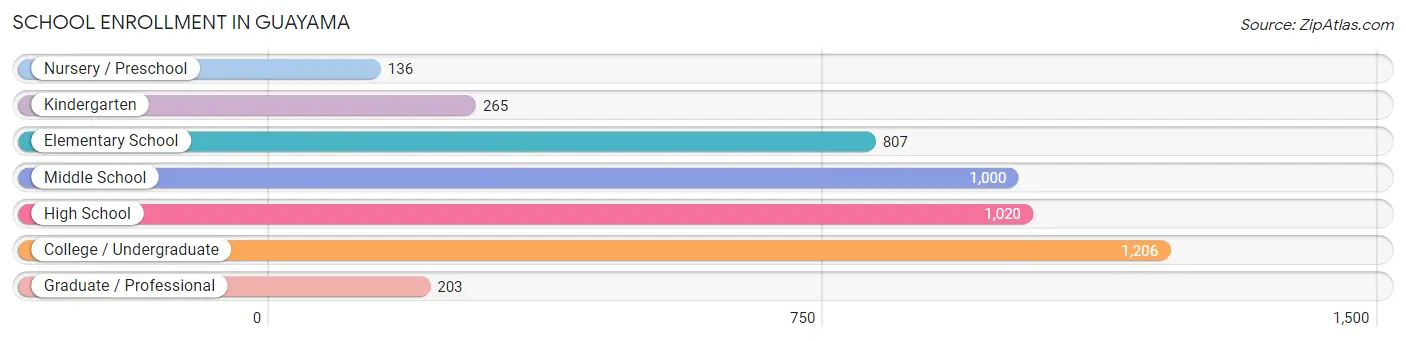
School Enrollment in Guayama
The most common levels of schooling among the 4,637 students in Guayama are college / undergraduate (1,206 | 26.0%), high school (1,020 | 22.0%), and middle school (1,000 | 21.6%).
| School Level | # Students | % Students |
| Nursery / Preschool | 136 | 2.9% |
| Kindergarten | 265 | 5.7% |
| Elementary School | 807 | 17.4% |
| Middle School | 1,000 | 21.6% |
| High School | 1,020 | 22.0% |
| College / Undergraduate | 1,206 | 26.0% |
| Graduate / Professional | 203 | 4.4% |
| Total | 4,637 | 100.0% |
School Enrollment by Age by Funding Source in Guayama
Out of a total of 4,637 students who are enrolled in schools in Guayama, 241 (5.2%) attend a private institution, while the remaining 4,396 (94.8%) are enrolled in public schools. The age group of 20 to 24 year olds has the highest likelihood of being enrolled in private schools, with 146 (19.8% in the age bracket) enrolled. Conversely, the age group of 3 to 4 year olds has the lowest likelihood of being enrolled in a private school, with 136 (100.0% in the age bracket) attending a public institution.
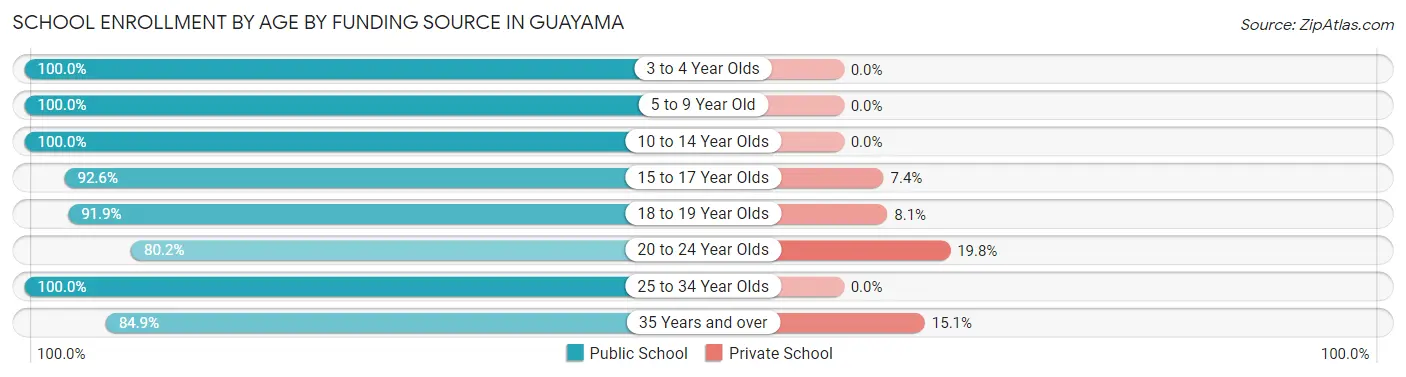
| Age Bracket | Public School | Private School |
| 3 to 4 Year Olds | 136 (100.0%) | 0 (0.0%) |
| 5 to 9 Year Old | 968 (100.0%) | 0 (0.0%) |
| 10 to 14 Year Olds | 1,320 (100.0%) | 0 (0.0%) |
| 15 to 17 Year Olds | 659 (92.6%) | 53 (7.4%) |
| 18 to 19 Year Olds | 339 (91.9%) | 30 (8.1%) |
| 20 to 24 Year Olds | 590 (80.2%) | 146 (19.8%) |
| 25 to 34 Year Olds | 310 (100.0%) | 0 (0.0%) |
| 35 Years and over | 73 (84.9%) | 13 (15.1%) |
| Total | 4,396 (94.8%) | 241 (5.2%) |
Educational Attainment by Field of Study in Guayama
Business (1,080 | 26.6%), education (973 | 24.0%), science & technology (499 | 12.3%), arts & humanities (344 | 8.5%), and physical & health sciences (299 | 7.4%) are the most common fields of study among 4,058 individuals in Guayama who have obtained a bachelor's degree or higher.
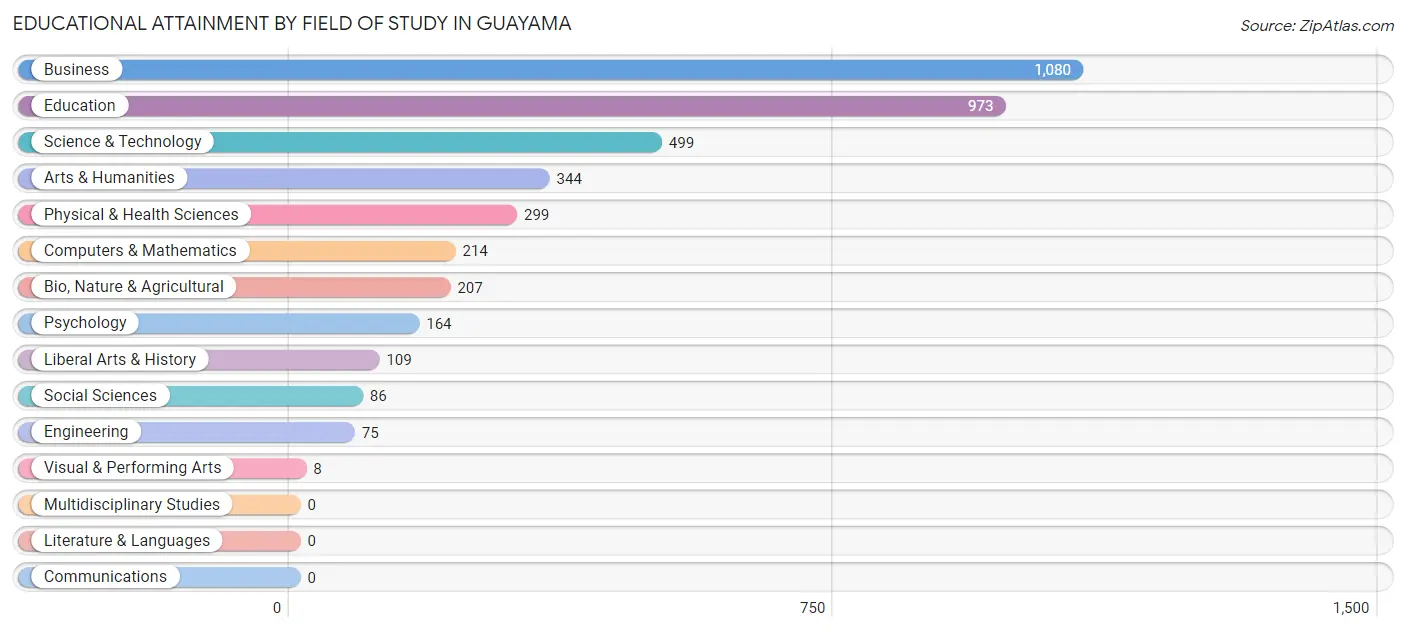
| Field of Study | # Graduates | % Graduates |
| Computers & Mathematics | 214 | 5.3% |
| Bio, Nature & Agricultural | 207 | 5.1% |
| Physical & Health Sciences | 299 | 7.4% |
| Psychology | 164 | 4.0% |
| Social Sciences | 86 | 2.1% |
| Engineering | 75 | 1.8% |
| Multidisciplinary Studies | 0 | 0.0% |
| Science & Technology | 499 | 12.3% |
| Business | 1,080 | 26.6% |
| Education | 973 | 24.0% |
| Literature & Languages | 0 | 0.0% |
| Liberal Arts & History | 109 | 2.7% |
| Visual & Performing Arts | 8 | 0.2% |
| Communications | 0 | 0.0% |
| Arts & Humanities | 344 | 8.5% |
| Total | 4,058 | 100.0% |
Transportation & Commute in Guayama
Vehicle Availability by Sex in Guayama
The most prevalent vehicle ownership categories in Guayama are males with 2 vehicles (1,141, accounting for 51.7%) and females with 2 vehicles (1,197, making up 44.6%).
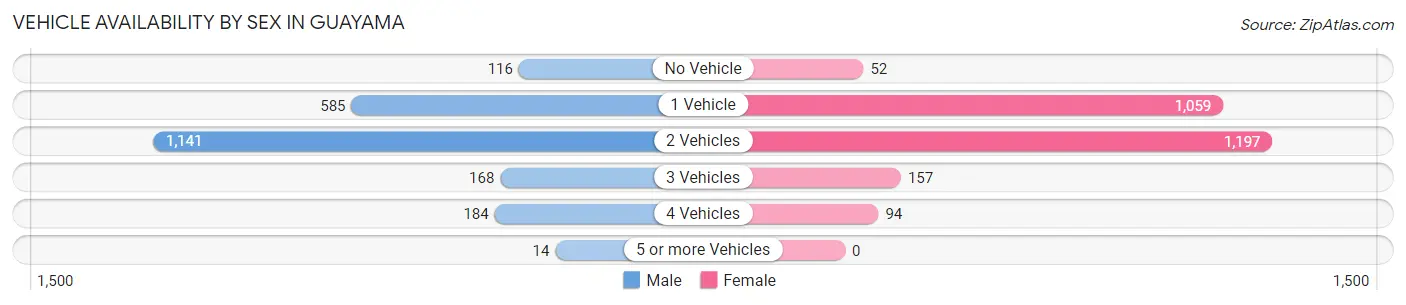
| Vehicles Available | Male | Female |
| No Vehicle | 116 (5.2%) | 52 (2.0%) |
| 1 Vehicle | 585 (26.5%) | 1,059 (41.4%) |
| 2 Vehicles | 1,141 (51.7%) | 1,197 (46.8%) |
| 3 Vehicles | 168 (7.6%) | 157 (6.1%) |
| 4 Vehicles | 184 (8.3%) | 94 (3.7%) |
| 5 or more Vehicles | 14 (0.6%) | 0 (0.0%) |
| Total | 2,208 (100.0%) | 2,559 (100.0%) |
Commute Time in Guayama
The most frequently occuring commute durations in Guayama are 20 to 24 minutes (1,533 commuters, 33.1%), 10 to 14 minutes (751 commuters, 16.2%), and 15 to 19 minutes (734 commuters, 15.8%).
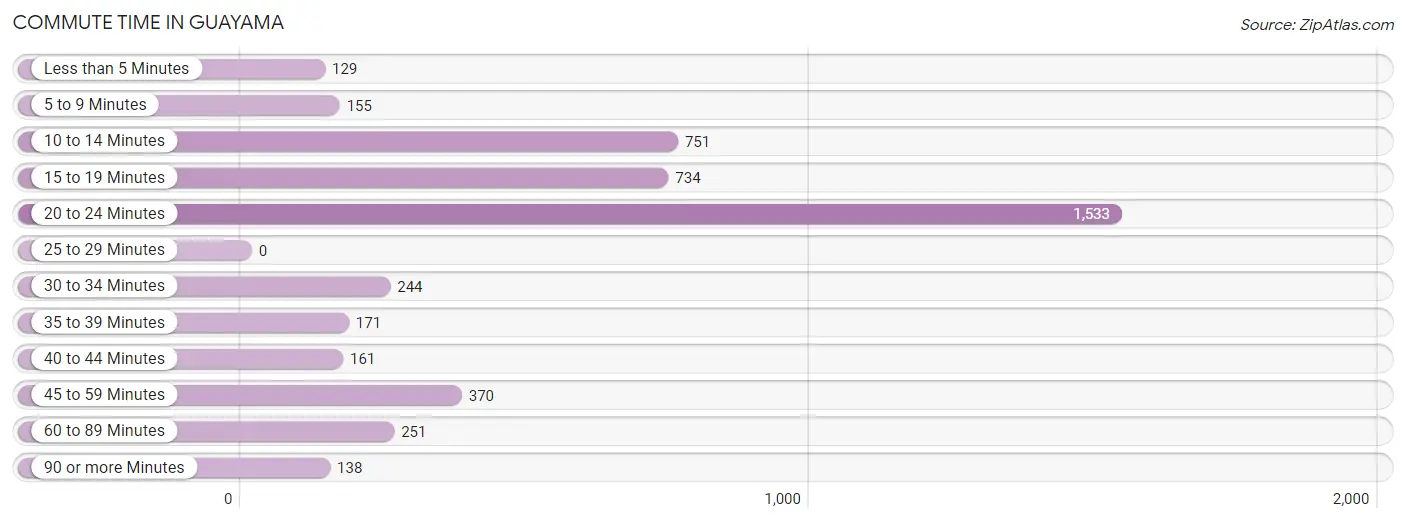
| Commute Time | # Commuters | % Commuters |
| Less than 5 Minutes | 129 | 2.8% |
| 5 to 9 Minutes | 155 | 3.3% |
| 10 to 14 Minutes | 751 | 16.2% |
| 15 to 19 Minutes | 734 | 15.8% |
| 20 to 24 Minutes | 1,533 | 33.1% |
| 25 to 29 Minutes | 0 | 0.0% |
| 30 to 34 Minutes | 244 | 5.3% |
| 35 to 39 Minutes | 171 | 3.7% |
| 40 to 44 Minutes | 161 | 3.5% |
| 45 to 59 Minutes | 370 | 8.0% |
| 60 to 89 Minutes | 251 | 5.4% |
| 90 or more Minutes | 138 | 3.0% |
Commute Time by Sex in Guayama
The most common commute times in Guayama are 20 to 24 minutes (833 commuters, 39.2%) for males and 20 to 24 minutes (700 commuters, 27.8%) for females.
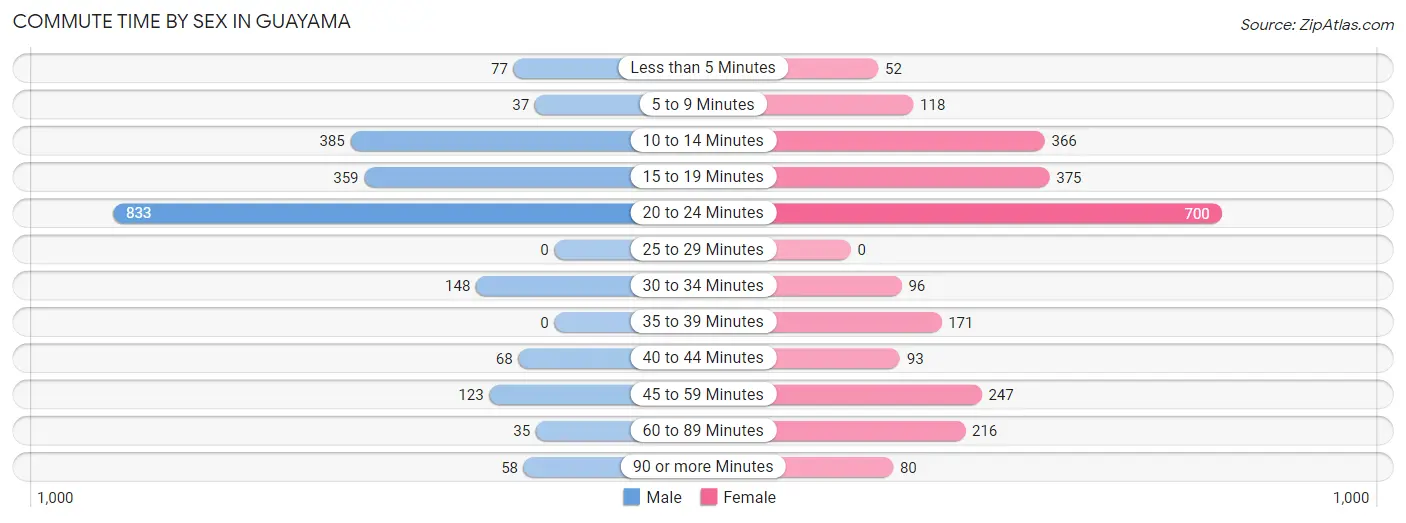
| Commute Time | Male | Female |
| Less than 5 Minutes | 77 (3.6%) | 52 (2.1%) |
| 5 to 9 Minutes | 37 (1.7%) | 118 (4.7%) |
| 10 to 14 Minutes | 385 (18.1%) | 366 (14.6%) |
| 15 to 19 Minutes | 359 (16.9%) | 375 (14.9%) |
| 20 to 24 Minutes | 833 (39.2%) | 700 (27.8%) |
| 25 to 29 Minutes | 0 (0.0%) | 0 (0.0%) |
| 30 to 34 Minutes | 148 (7.0%) | 96 (3.8%) |
| 35 to 39 Minutes | 0 (0.0%) | 171 (6.8%) |
| 40 to 44 Minutes | 68 (3.2%) | 93 (3.7%) |
| 45 to 59 Minutes | 123 (5.8%) | 247 (9.8%) |
| 60 to 89 Minutes | 35 (1.7%) | 216 (8.6%) |
| 90 or more Minutes | 58 (2.7%) | 80 (3.2%) |
Time of Departure to Work by Sex in Guayama
The most frequent times of departure to work in Guayama are 6:00 AM to 6:29 AM (408, 19.2%) for males and 12:00 AM to 4:59 AM (439, 17.5%) for females.
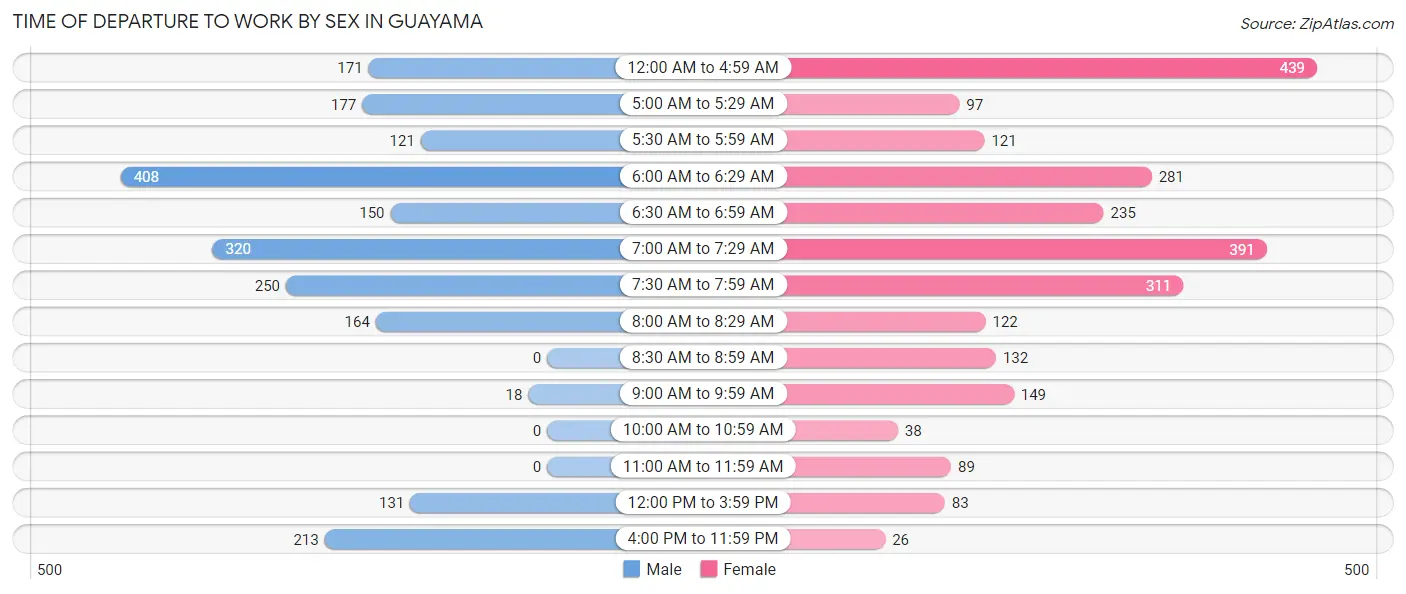
| Time of Departure | Male | Female |
| 12:00 AM to 4:59 AM | 171 (8.1%) | 439 (17.5%) |
| 5:00 AM to 5:29 AM | 177 (8.3%) | 97 (3.9%) |
| 5:30 AM to 5:59 AM | 121 (5.7%) | 121 (4.8%) |
| 6:00 AM to 6:29 AM | 408 (19.2%) | 281 (11.2%) |
| 6:30 AM to 6:59 AM | 150 (7.1%) | 235 (9.3%) |
| 7:00 AM to 7:29 AM | 320 (15.1%) | 391 (15.5%) |
| 7:30 AM to 7:59 AM | 250 (11.8%) | 311 (12.4%) |
| 8:00 AM to 8:29 AM | 164 (7.7%) | 122 (4.9%) |
| 8:30 AM to 8:59 AM | 0 (0.0%) | 132 (5.2%) |
| 9:00 AM to 9:59 AM | 18 (0.9%) | 149 (5.9%) |
| 10:00 AM to 10:59 AM | 0 (0.0%) | 38 (1.5%) |
| 11:00 AM to 11:59 AM | 0 (0.0%) | 89 (3.5%) |
| 12:00 PM to 3:59 PM | 131 (6.2%) | 83 (3.3%) |
| 4:00 PM to 11:59 PM | 213 (10.0%) | 26 (1.0%) |
| Total | 2,123 (100.0%) | 2,514 (100.0%) |
Housing Occupancy in Guayama
Occupancy by Ownership in Guayama
Of the total 7,912 dwellings in Guayama, owner-occupied units account for 4,877 (61.6%), while renter-occupied units make up 3,035 (38.4%).
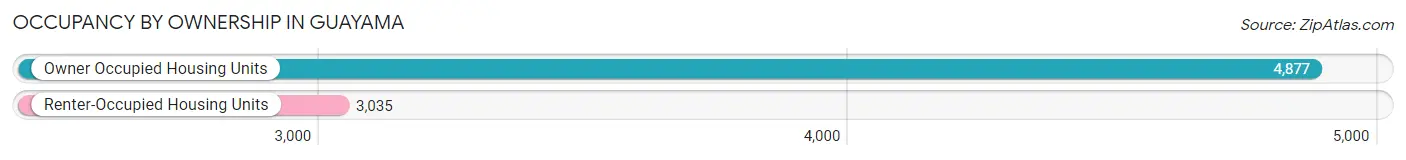
| Occupancy | # Housing Units | % Housing Units |
| Owner Occupied Housing Units | 4,877 | 61.6% |
| Renter-Occupied Housing Units | 3,035 | 38.4% |
| Total Occupied Housing Units | 7,912 | 100.0% |
Occupancy by Household Size in Guayama
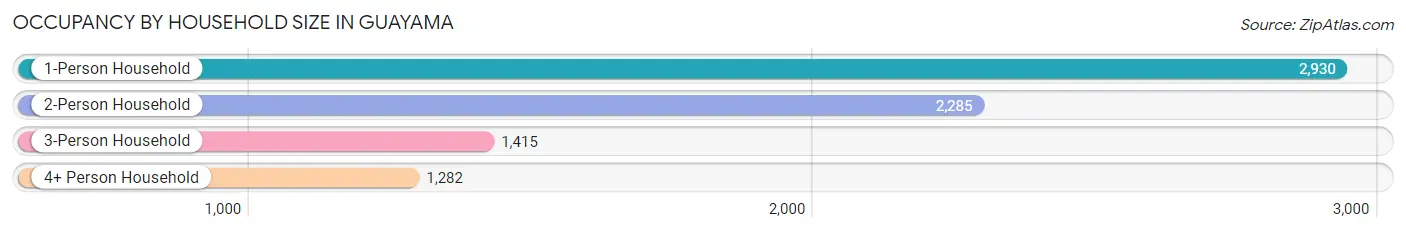
| Household Size | # Housing Units | % Housing Units |
| 1-Person Household | 2,930 | 37.0% |
| 2-Person Household | 2,285 | 28.9% |
| 3-Person Household | 1,415 | 17.9% |
| 4+ Person Household | 1,282 | 16.2% |
| Total Housing Units | 7,912 | 100.0% |
Occupancy by Ownership by Household Size in Guayama
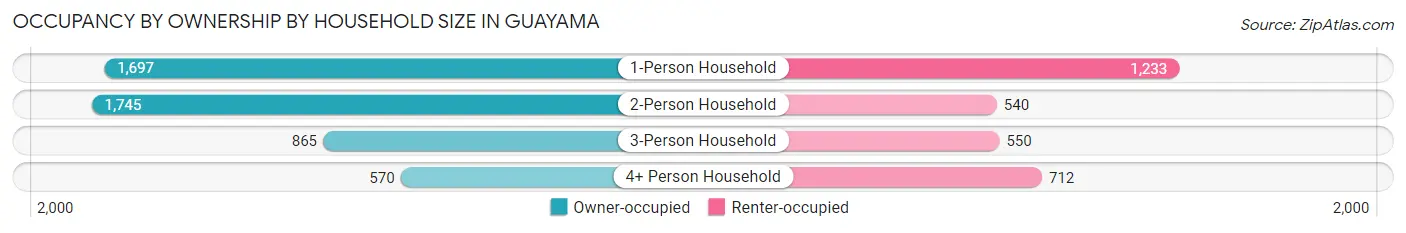
| Household Size | Owner-occupied | Renter-occupied |
| 1-Person Household | 1,697 (57.9%) | 1,233 (42.1%) |
| 2-Person Household | 1,745 (76.4%) | 540 (23.6%) |
| 3-Person Household | 865 (61.1%) | 550 (38.9%) |
| 4+ Person Household | 570 (44.5%) | 712 (55.5%) |
| Total Housing Units | 4,877 (61.6%) | 3,035 (38.4%) |
Occupancy by Educational Attainment in Guayama
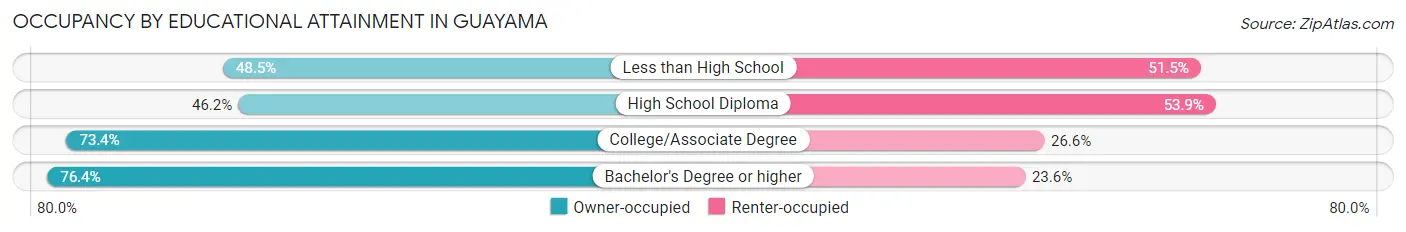
| Household Size | Owner-occupied | Renter-occupied |
| Less than High School | 599 (48.5%) | 635 (51.5%) |
| High School Diploma | 1,186 (46.2%) | 1,384 (53.8%) |
| College/Associate Degree | 1,124 (73.4%) | 408 (26.6%) |
| Bachelor's Degree or higher | 1,968 (76.4%) | 608 (23.6%) |
Occupancy by Age of Householder in Guayama
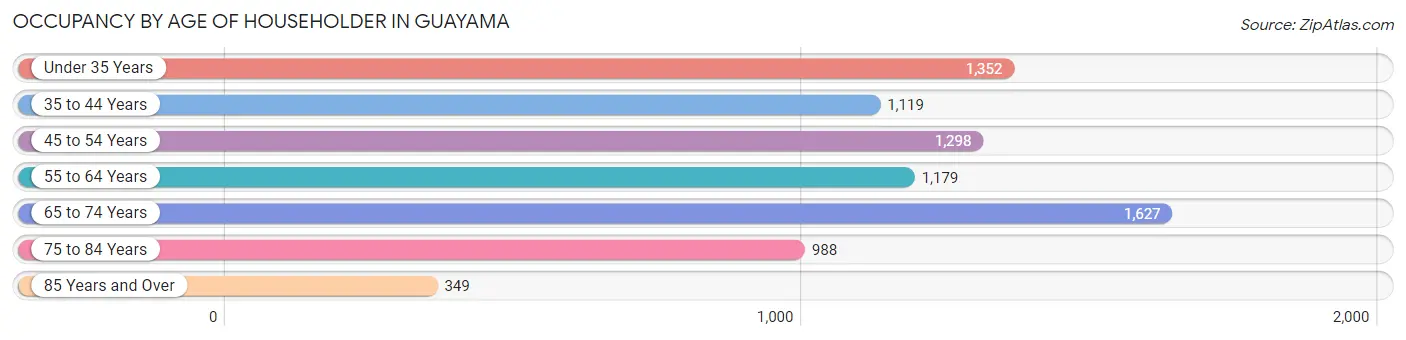
| Age Bracket | # Households | % Households |
| Under 35 Years | 1,352 | 17.1% |
| 35 to 44 Years | 1,119 | 14.1% |
| 45 to 54 Years | 1,298 | 16.4% |
| 55 to 64 Years | 1,179 | 14.9% |
| 65 to 74 Years | 1,627 | 20.6% |
| 75 to 84 Years | 988 | 12.5% |
| 85 Years and Over | 349 | 4.4% |
| Total | 7,912 | 100.0% |
Housing Finances in Guayama
Median Income by Occupancy in Guayama
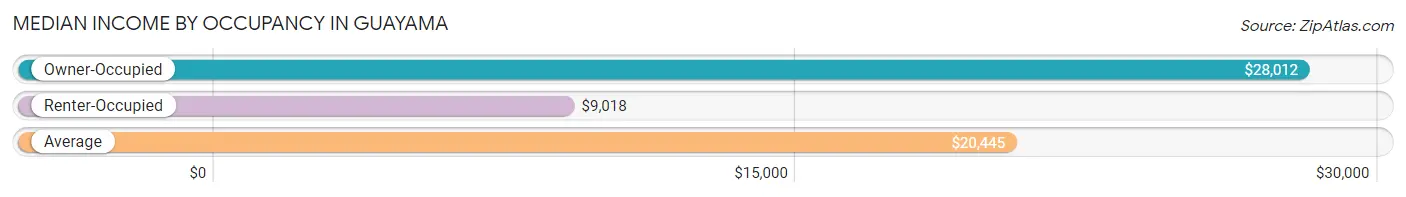
| Occupancy Type | # Households | Median Income |
| Owner-Occupied | 4,877 (61.6%) | $28,012 |
| Renter-Occupied | 3,035 (38.4%) | $9,018 |
| Average | 7,912 (100.0%) | $20,445 |
Occupancy by Householder Income Bracket in Guayama
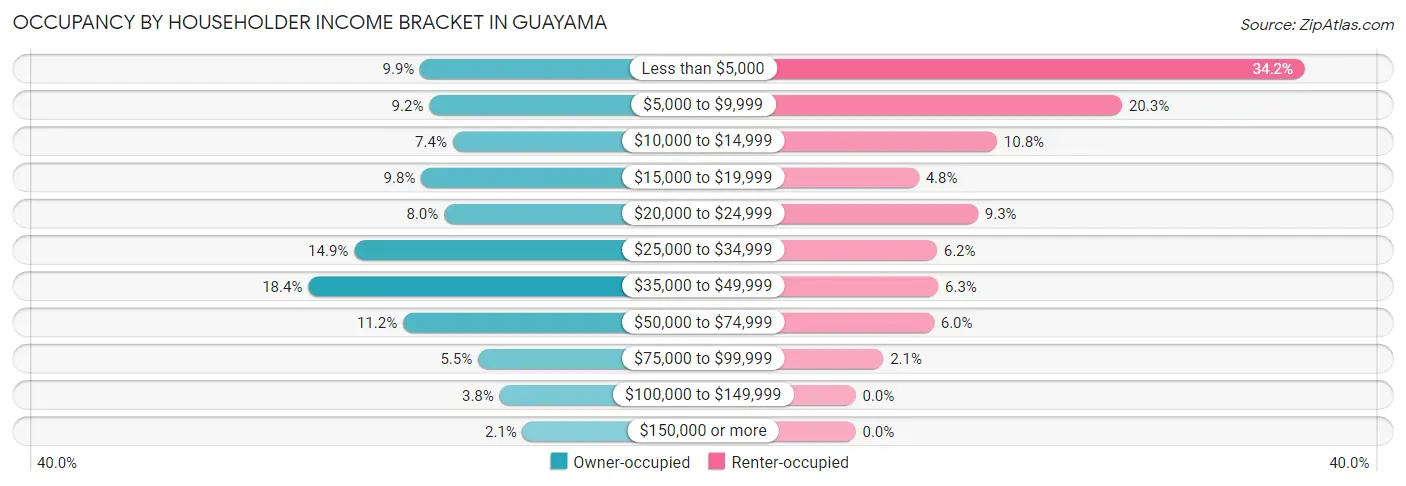
| Income Bracket | Owner-occupied | Renter-occupied |
| Less than $5,000 | 481 (9.9%) | 1,039 (34.2%) |
| $5,000 to $9,999 | 447 (9.2%) | 616 (20.3%) |
| $10,000 to $14,999 | 360 (7.4%) | 327 (10.8%) |
| $15,000 to $19,999 | 477 (9.8%) | 146 (4.8%) |
| $20,000 to $24,999 | 392 (8.0%) | 283 (9.3%) |
| $25,000 to $34,999 | 726 (14.9%) | 188 (6.2%) |
| $35,000 to $49,999 | 897 (18.4%) | 191 (6.3%) |
| $50,000 to $74,999 | 545 (11.2%) | 181 (6.0%) |
| $75,000 to $99,999 | 266 (5.4%) | 64 (2.1%) |
| $100,000 to $149,999 | 186 (3.8%) | 0 (0.0%) |
| $150,000 or more | 100 (2.1%) | 0 (0.0%) |
| Total | 4,877 (100.0%) | 3,035 (100.0%) |
Monthly Housing Cost Tiers in Guayama
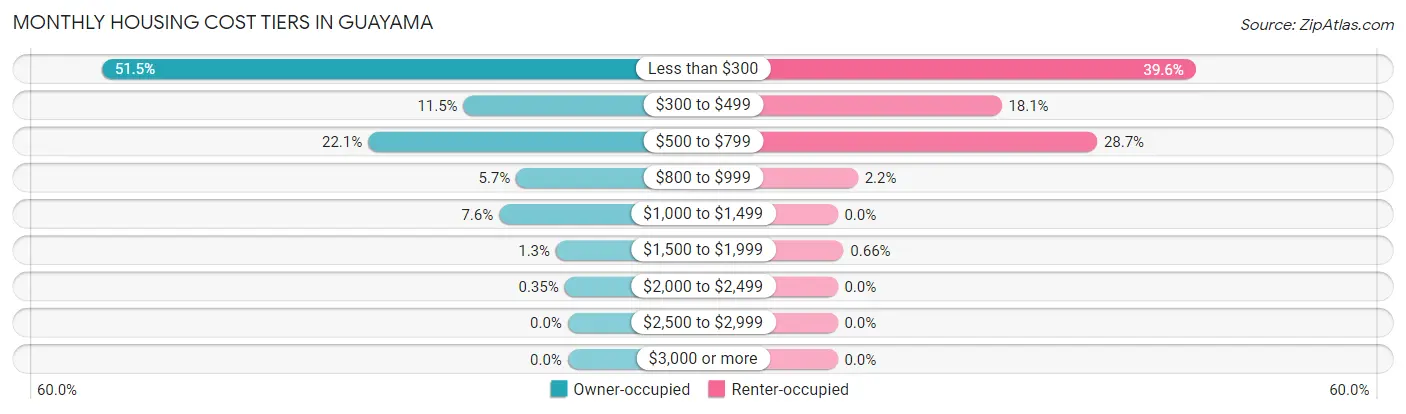
| Monthly Cost | Owner-occupied | Renter-occupied |
| Less than $300 | 2,510 (51.5%) | 1,201 (39.6%) |
| $300 to $499 | 562 (11.5%) | 550 (18.1%) |
| $500 to $799 | 1,076 (22.1%) | 870 (28.7%) |
| $800 to $999 | 278 (5.7%) | 68 (2.2%) |
| $1,000 to $1,499 | 370 (7.6%) | 0 (0.0%) |
| $1,500 to $1,999 | 64 (1.3%) | 20 (0.7%) |
| $2,000 to $2,499 | 17 (0.4%) | 0 (0.0%) |
| $2,500 to $2,999 | 0 (0.0%) | 0 (0.0%) |
| $3,000 or more | 0 (0.0%) | 0 (0.0%) |
| Total | 4,877 (100.0%) | 3,035 (100.0%) |
Physical Housing Characteristics in Guayama
Housing Structures in Guayama
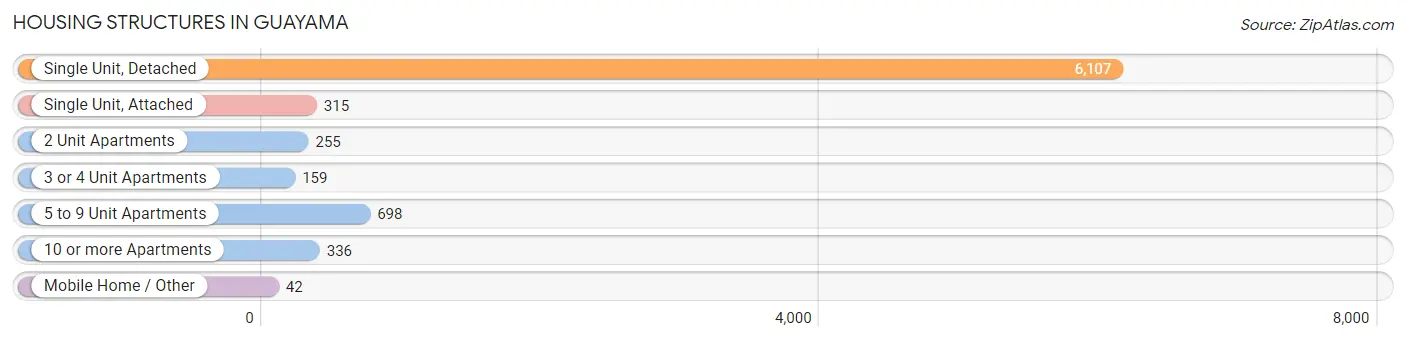
| Structure Type | # Housing Units | % Housing Units |
| Single Unit, Detached | 6,107 | 77.2% |
| Single Unit, Attached | 315 | 4.0% |
| 2 Unit Apartments | 255 | 3.2% |
| 3 or 4 Unit Apartments | 159 | 2.0% |
| 5 to 9 Unit Apartments | 698 | 8.8% |
| 10 or more Apartments | 336 | 4.3% |
| Mobile Home / Other | 42 | 0.5% |
| Total | 7,912 | 100.0% |
Housing Structures by Occupancy in Guayama
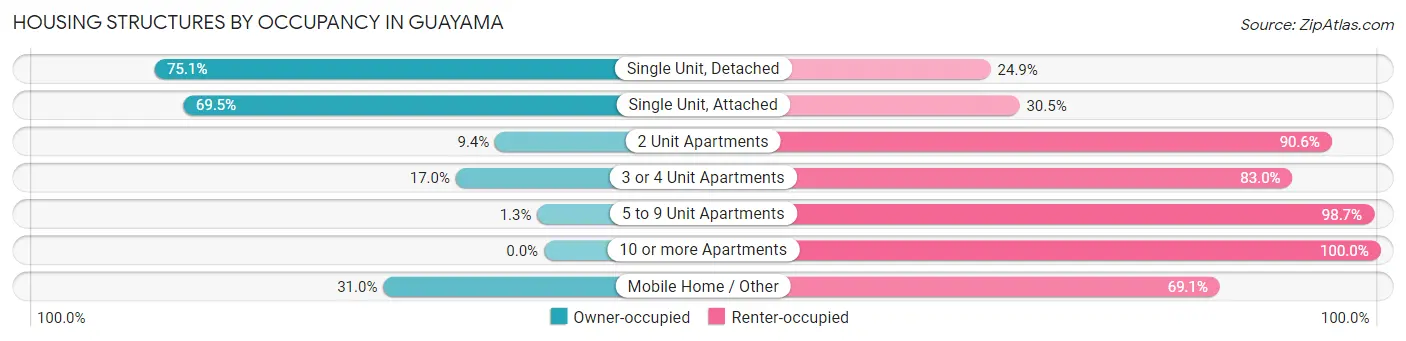
| Structure Type | Owner-occupied | Renter-occupied |
| Single Unit, Detached | 4,585 (75.1%) | 1,522 (24.9%) |
| Single Unit, Attached | 219 (69.5%) | 96 (30.5%) |
| 2 Unit Apartments | 24 (9.4%) | 231 (90.6%) |
| 3 or 4 Unit Apartments | 27 (17.0%) | 132 (83.0%) |
| 5 to 9 Unit Apartments | 9 (1.3%) | 689 (98.7%) |
| 10 or more Apartments | 0 (0.0%) | 336 (100.0%) |
| Mobile Home / Other | 13 (30.9%) | 29 (69.1%) |
| Total | 4,877 (61.6%) | 3,035 (38.4%) |
Housing Structures by Number of Rooms in Guayama
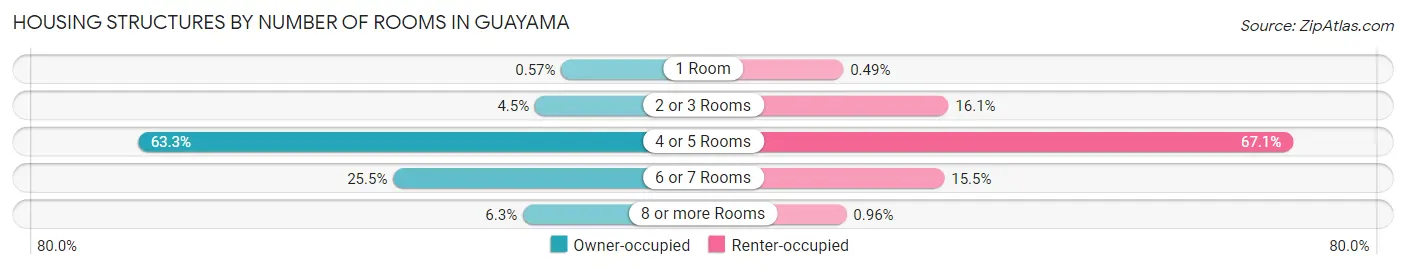
| Number of Rooms | Owner-occupied | Renter-occupied |
| 1 Room | 28 (0.6%) | 15 (0.5%) |
| 2 or 3 Rooms | 218 (4.5%) | 487 (16.1%) |
| 4 or 5 Rooms | 3,085 (63.3%) | 2,035 (67.0%) |
| 6 or 7 Rooms | 1,241 (25.5%) | 469 (15.4%) |
| 8 or more Rooms | 305 (6.2%) | 29 (1.0%) |
| Total | 4,877 (100.0%) | 3,035 (100.0%) |
Housing Structure by Heating Type in Guayama
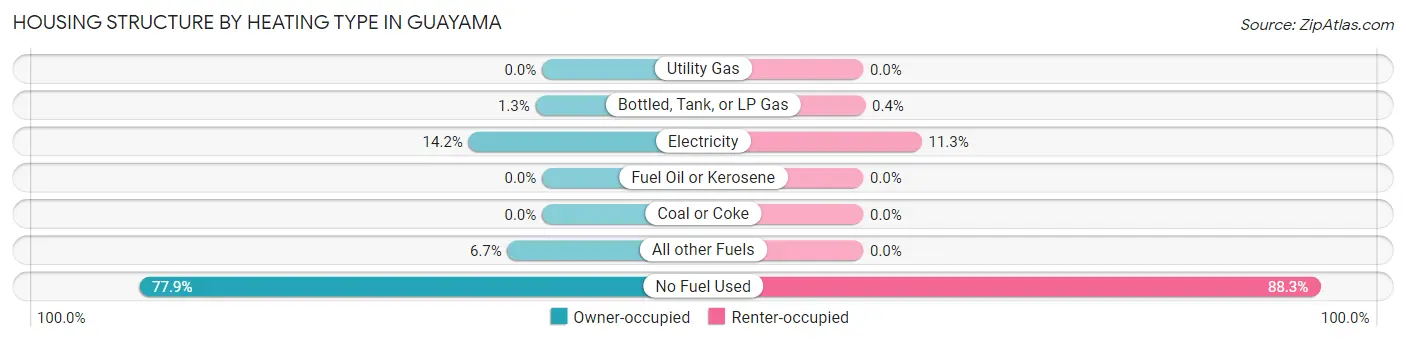
| Heating Type | Owner-occupied | Renter-occupied |
| Utility Gas | 0 (0.0%) | 0 (0.0%) |
| Bottled, Tank, or LP Gas | 62 (1.3%) | 12 (0.4%) |
| Electricity | 692 (14.2%) | 343 (11.3%) |
| Fuel Oil or Kerosene | 0 (0.0%) | 0 (0.0%) |
| Coal or Coke | 0 (0.0%) | 0 (0.0%) |
| All other Fuels | 325 (6.7%) | 0 (0.0%) |
| No Fuel Used | 3,798 (77.9%) | 2,680 (88.3%) |
| Total | 4,877 (100.0%) | 3,035 (100.0%) |
Household Vehicle Usage in Guayama
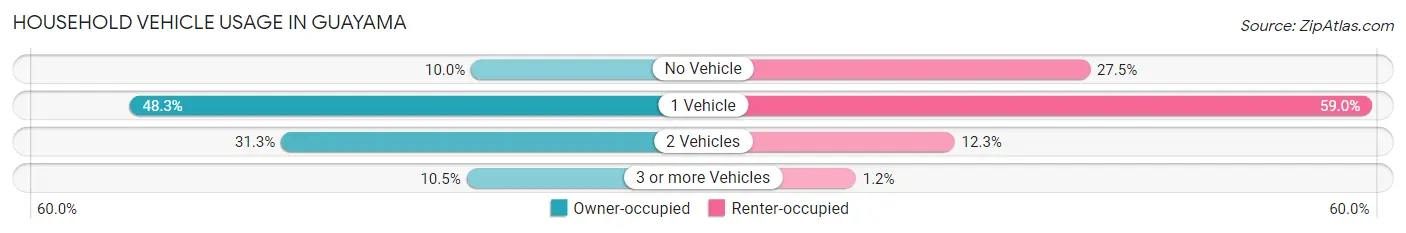
| Vehicles per Household | Owner-occupied | Renter-occupied |
| No Vehicle | 487 (10.0%) | 833 (27.5%) |
| 1 Vehicle | 2,353 (48.2%) | 1,792 (59.0%) |
| 2 Vehicles | 1,525 (31.3%) | 373 (12.3%) |
| 3 or more Vehicles | 512 (10.5%) | 37 (1.2%) |
| Total | 4,877 (100.0%) | 3,035 (100.0%) |
Real Estate & Mortgages in Guayama
Real Estate and Mortgage Overview in Guayama
| Characteristic | Without Mortgage | With Mortgage |
| Housing Units | 2,986 | 1,891 |
| Median Property Value | $95,200 | $119,700 |
| Median Household Income | $22,295 | $25 |
| Monthly Housing Costs | $174 | $0 |
| Real Estate Taxes | $382 | $1,816 |
Property Value by Mortgage Status in Guayama
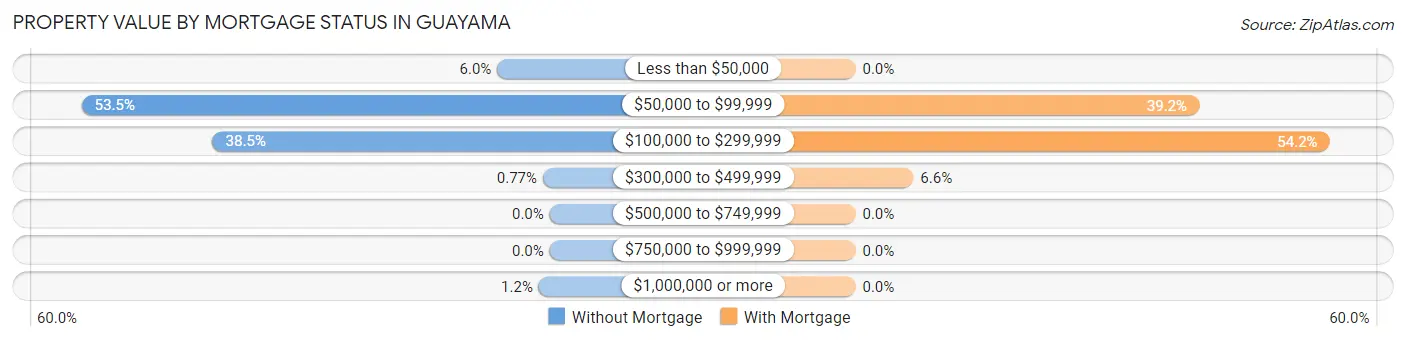
| Property Value | Without Mortgage | With Mortgage |
| Less than $50,000 | 179 (6.0%) | 0 (0.0%) |
| $50,000 to $99,999 | 1,597 (53.5%) | 742 (39.2%) |
| $100,000 to $299,999 | 1,150 (38.5%) | 1,024 (54.1%) |
| $300,000 to $499,999 | 23 (0.8%) | 125 (6.6%) |
| $500,000 to $749,999 | 0 (0.0%) | 0 (0.0%) |
| $750,000 to $999,999 | 0 (0.0%) | 0 (0.0%) |
| $1,000,000 or more | 37 (1.2%) | 0 (0.0%) |
| Total | 2,986 (100.0%) | 1,891 (100.0%) |
Household Income by Mortgage Status in Guayama
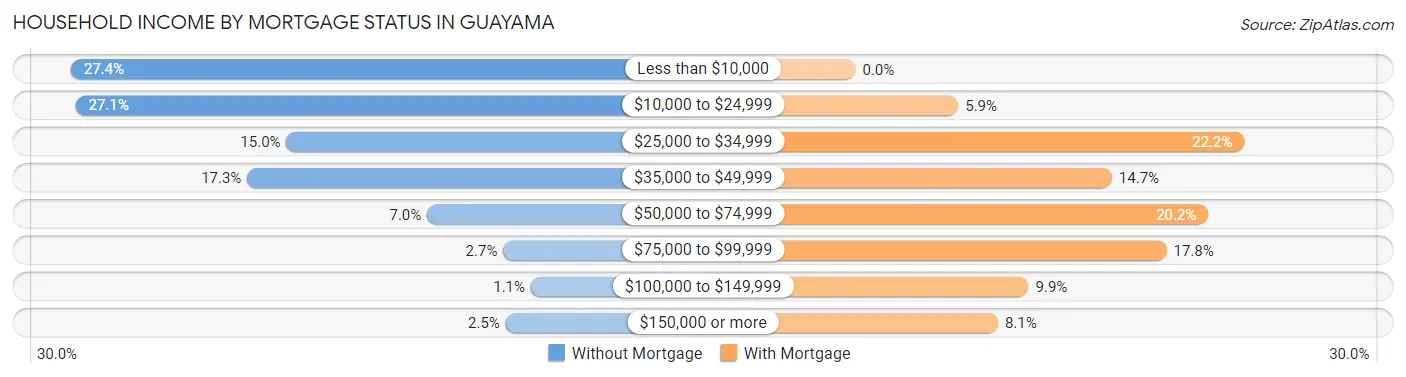
| Household Income | Without Mortgage | With Mortgage |
| Less than $10,000 | 817 (27.4%) | 0 (0.0%) |
| $10,000 to $24,999 | 809 (27.1%) | 111 (5.9%) |
| $25,000 to $34,999 | 449 (15.0%) | 420 (22.2%) |
| $35,000 to $49,999 | 516 (17.3%) | 277 (14.6%) |
| $50,000 to $74,999 | 209 (7.0%) | 381 (20.2%) |
| $75,000 to $99,999 | 79 (2.6%) | 336 (17.8%) |
| $100,000 to $149,999 | 32 (1.1%) | 187 (9.9%) |
| $150,000 or more | 75 (2.5%) | 154 (8.1%) |
| Total | 2,986 (100.0%) | 1,891 (100.0%) |
Property Value to Household Income Ratio in Guayama
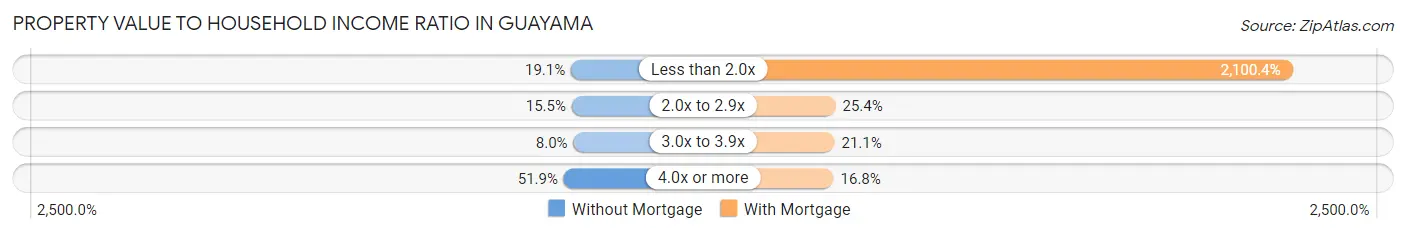
| Value-to-Income Ratio | Without Mortgage | With Mortgage |
| Less than 2.0x | 569 (19.1%) | 39,718 (2,100.4%) |
| 2.0x to 2.9x | 463 (15.5%) | 480 (25.4%) |
| 3.0x to 3.9x | 240 (8.0%) | 399 (21.1%) |
| 4.0x or more | 1,551 (51.9%) | 318 (16.8%) |
| Total | 2,986 (100.0%) | 1,891 (100.0%) |
Real Estate Taxes by Mortgage Status in Guayama
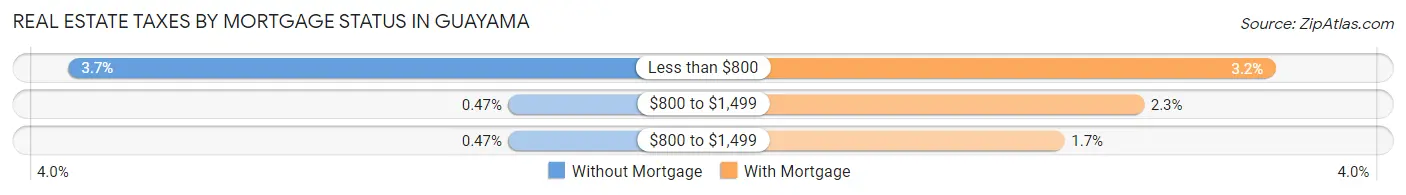
| Property Taxes | Without Mortgage | With Mortgage |
| Less than $800 | 110 (3.7%) | 61 (3.2%) |
| $800 to $1,499 | 14 (0.5%) | 43 (2.3%) |
| $800 to $1,499 | 14 (0.5%) | 32 (1.7%) |
| Total | 2,986 (100.0%) | 1,891 (100.0%) |
Health & Disability in Guayama
Health Insurance Coverage by Age in Guayama
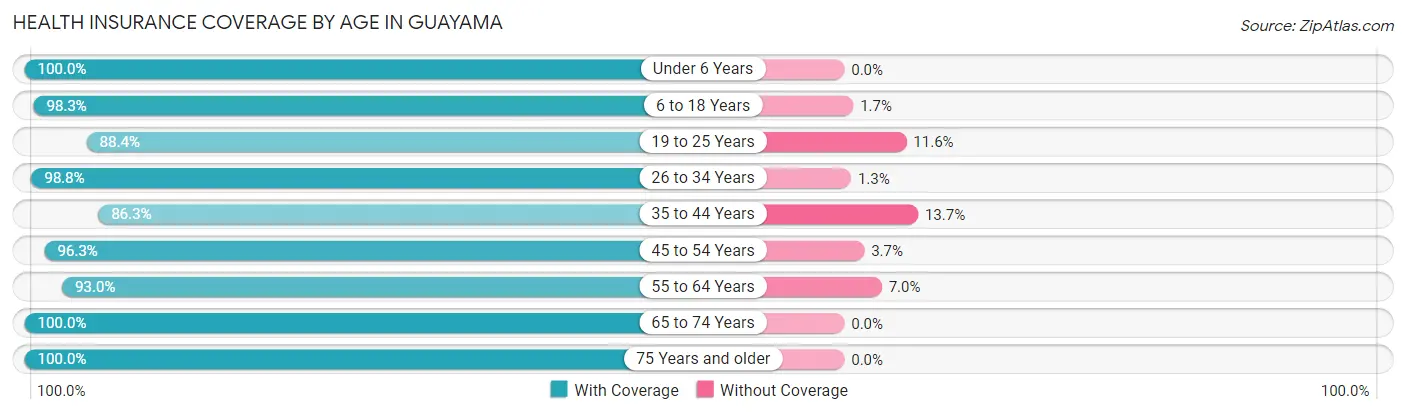
| Age Bracket | With Coverage | Without Coverage |
| Under 6 Years | 884 (100.0%) | 0 (0.0%) |
| 6 to 18 Years | 3,019 (98.3%) | 51 (1.7%) |
| 19 to 25 Years | 1,894 (88.4%) | 248 (11.6%) |
| 26 to 34 Years | 2,046 (98.8%) | 26 (1.3%) |
| 35 to 44 Years | 1,626 (86.3%) | 259 (13.7%) |
| 45 to 54 Years | 2,079 (96.3%) | 80 (3.7%) |
| 55 to 64 Years | 1,785 (93.0%) | 134 (7.0%) |
| 65 to 74 Years | 2,031 (100.0%) | 0 (0.0%) |
| 75 Years and older | 1,954 (100.0%) | 0 (0.0%) |
| Total | 17,318 (95.6%) | 798 (4.4%) |
Health Insurance Coverage by Citizenship Status in Guayama
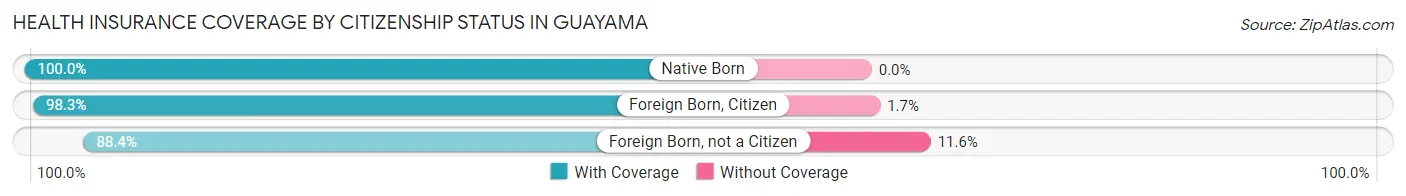
| Citizenship Status | With Coverage | Without Coverage |
| Native Born | 884 (100.0%) | 0 (0.0%) |
| Foreign Born, Citizen | 3,019 (98.3%) | 51 (1.7%) |
| Foreign Born, not a Citizen | 1,894 (88.4%) | 248 (11.6%) |
Health Insurance Coverage by Household Income in Guayama
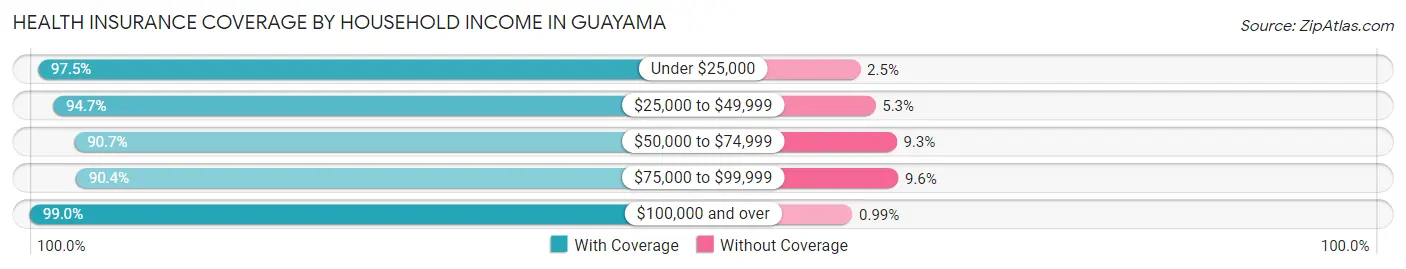
| Household Income | With Coverage | Without Coverage |
| Under $25,000 | 8,668 (97.5%) | 222 (2.5%) |
| $25,000 to $49,999 | 4,540 (94.7%) | 256 (5.3%) |
| $50,000 to $74,999 | 2,049 (90.7%) | 210 (9.3%) |
| $75,000 to $99,999 | 932 (90.4%) | 99 (9.6%) |
| $100,000 and over | 1,096 (99.0%) | 11 (1.0%) |
Public vs Private Health Insurance Coverage by Age in Guayama
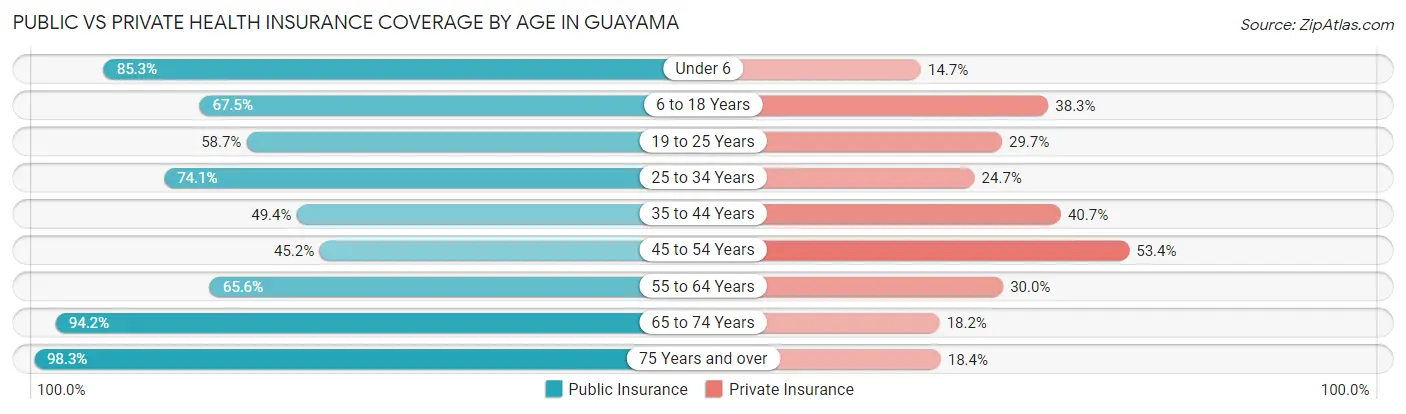
| Age Bracket | Public Insurance | Private Insurance |
| Under 6 | 754 (85.3%) | 130 (14.7%) |
| 6 to 18 Years | 2,073 (67.5%) | 1,177 (38.3%) |
| 19 to 25 Years | 1,257 (58.7%) | 637 (29.7%) |
| 25 to 34 Years | 1,535 (74.1%) | 511 (24.7%) |
| 35 to 44 Years | 931 (49.4%) | 767 (40.7%) |
| 45 to 54 Years | 975 (45.2%) | 1,152 (53.4%) |
| 55 to 64 Years | 1,259 (65.6%) | 575 (30.0%) |
| 65 to 74 Years | 1,913 (94.2%) | 369 (18.2%) |
| 75 Years and over | 1,920 (98.3%) | 359 (18.4%) |
| Total | 12,617 (69.7%) | 5,677 (31.3%) |
Disability Status by Sex by Age in Guayama
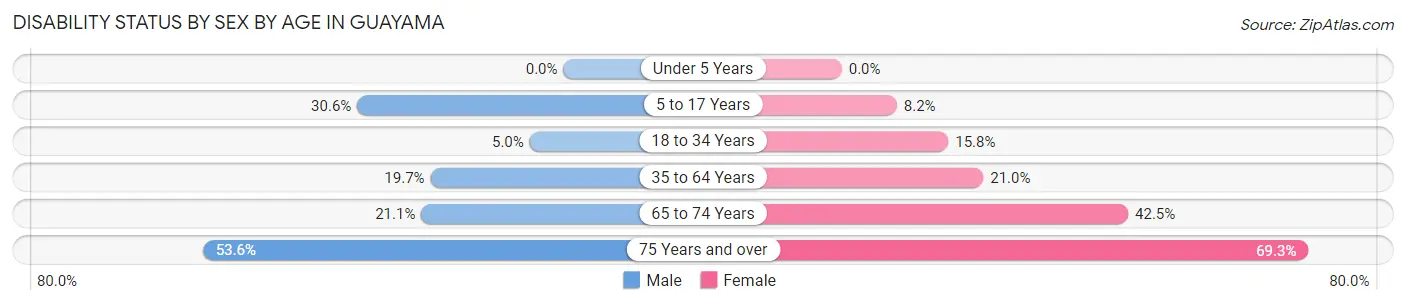
| Age Bracket | Male | Female |
| Under 5 Years | 0 (0.0%) | 0 (0.0%) |
| 5 to 17 Years | 376 (30.6%) | 145 (8.2%) |
| 18 to 34 Years | 113 (5.0%) | 359 (15.8%) |
| 35 to 64 Years | 477 (19.7%) | 745 (21.0%) |
| 65 to 74 Years | 176 (21.1%) | 509 (42.5%) |
| 75 Years and over | 407 (53.5%) | 827 (69.3%) |
Disability Class by Sex by Age in Guayama
Disability Class: Hearing Difficulty
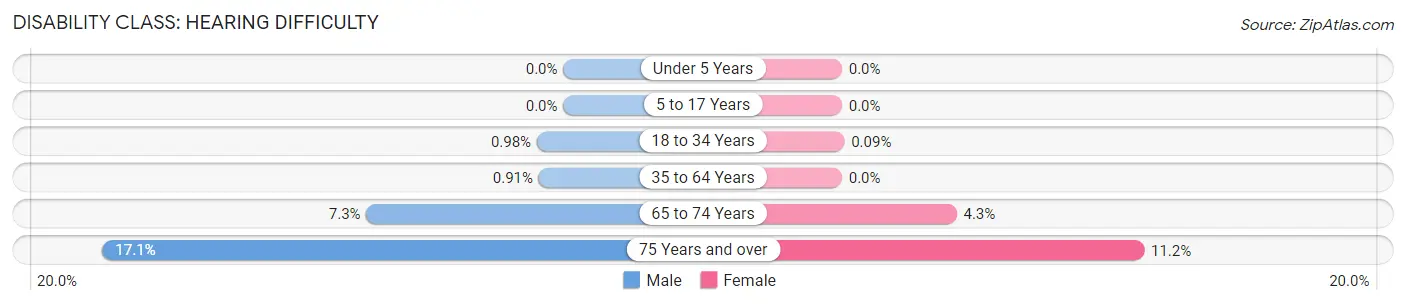
| Age Bracket | Male | Female |
| Under 5 Years | 0 (0.0%) | 0 (0.0%) |
| 5 to 17 Years | 0 (0.0%) | 0 (0.0%) |
| 18 to 34 Years | 22 (1.0%) | 2 (0.1%) |
| 35 to 64 Years | 22 (0.9%) | 0 (0.0%) |
| 65 to 74 Years | 61 (7.3%) | 51 (4.3%) |
| 75 Years and over | 130 (17.1%) | 134 (11.2%) |
Disability Class: Vision Difficulty
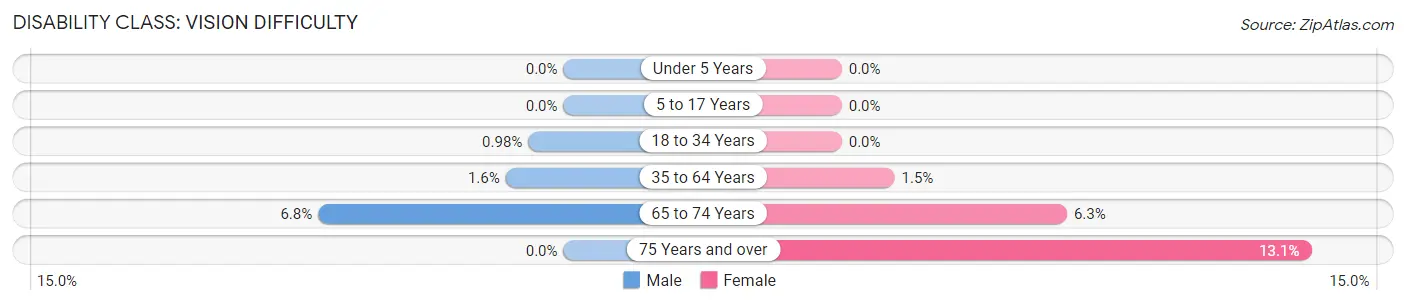
| Age Bracket | Male | Female |
| Under 5 Years | 0 (0.0%) | 0 (0.0%) |
| 5 to 17 Years | 0 (0.0%) | 0 (0.0%) |
| 18 to 34 Years | 22 (1.0%) | 0 (0.0%) |
| 35 to 64 Years | 39 (1.6%) | 52 (1.5%) |
| 65 to 74 Years | 57 (6.8%) | 75 (6.3%) |
| 75 Years and over | 0 (0.0%) | 156 (13.1%) |
Disability Class: Cognitive Difficulty
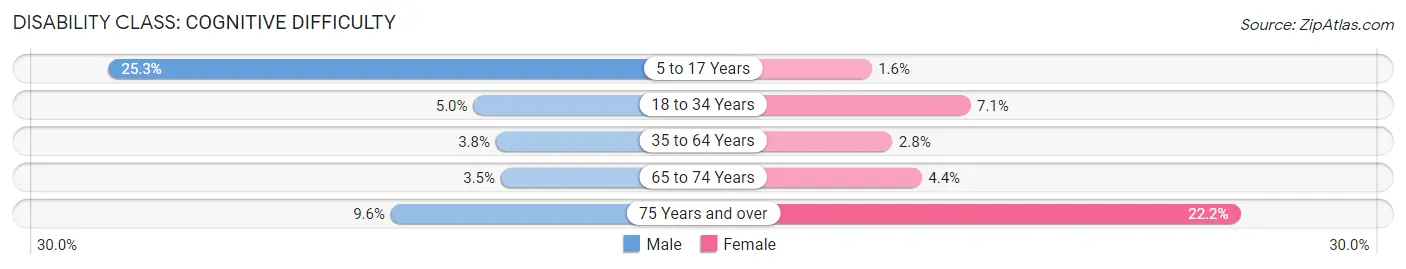
| Age Bracket | Male | Female |
| 5 to 17 Years | 311 (25.3%) | 29 (1.6%) |
| 18 to 34 Years | 113 (5.0%) | 162 (7.1%) |
| 35 to 64 Years | 91 (3.8%) | 99 (2.8%) |
| 65 to 74 Years | 29 (3.5%) | 53 (4.4%) |
| 75 Years and over | 73 (9.6%) | 265 (22.2%) |
Disability Class: Ambulatory Difficulty
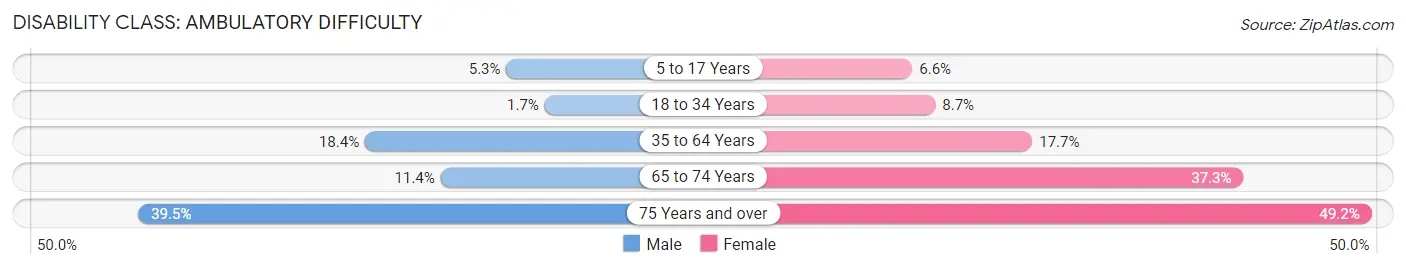
| Age Bracket | Male | Female |
| 5 to 17 Years | 65 (5.3%) | 116 (6.6%) |
| 18 to 34 Years | 39 (1.7%) | 197 (8.7%) |
| 35 to 64 Years | 445 (18.4%) | 627 (17.7%) |
| 65 to 74 Years | 95 (11.4%) | 446 (37.3%) |
| 75 Years and over | 300 (39.5%) | 587 (49.2%) |
Disability Class: Self-Care Difficulty
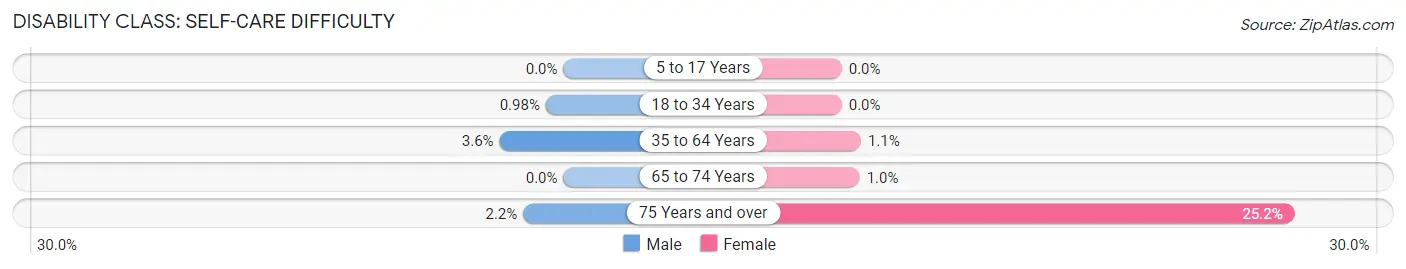
| Age Bracket | Male | Female |
| 5 to 17 Years | 0 (0.0%) | 0 (0.0%) |
| 18 to 34 Years | 22 (1.0%) | 0 (0.0%) |
| 35 to 64 Years | 86 (3.6%) | 38 (1.1%) |
| 65 to 74 Years | 0 (0.0%) | 12 (1.0%) |
| 75 Years and over | 17 (2.2%) | 301 (25.2%) |
Technology Access in Guayama
Computing Device Access in Guayama
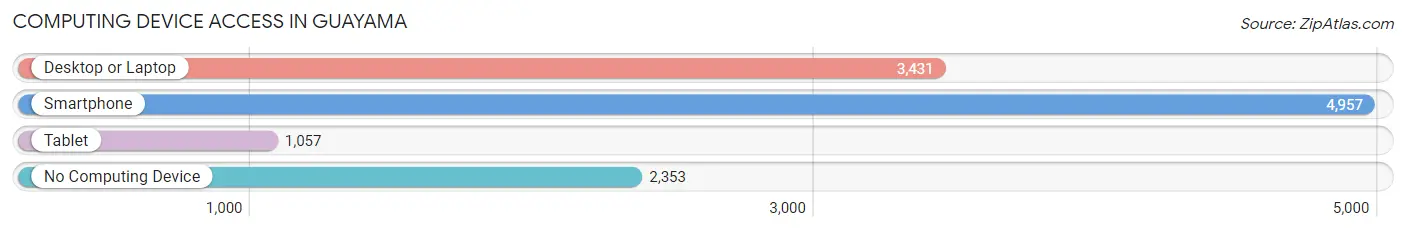
| Device Type | # Households | % Households |
| Desktop or Laptop | 3,431 | 43.4% |
| Smartphone | 4,957 | 62.6% |
| Tablet | 1,057 | 13.4% |
| No Computing Device | 2,353 | 29.7% |
| Total | 7,912 | 100.0% |
Internet Access in Guayama
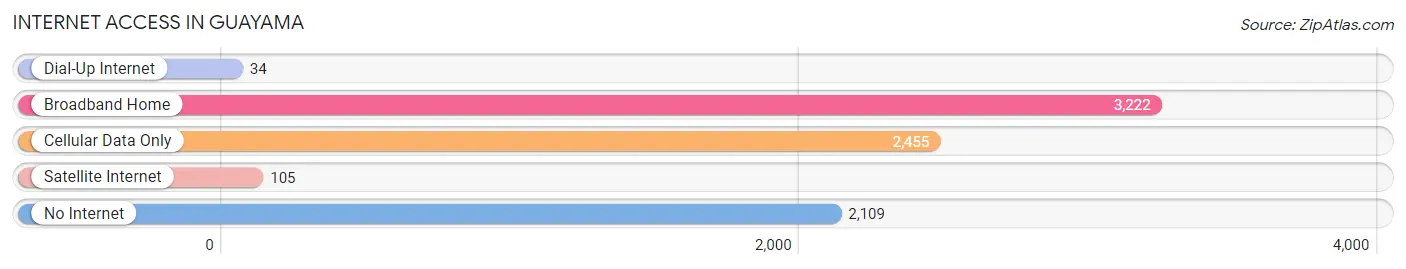
| Internet Type | # Households | % Households |
| Dial-Up Internet | 34 | 0.4% |
| Broadband Home | 3,222 | 40.7% |
| Cellular Data Only | 2,455 | 31.0% |
| Satellite Internet | 105 | 1.3% |
| No Internet | 2,109 | 26.7% |
| Total | 7,912 | 100.0% |
Guayama Summary
Guayama is a municipality located in the southeastern region of Puerto Rico. It is the capital of the municipality of Guayama and is located in the southern coast of the island. The population of Guayama was estimated to be 45,362 in 2019.
History
The area of Guayama was originally inhabited by the Taíno Indians. The Taíno Indians were the first inhabitants of Puerto Rico and were known for their agricultural practices. The Taíno Indians were eventually displaced by the Spanish in the 16th century. The Spanish established a settlement in the area of Guayama in 1510 and named it San Antonio de la Guayama. The settlement was later renamed Guayama in 1736.
During the 19th century, the economy of Guayama was based on the production of sugar cane and tobacco. The town was also known for its production of rum and other alcoholic beverages. In the late 19th century, the economy of Guayama shifted to the production of coffee and other agricultural products.
In 1898, Puerto Rico was ceded to the United States as a result of the Spanish-American War. Guayama was incorporated as a municipality in 1902. During the 20th century, the economy of Guayama shifted to the production of textiles and other light industries.
Geography
Guayama is located in the southeastern region of Puerto Rico. It is bordered by the municipalities of Patillas, Arroyo, and Salinas. The municipality covers an area of approximately 97 square miles and has a population density of 469 people per square mile.
The terrain of Guayama is mostly flat with some hills in the northern part of the municipality. The climate of Guayama is tropical with an average temperature of 79°F. The average annual precipitation is approximately 64 inches.
Economy
The economy of Guayama is largely based on the manufacturing sector. The municipality is home to several factories that produce textiles, electronics, and other products. The municipality is also home to several agricultural businesses that produce coffee, sugar cane, and other crops.
The tourism industry is also an important part of the economy of Guayama. The municipality is home to several beaches, parks, and other attractions.
Demographics
As of 2019, the population of Guayama was estimated to be 45,362. The majority of the population is of Hispanic or Latino descent. The median age of the population is 37.5 years. The median household income is $17,845.
The majority of the population of Guayama is Roman Catholic. Other religious denominations represented in the municipality include Protestantism, Judaism, and Islam.
Conclusion
Guayama is a municipality located in the southeastern region of Puerto Rico. It is the capital of the municipality of Guayama and is located in the southern coast of the island. The population of Guayama was estimated to be 45,362 in 2019. The economy of Guayama is largely based on the manufacturing sector and the tourism industry. The majority of the population is of Hispanic or Latino descent and the majority of the population is Roman Catholic.
Common Questions
What is Per Capita Income in Guayama?
Per Capita income in Guayama is $13,382.
What is the Median Family Income in Guayama?
Median Family Income in Guayama is $25,774.
What is the Median Household income in Guayama?
Median Household Income in Guayama is $20,445.
What is Income or Wage Gap in Guayama?
Income or Wage Gap in Guayama is 20.4%.
Women in Guayama earn 79.6 cents for every dollar earned by a man.
What is Family Income Deficit in Guayama?
Family Income Deficit in Guayama is $15,000.
Families that are below poverty line in Guayama earn $15,000 less on average than the poverty threshold level.
What is Inequality or Gini Index in Guayama?
Inequality or Gini Index in Guayama is 0.54.
What is the Total Population of Guayama?
Total Population of Guayama is 18,153.
What is the Total Male Population of Guayama?
Total Male Population of Guayama is 7,882.
What is the Total Female Population of Guayama?
Total Female Population of Guayama is 10,271.
What is the Ratio of Males per 100 Females in Guayama?
There are 76.74 Males per 100 Females in Guayama.
What is the Ratio of Females per 100 Males in Guayama?
There are 130.31 Females per 100 Males in Guayama.
What is the Median Population Age in Guayama?
Median Population Age in Guayama is 40.5 Years.
What is the Average Family Size in Guayama
Average Family Size in Guayama is 3.0 People.
What is the Average Household Size in Guayama
Average Household Size in Guayama is 2.3 People.
How Large is the Labor Force in Guayama?
There are 5,331 People in the Labor Forcein in Guayama.
What is the Percentage of People in the Labor Force in Guayama?
35.6% of People are in the Labor Force in Guayama.
What is the Unemployment Rate in Guayama?
Unemployment Rate in Guayama is 7.1%.