Guayanilla, PR Map & Demographics
Guayanilla Map
Guayanilla Overview
$11,957
PER CAPITA INCOME
$28,658
AVG FAMILY INCOME
$27,515
AVG HOUSEHOLD INCOME
34.3%
WAGE / INCOME GAP [ % ]
65.7¢/ $1
WAGE / INCOME GAP [ $ ]
$10,888
FAMILY INCOME DEFICIT
0.38
INEQUALITY / GINI INDEX
3,302
TOTAL POPULATION
1,430
MALE POPULATION
1,872
FEMALE POPULATION
76.39
MALES / 100 FEMALES
130.91
FEMALES / 100 MALES
48.3
MEDIAN AGE
3.0
AVG FAMILY SIZE
2.6
AVG HOUSEHOLD SIZE
1,013
LABOR FORCE [ PEOPLE ]
36.0%
PERCENT IN LABOR FORCE
25.8%
UNEMPLOYMENT RATE
Guayanilla Zip Codes
Guayanilla Area Codes
Income in Guayanilla
Income Overview in Guayanilla
Per Capita Income in Guayanilla is $11,957, while median incomes of families and households are $28,658 and $27,515 respectively.
| Characteristic | Number | Measure |
| Per Capita Income | 3,302 | $11,957 |
| Median Family Income | 953 | $28,658 |
| Mean Family Income | 953 | $30,835 |
| Median Household Income | 1,249 | $27,515 |
| Mean Household Income | 1,249 | $29,462 |
| Income Deficit | 953 | $10,888 |
| Wage / Income Gap (%) | 3,302 | 34.34% |
| Wage / Income Gap ($) | 3,302 | 65.66¢ per $1 |
| Gini / Inequality Index | 3,302 | 0.38 |
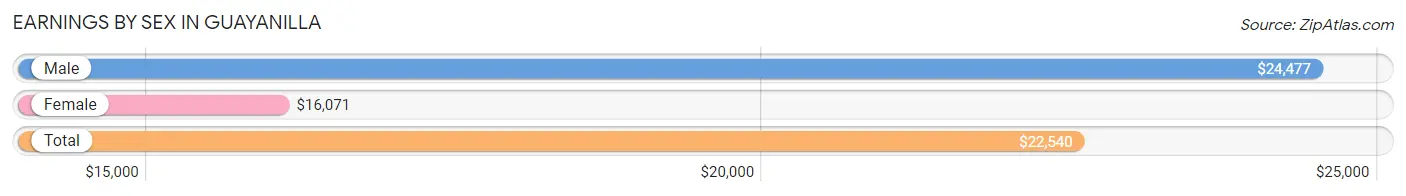
Earnings by Sex in Guayanilla
Average Earnings in Guayanilla are $22,540, $24,477 for men and $16,071 for women, a difference of 34.3%.
| Sex | Number | Average Earnings |
| Male | 415 (45.4%) | $24,477 |
| Female | 500 (54.6%) | $16,071 |
| Total | 915 (100.0%) | $22,540 |
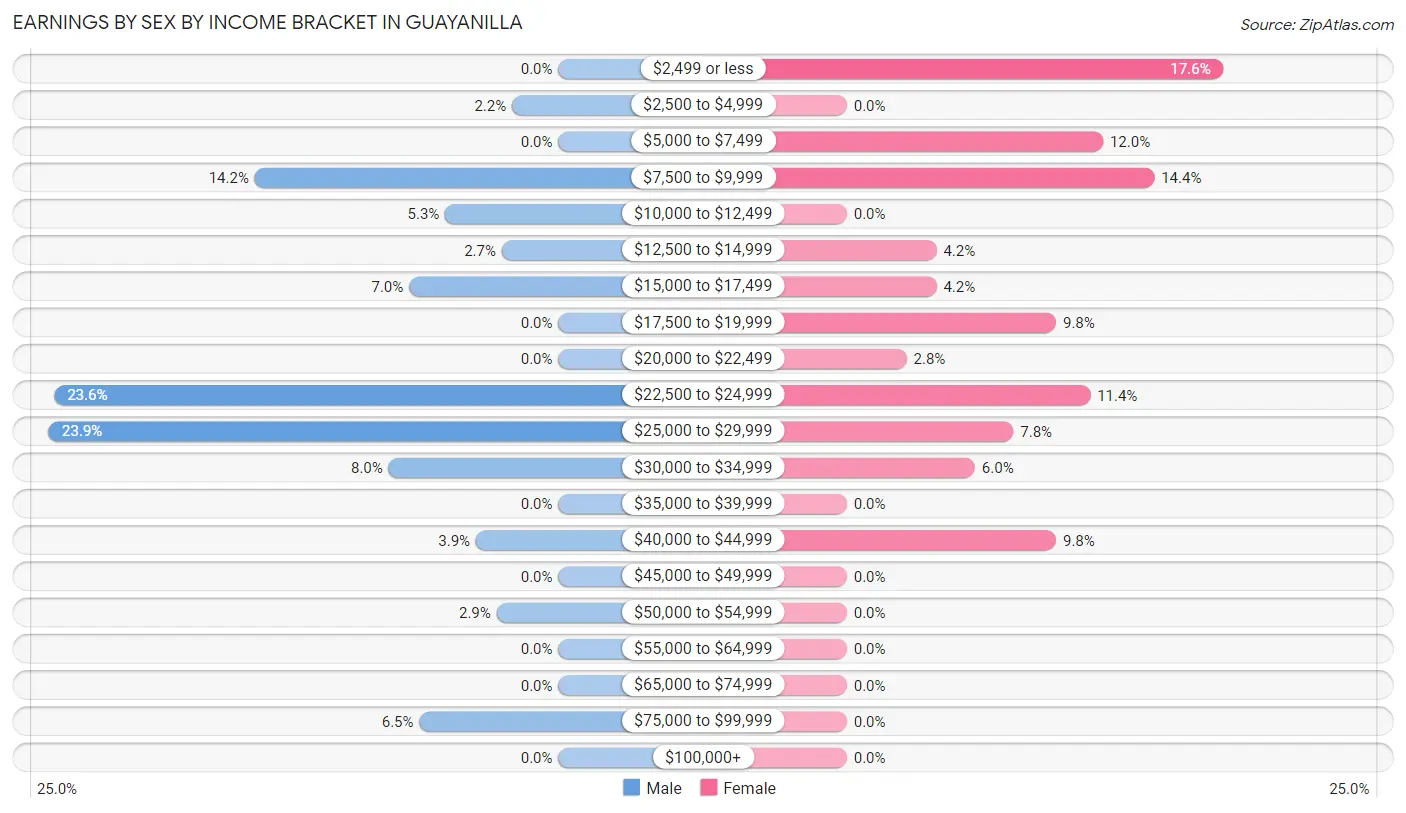
Earnings by Sex by Income Bracket in Guayanilla
The most common earnings brackets in Guayanilla are $25,000 to $29,999 for men (99 | 23.9%) and $2,499 or less for women (88 | 17.6%).
| Income | Male | Female |
| $2,499 or less | 0 (0.0%) | 88 (17.6%) |
| $2,500 to $4,999 | 9 (2.2%) | 0 (0.0%) |
| $5,000 to $7,499 | 0 (0.0%) | 60 (12.0%) |
| $7,500 to $9,999 | 59 (14.2%) | 72 (14.4%) |
| $10,000 to $12,499 | 22 (5.3%) | 0 (0.0%) |
| $12,500 to $14,999 | 11 (2.6%) | 21 (4.2%) |
| $15,000 to $17,499 | 29 (7.0%) | 21 (4.2%) |
| $17,500 to $19,999 | 0 (0.0%) | 49 (9.8%) |
| $20,000 to $22,499 | 0 (0.0%) | 14 (2.8%) |
| $22,500 to $24,999 | 98 (23.6%) | 57 (11.4%) |
| $25,000 to $29,999 | 99 (23.9%) | 39 (7.8%) |
| $30,000 to $34,999 | 33 (8.0%) | 30 (6.0%) |
| $35,000 to $39,999 | 0 (0.0%) | 0 (0.0%) |
| $40,000 to $44,999 | 16 (3.9%) | 49 (9.8%) |
| $45,000 to $49,999 | 0 (0.0%) | 0 (0.0%) |
| $50,000 to $54,999 | 12 (2.9%) | 0 (0.0%) |
| $55,000 to $64,999 | 0 (0.0%) | 0 (0.0%) |
| $65,000 to $74,999 | 0 (0.0%) | 0 (0.0%) |
| $75,000 to $99,999 | 27 (6.5%) | 0 (0.0%) |
| $100,000+ | 0 (0.0%) | 0 (0.0%) |
| Total | 415 (100.0%) | 500 (100.0%) |
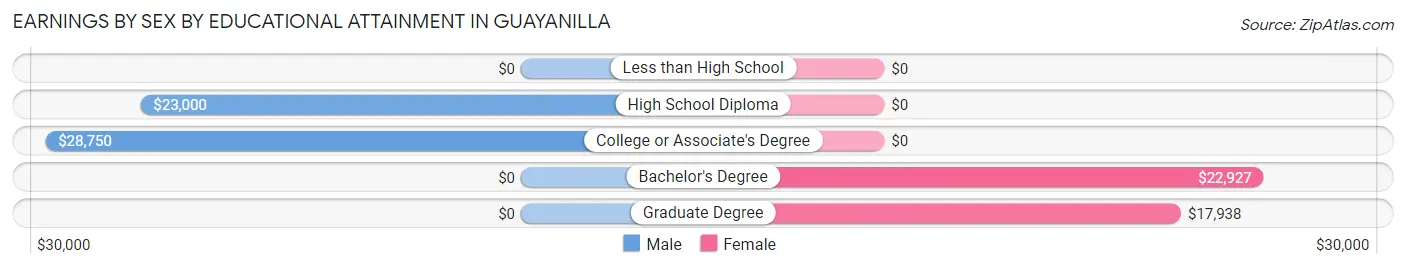
Earnings by Sex by Educational Attainment in Guayanilla
Average earnings in Guayanilla are $24,656 for men and $17,730 for women, a difference of 28.1%. Men with an educational attainment of college or associate's degree enjoy the highest average annual earnings of $28,750, while those with high school diploma education earn the least with $23,000. Women with an educational attainment of bachelor's degree earn the most with the average annual earnings of $22,927, while those with graduate degree education have the smallest earnings of $17,938.
| Educational Attainment | Male Income | Female Income |
| Less than High School | - | - |
| High School Diploma | $23,000 | $0 |
| College or Associate's Degree | $28,750 | $0 |
| Bachelor's Degree | - | - |
| Graduate Degree | - | - |
| Total | $24,656 | $17,730 |
Family Income in Guayanilla
Family Income Brackets in Guayanilla
According to the Guayanilla family income data, there are 247 families falling into the $25,000 to $34,999 income range, which is the most common income bracket and makes up 25.9% of all families.
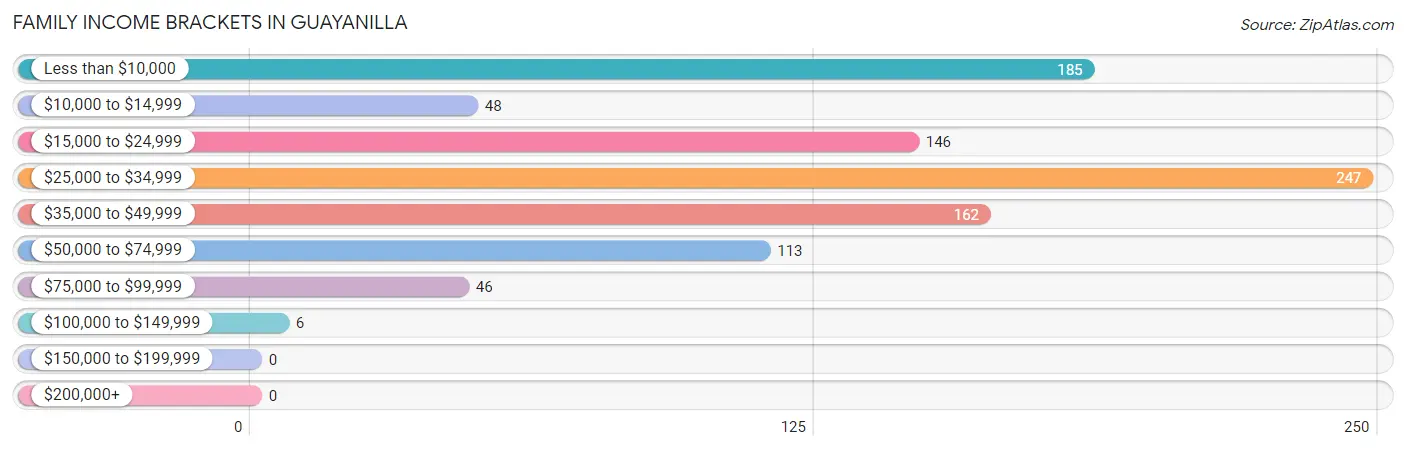
| Income Bracket | # Families | % Families |
| Less than $10,000 | 185 | 19.4% |
| $10,000 to $14,999 | 48 | 5.0% |
| $15,000 to $24,999 | 146 | 15.3% |
| $25,000 to $34,999 | 247 | 25.9% |
| $35,000 to $49,999 | 162 | 17.0% |
| $50,000 to $74,999 | 113 | 11.9% |
| $75,000 to $99,999 | 46 | 4.8% |
| $100,000 to $149,999 | 6 | 0.6% |
| $150,000 to $199,999 | 0 | 0.0% |
| $200,000+ | 0 | 0.0% |
Family Income by Famaliy Size in Guayanilla
3-person families (267 | 28.0%) account for the highest median family income in Guayanilla with $31,595 per family, while 2-person families (490 | 51.4%) have the highest median income of $13,306 per family member.
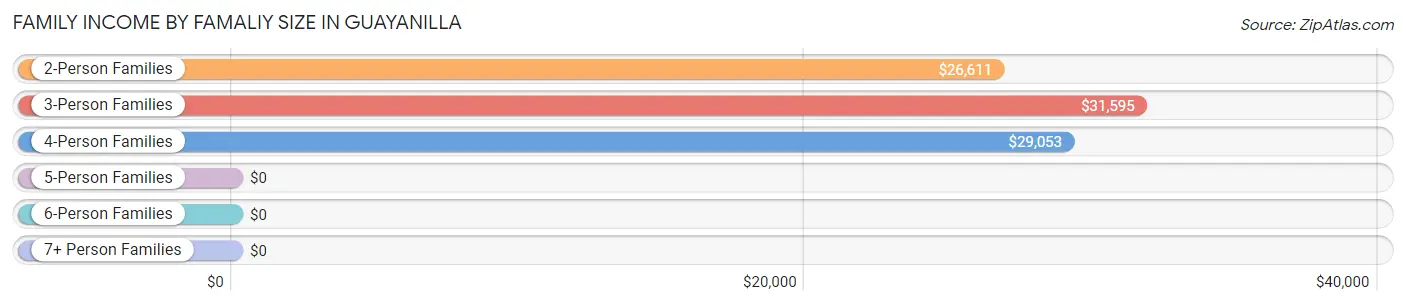
| Income Bracket | # Families | Median Income |
| 2-Person Families | 490 (51.4%) | $26,611 |
| 3-Person Families | 267 (28.0%) | $31,595 |
| 4-Person Families | 179 (18.8%) | $29,053 |
| 5-Person Families | 9 (0.9%) | $0 |
| 6-Person Families | 0 (0.0%) | $0 |
| 7+ Person Families | 8 (0.8%) | $0 |
| Total | 953 (100.0%) | $28,658 |
Family Income by Number of Earners in Guayanilla
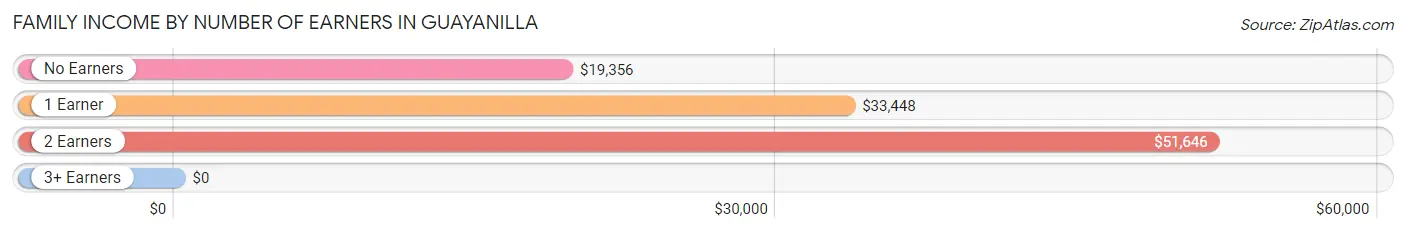
| Number of Earners | # Families | Median Income |
| No Earners | 455 (47.7%) | $19,356 |
| 1 Earner | 364 (38.2%) | $33,448 |
| 2 Earners | 100 (10.5%) | $51,646 |
| 3+ Earners | 34 (3.6%) | $0 |
| Total | 953 (100.0%) | $28,658 |
Household Income in Guayanilla
Household Income Brackets in Guayanilla
With 270 households falling in the category, the $25,000 to $34,999 income range is the most frequent in Guayanilla, accounting for 21.6% of all households.
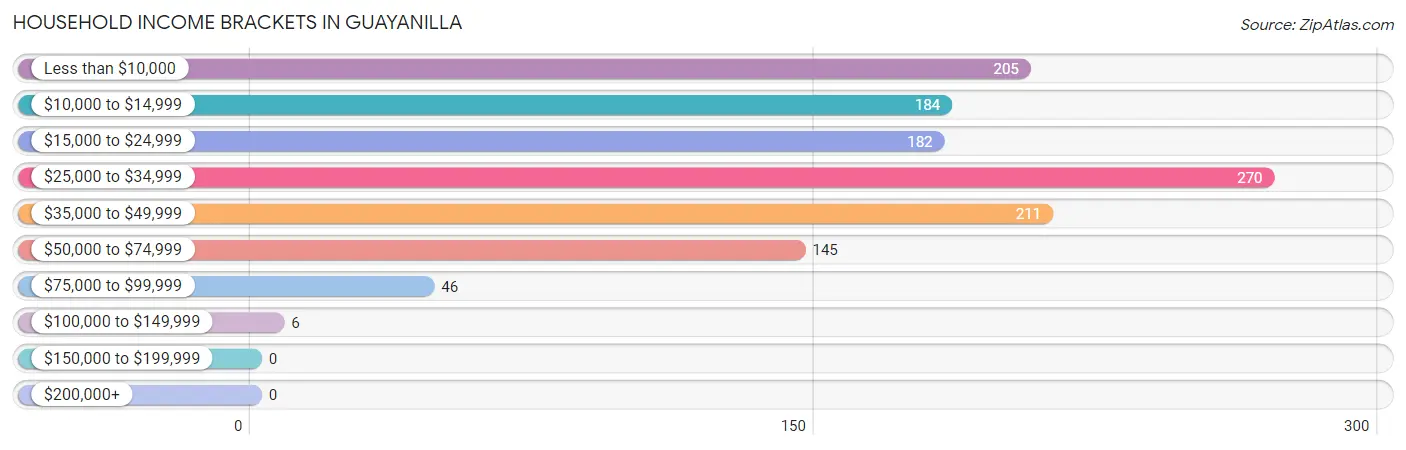
| Income Bracket | # Households | % Households |
| Less than $10,000 | 205 | 16.4% |
| $10,000 to $14,999 | 184 | 14.7% |
| $15,000 to $24,999 | 182 | 14.6% |
| $25,000 to $34,999 | 270 | 21.6% |
| $35,000 to $49,999 | 211 | 16.9% |
| $50,000 to $74,999 | 145 | 11.6% |
| $75,000 to $99,999 | 46 | 3.7% |
| $100,000 to $149,999 | 6 | 0.5% |
| $150,000 to $199,999 | 0 | 0.0% |
| $200,000+ | 0 | 0.0% |
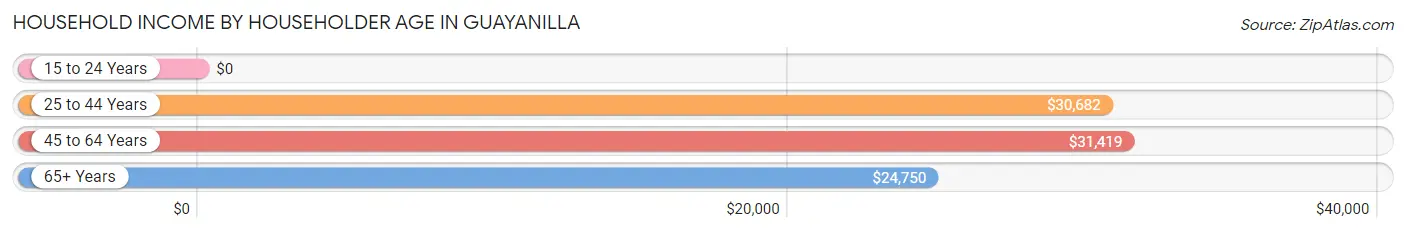
Household Income by Householder Age in Guayanilla
The median household income in Guayanilla is $27,515, with the highest median household income of $31,419 found in the 45 to 64 years age bracket for the primary householder. A total of 330 households (26.4%) fall into this category. Meanwhile, the 15 to 24 years age bracket for the primary householder has the lowest median household income of $0, with 50 households (4.0%) in this group.
| Income Bracket | # Households | Median Income |
| 15 to 24 Years | 50 (4.0%) | $0 |
| 25 to 44 Years | 240 (19.2%) | $30,682 |
| 45 to 64 Years | 330 (26.4%) | $31,419 |
| 65+ Years | 629 (50.4%) | $24,750 |
| Total | 1,249 (100.0%) | $27,515 |
Poverty in Guayanilla
Income Below Poverty by Sex and Age in Guayanilla
With 27.4% poverty level for males and 48.4% for females among the residents of Guayanilla, 15 year old males and 5 year old females are the most vulnerable to poverty, with 25 males (100.0%) and 15 females (100.0%) in their respective age groups living below the poverty level.
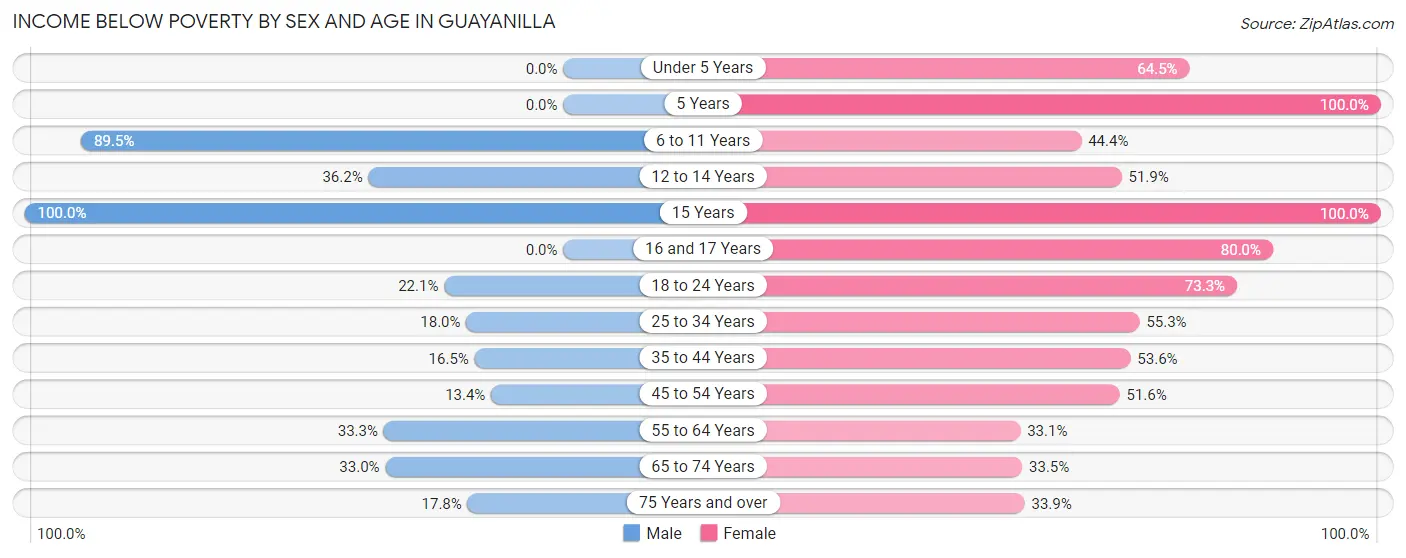
| Age Bracket | Male | Female |
| Under 5 Years | 0 (0.0%) | 40 (64.5%) |
| 5 Years | 0 (0.0%) | 15 (100.0%) |
| 6 to 11 Years | 77 (89.5%) | 76 (44.4%) |
| 12 to 14 Years | 17 (36.2%) | 27 (51.9%) |
| 15 Years | 25 (100.0%) | 19 (100.0%) |
| 16 and 17 Years | 0 (0.0%) | 32 (80.0%) |
| 18 to 24 Years | 21 (22.1%) | 99 (73.3%) |
| 25 to 34 Years | 18 (18.0%) | 121 (55.2%) |
| 35 to 44 Years | 26 (16.5%) | 120 (53.6%) |
| 45 to 54 Years | 34 (13.4%) | 116 (51.6%) |
| 55 to 64 Years | 56 (33.3%) | 52 (33.1%) |
| 65 to 74 Years | 73 (33.0%) | 84 (33.5%) |
| 75 Years and over | 43 (17.8%) | 97 (33.9%) |
| Total | 390 (27.4%) | 898 (48.4%) |
Income Above Poverty by Sex and Age in Guayanilla
According to the poverty statistics in Guayanilla, males aged under 5 years and females aged 55 to 64 years are the age groups that are most secure financially, with 100.0% of males and 66.9% of females in these age groups living above the poverty line.
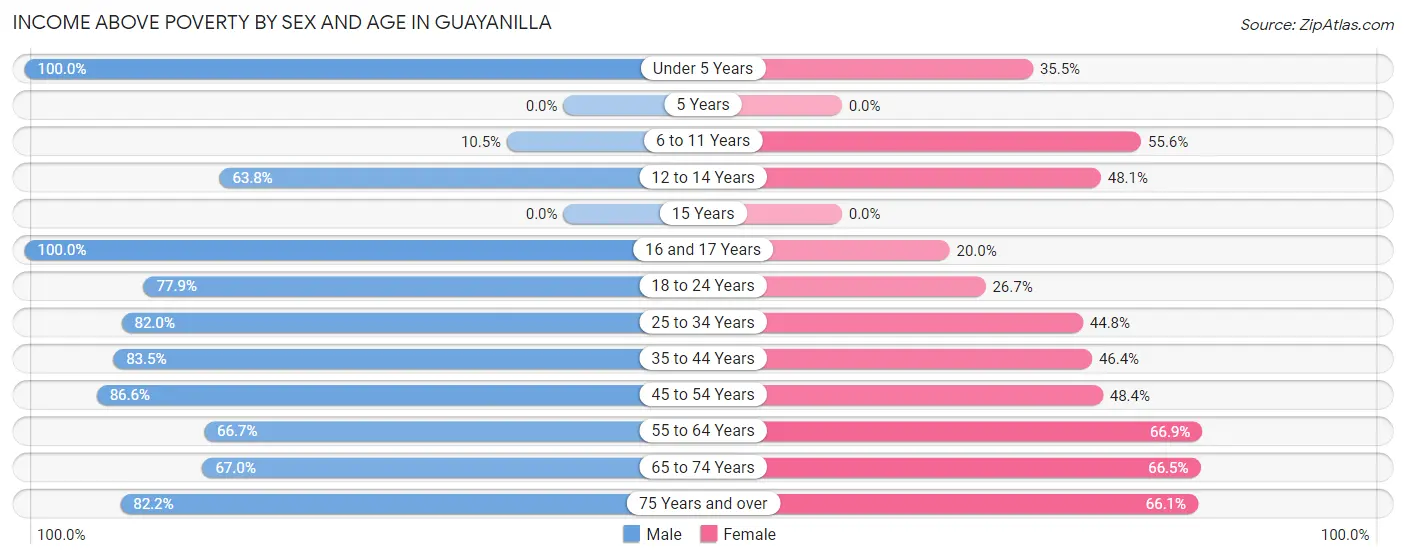
| Age Bracket | Male | Female |
| Under 5 Years | 11 (100.0%) | 22 (35.5%) |
| 5 Years | 0 (0.0%) | 0 (0.0%) |
| 6 to 11 Years | 9 (10.5%) | 95 (55.6%) |
| 12 to 14 Years | 30 (63.8%) | 25 (48.1%) |
| 15 Years | 0 (0.0%) | 0 (0.0%) |
| 16 and 17 Years | 18 (100.0%) | 8 (20.0%) |
| 18 to 24 Years | 74 (77.9%) | 36 (26.7%) |
| 25 to 34 Years | 82 (82.0%) | 98 (44.8%) |
| 35 to 44 Years | 132 (83.5%) | 104 (46.4%) |
| 45 to 54 Years | 220 (86.6%) | 109 (48.4%) |
| 55 to 64 Years | 112 (66.7%) | 105 (66.9%) |
| 65 to 74 Years | 148 (67.0%) | 167 (66.5%) |
| 75 Years and over | 199 (82.2%) | 189 (66.1%) |
| Total | 1,035 (72.6%) | 958 (51.6%) |
Income Below Poverty Among Married-Couple Families in Guayanilla
The poverty statistics for married-couple families in Guayanilla show that 9.8% or 40 of the total 410 families live below the poverty line. Families with no children have the highest poverty rate of 11.7%, comprising of 40 families. On the other hand, families with 1 or 2 children have the lowest poverty rate of 0.0%, which includes 0 families.
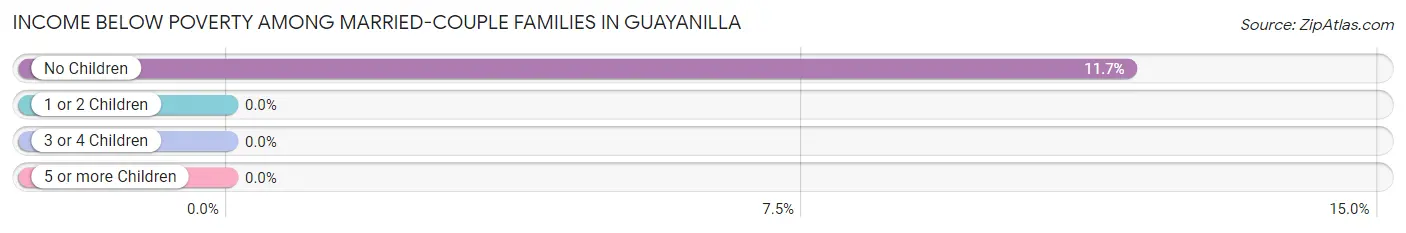
| Children | Above Poverty | Below Poverty |
| No Children | 301 (88.3%) | 40 (11.7%) |
| 1 or 2 Children | 69 (100.0%) | 0 (0.0%) |
| 3 or 4 Children | 0 (0.0%) | 0 (0.0%) |
| 5 or more Children | 0 (0.0%) | 0 (0.0%) |
| Total | 370 (90.2%) | 40 (9.8%) |
Income Below Poverty Among Single-Parent Households in Guayanilla
According to the poverty data in Guayanilla, 59.4% or 85 single-father households and 49.5% or 198 single-mother households are living below the poverty line. Among single-father households, those with 1 or 2 children have the highest poverty rate, with 42 households (75.0%) experiencing poverty. Likewise, among single-mother households, those with 3 or 4 children have the highest poverty rate, with 35 households (100.0%) falling below the poverty line.
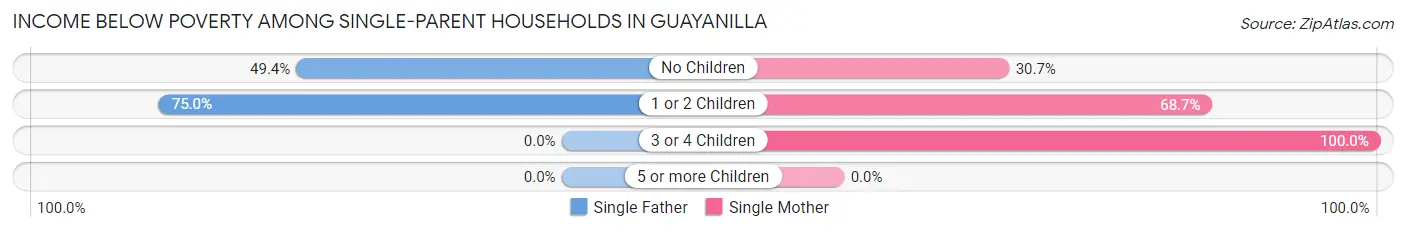
| Children | Single Father | Single Mother |
| No Children | 43 (49.4%) | 71 (30.7%) |
| 1 or 2 Children | 42 (75.0%) | 92 (68.7%) |
| 3 or 4 Children | 0 (0.0%) | 35 (100.0%) |
| 5 or more Children | 0 (0.0%) | 0 (0.0%) |
| Total | 85 (59.4%) | 198 (49.5%) |
Income Below Poverty Among Married-Couple vs Single-Parent Households in Guayanilla
The poverty data for Guayanilla shows that 40 of the married-couple family households (9.8%) and 283 of the single-parent households (52.1%) are living below the poverty level. Within the married-couple family households, those with no children have the highest poverty rate, with 40 households (11.7%) falling below the poverty line. Among the single-parent households, those with 3 or 4 children have the highest poverty rate, with 35 household (100.0%) living below poverty.
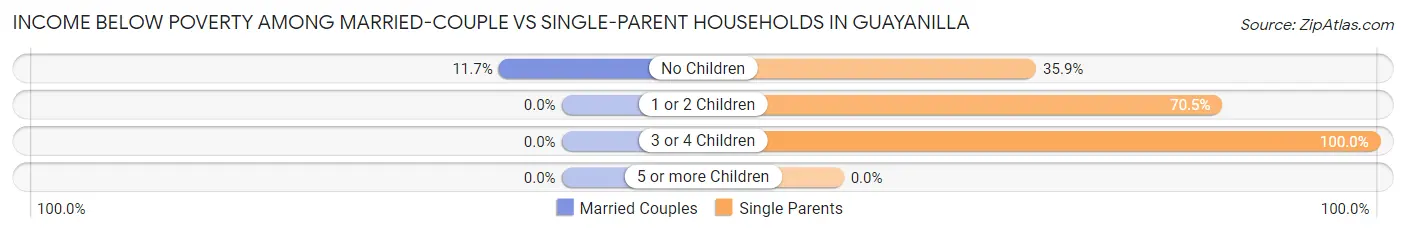
| Children | Married-Couple Families | Single-Parent Households |
| No Children | 40 (11.7%) | 114 (35.8%) |
| 1 or 2 Children | 0 (0.0%) | 134 (70.5%) |
| 3 or 4 Children | 0 (0.0%) | 35 (100.0%) |
| 5 or more Children | 0 (0.0%) | 0 (0.0%) |
| Total | 40 (9.8%) | 283 (52.1%) |
Race in Guayanilla
The most populous races in Guayanilla are Hispanic or Latino (3,288 | 99.6%), White / Caucasian (2,360 | 71.5%), and Some other Race (532 | 16.1%).
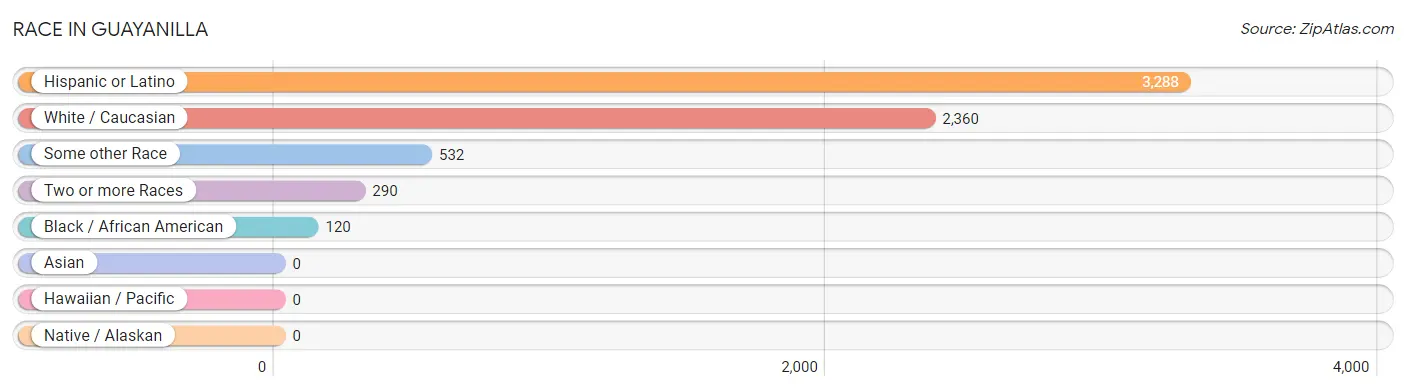
| Race | # Population | % Population |
| Asian | 0 | 0.0% |
| Black / African American | 120 | 3.6% |
| Hawaiian / Pacific | 0 | 0.0% |
| Hispanic or Latino | 3,288 | 99.6% |
| Native / Alaskan | 0 | 0.0% |
| White / Caucasian | 2,360 | 71.5% |
| Two or more Races | 290 | 8.8% |
| Some other Race | 532 | 16.1% |
| Total | 3,302 | 100.0% |
Ancestry in Guayanilla
The most populous ancestries reported in Guayanilla are Puerto Rican (3,264 | 98.9%), Central American Indian (28 | 0.9%), American (18 | 0.5%), Mexican (17 | 0.5%), and Guyanese (9 | 0.3%), together accounting for 101.0% of all Guayanilla residents.
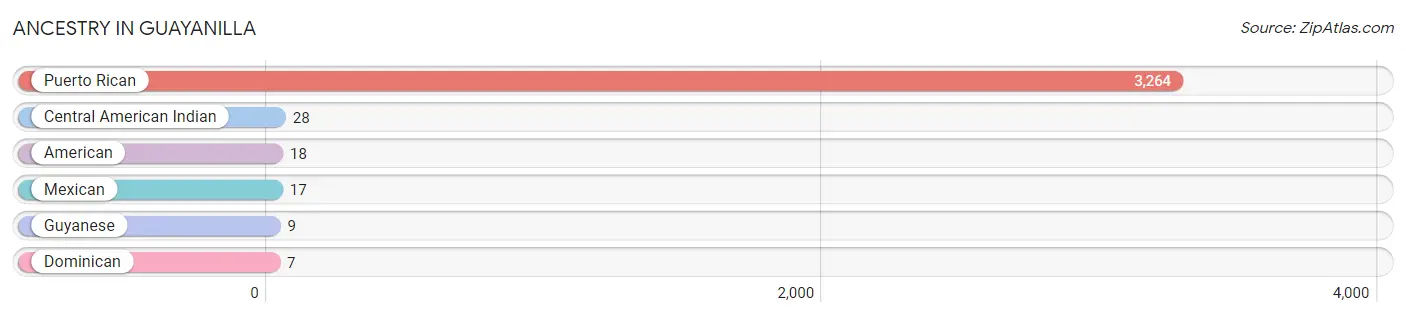
| Ancestry | # Population | % Population |
| American | 18 | 0.5% |
| Central American Indian | 28 | 0.9% |
| Dominican | 7 | 0.2% |
| Guyanese | 9 | 0.3% |
| Mexican | 17 | 0.5% |
| Puerto Rican | 3,264 | 98.9% | View All 6 Rows |
Immigrants in Guayanilla

| Immigration Origin | # Population | % Population | View All 0 Rows |
Sex and Age in Guayanilla
Sex and Age in Guayanilla
The most populous age groups in Guayanilla are 45 to 49 Years (148 | 10.3%) for men and 35 to 39 Years (191 | 10.2%) for women.
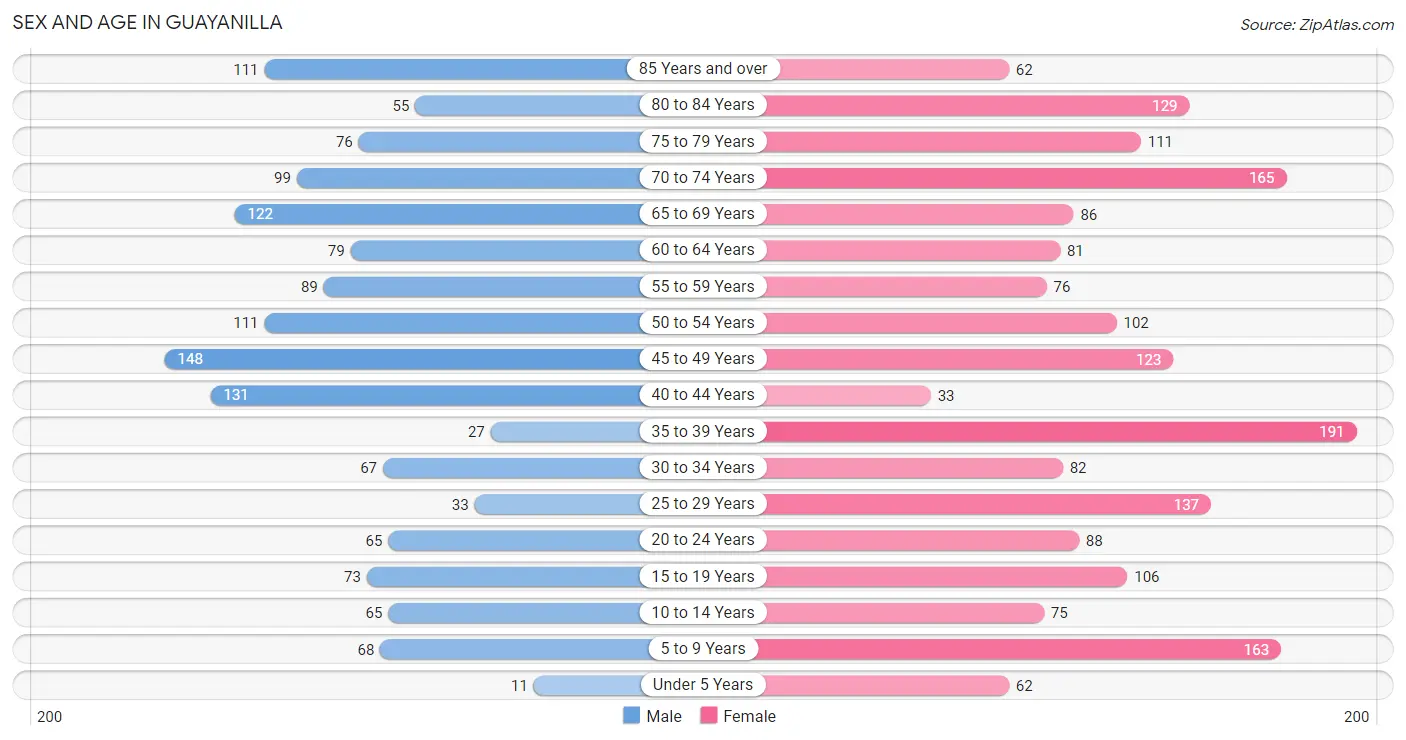
| Age Bracket | Male | Female |
| Under 5 Years | 11 (0.8%) | 62 (3.3%) |
| 5 to 9 Years | 68 (4.8%) | 163 (8.7%) |
| 10 to 14 Years | 65 (4.5%) | 75 (4.0%) |
| 15 to 19 Years | 73 (5.1%) | 106 (5.7%) |
| 20 to 24 Years | 65 (4.5%) | 88 (4.7%) |
| 25 to 29 Years | 33 (2.3%) | 137 (7.3%) |
| 30 to 34 Years | 67 (4.7%) | 82 (4.4%) |
| 35 to 39 Years | 27 (1.9%) | 191 (10.2%) |
| 40 to 44 Years | 131 (9.2%) | 33 (1.8%) |
| 45 to 49 Years | 148 (10.3%) | 123 (6.6%) |
| 50 to 54 Years | 111 (7.8%) | 102 (5.4%) |
| 55 to 59 Years | 89 (6.2%) | 76 (4.1%) |
| 60 to 64 Years | 79 (5.5%) | 81 (4.3%) |
| 65 to 69 Years | 122 (8.5%) | 86 (4.6%) |
| 70 to 74 Years | 99 (6.9%) | 165 (8.8%) |
| 75 to 79 Years | 76 (5.3%) | 111 (5.9%) |
| 80 to 84 Years | 55 (3.8%) | 129 (6.9%) |
| 85 Years and over | 111 (7.8%) | 62 (3.3%) |
| Total | 1,430 (100.0%) | 1,872 (100.0%) |
Families and Households in Guayanilla
Median Family Size in Guayanilla
The median family size in Guayanilla is 3.00 persons per family, with single female/mother families (400 | 42.0%) accounting for the largest median family size of 3.19 persons per family. On the other hand, married-couple families (410 | 43.0%) represent the smallest median family size with 2.84 persons per family.
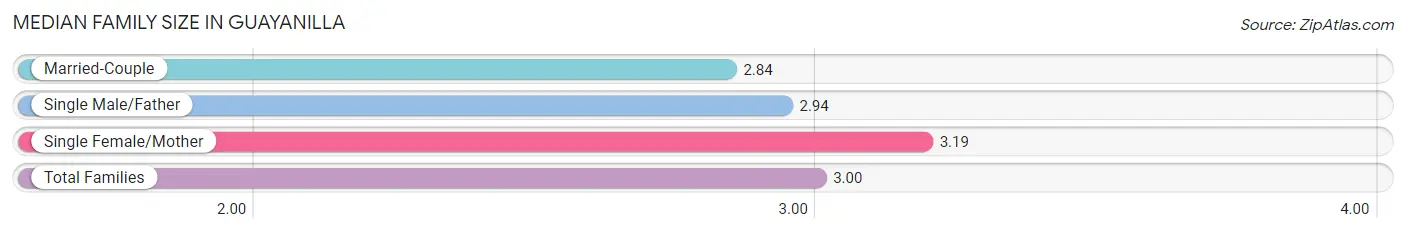
| Family Type | # Families | Family Size |
| Married-Couple | 410 (43.0%) | 2.84 |
| Single Male/Father | 143 (15.0%) | 2.94 |
| Single Female/Mother | 400 (42.0%) | 3.19 |
| Total Families | 953 (100.0%) | 3.00 |
Median Household Size in Guayanilla
The median household size in Guayanilla is 2.62 persons per household, with single male/father households (143 | 11.5%) accounting for the largest median household size of 3.36 persons per household. non-family households (296 | 23.7%) represent the smallest median household size with 1.07 persons per household.
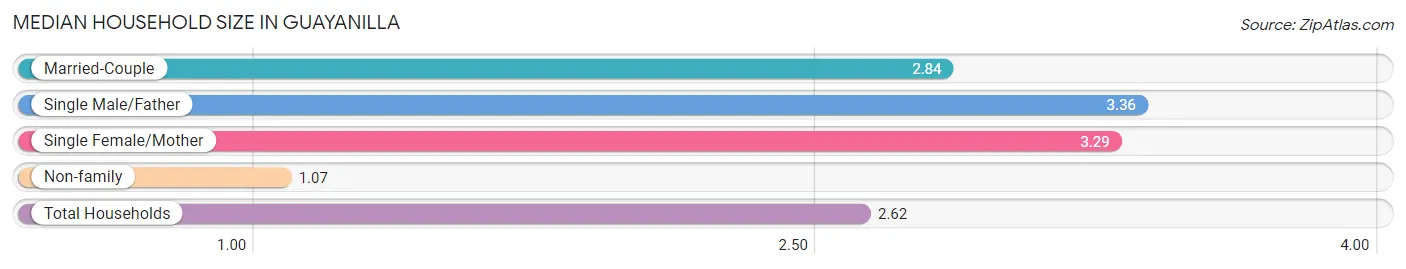
| Household Type | # Households | Household Size |
| Married-Couple | 410 (32.8%) | 2.84 |
| Single Male/Father | 143 (11.5%) | 3.36 |
| Single Female/Mother | 400 (32.0%) | 3.29 |
| Non-family | 296 (23.7%) | 1.07 |
| Total Households | 1,249 (100.0%) | 2.62 |
Household Size by Marriage Status in Guayanilla
Out of a total of 1,249 households in Guayanilla, 953 (76.3%) are family households, while 296 (23.7%) are nonfamily households. The most numerous type of family households are 2-person households, comprising 464, and the most common type of nonfamily households are 1-person households, comprising 275.
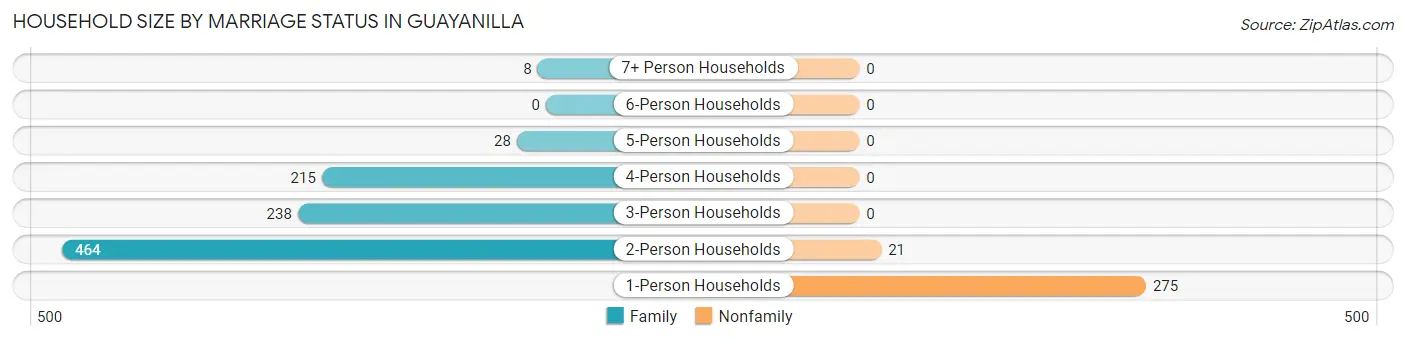
| Household Size | Family Households | Nonfamily Households |
| 1-Person Households | - | 275 (22.0%) |
| 2-Person Households | 464 (37.1%) | 21 (1.7%) |
| 3-Person Households | 238 (19.1%) | 0 (0.0%) |
| 4-Person Households | 215 (17.2%) | 0 (0.0%) |
| 5-Person Households | 28 (2.2%) | 0 (0.0%) |
| 6-Person Households | 0 (0.0%) | 0 (0.0%) |
| 7+ Person Households | 8 (0.6%) | 0 (0.0%) |
| Total | 953 (76.3%) | 296 (23.7%) |
Female Fertility in Guayanilla
Fertility by Age in Guayanilla
| Age Bracket | Women with Births | Births / 1,000 Women |
| 15 to 19 years | 0 (0.0%) | 0.0 |
| 20 to 34 years | 0 (0.0%) | 0.0 |
| 35 to 50 years | 0 (0.0%) | 0.0 |
| Total | 0 (0.0%) | 0.0 |
Fertility by Age by Marriage Status in Guayanilla
| Age Bracket | Married | Unmarried |
| 15 to 19 years | 0 (0.0%) | 0 (0.0%) |
| 20 to 34 years | 0 (0.0%) | 0 (0.0%) |
| 35 to 50 years | 0 (0.0%) | 0 (0.0%) |
| Total | 0 (0.0%) | 0 (0.0%) |
Fertility by Education in Guayanilla
| Educational Attainment | Women with Births | Births / 1,000 Women |
| Less than High School | 0 (0.0%) | 0.0 |
| High School Diploma | 0 (0.0%) | 0.0 |
| College or Associate's Degree | 0 (0.0%) | 0.0 |
| Bachelor's Degree | 0 (0.0%) | 0.0 |
| Graduate Degree | 0 (0.0%) | 0.0 |
| Total | 0 (0.0%) | 0.0 |
Fertility by Education by Marriage Status in Guayanilla
| Educational Attainment | Married | Unmarried |
| Less than High School | 0 (0.0%) | 0 (0.0%) |
| High School Diploma | 0 (0.0%) | 0 (0.0%) |
| College or Associate's Degree | 0 (0.0%) | 0 (0.0%) |
| Bachelor's Degree | 0 (0.0%) | 0 (0.0%) |
| Graduate Degree | 0 (0.0%) | 0 (0.0%) |
| Total | 0 (0.0%) | 0 (0.0%) |
Employment Characteristics in Guayanilla
Employment by Class of Employer in Guayanilla
Among the 735 employed individuals in Guayanilla, private company employees (362 | 49.2%), state government employees (180 | 24.5%), and local government employees (72 | 9.8%) make up the most common classes of employment.
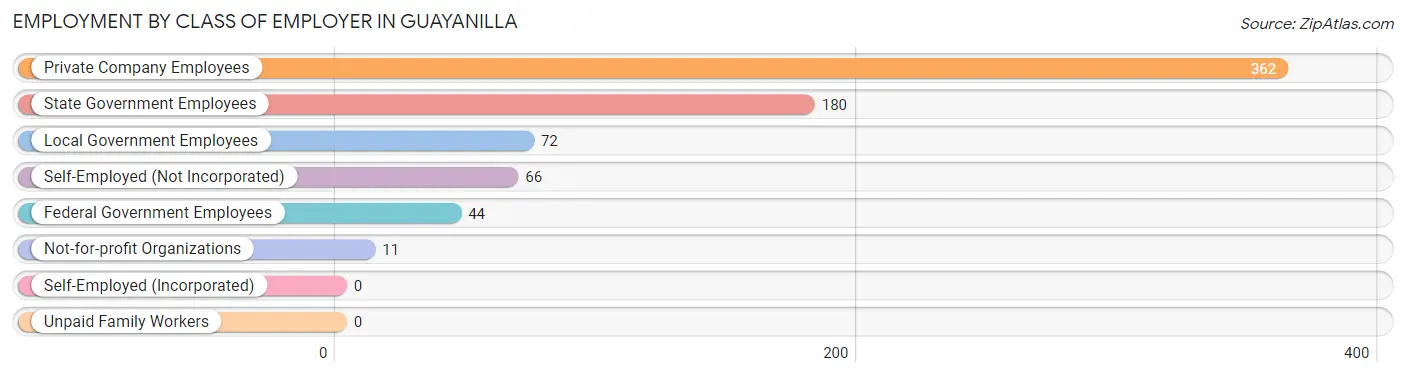
| Employer Class | # Employees | % Employees |
| Private Company Employees | 362 | 49.2% |
| Self-Employed (Incorporated) | 0 | 0.0% |
| Self-Employed (Not Incorporated) | 66 | 9.0% |
| Not-for-profit Organizations | 11 | 1.5% |
| Local Government Employees | 72 | 9.8% |
| State Government Employees | 180 | 24.5% |
| Federal Government Employees | 44 | 6.0% |
| Unpaid Family Workers | 0 | 0.0% |
| Total | 735 | 100.0% |
Employment Status by Age in Guayanilla
According to the labor force statistics for Guayanilla, out of the total population over 16 years of age (2,814), 36.0% or 1,013 individuals are in the labor force, with 25.8% or 261 of them unemployed. The age group with the highest labor force participation rate is 30 to 34 years, with 100.0% or 149 individuals in the labor force. Within the labor force, the 20 to 24 years age range has the highest percentage of unemployed individuals, with 74.0% or 54 of them being unemployed.
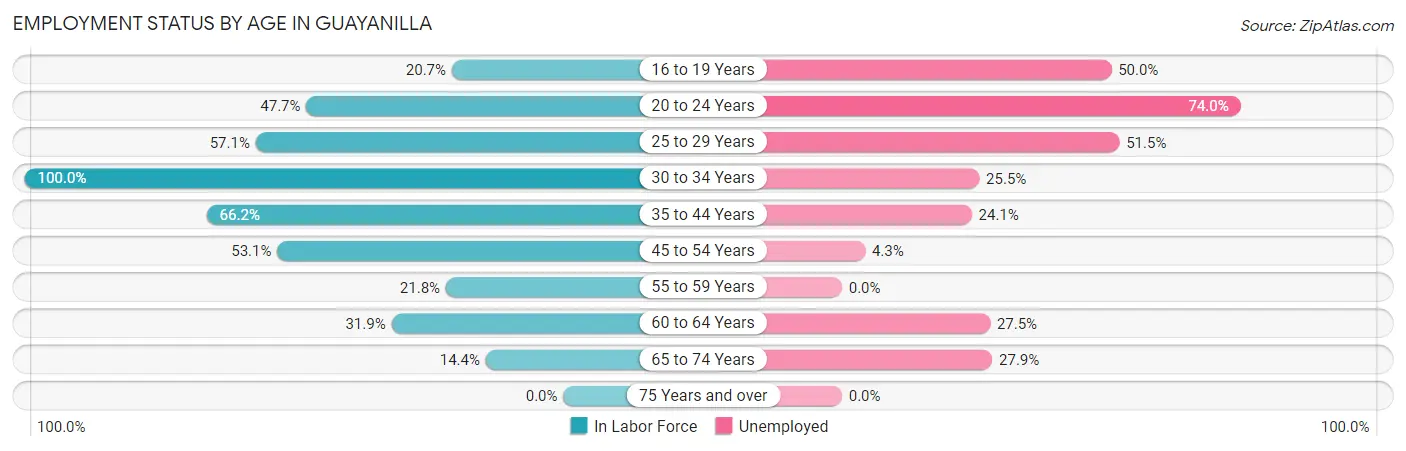
| Age Bracket | In Labor Force | Unemployed |
| 16 to 19 Years | 28 (20.7%) | 14 (50.0%) |
| 20 to 24 Years | 73 (47.7%) | 54 (74.0%) |
| 25 to 29 Years | 97 (57.1%) | 50 (51.5%) |
| 30 to 34 Years | 149 (100.0%) | 38 (25.5%) |
| 35 to 44 Years | 253 (66.2%) | 61 (24.1%) |
| 45 to 54 Years | 257 (53.1%) | 11 (4.3%) |
| 55 to 59 Years | 36 (21.8%) | 0 (0.0%) |
| 60 to 64 Years | 51 (31.9%) | 14 (27.5%) |
| 65 to 74 Years | 68 (14.4%) | 19 (27.9%) |
| 75 Years and over | 0 (0.0%) | 0 (0.0%) |
| Total | 1,013 (36.0%) | 261 (25.8%) |
Employment Status by Educational Attainment in Guayanilla
According to labor force statistics for Guayanilla, 55.8% of individuals (843) out of the total population between 25 and 64 years of age (1,510) are in the labor force, with 20.6% or 174 of them being unemployed. The group with the highest labor force participation rate are those with the educational attainment of bachelor's degree or higher, with 69.4% or 403 individuals in the labor force. Within the labor force, individuals with college / associate degree education have the highest percentage of unemployment, with 30.5% or 62 of them being unemployed.
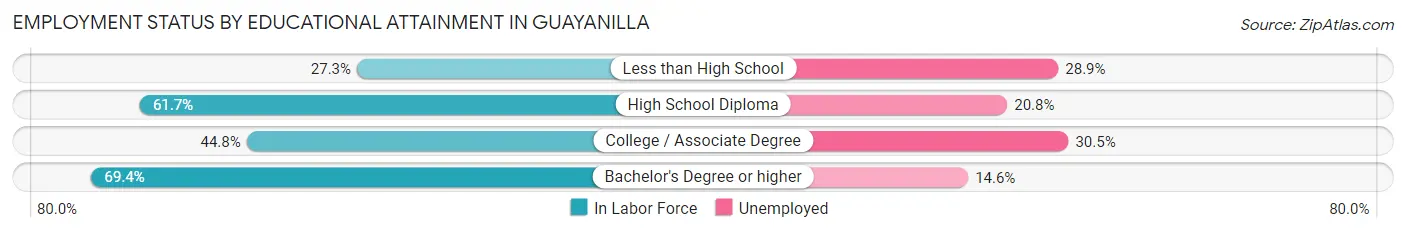
| Educational Attainment | In Labor Force | Unemployed |
| Less than High School | 45 (27.3%) | 48 (28.9%) |
| High School Diploma | 192 (61.7%) | 65 (20.8%) |
| College / Associate Degree | 203 (44.8%) | 138 (30.5%) |
| Bachelor's Degree or higher | 403 (69.4%) | 85 (14.6%) |
| Total | 843 (55.8%) | 311 (20.6%) |
Employment Occupations by Sex in Guayanilla
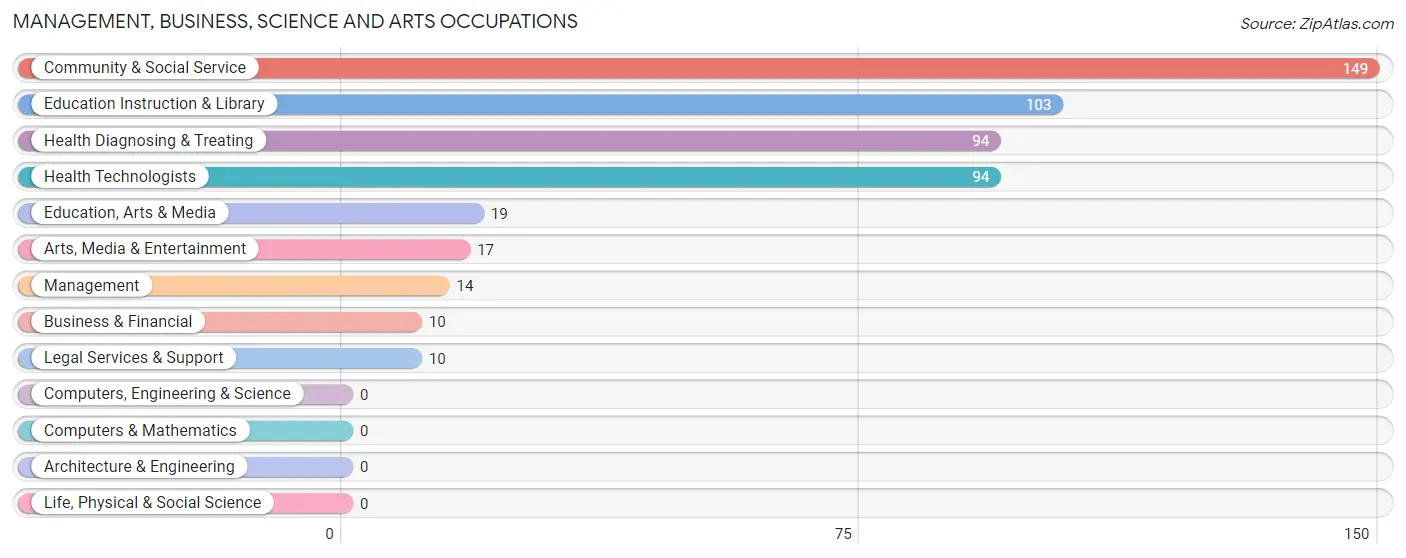
Management, Business, Science and Arts Occupations
The most common Management, Business, Science and Arts occupations in Guayanilla are Community & Social Service (149 | 19.8%), Education Instruction & Library (103 | 13.7%), Health Diagnosing & Treating (94 | 12.5%), Health Technologists (94 | 12.5%), and Education, Arts & Media (19 | 2.5%).
Management, Business, Science and Arts Occupations by Sex
Within the Management, Business, Science and Arts occupations in Guayanilla, the most male-oriented occupations are Business & Financial (100.0%), Arts, Media & Entertainment (100.0%), and Education Instruction & Library (42.7%), while the most female-oriented occupations are Management (100.0%), Education, Arts & Media (100.0%), and Legal Services & Support (100.0%).
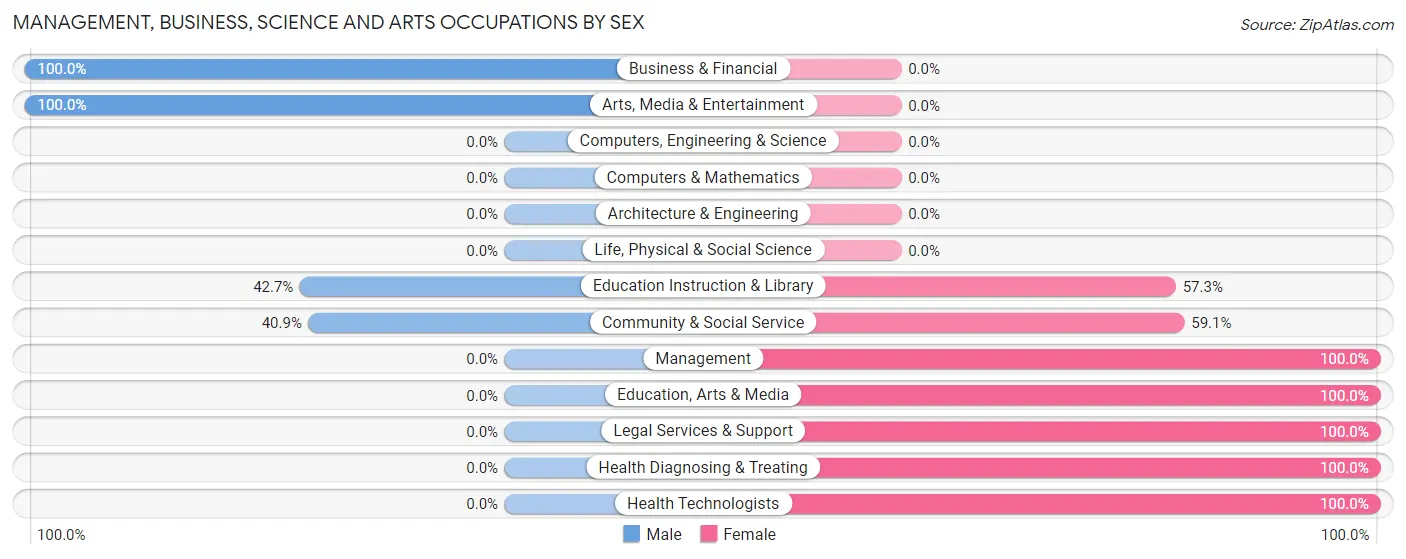
| Occupation | Male | Female |
| Management | 0 (0.0%) | 14 (100.0%) |
| Business & Financial | 10 (100.0%) | 0 (0.0%) |
| Computers, Engineering & Science | 0 (0.0%) | 0 (0.0%) |
| Computers & Mathematics | 0 (0.0%) | 0 (0.0%) |
| Architecture & Engineering | 0 (0.0%) | 0 (0.0%) |
| Life, Physical & Social Science | 0 (0.0%) | 0 (0.0%) |
| Community & Social Service | 61 (40.9%) | 88 (59.1%) |
| Education, Arts & Media | 0 (0.0%) | 19 (100.0%) |
| Legal Services & Support | 0 (0.0%) | 10 (100.0%) |
| Education Instruction & Library | 44 (42.7%) | 59 (57.3%) |
| Arts, Media & Entertainment | 17 (100.0%) | 0 (0.0%) |
| Health Diagnosing & Treating | 0 (0.0%) | 94 (100.0%) |
| Health Technologists | 0 (0.0%) | 94 (100.0%) |
| Total (Category) | 71 (26.6%) | 196 (73.4%) |
| Total (Overall) | 364 (48.5%) | 387 (51.5%) |
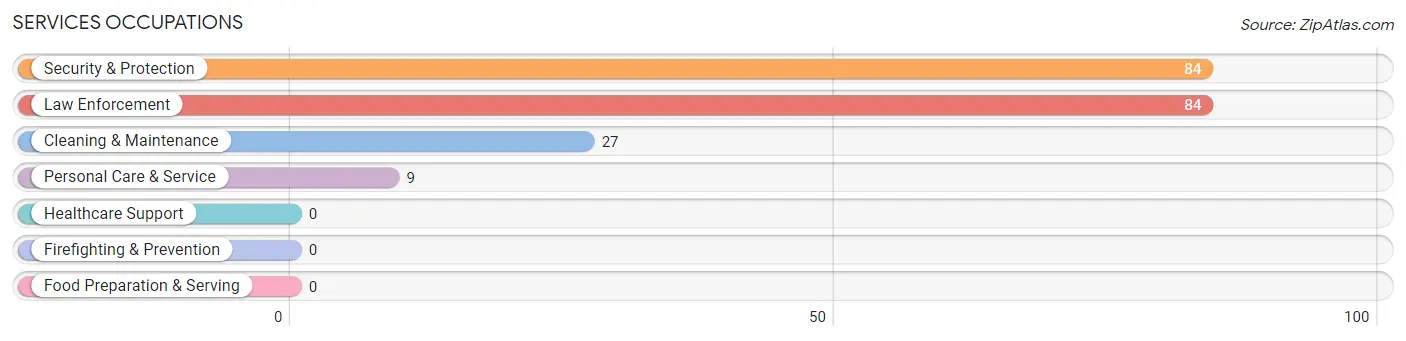
Services Occupations
The most common Services occupations in Guayanilla are Security & Protection (84 | 11.2%), Law Enforcement (84 | 11.2%), Cleaning & Maintenance (27 | 3.6%), and Personal Care & Service (9 | 1.2%).
Services Occupations by Sex
Within the Services occupations in Guayanilla, the most male-oriented occupations are Cleaning & Maintenance (100.0%), Security & Protection (86.9%), and Law Enforcement (86.9%), while the most female-oriented occupations are Personal Care & Service (100.0%), Security & Protection (13.1%), and Law Enforcement (13.1%).
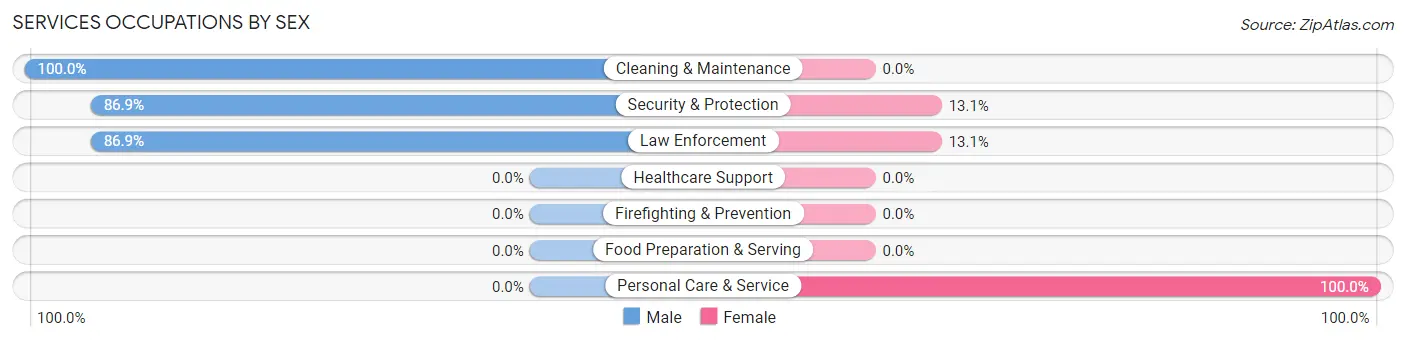
| Occupation | Male | Female |
| Healthcare Support | 0 (0.0%) | 0 (0.0%) |
| Security & Protection | 73 (86.9%) | 11 (13.1%) |
| Firefighting & Prevention | 0 (0.0%) | 0 (0.0%) |
| Law Enforcement | 73 (86.9%) | 11 (13.1%) |
| Food Preparation & Serving | 0 (0.0%) | 0 (0.0%) |
| Cleaning & Maintenance | 27 (100.0%) | 0 (0.0%) |
| Personal Care & Service | 0 (0.0%) | 9 (100.0%) |
| Total (Category) | 100 (83.3%) | 20 (16.7%) |
| Total (Overall) | 364 (48.5%) | 387 (51.5%) |
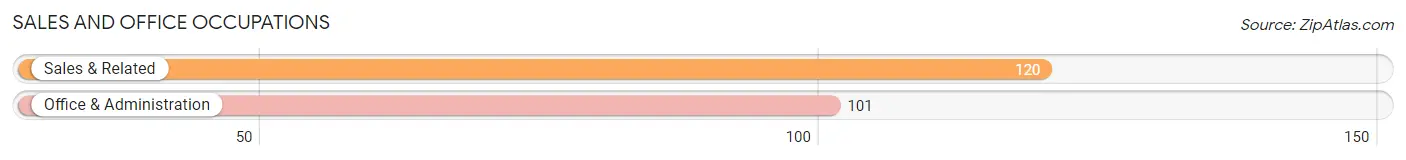
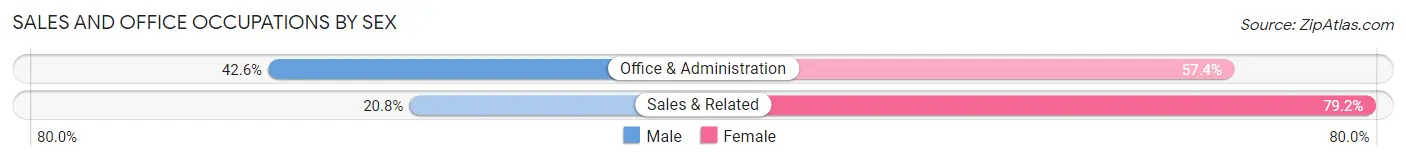
Sales and Office Occupations
The most common Sales and Office occupations in Guayanilla are Sales & Related (120 | 16.0%), and Office & Administration (101 | 13.5%).
Sales and Office Occupations by Sex
| Occupation | Male | Female |
| Sales & Related | 25 (20.8%) | 95 (79.2%) |
| Office & Administration | 43 (42.6%) | 58 (57.4%) |
| Total (Category) | 68 (30.8%) | 153 (69.2%) |
| Total (Overall) | 364 (48.5%) | 387 (51.5%) |
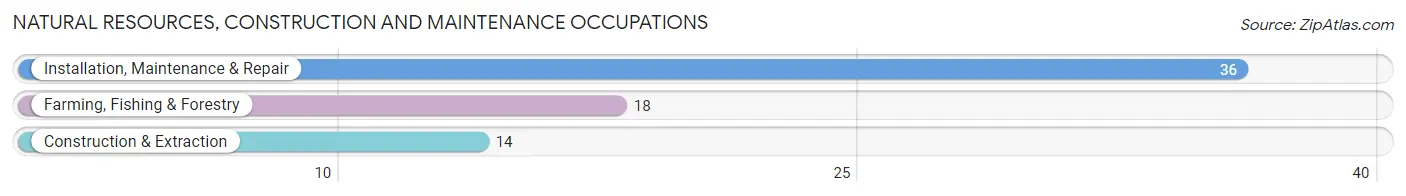
Natural Resources, Construction and Maintenance Occupations
The most common Natural Resources, Construction and Maintenance occupations in Guayanilla are Installation, Maintenance & Repair (36 | 4.8%), Farming, Fishing & Forestry (18 | 2.4%), and Construction & Extraction (14 | 1.9%).
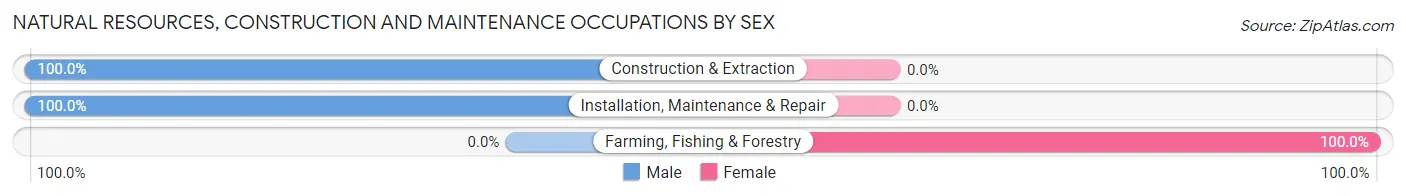
Natural Resources, Construction and Maintenance Occupations by Sex
| Occupation | Male | Female |
| Farming, Fishing & Forestry | 0 (0.0%) | 18 (100.0%) |
| Construction & Extraction | 14 (100.0%) | 0 (0.0%) |
| Installation, Maintenance & Repair | 36 (100.0%) | 0 (0.0%) |
| Total (Category) | 50 (73.5%) | 18 (26.5%) |
| Total (Overall) | 364 (48.5%) | 387 (51.5%) |
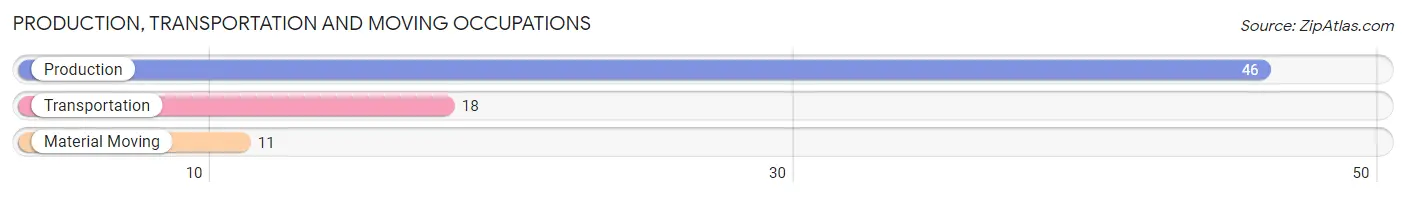
Production, Transportation and Moving Occupations
The most common Production, Transportation and Moving occupations in Guayanilla are Production (46 | 6.1%), Transportation (18 | 2.4%), and Material Moving (11 | 1.5%).
Production, Transportation and Moving Occupations by Sex
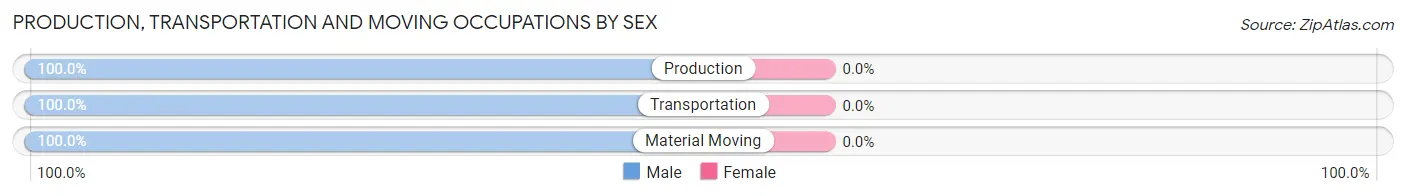
| Occupation | Male | Female |
| Production | 46 (100.0%) | 0 (0.0%) |
| Transportation | 18 (100.0%) | 0 (0.0%) |
| Material Moving | 11 (100.0%) | 0 (0.0%) |
| Total (Category) | 75 (100.0%) | 0 (0.0%) |
| Total (Overall) | 364 (48.5%) | 387 (51.5%) |
Employment Industries by Sex in Guayanilla
Employment Industries in Guayanilla
The major employment industries in Guayanilla include Retail Trade (149 | 19.8%), Public Administration (142 | 18.9%), Health Care & Social Assistance (114 | 15.2%), Educational Services (83 | 11.1%), and Manufacturing (59 | 7.9%).
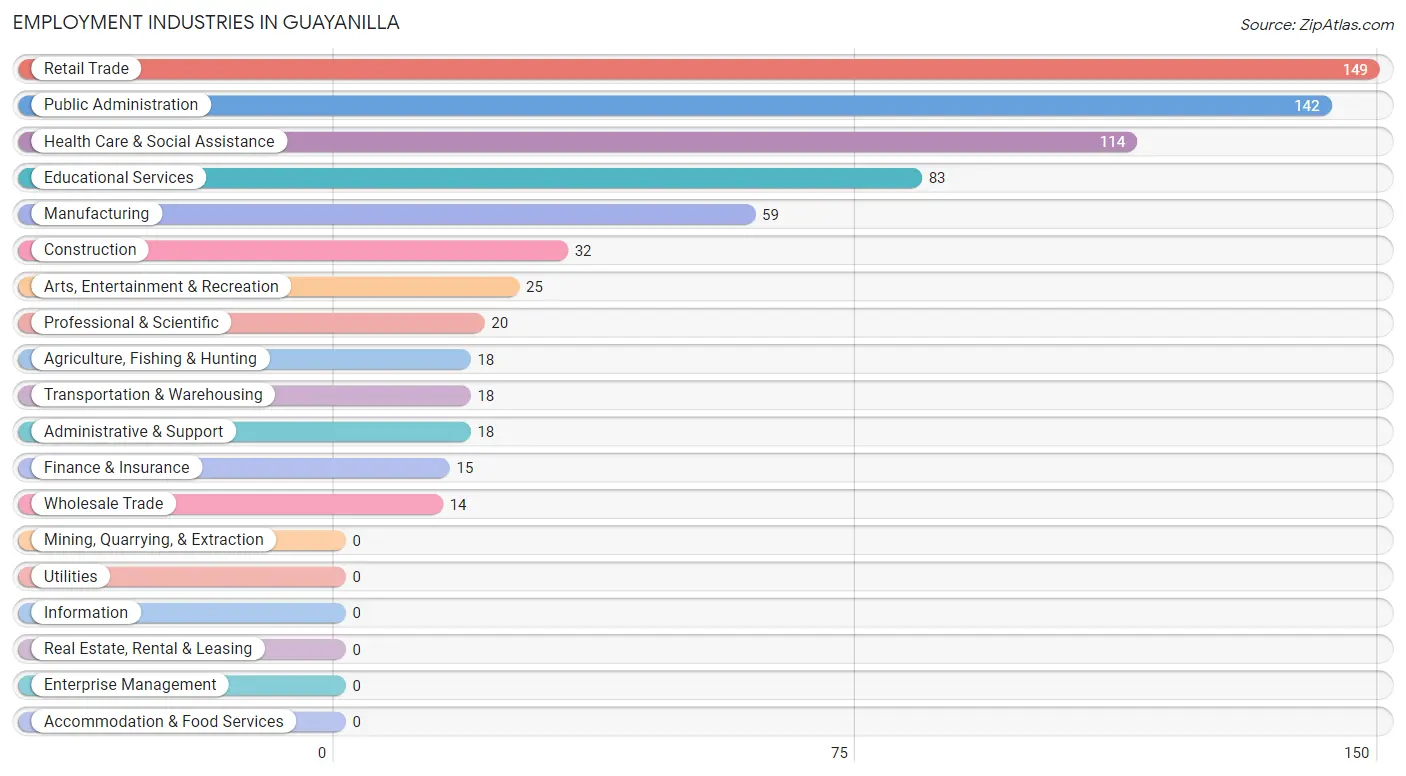
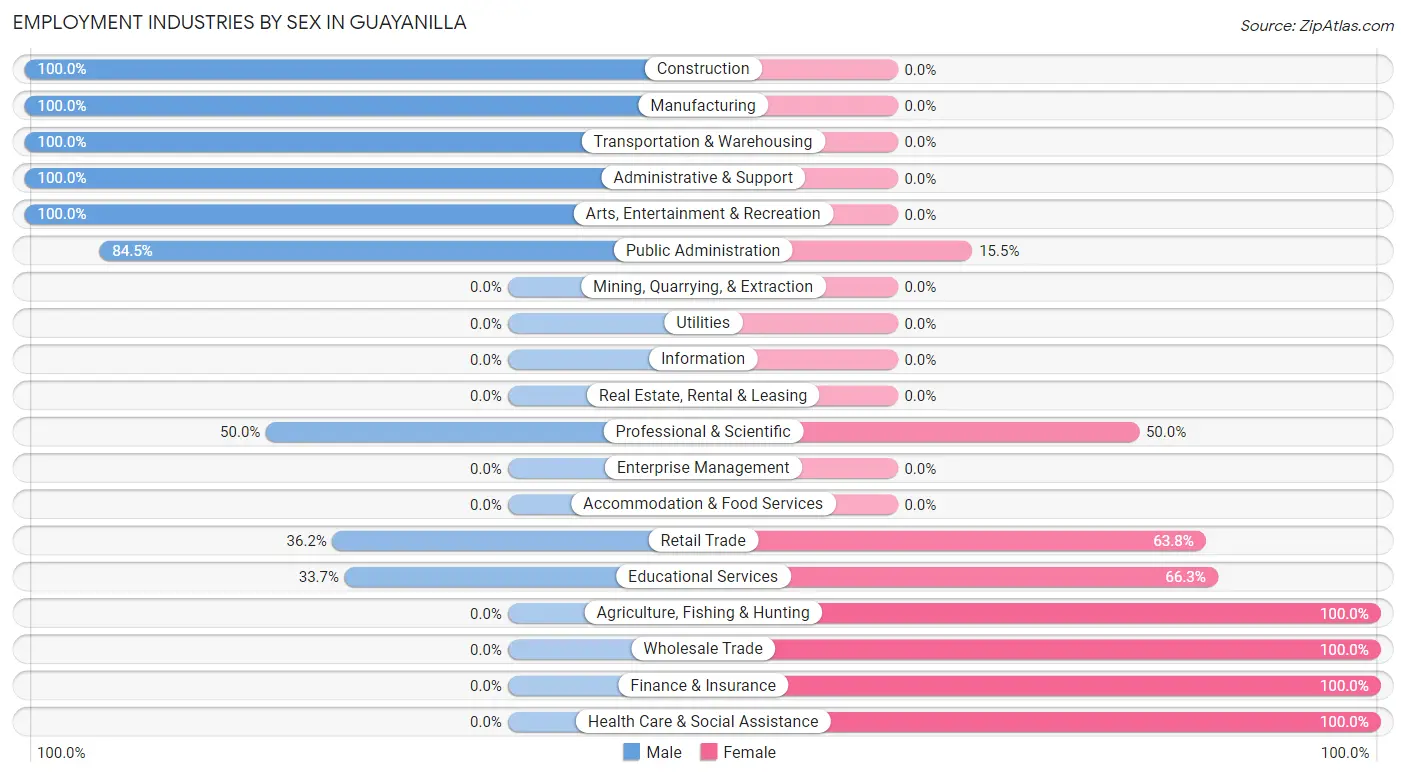
Employment Industries by Sex in Guayanilla
The Guayanilla industries that see more men than women are Construction (100.0%), Manufacturing (100.0%), and Transportation & Warehousing (100.0%), whereas the industries that tend to have a higher number of women are Agriculture, Fishing & Hunting (100.0%), Wholesale Trade (100.0%), and Finance & Insurance (100.0%).
| Industry | Male | Female |
| Agriculture, Fishing & Hunting | 0 (0.0%) | 18 (100.0%) |
| Mining, Quarrying, & Extraction | 0 (0.0%) | 0 (0.0%) |
| Construction | 32 (100.0%) | 0 (0.0%) |
| Manufacturing | 59 (100.0%) | 0 (0.0%) |
| Wholesale Trade | 0 (0.0%) | 14 (100.0%) |
| Retail Trade | 54 (36.2%) | 95 (63.8%) |
| Transportation & Warehousing | 18 (100.0%) | 0 (0.0%) |
| Utilities | 0 (0.0%) | 0 (0.0%) |
| Information | 0 (0.0%) | 0 (0.0%) |
| Finance & Insurance | 0 (0.0%) | 15 (100.0%) |
| Real Estate, Rental & Leasing | 0 (0.0%) | 0 (0.0%) |
| Professional & Scientific | 10 (50.0%) | 10 (50.0%) |
| Enterprise Management | 0 (0.0%) | 0 (0.0%) |
| Administrative & Support | 18 (100.0%) | 0 (0.0%) |
| Educational Services | 28 (33.7%) | 55 (66.3%) |
| Health Care & Social Assistance | 0 (0.0%) | 114 (100.0%) |
| Arts, Entertainment & Recreation | 25 (100.0%) | 0 (0.0%) |
| Accommodation & Food Services | 0 (0.0%) | 0 (0.0%) |
| Public Administration | 120 (84.5%) | 22 (15.5%) |
| Total | 364 (48.5%) | 387 (51.5%) |
Education in Guayanilla
School Enrollment in Guayanilla
The most common levels of schooling among the 756 students in Guayanilla are elementary school (227 | 30.0%), college / undergraduate (186 | 24.6%), and middle school (145 | 19.2%).
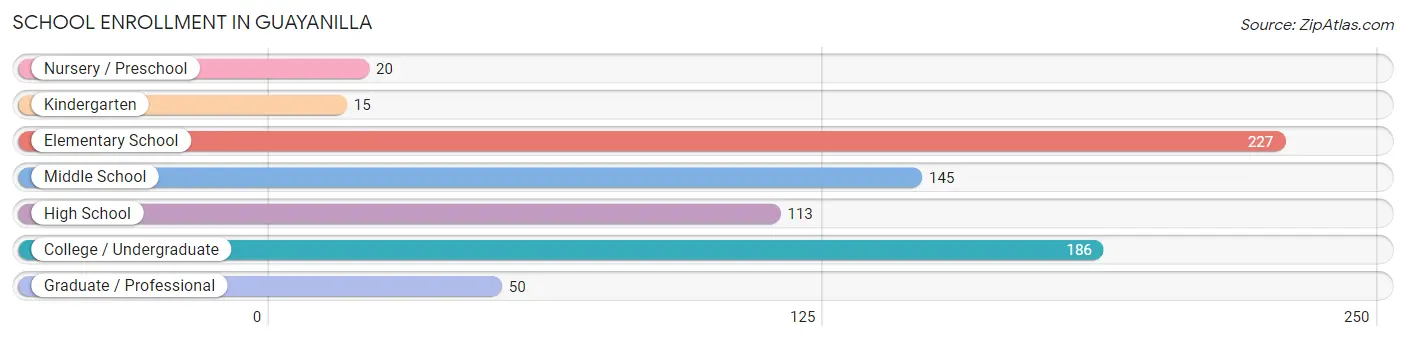
| School Level | # Students | % Students |
| Nursery / Preschool | 20 | 2.6% |
| Kindergarten | 15 | 2.0% |
| Elementary School | 227 | 30.0% |
| Middle School | 145 | 19.2% |
| High School | 113 | 14.9% |
| College / Undergraduate | 186 | 24.6% |
| Graduate / Professional | 50 | 6.6% |
| Total | 756 | 100.0% |
School Enrollment by Age by Funding Source in Guayanilla
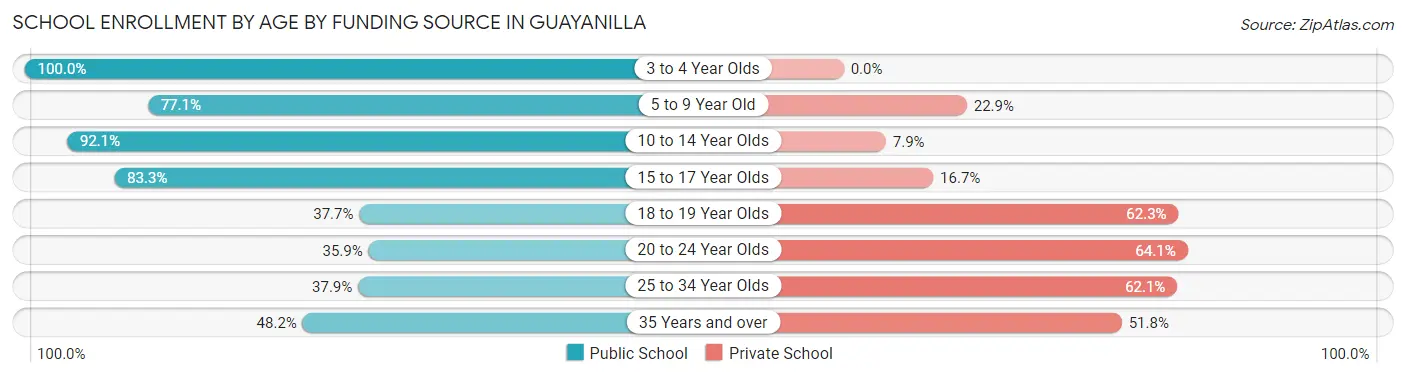
Out of a total of 756 students who are enrolled in schools in Guayanilla, 240 (31.7%) attend a private institution, while the remaining 516 (68.3%) are enrolled in public schools. The age group of 20 to 24 year olds has the highest likelihood of being enrolled in private schools, with 41 (64.1% in the age bracket) enrolled. Conversely, the age group of 3 to 4 year olds has the lowest likelihood of being enrolled in a private school, with 20 (100.0% in the age bracket) attending a public institution.
| Age Bracket | Public School | Private School |
| 3 to 4 Year Olds | 20 (100.0%) | 0 (0.0%) |
| 5 to 9 Year Old | 178 (77.1%) | 53 (22.9%) |
| 10 to 14 Year Olds | 129 (92.1%) | 11 (7.9%) |
| 15 to 17 Year Olds | 85 (83.3%) | 17 (16.7%) |
| 18 to 19 Year Olds | 29 (37.7%) | 48 (62.3%) |
| 20 to 24 Year Olds | 23 (35.9%) | 41 (64.1%) |
| 25 to 34 Year Olds | 25 (37.9%) | 41 (62.1%) |
| 35 Years and over | 27 (48.2%) | 29 (51.8%) |
| Total | 516 (68.3%) | 240 (31.7%) |
Educational Attainment by Field of Study in Guayanilla
Education (296 | 31.0%), science & technology (153 | 16.0%), arts & humanities (100 | 10.5%), physical & health sciences (94 | 9.8%), and social sciences (83 | 8.7%) are the most common fields of study among 956 individuals in Guayanilla who have obtained a bachelor's degree or higher.
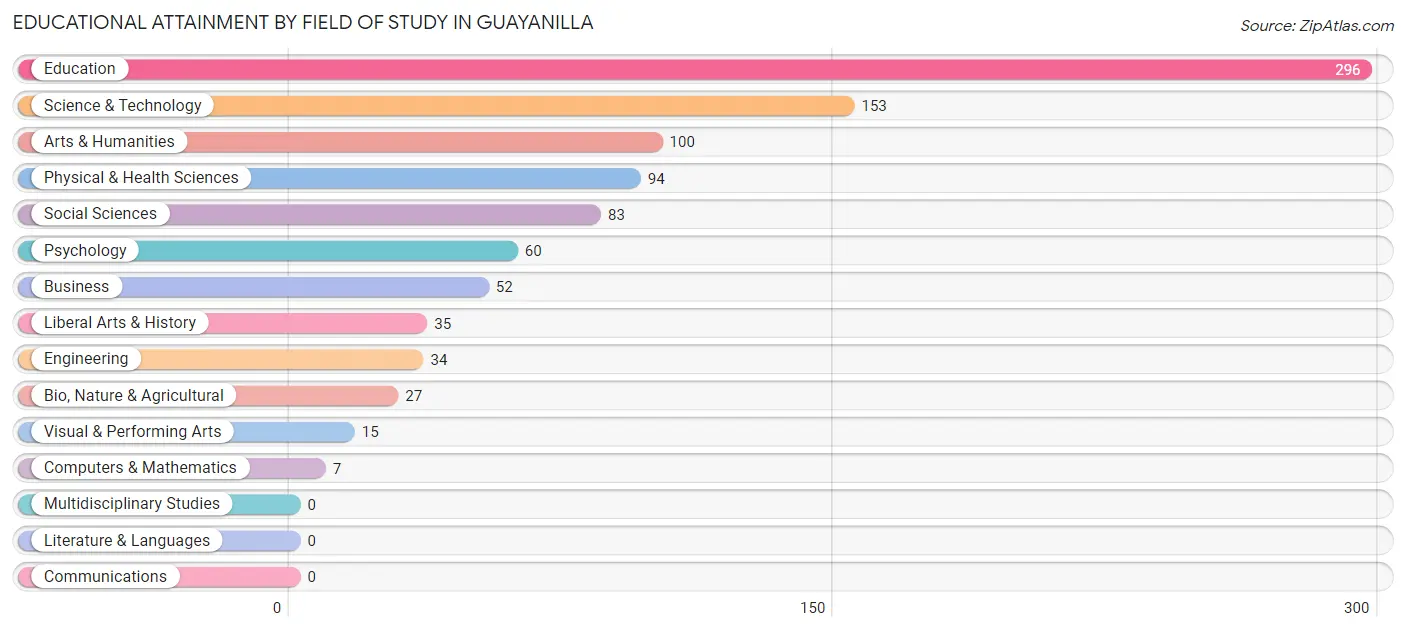
| Field of Study | # Graduates | % Graduates |
| Computers & Mathematics | 7 | 0.7% |
| Bio, Nature & Agricultural | 27 | 2.8% |
| Physical & Health Sciences | 94 | 9.8% |
| Psychology | 60 | 6.3% |
| Social Sciences | 83 | 8.7% |
| Engineering | 34 | 3.6% |
| Multidisciplinary Studies | 0 | 0.0% |
| Science & Technology | 153 | 16.0% |
| Business | 52 | 5.4% |
| Education | 296 | 31.0% |
| Literature & Languages | 0 | 0.0% |
| Liberal Arts & History | 35 | 3.7% |
| Visual & Performing Arts | 15 | 1.6% |
| Communications | 0 | 0.0% |
| Arts & Humanities | 100 | 10.5% |
| Total | 956 | 100.0% |
Transportation & Commute in Guayanilla
Vehicle Availability by Sex in Guayanilla
The most prevalent vehicle ownership categories in Guayanilla are males with 2 vehicles (154, accounting for 44.3%) and females with 2 vehicles (203, making up 39.8%).
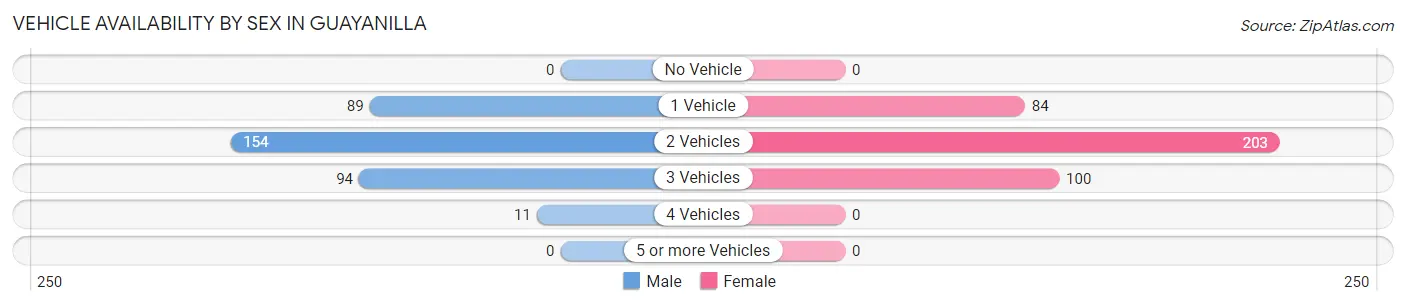
| Vehicles Available | Male | Female |
| No Vehicle | 0 (0.0%) | 0 (0.0%) |
| 1 Vehicle | 89 (25.6%) | 84 (21.7%) |
| 2 Vehicles | 154 (44.3%) | 203 (52.4%) |
| 3 Vehicles | 94 (27.0%) | 100 (25.8%) |
| 4 Vehicles | 11 (3.2%) | 0 (0.0%) |
| 5 or more Vehicles | 0 (0.0%) | 0 (0.0%) |
| Total | 348 (100.0%) | 387 (100.0%) |
Commute Time in Guayanilla
The most frequently occuring commute durations in Guayanilla are 15 to 19 minutes (241 commuters, 32.8%), 10 to 14 minutes (171 commuters, 23.3%), and 30 to 34 minutes (79 commuters, 10.7%).
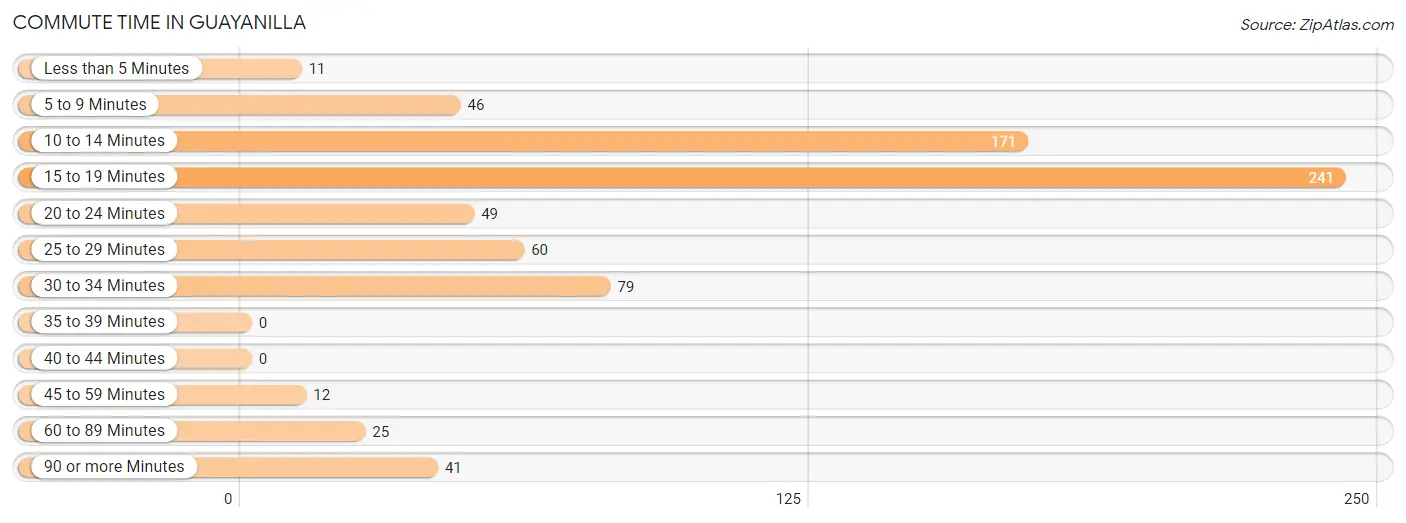
| Commute Time | # Commuters | % Commuters |
| Less than 5 Minutes | 11 | 1.5% |
| 5 to 9 Minutes | 46 | 6.3% |
| 10 to 14 Minutes | 171 | 23.3% |
| 15 to 19 Minutes | 241 | 32.8% |
| 20 to 24 Minutes | 49 | 6.7% |
| 25 to 29 Minutes | 60 | 8.2% |
| 30 to 34 Minutes | 79 | 10.7% |
| 35 to 39 Minutes | 0 | 0.0% |
| 40 to 44 Minutes | 0 | 0.0% |
| 45 to 59 Minutes | 12 | 1.6% |
| 60 to 89 Minutes | 25 | 3.4% |
| 90 or more Minutes | 41 | 5.6% |
Commute Time by Sex in Guayanilla
The most common commute times in Guayanilla are 15 to 19 minutes (93 commuters, 26.7%) for males and 15 to 19 minutes (148 commuters, 38.2%) for females.
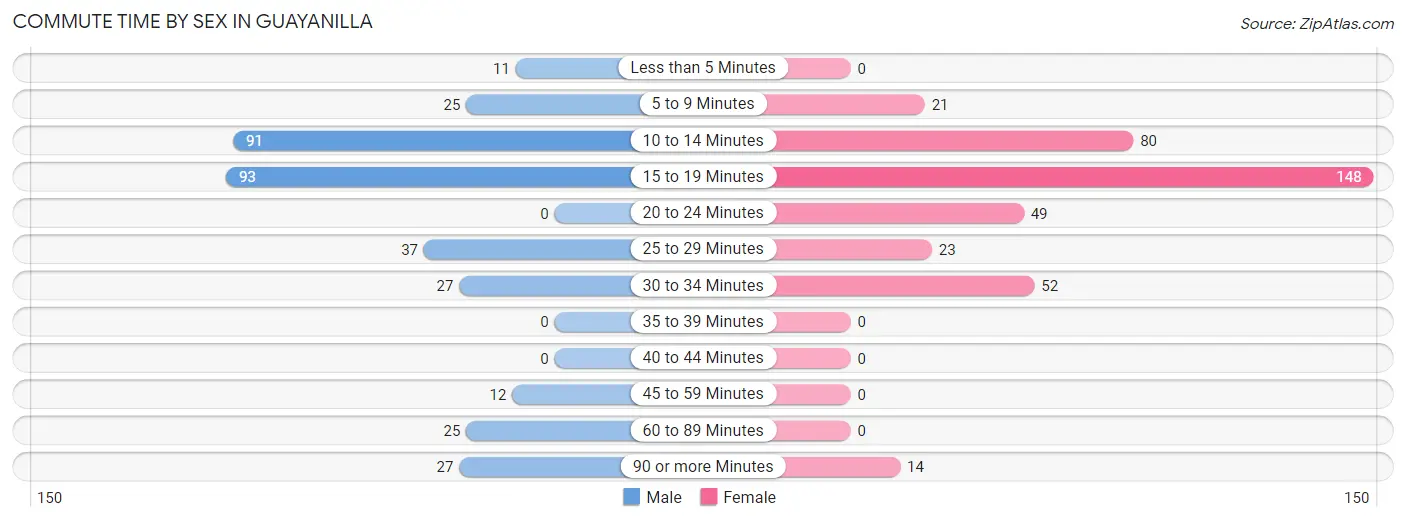
| Commute Time | Male | Female |
| Less than 5 Minutes | 11 (3.2%) | 0 (0.0%) |
| 5 to 9 Minutes | 25 (7.2%) | 21 (5.4%) |
| 10 to 14 Minutes | 91 (26.2%) | 80 (20.7%) |
| 15 to 19 Minutes | 93 (26.7%) | 148 (38.2%) |
| 20 to 24 Minutes | 0 (0.0%) | 49 (12.7%) |
| 25 to 29 Minutes | 37 (10.6%) | 23 (5.9%) |
| 30 to 34 Minutes | 27 (7.8%) | 52 (13.4%) |
| 35 to 39 Minutes | 0 (0.0%) | 0 (0.0%) |
| 40 to 44 Minutes | 0 (0.0%) | 0 (0.0%) |
| 45 to 59 Minutes | 12 (3.5%) | 0 (0.0%) |
| 60 to 89 Minutes | 25 (7.2%) | 0 (0.0%) |
| 90 or more Minutes | 27 (7.8%) | 14 (3.6%) |
Time of Departure to Work by Sex in Guayanilla
The most frequent times of departure to work in Guayanilla are 7:30 AM to 7:59 AM (75, 21.5%) for males and 6:30 AM to 6:59 AM (149, 38.5%) for females.
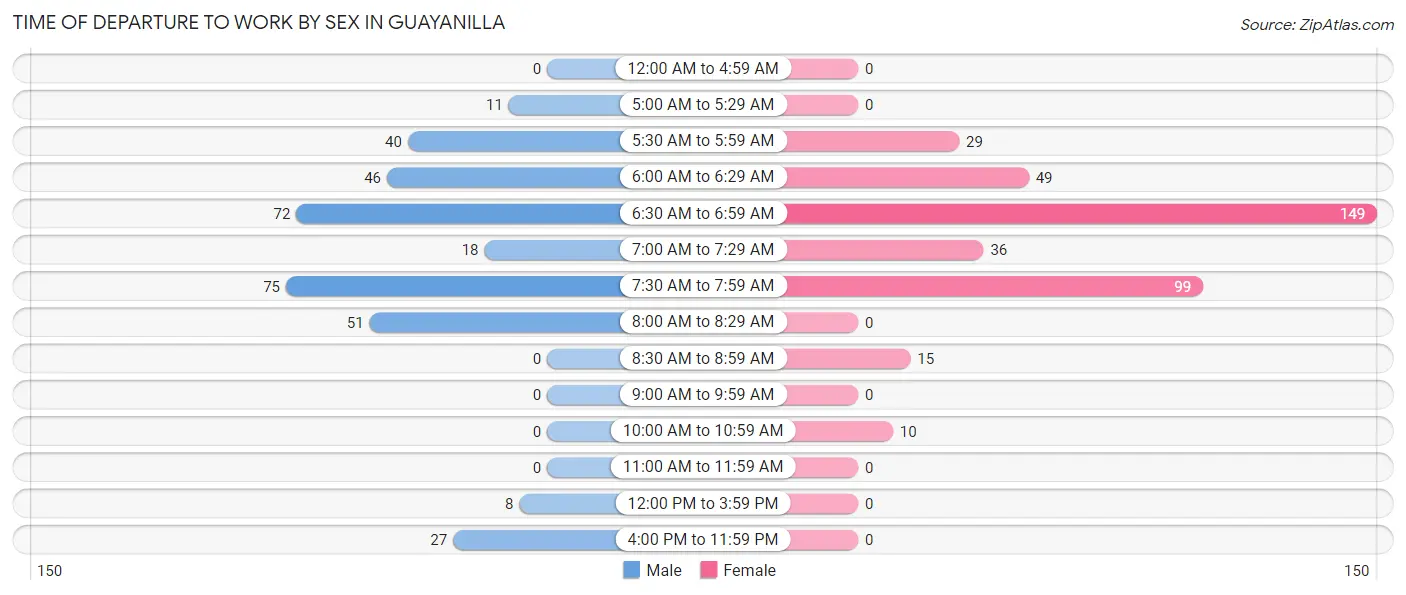
| Time of Departure | Male | Female |
| 12:00 AM to 4:59 AM | 0 (0.0%) | 0 (0.0%) |
| 5:00 AM to 5:29 AM | 11 (3.2%) | 0 (0.0%) |
| 5:30 AM to 5:59 AM | 40 (11.5%) | 29 (7.5%) |
| 6:00 AM to 6:29 AM | 46 (13.2%) | 49 (12.7%) |
| 6:30 AM to 6:59 AM | 72 (20.7%) | 149 (38.5%) |
| 7:00 AM to 7:29 AM | 18 (5.2%) | 36 (9.3%) |
| 7:30 AM to 7:59 AM | 75 (21.5%) | 99 (25.6%) |
| 8:00 AM to 8:29 AM | 51 (14.7%) | 0 (0.0%) |
| 8:30 AM to 8:59 AM | 0 (0.0%) | 15 (3.9%) |
| 9:00 AM to 9:59 AM | 0 (0.0%) | 0 (0.0%) |
| 10:00 AM to 10:59 AM | 0 (0.0%) | 10 (2.6%) |
| 11:00 AM to 11:59 AM | 0 (0.0%) | 0 (0.0%) |
| 12:00 PM to 3:59 PM | 8 (2.3%) | 0 (0.0%) |
| 4:00 PM to 11:59 PM | 27 (7.8%) | 0 (0.0%) |
| Total | 348 (100.0%) | 387 (100.0%) |
Housing Occupancy in Guayanilla
Occupancy by Ownership in Guayanilla
Of the total 1,249 dwellings in Guayanilla, owner-occupied units account for 918 (73.5%), while renter-occupied units make up 331 (26.5%).
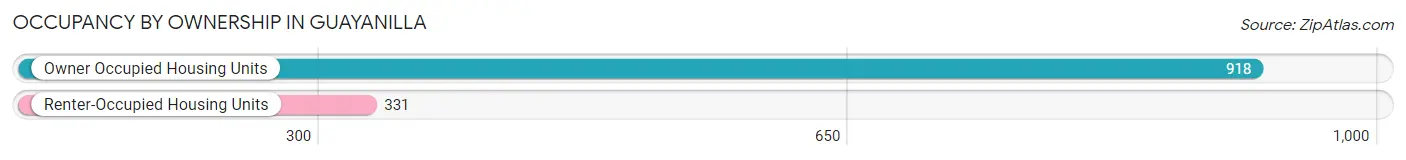
| Occupancy | # Housing Units | % Housing Units |
| Owner Occupied Housing Units | 918 | 73.5% |
| Renter-Occupied Housing Units | 331 | 26.5% |
| Total Occupied Housing Units | 1,249 | 100.0% |
Occupancy by Household Size in Guayanilla
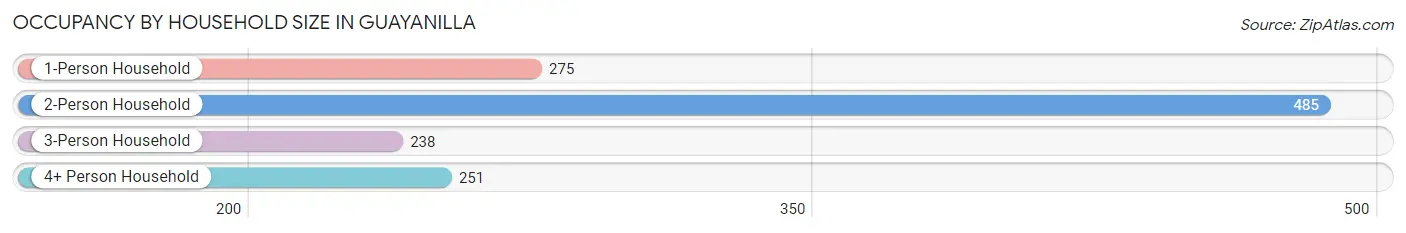
| Household Size | # Housing Units | % Housing Units |
| 1-Person Household | 275 | 22.0% |
| 2-Person Household | 485 | 38.8% |
| 3-Person Household | 238 | 19.1% |
| 4+ Person Household | 251 | 20.1% |
| Total Housing Units | 1,249 | 100.0% |
Occupancy by Ownership by Household Size in Guayanilla
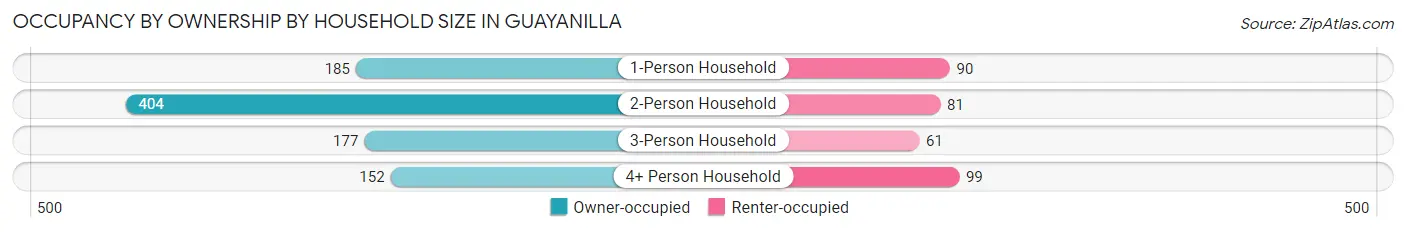
| Household Size | Owner-occupied | Renter-occupied |
| 1-Person Household | 185 (67.3%) | 90 (32.7%) |
| 2-Person Household | 404 (83.3%) | 81 (16.7%) |
| 3-Person Household | 177 (74.4%) | 61 (25.6%) |
| 4+ Person Household | 152 (60.6%) | 99 (39.4%) |
| Total Housing Units | 918 (73.5%) | 331 (26.5%) |
Occupancy by Educational Attainment in Guayanilla
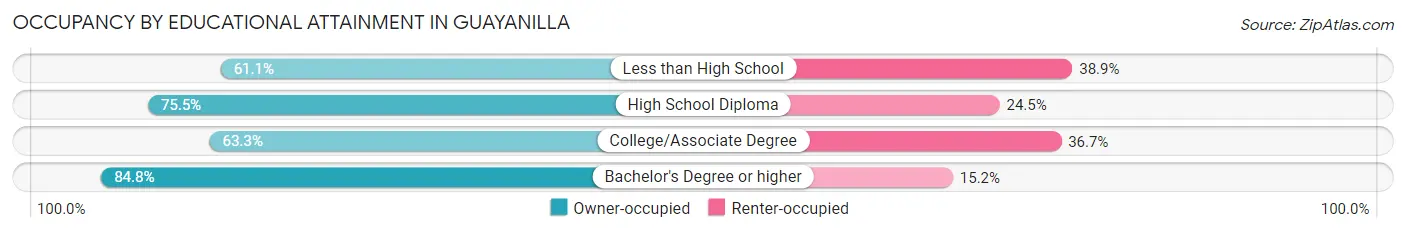
| Household Size | Owner-occupied | Renter-occupied |
| Less than High School | 121 (61.1%) | 77 (38.9%) |
| High School Diploma | 210 (75.5%) | 68 (24.5%) |
| College/Associate Degree | 202 (63.3%) | 117 (36.7%) |
| Bachelor's Degree or higher | 385 (84.8%) | 69 (15.2%) |
Occupancy by Age of Householder in Guayanilla
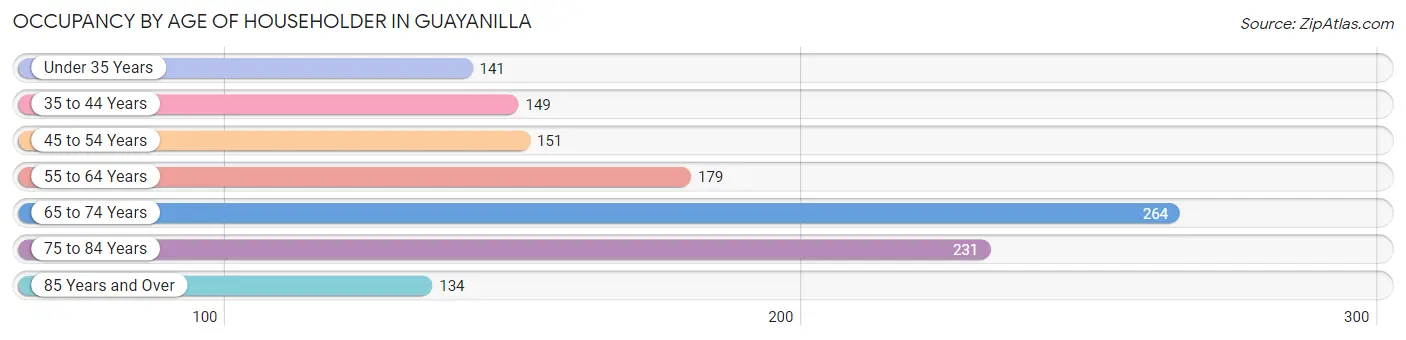
| Age Bracket | # Households | % Households |
| Under 35 Years | 141 | 11.3% |
| 35 to 44 Years | 149 | 11.9% |
| 45 to 54 Years | 151 | 12.1% |
| 55 to 64 Years | 179 | 14.3% |
| 65 to 74 Years | 264 | 21.1% |
| 75 to 84 Years | 231 | 18.5% |
| 85 Years and Over | 134 | 10.7% |
| Total | 1,249 | 100.0% |
Housing Finances in Guayanilla
Median Income by Occupancy in Guayanilla
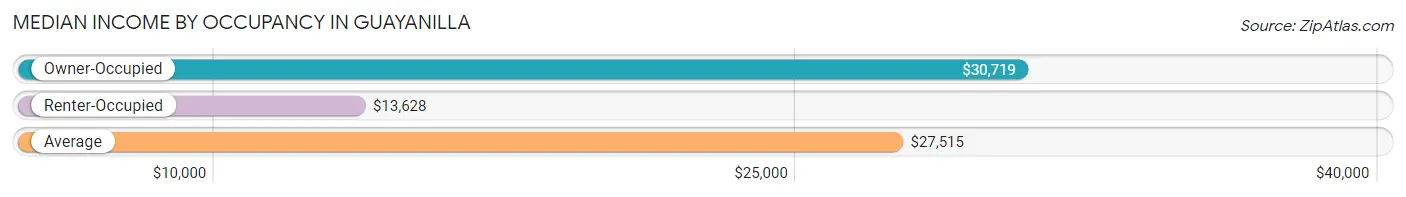
| Occupancy Type | # Households | Median Income |
| Owner-Occupied | 918 (73.5%) | $30,719 |
| Renter-Occupied | 331 (26.5%) | $13,628 |
| Average | 1,249 (100.0%) | $27,515 |
Occupancy by Householder Income Bracket in Guayanilla
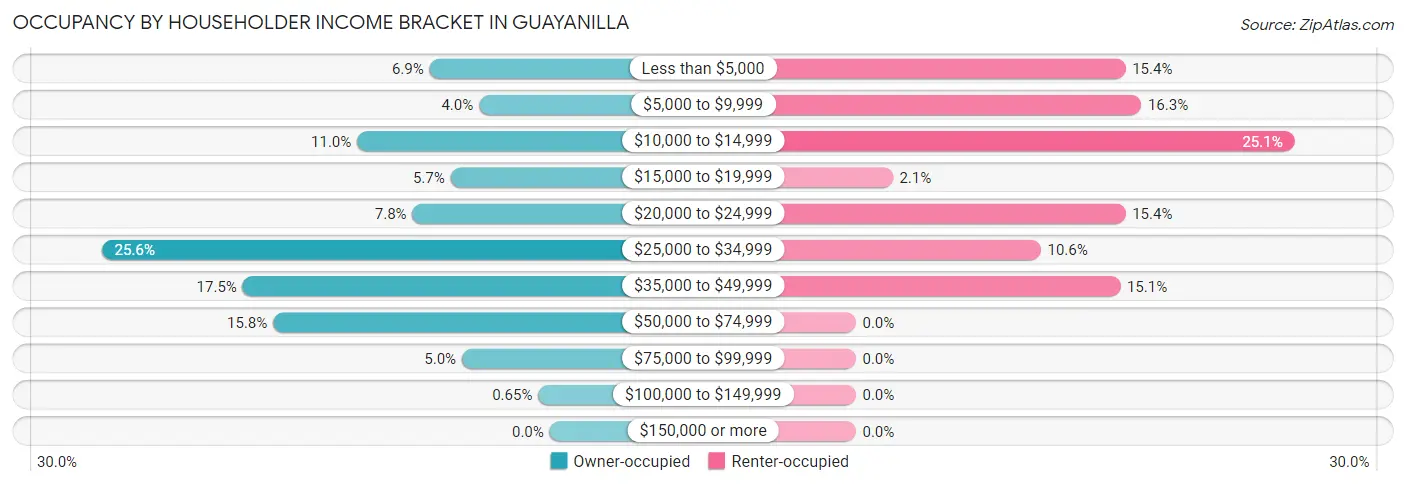
| Income Bracket | Owner-occupied | Renter-occupied |
| Less than $5,000 | 63 (6.9%) | 51 (15.4%) |
| $5,000 to $9,999 | 37 (4.0%) | 54 (16.3%) |
| $10,000 to $14,999 | 101 (11.0%) | 83 (25.1%) |
| $15,000 to $19,999 | 52 (5.7%) | 7 (2.1%) |
| $20,000 to $24,999 | 72 (7.8%) | 51 (15.4%) |
| $25,000 to $34,999 | 235 (25.6%) | 35 (10.6%) |
| $35,000 to $49,999 | 161 (17.5%) | 50 (15.1%) |
| $50,000 to $74,999 | 145 (15.8%) | 0 (0.0%) |
| $75,000 to $99,999 | 46 (5.0%) | 0 (0.0%) |
| $100,000 to $149,999 | 6 (0.6%) | 0 (0.0%) |
| $150,000 or more | 0 (0.0%) | 0 (0.0%) |
| Total | 918 (100.0%) | 331 (100.0%) |
Monthly Housing Cost Tiers in Guayanilla
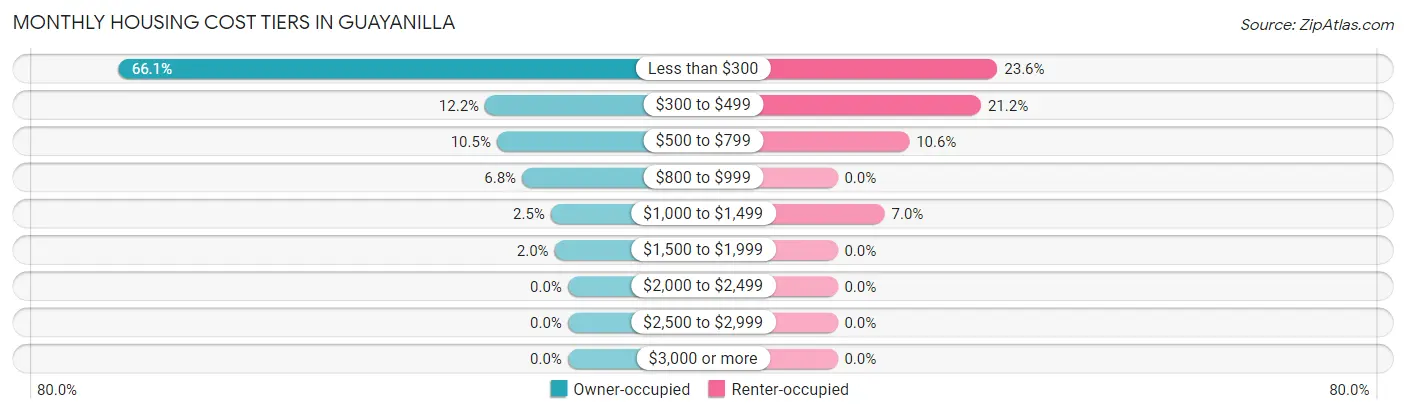
| Monthly Cost | Owner-occupied | Renter-occupied |
| Less than $300 | 607 (66.1%) | 78 (23.6%) |
| $300 to $499 | 112 (12.2%) | 70 (21.1%) |
| $500 to $799 | 96 (10.5%) | 35 (10.6%) |
| $800 to $999 | 62 (6.8%) | 0 (0.0%) |
| $1,000 to $1,499 | 23 (2.5%) | 23 (7.0%) |
| $1,500 to $1,999 | 18 (2.0%) | 0 (0.0%) |
| $2,000 to $2,499 | 0 (0.0%) | 0 (0.0%) |
| $2,500 to $2,999 | 0 (0.0%) | 0 (0.0%) |
| $3,000 or more | 0 (0.0%) | 0 (0.0%) |
| Total | 918 (100.0%) | 331 (100.0%) |
Physical Housing Characteristics in Guayanilla
Housing Structures in Guayanilla
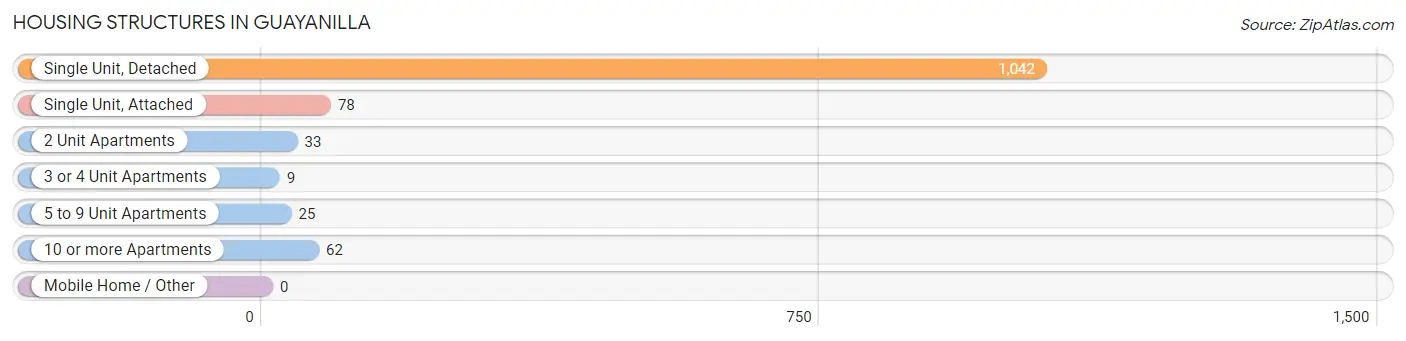
| Structure Type | # Housing Units | % Housing Units |
| Single Unit, Detached | 1,042 | 83.4% |
| Single Unit, Attached | 78 | 6.2% |
| 2 Unit Apartments | 33 | 2.6% |
| 3 or 4 Unit Apartments | 9 | 0.7% |
| 5 to 9 Unit Apartments | 25 | 2.0% |
| 10 or more Apartments | 62 | 5.0% |
| Mobile Home / Other | 0 | 0.0% |
| Total | 1,249 | 100.0% |
Housing Structures by Occupancy in Guayanilla
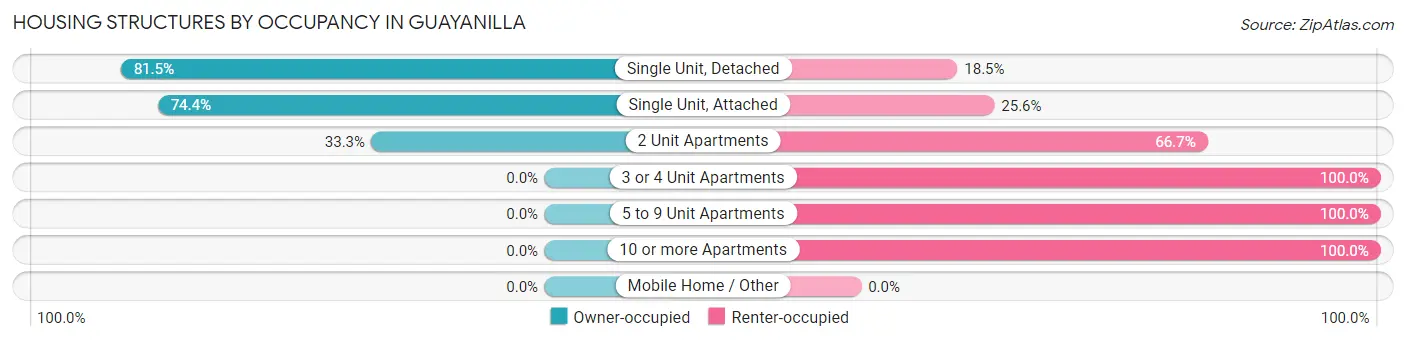
| Structure Type | Owner-occupied | Renter-occupied |
| Single Unit, Detached | 849 (81.5%) | 193 (18.5%) |
| Single Unit, Attached | 58 (74.4%) | 20 (25.6%) |
| 2 Unit Apartments | 11 (33.3%) | 22 (66.7%) |
| 3 or 4 Unit Apartments | 0 (0.0%) | 9 (100.0%) |
| 5 to 9 Unit Apartments | 0 (0.0%) | 25 (100.0%) |
| 10 or more Apartments | 0 (0.0%) | 62 (100.0%) |
| Mobile Home / Other | 0 (0.0%) | 0 (0.0%) |
| Total | 918 (73.5%) | 331 (26.5%) |
Housing Structures by Number of Rooms in Guayanilla
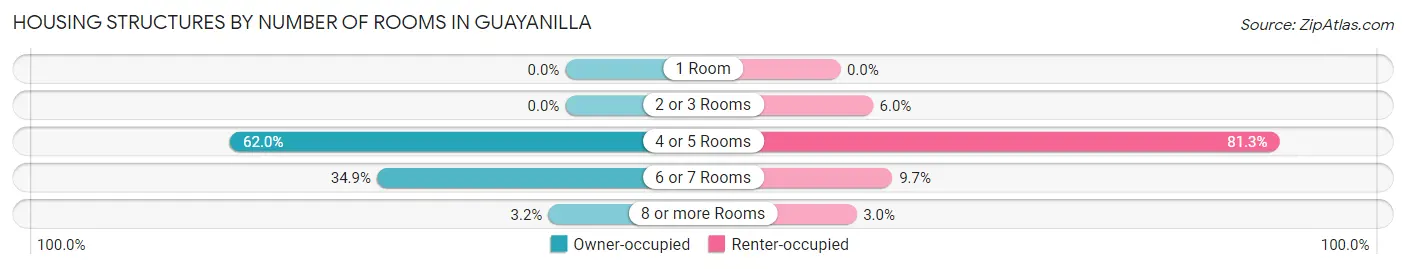
| Number of Rooms | Owner-occupied | Renter-occupied |
| 1 Room | 0 (0.0%) | 0 (0.0%) |
| 2 or 3 Rooms | 0 (0.0%) | 20 (6.0%) |
| 4 or 5 Rooms | 569 (62.0%) | 269 (81.3%) |
| 6 or 7 Rooms | 320 (34.9%) | 32 (9.7%) |
| 8 or more Rooms | 29 (3.2%) | 10 (3.0%) |
| Total | 918 (100.0%) | 331 (100.0%) |
Housing Structure by Heating Type in Guayanilla
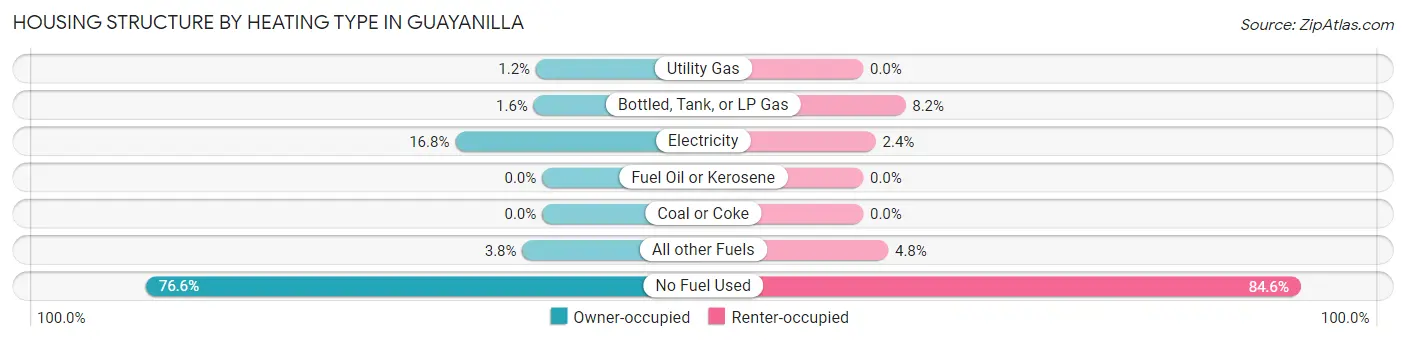
| Heating Type | Owner-occupied | Renter-occupied |
| Utility Gas | 11 (1.2%) | 0 (0.0%) |
| Bottled, Tank, or LP Gas | 15 (1.6%) | 27 (8.2%) |
| Electricity | 154 (16.8%) | 8 (2.4%) |
| Fuel Oil or Kerosene | 0 (0.0%) | 0 (0.0%) |
| Coal or Coke | 0 (0.0%) | 0 (0.0%) |
| All other Fuels | 35 (3.8%) | 16 (4.8%) |
| No Fuel Used | 703 (76.6%) | 280 (84.6%) |
| Total | 918 (100.0%) | 331 (100.0%) |
Household Vehicle Usage in Guayanilla
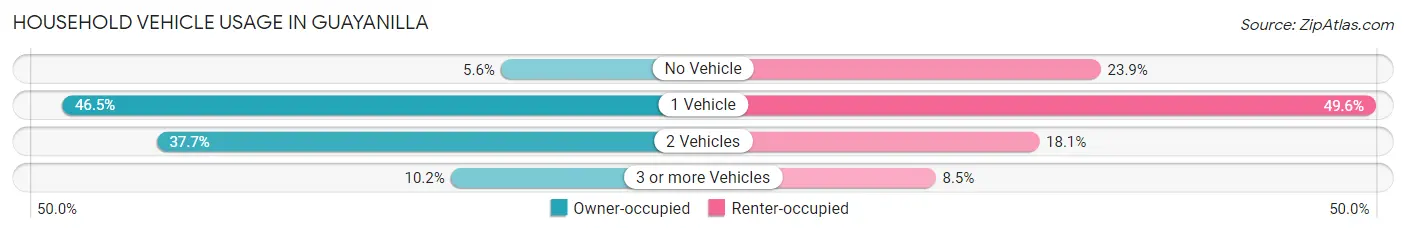
| Vehicles per Household | Owner-occupied | Renter-occupied |
| No Vehicle | 51 (5.6%) | 79 (23.9%) |
| 1 Vehicle | 427 (46.5%) | 164 (49.5%) |
| 2 Vehicles | 346 (37.7%) | 60 (18.1%) |
| 3 or more Vehicles | 94 (10.2%) | 28 (8.5%) |
| Total | 918 (100.0%) | 331 (100.0%) |
Real Estate & Mortgages in Guayanilla
Real Estate and Mortgage Overview in Guayanilla
| Characteristic | Without Mortgage | With Mortgage |
| Housing Units | 727 | 191 |
| Median Property Value | $104,100 | $125,400 |
| Median Household Income | $28,063 | $0 |
| Monthly Housing Costs | $170 | $0 |
| Real Estate Taxes | - | - |
Property Value by Mortgage Status in Guayanilla
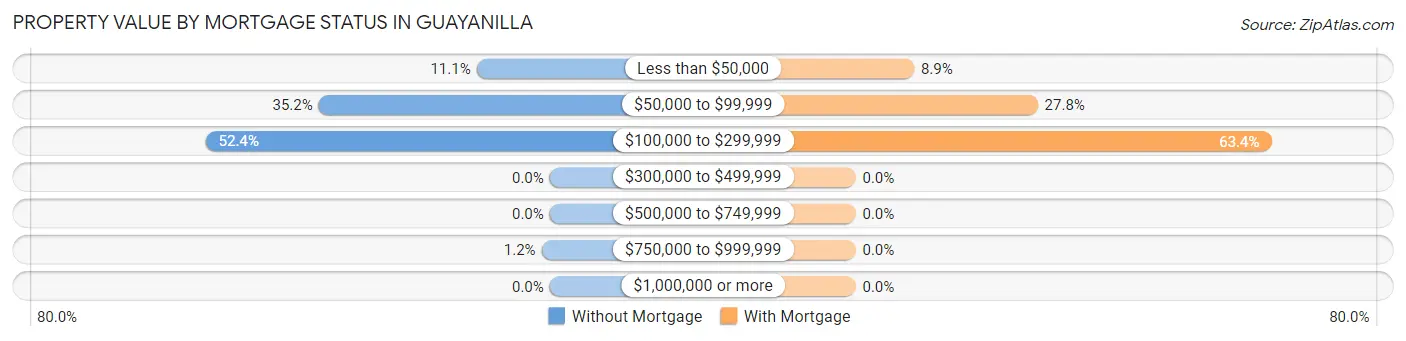
| Property Value | Without Mortgage | With Mortgage |
| Less than $50,000 | 81 (11.1%) | 17 (8.9%) |
| $50,000 to $99,999 | 256 (35.2%) | 53 (27.8%) |
| $100,000 to $299,999 | 381 (52.4%) | 121 (63.3%) |
| $300,000 to $499,999 | 0 (0.0%) | 0 (0.0%) |
| $500,000 to $749,999 | 0 (0.0%) | 0 (0.0%) |
| $750,000 to $999,999 | 9 (1.2%) | 0 (0.0%) |
| $1,000,000 or more | 0 (0.0%) | 0 (0.0%) |
| Total | 727 (100.0%) | 191 (100.0%) |
Household Income by Mortgage Status in Guayanilla
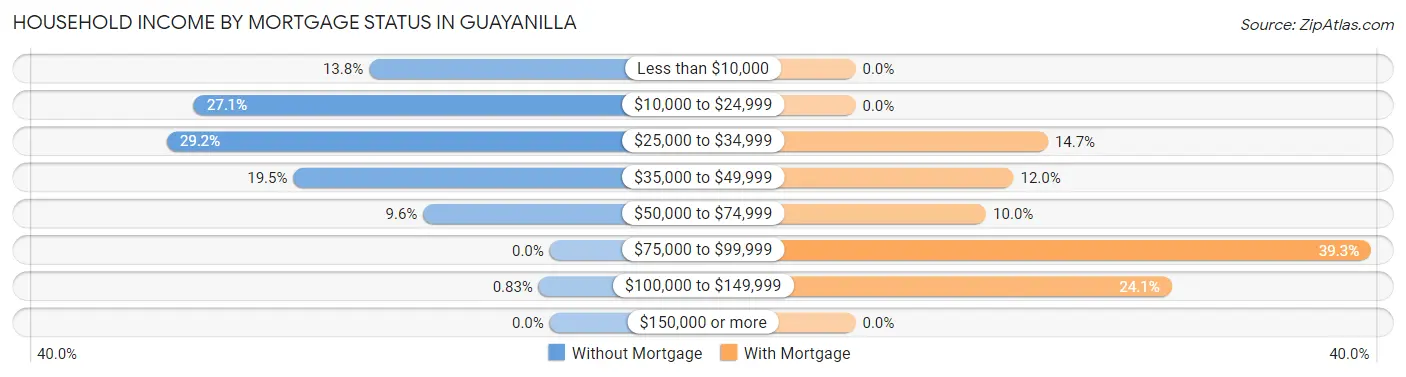
| Household Income | Without Mortgage | With Mortgage |
| Less than $10,000 | 100 (13.8%) | 0 (0.0%) |
| $10,000 to $24,999 | 197 (27.1%) | 0 (0.0%) |
| $25,000 to $34,999 | 212 (29.2%) | 28 (14.7%) |
| $35,000 to $49,999 | 142 (19.5%) | 23 (12.0%) |
| $50,000 to $74,999 | 70 (9.6%) | 19 (10.0%) |
| $75,000 to $99,999 | 0 (0.0%) | 75 (39.3%) |
| $100,000 to $149,999 | 6 (0.8%) | 46 (24.1%) |
| $150,000 or more | 0 (0.0%) | 0 (0.0%) |
| Total | 727 (100.0%) | 191 (100.0%) |
Property Value to Household Income Ratio in Guayanilla
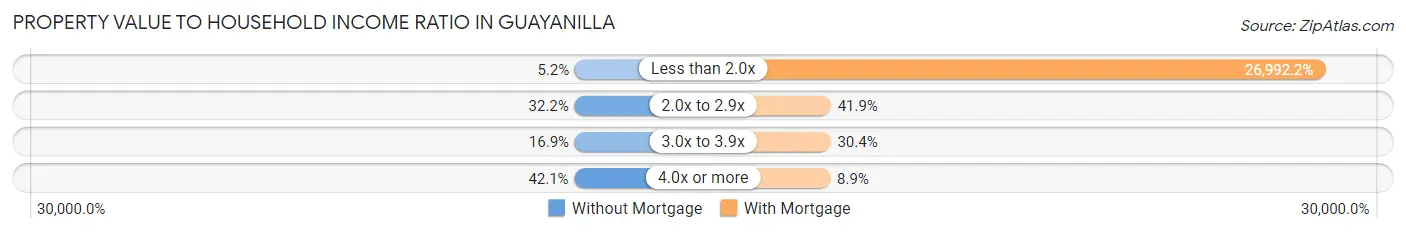
| Value-to-Income Ratio | Without Mortgage | With Mortgage |
| Less than 2.0x | 38 (5.2%) | 51,555 (26,992.1%) |
| 2.0x to 2.9x | 234 (32.2%) | 80 (41.9%) |
| 3.0x to 3.9x | 123 (16.9%) | 58 (30.4%) |
| 4.0x or more | 306 (42.1%) | 17 (8.9%) |
| Total | 727 (100.0%) | 191 (100.0%) |
Real Estate Taxes by Mortgage Status in Guayanilla
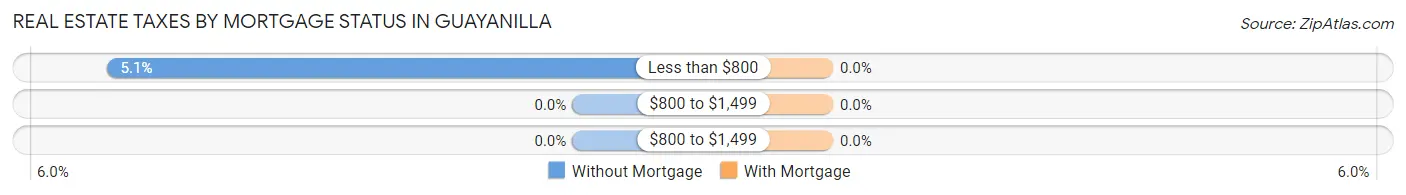
| Property Taxes | Without Mortgage | With Mortgage |
| Less than $800 | 37 (5.1%) | 0 (0.0%) |
| $800 to $1,499 | 0 (0.0%) | 0 (0.0%) |
| $800 to $1,499 | 0 (0.0%) | 0 (0.0%) |
| Total | 727 (100.0%) | 191 (100.0%) |
Health & Disability in Guayanilla
Health Insurance Coverage by Age in Guayanilla
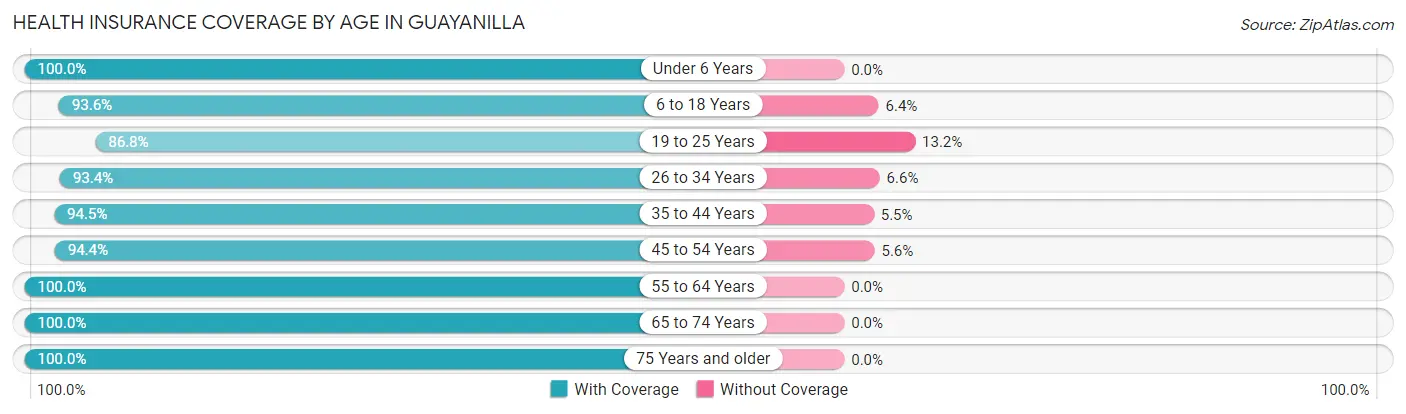
| Age Bracket | With Coverage | Without Coverage |
| Under 6 Years | 88 (100.0%) | 0 (0.0%) |
| 6 to 18 Years | 453 (93.6%) | 31 (6.4%) |
| 19 to 25 Years | 217 (86.8%) | 33 (13.2%) |
| 26 to 34 Years | 255 (93.4%) | 18 (6.6%) |
| 35 to 44 Years | 361 (94.5%) | 21 (5.5%) |
| 45 to 54 Years | 452 (94.4%) | 27 (5.6%) |
| 55 to 64 Years | 325 (100.0%) | 0 (0.0%) |
| 65 to 74 Years | 472 (100.0%) | 0 (0.0%) |
| 75 Years and older | 528 (100.0%) | 0 (0.0%) |
| Total | 3,151 (96.0%) | 130 (4.0%) |
Health Insurance Coverage by Citizenship Status in Guayanilla
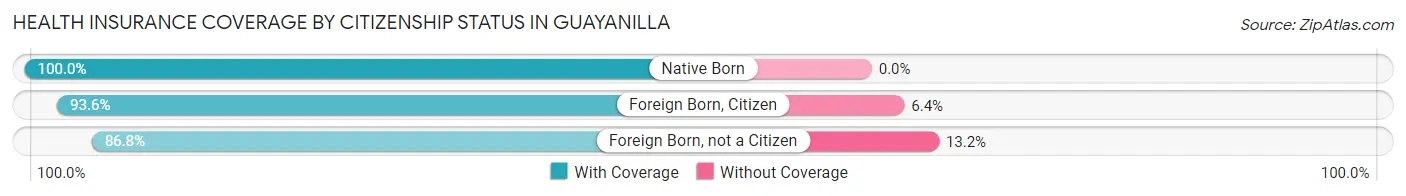
| Citizenship Status | With Coverage | Without Coverage |
| Native Born | 88 (100.0%) | 0 (0.0%) |
| Foreign Born, Citizen | 453 (93.6%) | 31 (6.4%) |
| Foreign Born, not a Citizen | 217 (86.8%) | 33 (13.2%) |
Health Insurance Coverage by Household Income in Guayanilla
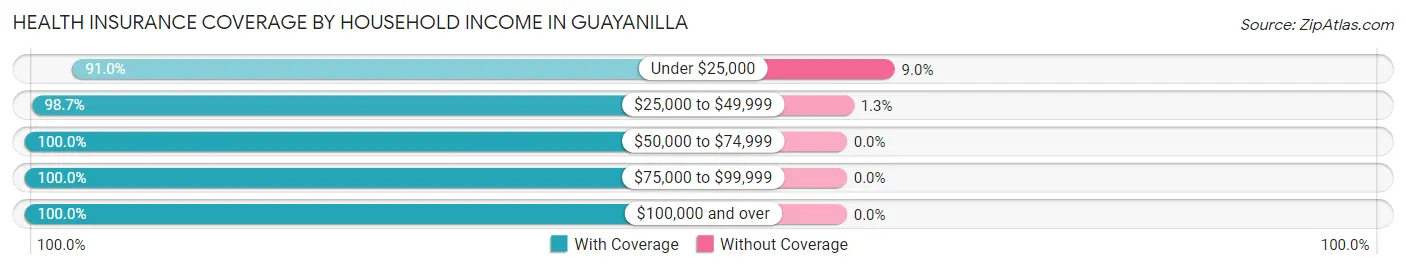
| Household Income | With Coverage | Without Coverage |
| Under $25,000 | 1,136 (91.0%) | 112 (9.0%) |
| $25,000 to $49,999 | 1,381 (98.7%) | 18 (1.3%) |
| $50,000 to $74,999 | 420 (100.0%) | 0 (0.0%) |
| $75,000 to $99,999 | 196 (100.0%) | 0 (0.0%) |
| $100,000 and over | 14 (100.0%) | 0 (0.0%) |
Public vs Private Health Insurance Coverage by Age in Guayanilla
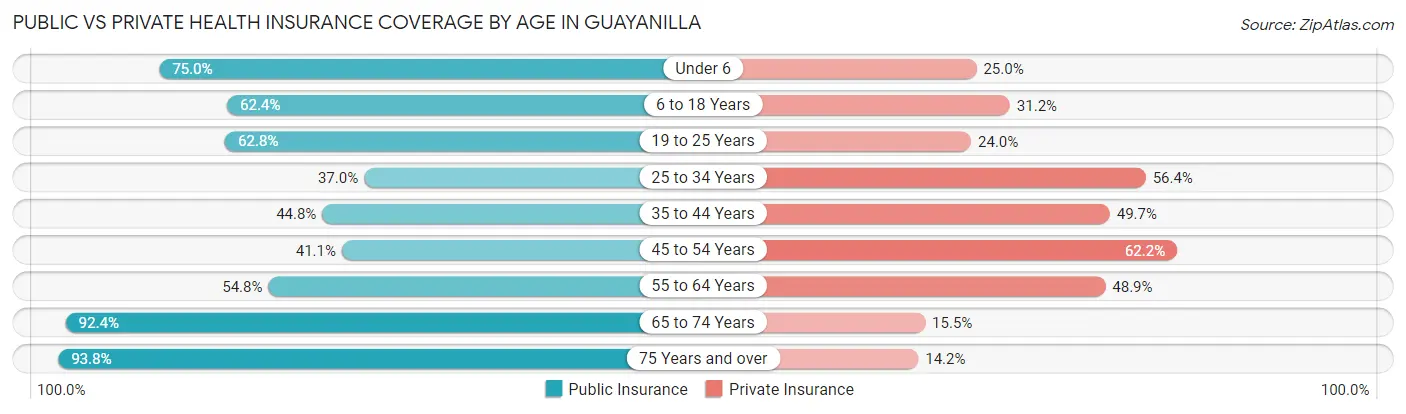
| Age Bracket | Public Insurance | Private Insurance |
| Under 6 | 66 (75.0%) | 22 (25.0%) |
| 6 to 18 Years | 302 (62.4%) | 151 (31.2%) |
| 19 to 25 Years | 157 (62.8%) | 60 (24.0%) |
| 25 to 34 Years | 101 (37.0%) | 154 (56.4%) |
| 35 to 44 Years | 171 (44.8%) | 190 (49.7%) |
| 45 to 54 Years | 197 (41.1%) | 298 (62.2%) |
| 55 to 64 Years | 178 (54.8%) | 159 (48.9%) |
| 65 to 74 Years | 436 (92.4%) | 73 (15.5%) |
| 75 Years and over | 495 (93.8%) | 75 (14.2%) |
| Total | 2,103 (64.1%) | 1,182 (36.0%) |
Disability Status by Sex by Age in Guayanilla
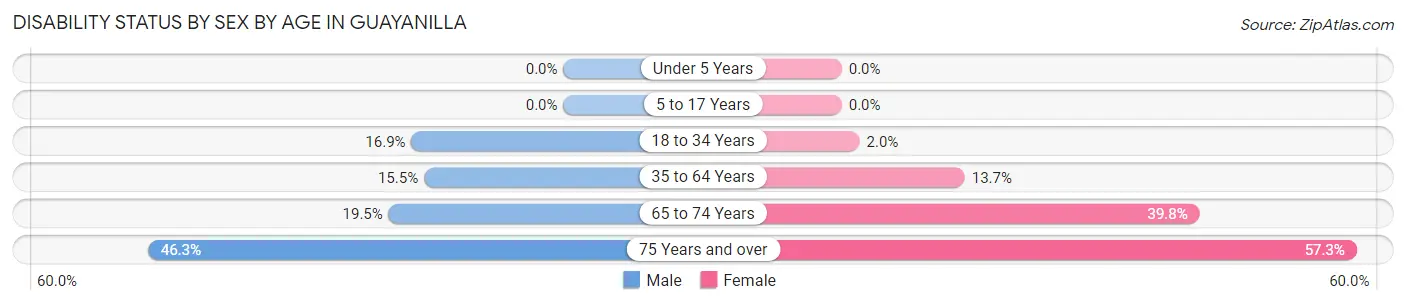
| Age Bracket | Male | Female |
| Under 5 Years | 0 (0.0%) | 0 (0.0%) |
| 5 to 17 Years | 0 (0.0%) | 0 (0.0%) |
| 18 to 34 Years | 33 (16.9%) | 7 (2.0%) |
| 35 to 64 Years | 90 (15.5%) | 83 (13.7%) |
| 65 to 74 Years | 43 (19.5%) | 100 (39.8%) |
| 75 Years and over | 112 (46.3%) | 164 (57.3%) |
Disability Class by Sex by Age in Guayanilla
Disability Class: Hearing Difficulty
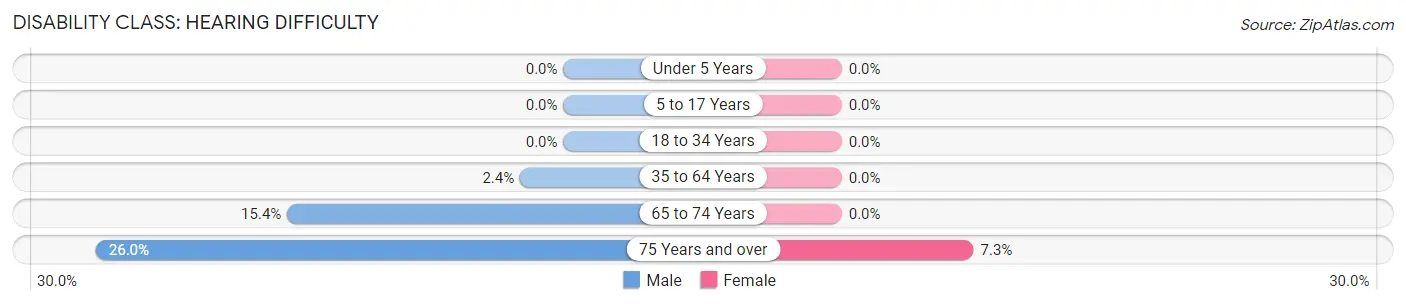
| Age Bracket | Male | Female |
| Under 5 Years | 0 (0.0%) | 0 (0.0%) |
| 5 to 17 Years | 0 (0.0%) | 0 (0.0%) |
| 18 to 34 Years | 0 (0.0%) | 0 (0.0%) |
| 35 to 64 Years | 14 (2.4%) | 0 (0.0%) |
| 65 to 74 Years | 34 (15.4%) | 0 (0.0%) |
| 75 Years and over | 63 (26.0%) | 21 (7.3%) |
Disability Class: Vision Difficulty
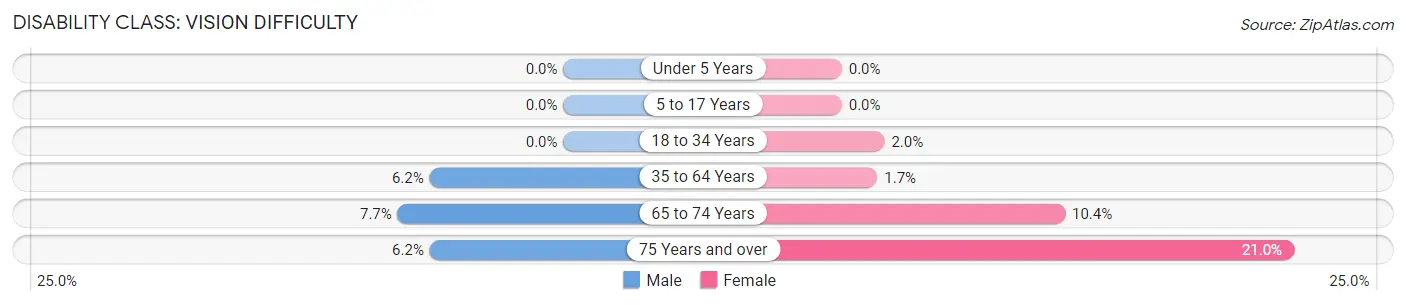
| Age Bracket | Male | Female |
| Under 5 Years | 0 (0.0%) | 0 (0.0%) |
| 5 to 17 Years | 0 (0.0%) | 0 (0.0%) |
| 18 to 34 Years | 0 (0.0%) | 7 (2.0%) |
| 35 to 64 Years | 36 (6.2%) | 10 (1.7%) |
| 65 to 74 Years | 17 (7.7%) | 26 (10.4%) |
| 75 Years and over | 15 (6.2%) | 60 (21.0%) |
Disability Class: Cognitive Difficulty
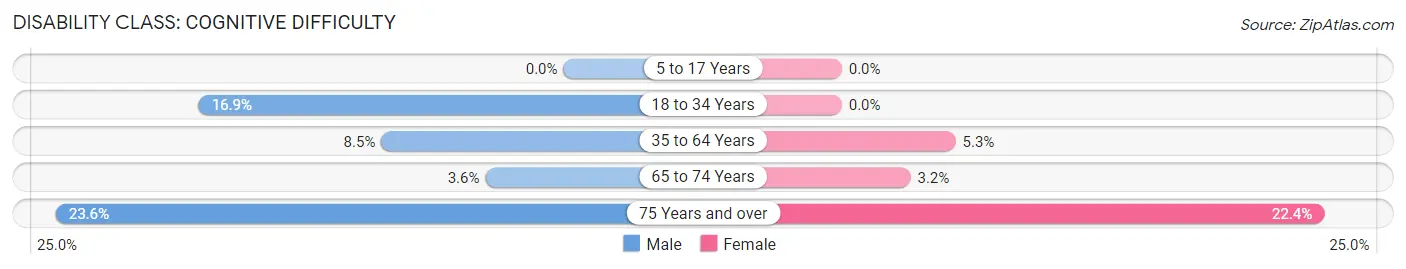
| Age Bracket | Male | Female |
| 5 to 17 Years | 0 (0.0%) | 0 (0.0%) |
| 18 to 34 Years | 33 (16.9%) | 0 (0.0%) |
| 35 to 64 Years | 49 (8.5%) | 32 (5.3%) |
| 65 to 74 Years | 8 (3.6%) | 8 (3.2%) |
| 75 Years and over | 57 (23.5%) | 64 (22.4%) |
Disability Class: Ambulatory Difficulty
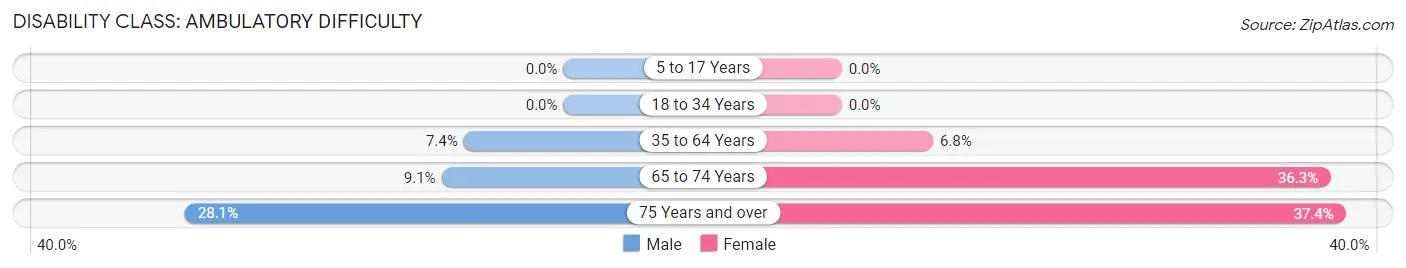
| Age Bracket | Male | Female |
| 5 to 17 Years | 0 (0.0%) | 0 (0.0%) |
| 18 to 34 Years | 0 (0.0%) | 0 (0.0%) |
| 35 to 64 Years | 43 (7.4%) | 41 (6.8%) |
| 65 to 74 Years | 20 (9.0%) | 91 (36.2%) |
| 75 Years and over | 68 (28.1%) | 107 (37.4%) |
Disability Class: Self-Care Difficulty
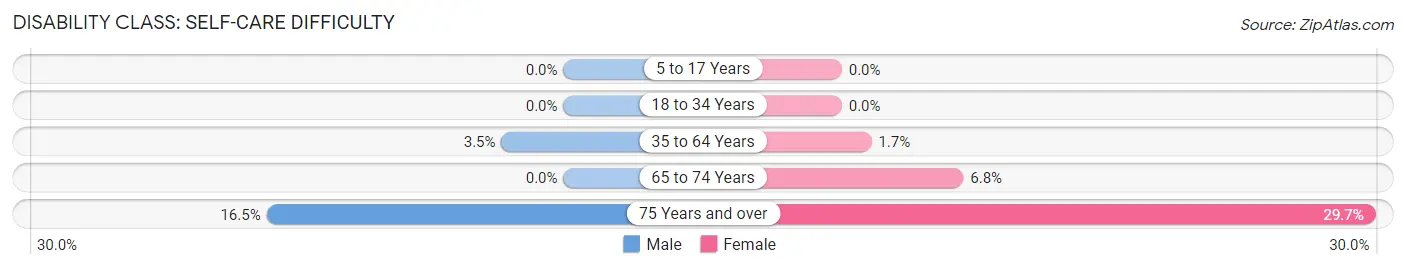
| Age Bracket | Male | Female |
| 5 to 17 Years | 0 (0.0%) | 0 (0.0%) |
| 18 to 34 Years | 0 (0.0%) | 0 (0.0%) |
| 35 to 64 Years | 20 (3.5%) | 10 (1.7%) |
| 65 to 74 Years | 0 (0.0%) | 17 (6.8%) |
| 75 Years and over | 40 (16.5%) | 85 (29.7%) |
Technology Access in Guayanilla
Computing Device Access in Guayanilla
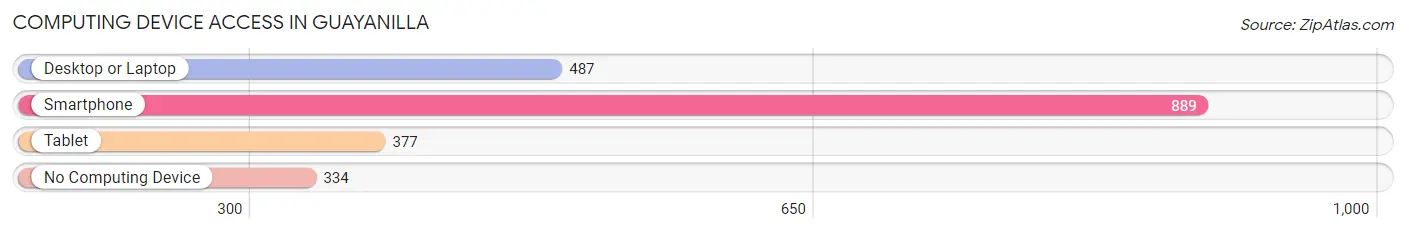
| Device Type | # Households | % Households |
| Desktop or Laptop | 487 | 39.0% |
| Smartphone | 889 | 71.2% |
| Tablet | 377 | 30.2% |
| No Computing Device | 334 | 26.7% |
| Total | 1,249 | 100.0% |
Internet Access in Guayanilla
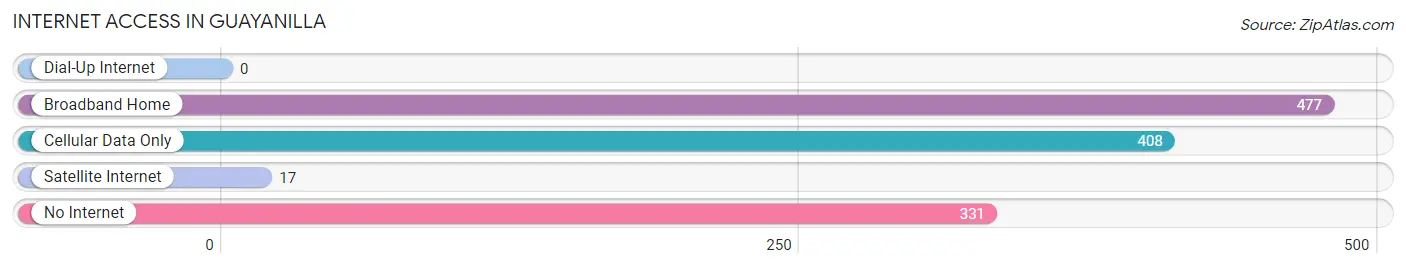
| Internet Type | # Households | % Households |
| Dial-Up Internet | 0 | 0.0% |
| Broadband Home | 477 | 38.2% |
| Cellular Data Only | 408 | 32.7% |
| Satellite Internet | 17 | 1.4% |
| No Internet | 331 | 26.5% |
| Total | 1,249 | 100.0% |
Guayanilla Summary
Guayanilla is a municipality located in the southwestern region of Puerto Rico. It is part of the Ponce Metropolitan Statistical Area. As of the 2010 census, the municipality had a population of 24,818.
History
The area of Guayanilla was originally inhabited by the indigenous Taíno people. The area was later colonized by the Spanish in the 16th century. The town was founded in 1733 and was named after the Guaynia tree, which is native to the area.
In the 19th century, the town was a major producer of sugar cane and coffee. The economy of the town was heavily dependent on the sugar industry until the late 20th century.
Geography
Guayanilla is located in the southwestern region of Puerto Rico, on the Caribbean Sea. It is bordered by the municipalities of Peñuelas to the north, Yauco to the east, and Ponce to the south. The municipality covers an area of 44.9 square miles (116.3 km2).
The terrain of the municipality is mostly flat, with some hills in the northern part of the municipality. The highest point in the municipality is Cerro La Punta, which has an elevation of 1,067 feet (325 m).
Economy
The economy of Guayanilla is largely based on agriculture and tourism. The main agricultural products are sugar cane, coffee, and bananas. The municipality is also home to several industrial parks, which are home to a variety of manufacturing and service companies.
Tourism is an important part of the economy of Guayanilla. The municipality is home to several beaches, including Playa de Guayanilla, Playa de Punta Guayanilla, and Playa de Punta de Jobos. The municipality also has several historical sites, including the ruins of the Hacienda San José sugar mill and the ruins of the Hacienda Santa Rosa.
Demographics
As of the 2010 census, the population of Guayanilla was 24,818. The population is mostly of mixed European and African descent. The majority of the population (90.3%) is of Hispanic or Latino origin. The median household income in the municipality is $17,845.
The majority of the population (90.3%) is Roman Catholic. Other religious denominations include Protestantism (7.2%), Jehovah's Witnesses (1.2%), and other religions (1.3%).
The official language of the municipality is Spanish. English is also spoken by a small percentage of the population.
Common Questions
What is Per Capita Income in Guayanilla?
Per Capita income in Guayanilla is $11,957.
What is the Median Family Income in Guayanilla?
Median Family Income in Guayanilla is $28,658.
What is the Median Household income in Guayanilla?
Median Household Income in Guayanilla is $27,515.
What is Income or Wage Gap in Guayanilla?
Income or Wage Gap in Guayanilla is 34.3%.
Women in Guayanilla earn 65.7 cents for every dollar earned by a man.
What is Family Income Deficit in Guayanilla?
Family Income Deficit in Guayanilla is $10,888.
Families that are below poverty line in Guayanilla earn $10,888 less on average than the poverty threshold level.
What is Inequality or Gini Index in Guayanilla?
Inequality or Gini Index in Guayanilla is 0.38.
What is the Total Population of Guayanilla?
Total Population of Guayanilla is 3,302.
What is the Total Male Population of Guayanilla?
Total Male Population of Guayanilla is 1,430.
What is the Total Female Population of Guayanilla?
Total Female Population of Guayanilla is 1,872.
What is the Ratio of Males per 100 Females in Guayanilla?
There are 76.39 Males per 100 Females in Guayanilla.
What is the Ratio of Females per 100 Males in Guayanilla?
There are 130.91 Females per 100 Males in Guayanilla.
What is the Median Population Age in Guayanilla?
Median Population Age in Guayanilla is 48.3 Years.
What is the Average Family Size in Guayanilla
Average Family Size in Guayanilla is 3.0 People.
What is the Average Household Size in Guayanilla
Average Household Size in Guayanilla is 2.6 People.
How Large is the Labor Force in Guayanilla?
There are 1,013 People in the Labor Forcein in Guayanilla.
What is the Percentage of People in the Labor Force in Guayanilla?
36.0% of People are in the Labor Force in Guayanilla.
What is the Unemployment Rate in Guayanilla?
Unemployment Rate in Guayanilla is 25.8%.