Cabo Rojo, PR Map & Demographics
Cabo Rojo Map
Cabo Rojo Overview
$15,393
PER CAPITA INCOME
$31,198
AVG FAMILY INCOME
$25,043
AVG HOUSEHOLD INCOME
12.3%
WAGE / INCOME GAP [ % ]
87.7¢/ $1
WAGE / INCOME GAP [ $ ]
0.52
INEQUALITY / GINI INDEX
10,137
TOTAL POPULATION
4,582
MALE POPULATION
5,555
FEMALE POPULATION
82.48
MALES / 100 FEMALES
121.24
FEMALES / 100 MALES
44.3
MEDIAN AGE
3.4
AVG FAMILY SIZE
2.8
AVG HOUSEHOLD SIZE
4,135
LABOR FORCE [ PEOPLE ]
47.1%
PERCENT IN LABOR FORCE
12.4%
UNEMPLOYMENT RATE
Cabo Rojo Zip Codes
Cabo Rojo Area Codes
Income in Cabo Rojo
Income Overview in Cabo Rojo
Per Capita Income in Cabo Rojo is $15,393, while median incomes of families and households are $31,198 and $25,043 respectively.
| Characteristic | Number | Measure |
| Per Capita Income | 10,137 | $15,393 |
| Median Family Income | 2,573 | $31,198 |
| Mean Family Income | 2,573 | $40,211 |
| Median Household Income | 3,572 | $25,043 |
| Mean Household Income | 3,572 | $39,613 |
| Income Deficit | 2,573 | $0 |
| Wage / Income Gap (%) | 10,137 | 12.35% |
| Wage / Income Gap ($) | 10,137 | 87.65¢ per $1 |
| Gini / Inequality Index | 10,137 | 0.52 |
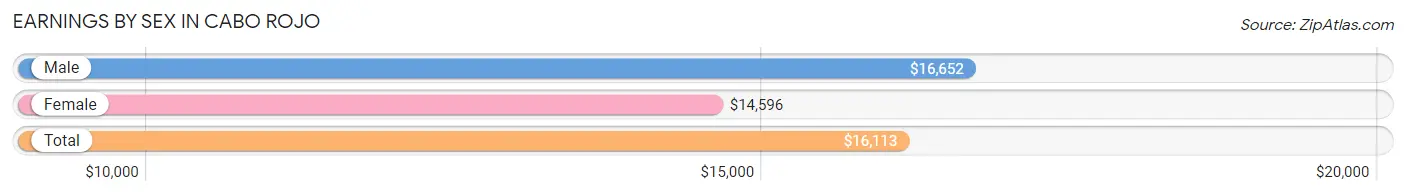
Earnings by Sex in Cabo Rojo
Average Earnings in Cabo Rojo are $16,113, $16,652 for men and $14,596 for women, a difference of 12.3%.
| Sex | Number | Average Earnings |
| Male | 1,968 (50.0%) | $16,652 |
| Female | 1,968 (50.0%) | $14,596 |
| Total | 3,936 (100.0%) | $16,113 |
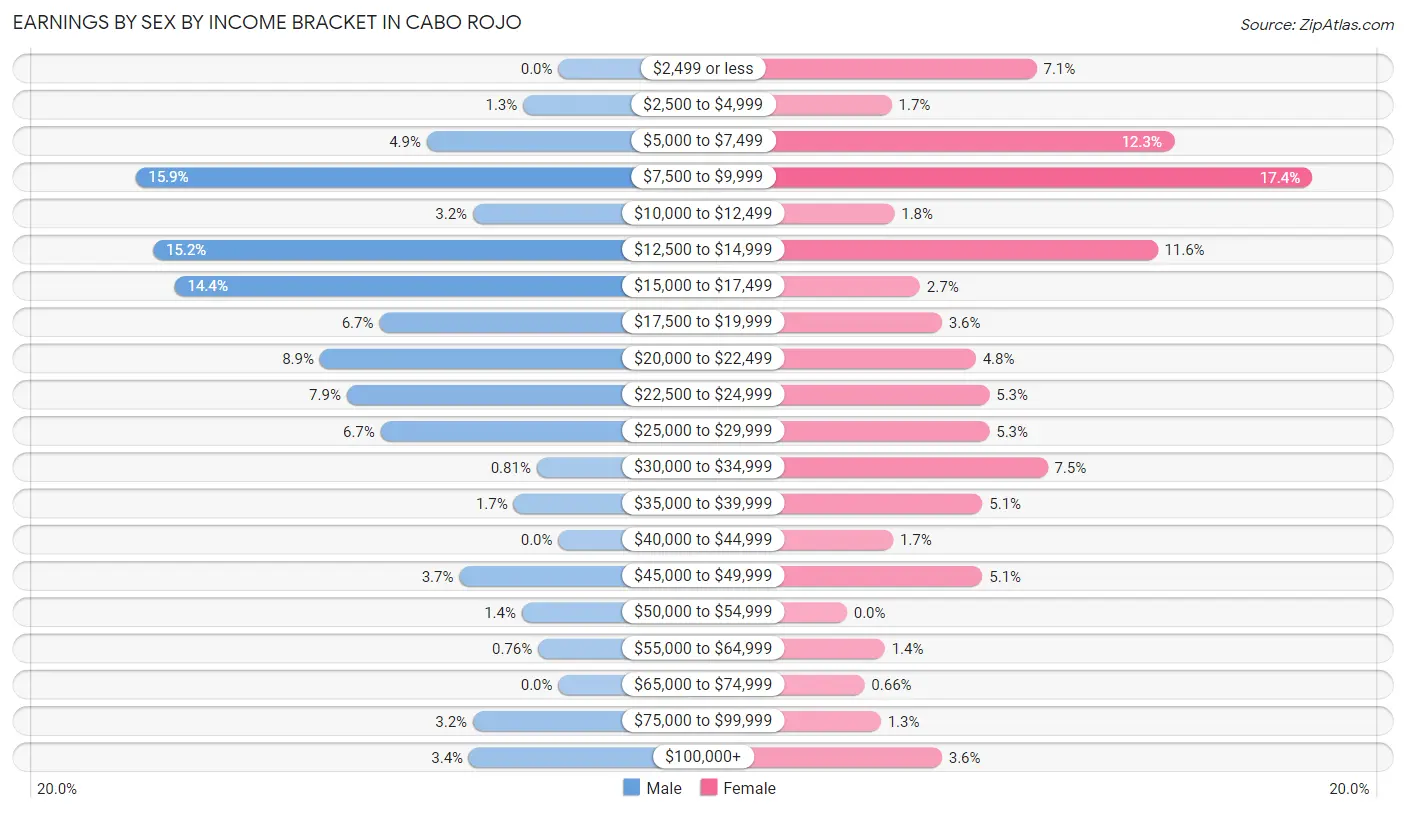
Earnings by Sex by Income Bracket in Cabo Rojo
The most common earnings brackets in Cabo Rojo are $7,500 to $9,999 for men (312 | 15.9%) and $7,500 to $9,999 for women (343 | 17.4%).
| Income | Male | Female |
| $2,499 or less | 0 (0.0%) | 140 (7.1%) |
| $2,500 to $4,999 | 26 (1.3%) | 33 (1.7%) |
| $5,000 to $7,499 | 97 (4.9%) | 241 (12.2%) |
| $7,500 to $9,999 | 312 (15.9%) | 343 (17.4%) |
| $10,000 to $12,499 | 63 (3.2%) | 35 (1.8%) |
| $12,500 to $14,999 | 299 (15.2%) | 229 (11.6%) |
| $15,000 to $17,499 | 283 (14.4%) | 54 (2.7%) |
| $17,500 to $19,999 | 132 (6.7%) | 70 (3.6%) |
| $20,000 to $22,499 | 176 (8.9%) | 95 (4.8%) |
| $22,500 to $24,999 | 156 (7.9%) | 105 (5.3%) |
| $25,000 to $29,999 | 131 (6.7%) | 105 (5.3%) |
| $30,000 to $34,999 | 16 (0.8%) | 148 (7.5%) |
| $35,000 to $39,999 | 33 (1.7%) | 100 (5.1%) |
| $40,000 to $44,999 | 0 (0.0%) | 34 (1.7%) |
| $45,000 to $49,999 | 73 (3.7%) | 100 (5.1%) |
| $50,000 to $54,999 | 27 (1.4%) | 0 (0.0%) |
| $55,000 to $64,999 | 15 (0.8%) | 28 (1.4%) |
| $65,000 to $74,999 | 0 (0.0%) | 13 (0.7%) |
| $75,000 to $99,999 | 63 (3.2%) | 25 (1.3%) |
| $100,000+ | 66 (3.4%) | 70 (3.6%) |
| Total | 1,968 (100.0%) | 1,968 (100.0%) |
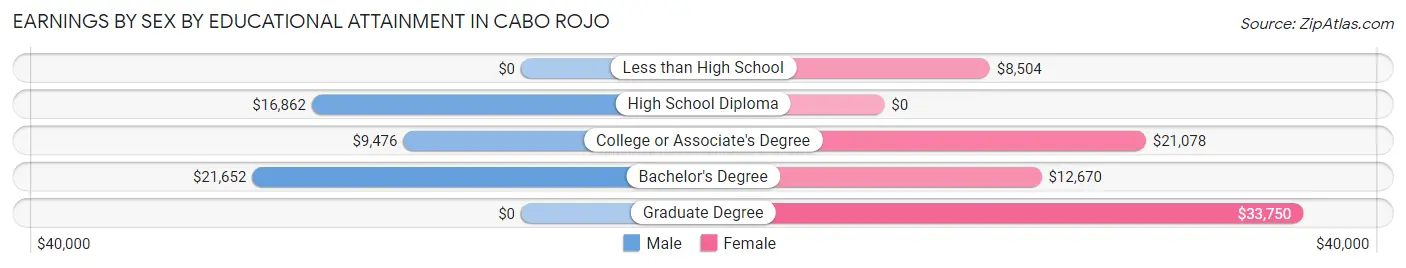
Earnings by Sex by Educational Attainment in Cabo Rojo
Average earnings in Cabo Rojo are $17,191 for men and $15,648 for women, a difference of 9.0%. Men with an educational attainment of bachelor's degree enjoy the highest average annual earnings of $21,652, while those with college or associate's degree education earn the least with $9,476. Women with an educational attainment of graduate degree earn the most with the average annual earnings of $33,750, while those with less than high school education have the smallest earnings of $8,504.
| Educational Attainment | Male Income | Female Income |
| Less than High School | - | - |
| High School Diploma | $16,862 | $0 |
| College or Associate's Degree | $9,476 | $21,078 |
| Bachelor's Degree | $21,652 | $12,670 |
| Graduate Degree | - | - |
| Total | $17,191 | $15,648 |
Family Income in Cabo Rojo
Family Income Brackets in Cabo Rojo
According to the Cabo Rojo family income data, there are 574 families falling into the $15,000 to $24,999 income range, which is the most common income bracket and makes up 22.3% of all families. Conversely, the $150,000 to $199,999 income bracket is the least frequent group with only 15 families (0.6%) belonging to this category.
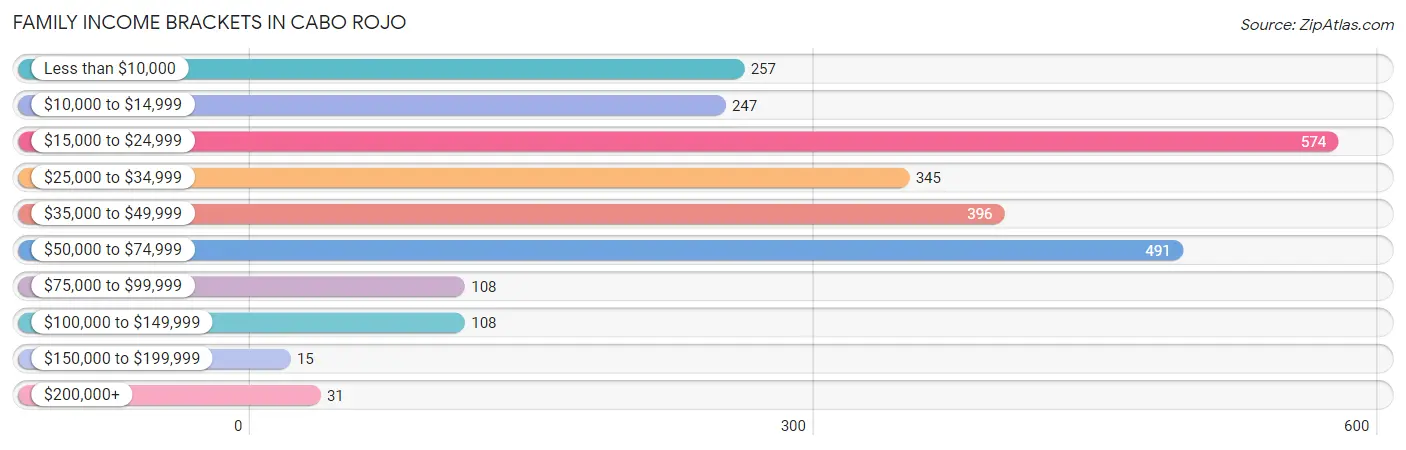
| Income Bracket | # Families | % Families |
| Less than $10,000 | 257 | 10.0% |
| $10,000 to $14,999 | 247 | 9.6% |
| $15,000 to $24,999 | 574 | 22.3% |
| $25,000 to $34,999 | 345 | 13.4% |
| $35,000 to $49,999 | 396 | 15.4% |
| $50,000 to $74,999 | 491 | 19.1% |
| $75,000 to $99,999 | 108 | 4.2% |
| $100,000 to $149,999 | 108 | 4.2% |
| $150,000 to $199,999 | 15 | 0.6% |
| $200,000+ | 31 | 1.2% |
Family Income by Famaliy Size in Cabo Rojo
5-person families (116 | 4.5%) account for the highest median family income in Cabo Rojo with $55,313 per family, while 2-person families (1,253 | 48.7%) have the highest median income of $15,282 per family member.
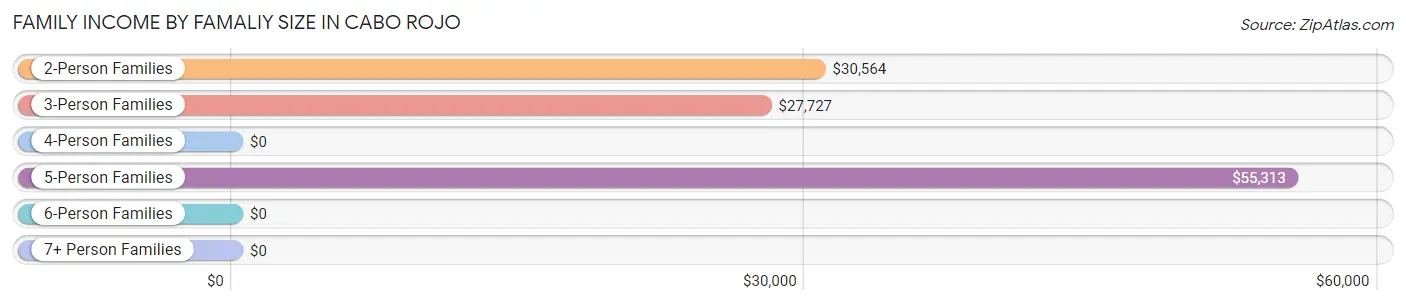
| Income Bracket | # Families | Median Income |
| 2-Person Families | 1,253 (48.7%) | $30,564 |
| 3-Person Families | 968 (37.6%) | $27,727 |
| 4-Person Families | 165 (6.4%) | $0 |
| 5-Person Families | 116 (4.5%) | $55,313 |
| 6-Person Families | 0 (0.0%) | $0 |
| 7+ Person Families | 71 (2.8%) | $0 |
| Total | 2,573 (100.0%) | $31,198 |
Family Income by Number of Earners in Cabo Rojo
The median family income in Cabo Rojo is $31,198, with families comprising 3+ earners (211) having the highest median family income of $59,988, while families with no earners (846) have the lowest median family income of $19,417, accounting for 8.2% and 32.9% of families, respectively.
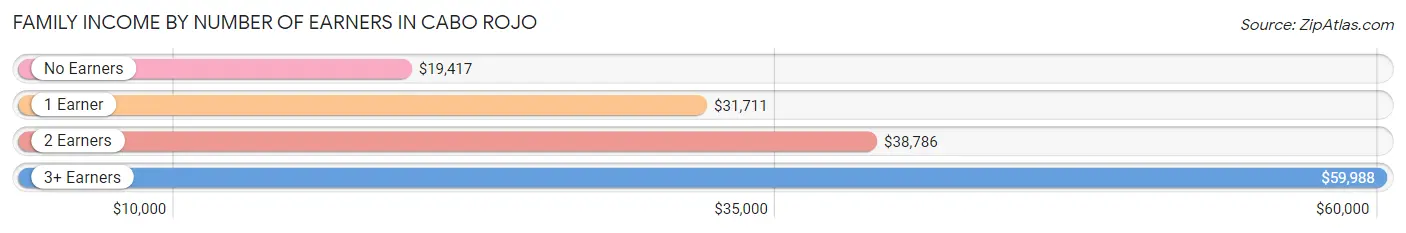
| Number of Earners | # Families | Median Income |
| No Earners | 846 (32.9%) | $19,417 |
| 1 Earner | 1,090 (42.4%) | $31,711 |
| 2 Earners | 426 (16.6%) | $38,786 |
| 3+ Earners | 211 (8.2%) | $59,988 |
| Total | 2,573 (100.0%) | $31,198 |
Household Income in Cabo Rojo
Household Income Brackets in Cabo Rojo
With 729 households falling in the category, the $15,000 to $24,999 income range is the most frequent in Cabo Rojo, accounting for 20.4% of all households. In contrast, only 14 households (0.4%) fall into the $150,000 to $199,999 income bracket, making it the least populous group.
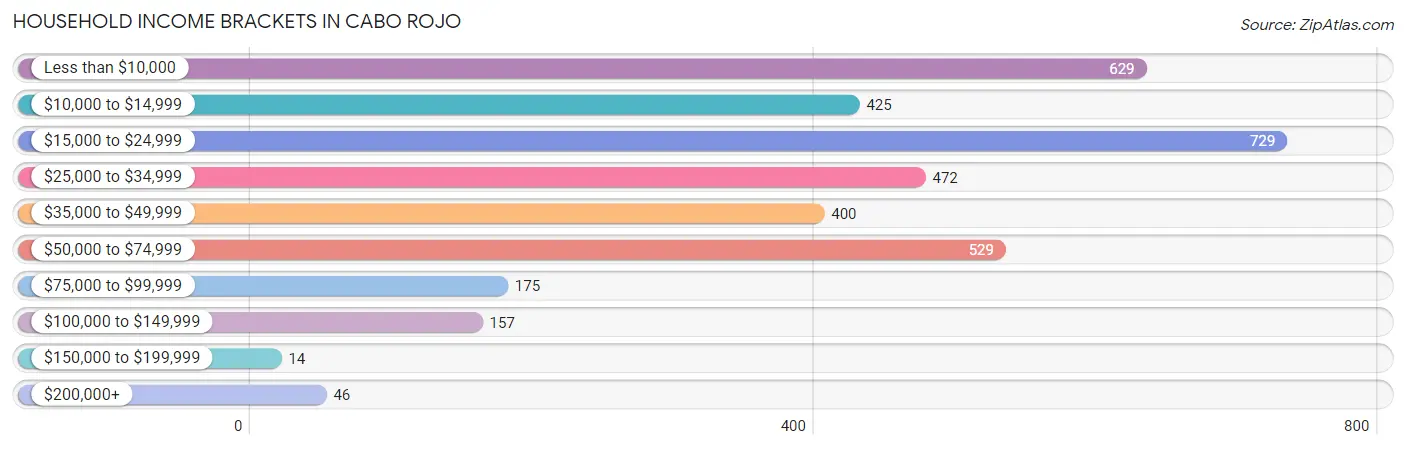
| Income Bracket | # Households | % Households |
| Less than $10,000 | 629 | 17.6% |
| $10,000 to $14,999 | 425 | 11.9% |
| $15,000 to $24,999 | 729 | 20.4% |
| $25,000 to $34,999 | 472 | 13.2% |
| $35,000 to $49,999 | 400 | 11.2% |
| $50,000 to $74,999 | 529 | 14.8% |
| $75,000 to $99,999 | 175 | 4.9% |
| $100,000 to $149,999 | 157 | 4.4% |
| $150,000 to $199,999 | 14 | 0.4% |
| $200,000+ | 46 | 1.3% |
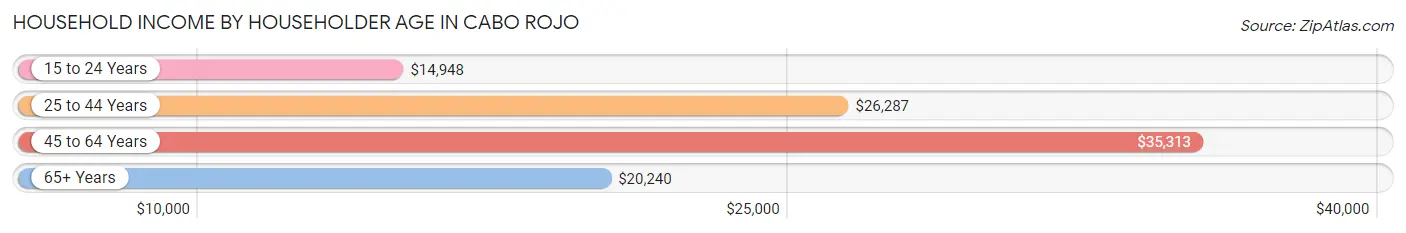
Household Income by Householder Age in Cabo Rojo
The median household income in Cabo Rojo is $25,043, with the highest median household income of $35,313 found in the 45 to 64 years age bracket for the primary householder. A total of 1,510 households (42.3%) fall into this category. Meanwhile, the 15 to 24 years age bracket for the primary householder has the lowest median household income of $14,948, with 47 households (1.3%) in this group.
| Income Bracket | # Households | Median Income |
| 15 to 24 Years | 47 (1.3%) | $14,948 |
| 25 to 44 Years | 659 (18.4%) | $26,287 |
| 45 to 64 Years | 1,510 (42.3%) | $35,313 |
| 65+ Years | 1,356 (38.0%) | $20,240 |
| Total | 3,572 (100.0%) | $25,043 |
Poverty in Cabo Rojo
Income Below Poverty by Sex and Age in Cabo Rojo
With 24.4% poverty level for males and 40.7% for females among the residents of Cabo Rojo, 12 to 14 year old males and 5 year old females are the most vulnerable to poverty, with 148 males (46.0%) and 37 females (100.0%) in their respective age groups living below the poverty level.
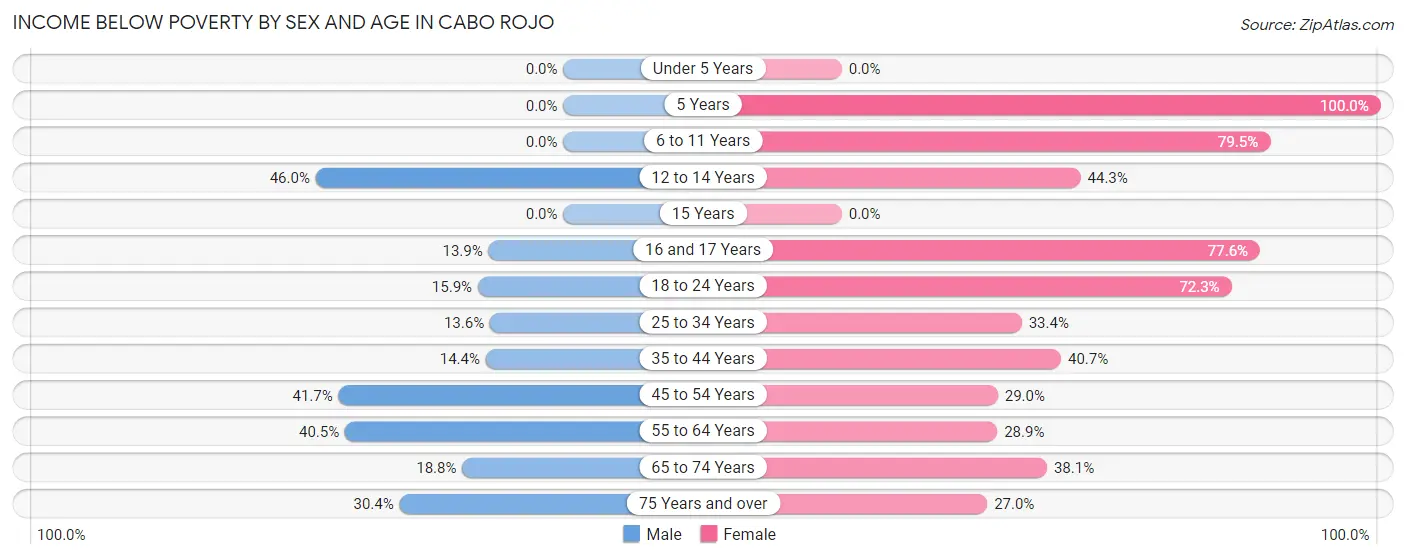
| Age Bracket | Male | Female |
| Under 5 Years | 0 (0.0%) | 0 (0.0%) |
| 5 Years | 0 (0.0%) | 37 (100.0%) |
| 6 to 11 Years | 0 (0.0%) | 275 (79.5%) |
| 12 to 14 Years | 148 (46.0%) | 90 (44.3%) |
| 15 Years | 0 (0.0%) | 0 (0.0%) |
| 16 and 17 Years | 50 (13.9%) | 142 (77.6%) |
| 18 to 24 Years | 69 (15.9%) | 337 (72.3%) |
| 25 to 34 Years | 90 (13.6%) | 160 (33.4%) |
| 35 to 44 Years | 58 (14.4%) | 313 (40.7%) |
| 45 to 54 Years | 179 (41.7%) | 225 (29.0%) |
| 55 to 64 Years | 310 (40.5%) | 234 (28.8%) |
| 65 to 74 Years | 105 (18.8%) | 243 (38.1%) |
| 75 Years and over | 100 (30.4%) | 193 (27.0%) |
| Total | 1,109 (24.4%) | 2,249 (40.7%) |
Income Above Poverty by Sex and Age in Cabo Rojo
According to the poverty statistics in Cabo Rojo, males aged under 5 years and females aged under 5 years are the age groups that are most secure financially, with 100.0% of males and 100.0% of females in these age groups living above the poverty line.
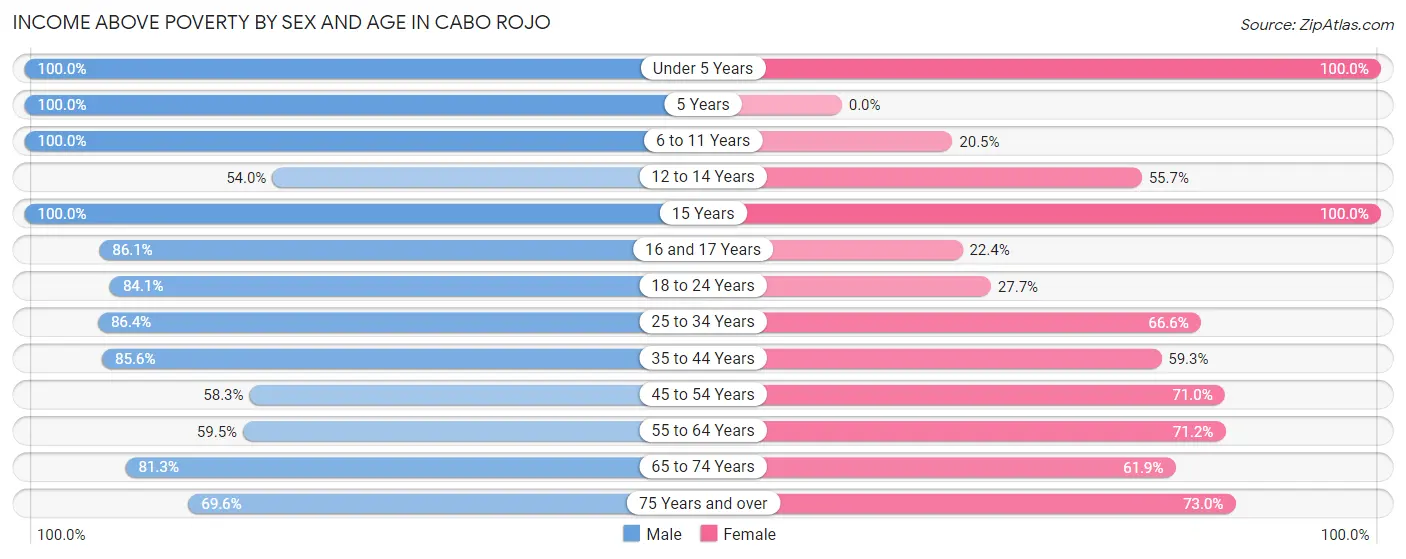
| Age Bracket | Male | Female |
| Under 5 Years | 89 (100.0%) | 79 (100.0%) |
| 5 Years | 43 (100.0%) | 0 (0.0%) |
| 6 to 11 Years | 94 (100.0%) | 71 (20.5%) |
| 12 to 14 Years | 174 (54.0%) | 113 (55.7%) |
| 15 Years | 61 (100.0%) | 25 (100.0%) |
| 16 and 17 Years | 310 (86.1%) | 41 (22.4%) |
| 18 to 24 Years | 366 (84.1%) | 129 (27.7%) |
| 25 to 34 Years | 571 (86.4%) | 319 (66.6%) |
| 35 to 44 Years | 345 (85.6%) | 456 (59.3%) |
| 45 to 54 Years | 250 (58.3%) | 552 (71.0%) |
| 55 to 64 Years | 455 (59.5%) | 577 (71.2%) |
| 65 to 74 Years | 455 (81.2%) | 395 (61.9%) |
| 75 Years and over | 229 (69.6%) | 522 (73.0%) |
| Total | 3,442 (75.6%) | 3,279 (59.3%) |
Income Below Poverty Among Married-Couple Families in Cabo Rojo
The poverty statistics for married-couple families in Cabo Rojo show that 18.1% or 261 of the total 1,444 families live below the poverty line. Families with 3 or 4 children have the highest poverty rate of 34.3%, comprising of 37 families. On the other hand, families with 1 or 2 children have the lowest poverty rate of 9.3%, which includes 22 families.
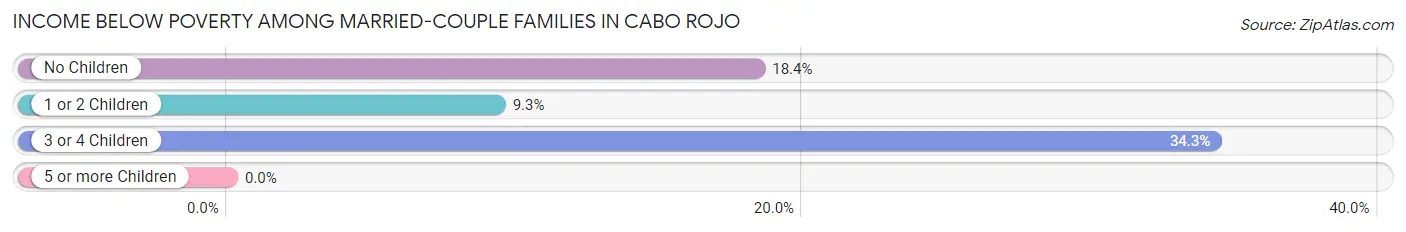
| Children | Above Poverty | Below Poverty |
| No Children | 898 (81.6%) | 202 (18.4%) |
| 1 or 2 Children | 214 (90.7%) | 22 (9.3%) |
| 3 or 4 Children | 71 (65.7%) | 37 (34.3%) |
| 5 or more Children | 0 (0.0%) | 0 (0.0%) |
| Total | 1,183 (81.9%) | 261 (18.1%) |
Income Below Poverty Among Single-Parent Households in Cabo Rojo
According to the poverty data in Cabo Rojo, 29.5% or 61 single-father households and 51.8% or 478 single-mother households are living below the poverty line. Among single-father households, those with no children have the highest poverty rate, with 61 households (36.5%) experiencing poverty. Likewise, among single-mother households, those with 1 or 2 children have the highest poverty rate, with 317 households (62.4%) falling below the poverty line.
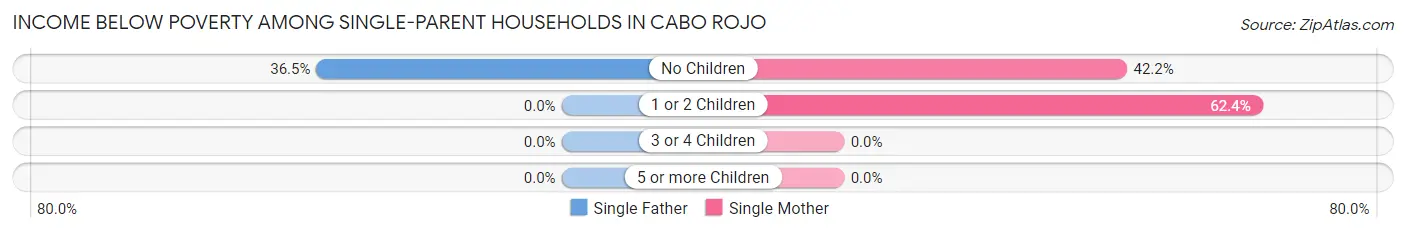
| Children | Single Father | Single Mother |
| No Children | 61 (36.5%) | 161 (42.1%) |
| 1 or 2 Children | 0 (0.0%) | 317 (62.4%) |
| 3 or 4 Children | 0 (0.0%) | 0 (0.0%) |
| 5 or more Children | 0 (0.0%) | 0 (0.0%) |
| Total | 61 (29.5%) | 478 (51.8%) |
Income Below Poverty Among Married-Couple vs Single-Parent Households in Cabo Rojo
The poverty data for Cabo Rojo shows that 261 of the married-couple family households (18.1%) and 539 of the single-parent households (47.7%) are living below the poverty level. Within the married-couple family households, those with 3 or 4 children have the highest poverty rate, with 37 households (34.3%) falling below the poverty line. Among the single-parent households, those with 1 or 2 children have the highest poverty rate, with 317 household (57.9%) living below poverty.
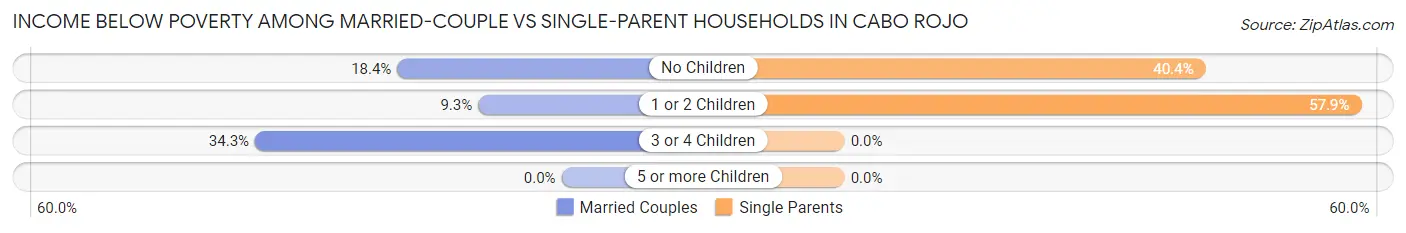
| Children | Married-Couple Families | Single-Parent Households |
| No Children | 202 (18.4%) | 222 (40.4%) |
| 1 or 2 Children | 22 (9.3%) | 317 (57.9%) |
| 3 or 4 Children | 37 (34.3%) | 0 (0.0%) |
| 5 or more Children | 0 (0.0%) | 0 (0.0%) |
| Total | 261 (18.1%) | 539 (47.7%) |
Race in Cabo Rojo
The most populous races in Cabo Rojo are Hispanic or Latino (10,098 | 99.6%), White / Caucasian (4,288 | 42.3%), and Some other Race (3,467 | 34.2%).
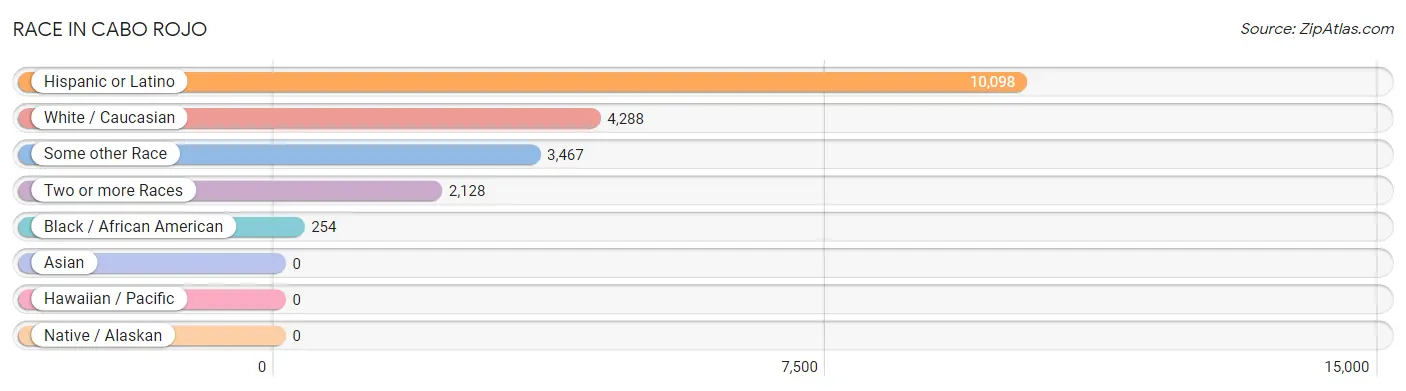
| Race | # Population | % Population |
| Asian | 0 | 0.0% |
| Black / African American | 254 | 2.5% |
| Hawaiian / Pacific | 0 | 0.0% |
| Hispanic or Latino | 10,098 | 99.6% |
| Native / Alaskan | 0 | 0.0% |
| White / Caucasian | 4,288 | 42.3% |
| Two or more Races | 2,128 | 21.0% |
| Some other Race | 3,467 | 34.2% |
| Total | 10,137 | 100.0% |
Ancestry in Cabo Rojo
The most populous ancestries reported in Cabo Rojo are Puerto Rican (9,945 | 98.1%), Central American Indian (1,073 | 10.6%), West Indian (93 | 0.9%), Spaniard (76 | 0.7%), and American (69 | 0.7%), together accounting for 111.0% of all Cabo Rojo residents.
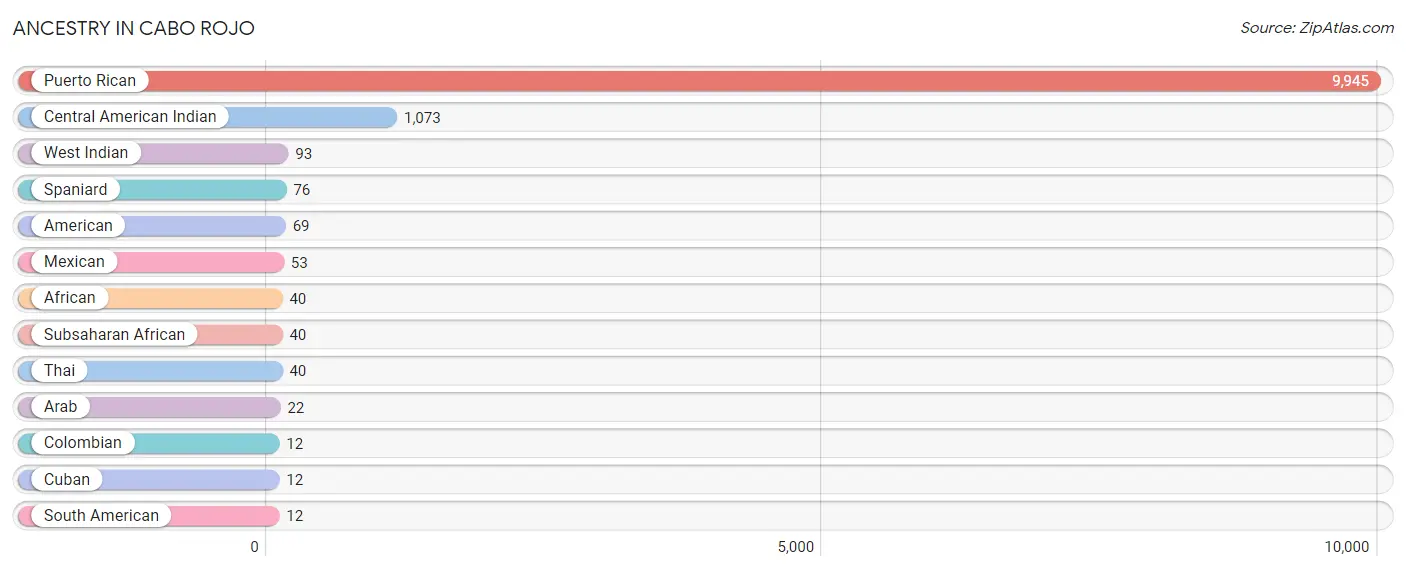
| Ancestry | # Population | % Population |
| African | 40 | 0.4% |
| American | 69 | 0.7% |
| Arab | 22 | 0.2% |
| Central American Indian | 1,073 | 10.6% |
| Colombian | 12 | 0.1% |
| Cuban | 12 | 0.1% |
| Mexican | 53 | 0.5% |
| Puerto Rican | 9,945 | 98.1% |
| South American | 12 | 0.1% |
| Spaniard | 76 | 0.7% |
| Subsaharan African | 40 | 0.4% |
| Thai | 40 | 0.4% |
| West Indian | 93 | 0.9% | View All 13 Rows |
Immigrants in Cabo Rojo

| Immigration Origin | # Population | % Population | View All 0 Rows |
Sex and Age in Cabo Rojo
Sex and Age in Cabo Rojo
The most populous age groups in Cabo Rojo are 15 to 19 Years (583 | 12.7%) for men and 40 to 44 Years (488 | 8.8%) for women.
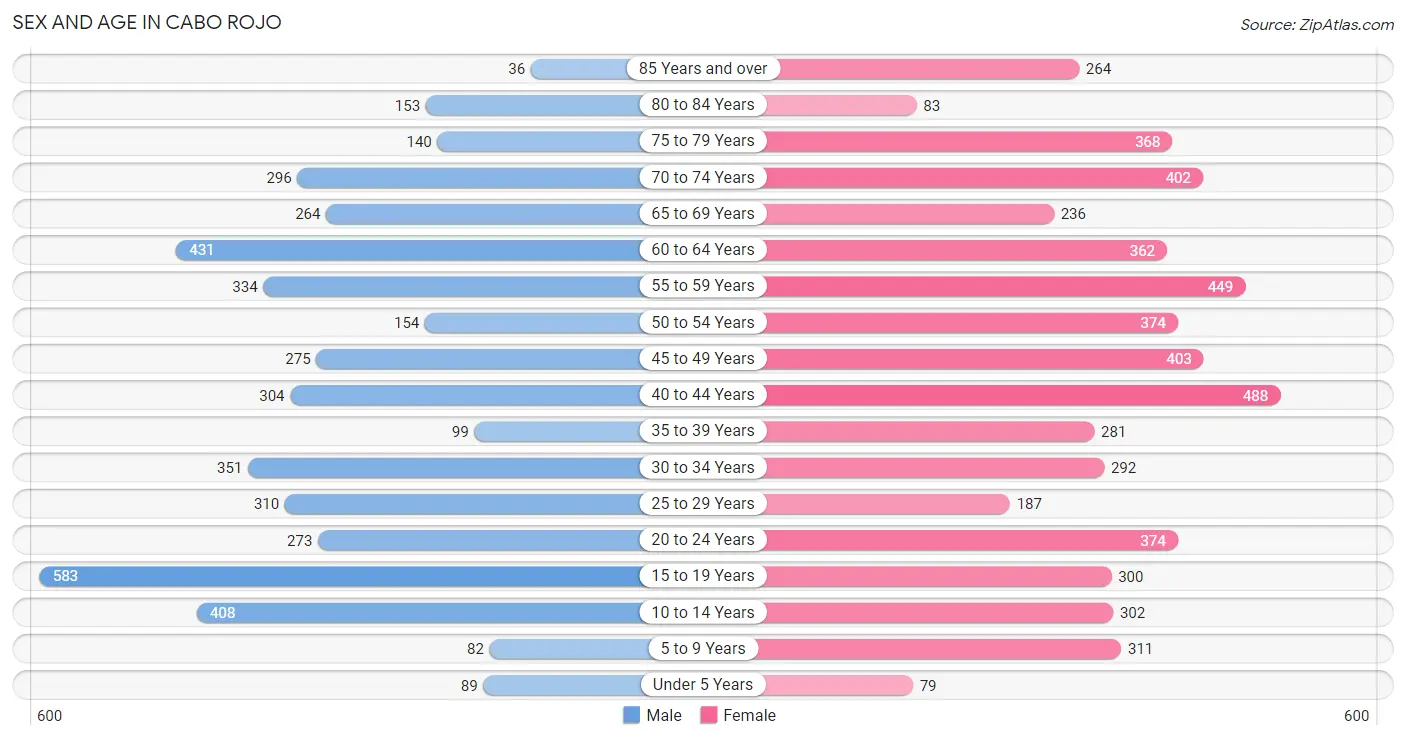
| Age Bracket | Male | Female |
| Under 5 Years | 89 (1.9%) | 79 (1.4%) |
| 5 to 9 Years | 82 (1.8%) | 311 (5.6%) |
| 10 to 14 Years | 408 (8.9%) | 302 (5.4%) |
| 15 to 19 Years | 583 (12.7%) | 300 (5.4%) |
| 20 to 24 Years | 273 (6.0%) | 374 (6.7%) |
| 25 to 29 Years | 310 (6.8%) | 187 (3.4%) |
| 30 to 34 Years | 351 (7.7%) | 292 (5.3%) |
| 35 to 39 Years | 99 (2.2%) | 281 (5.1%) |
| 40 to 44 Years | 304 (6.6%) | 488 (8.8%) |
| 45 to 49 Years | 275 (6.0%) | 403 (7.2%) |
| 50 to 54 Years | 154 (3.4%) | 374 (6.7%) |
| 55 to 59 Years | 334 (7.3%) | 449 (8.1%) |
| 60 to 64 Years | 431 (9.4%) | 362 (6.5%) |
| 65 to 69 Years | 264 (5.8%) | 236 (4.3%) |
| 70 to 74 Years | 296 (6.5%) | 402 (7.2%) |
| 75 to 79 Years | 140 (3.1%) | 368 (6.6%) |
| 80 to 84 Years | 153 (3.3%) | 83 (1.5%) |
| 85 Years and over | 36 (0.8%) | 264 (4.8%) |
| Total | 4,582 (100.0%) | 5,555 (100.0%) |
Families and Households in Cabo Rojo
Median Family Size in Cabo Rojo
The median family size in Cabo Rojo is 3.38 persons per family, with single female/mother families (922 | 35.8%) accounting for the largest median family size of 3.5 persons per family. On the other hand, single male/father families (207 | 8.1%) represent the smallest median family size with 2.81 persons per family.
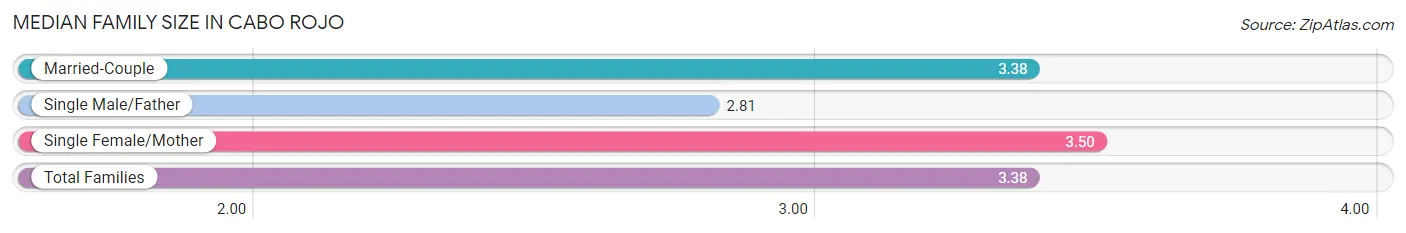
| Family Type | # Families | Family Size |
| Married-Couple | 1,444 (56.1%) | 3.38 |
| Single Male/Father | 207 (8.1%) | 2.81 |
| Single Female/Mother | 922 (35.8%) | 3.50 |
| Total Families | 2,573 (100.0%) | 3.38 |
Median Household Size in Cabo Rojo
The median household size in Cabo Rojo is 2.84 persons per household, with single female/mother households (922 | 25.8%) accounting for the largest median household size of 3.59 persons per household. non-family households (999 | 28.0%) represent the smallest median household size with 1.30 persons per household.
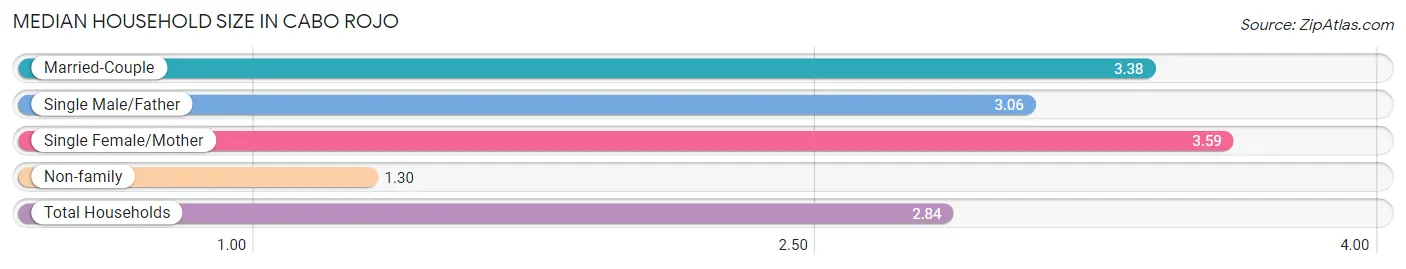
| Household Type | # Households | Household Size |
| Married-Couple | 1,444 (40.4%) | 3.38 |
| Single Male/Father | 207 (5.8%) | 3.06 |
| Single Female/Mother | 922 (25.8%) | 3.59 |
| Non-family | 999 (28.0%) | 1.30 |
| Total Households | 3,572 (100.0%) | 2.84 |
Household Size by Marriage Status in Cabo Rojo
Out of a total of 3,572 households in Cabo Rojo, 2,573 (72.0%) are family households, while 999 (28.0%) are nonfamily households. The most numerous type of family households are 2-person households, comprising 1,129, and the most common type of nonfamily households are 1-person households, comprising 877.
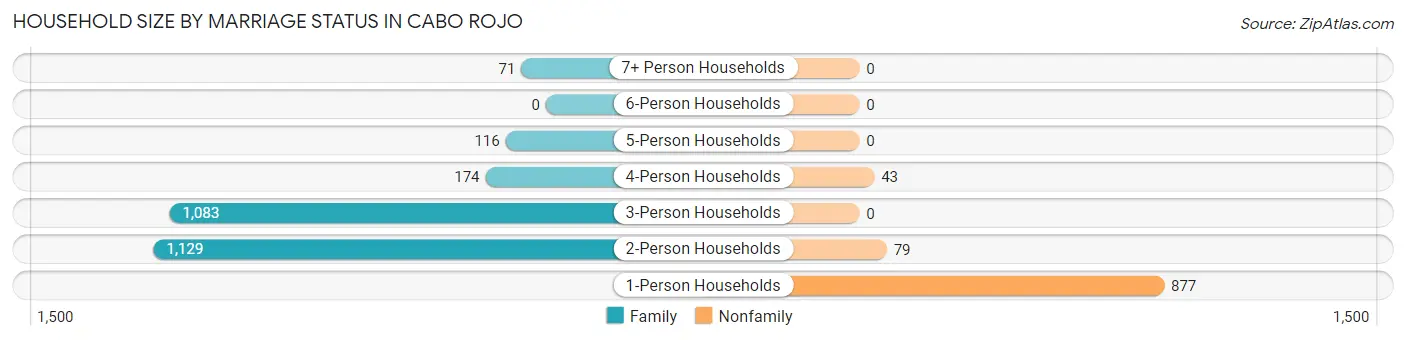
| Household Size | Family Households | Nonfamily Households |
| 1-Person Households | - | 877 (24.5%) |
| 2-Person Households | 1,129 (31.6%) | 79 (2.2%) |
| 3-Person Households | 1,083 (30.3%) | 0 (0.0%) |
| 4-Person Households | 174 (4.9%) | 43 (1.2%) |
| 5-Person Households | 116 (3.3%) | 0 (0.0%) |
| 6-Person Households | 0 (0.0%) | 0 (0.0%) |
| 7+ Person Households | 71 (2.0%) | 0 (0.0%) |
| Total | 2,573 (72.0%) | 999 (28.0%) |
Female Fertility in Cabo Rojo
Fertility by Age in Cabo Rojo
Average fertility rate in Cabo Rojo is 36.0 births per 1,000 women. Women in the age bracket of 20 to 34 years have the highest fertility rate with 62.0 births per 1,000 women. Women in the age bracket of 20 to 34 years acount for 60.9% of all women with births.
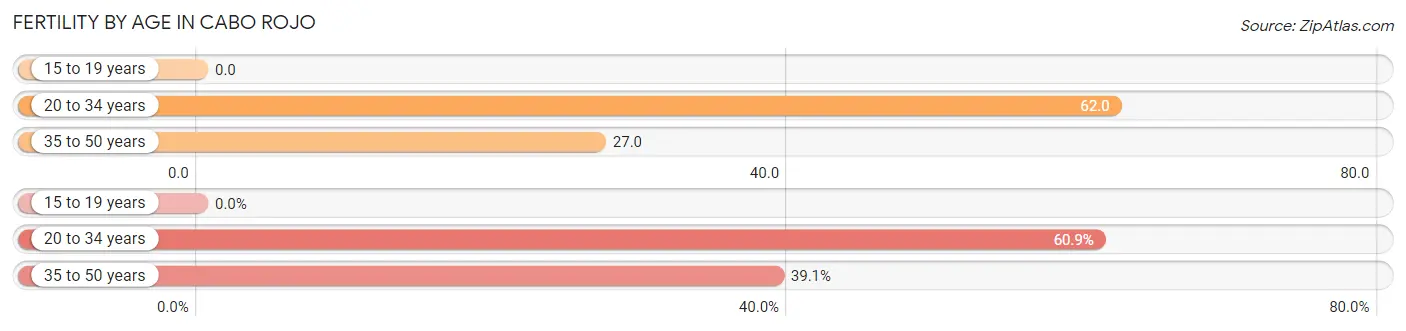
| Age Bracket | Women with Births | Births / 1,000 Women |
| 15 to 19 years | 0 (0.0%) | 0.0 |
| 20 to 34 years | 53 (60.9%) | 62.0 |
| 35 to 50 years | 34 (39.1%) | 27.0 |
| Total | 87 (100.0%) | 36.0 |
Fertility by Age by Marriage Status in Cabo Rojo
39.1% of women with births (87) in Cabo Rojo are married. The highest percentage of unmarried women with births falls into 20 to 34 years age bracket with 100.0% of them unmarried at the time of birth, while the lowest percentage of unmarried women with births belong to 35 to 50 years age bracket with 0.0% of them unmarried.
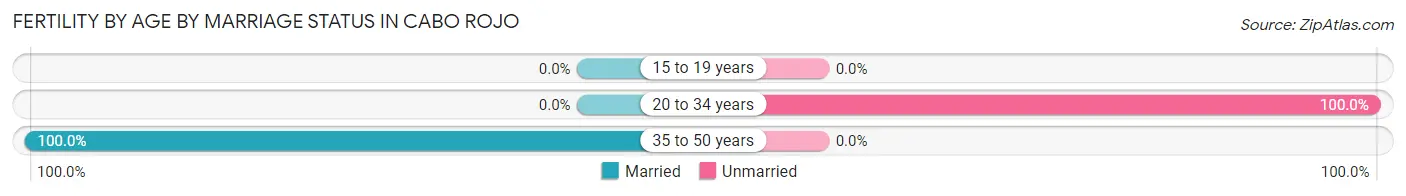
| Age Bracket | Married | Unmarried |
| 15 to 19 years | 0 (0.0%) | 0 (0.0%) |
| 20 to 34 years | 0 (0.0%) | 53 (100.0%) |
| 35 to 50 years | 34 (100.0%) | 0 (0.0%) |
| Total | 34 (39.1%) | 53 (60.9%) |
Fertility by Education in Cabo Rojo
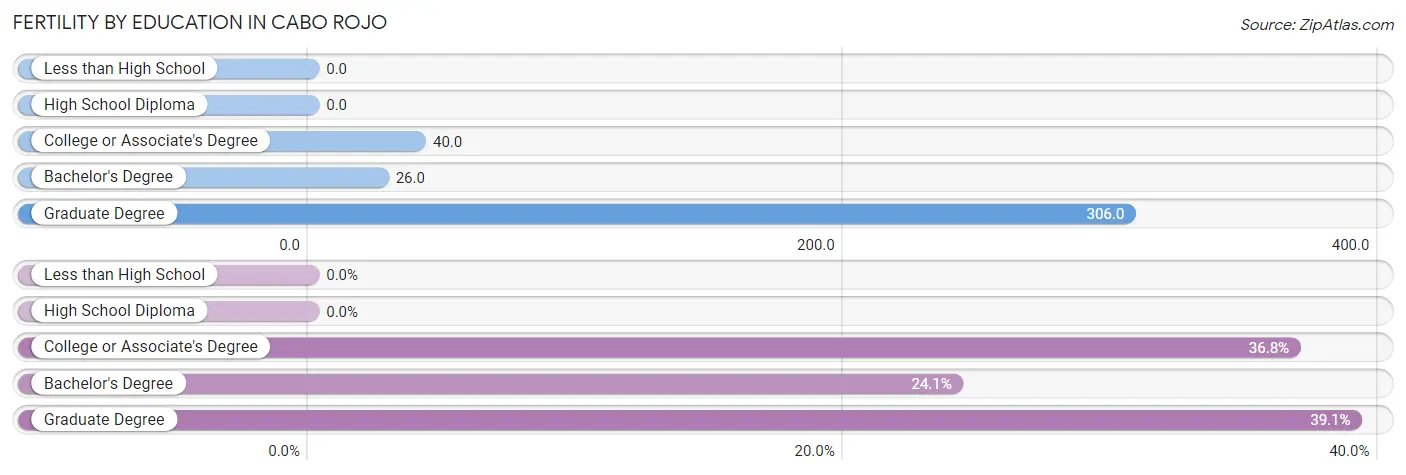
| Educational Attainment | Women with Births | Births / 1,000 Women |
| Less than High School | 0 (0.0%) | 0.0 |
| High School Diploma | 0 (0.0%) | 0.0 |
| College or Associate's Degree | 32 (36.8%) | 40.0 |
| Bachelor's Degree | 21 (24.1%) | 26.0 |
| Graduate Degree | 34 (39.1%) | 306.0 |
| Total | 87 (100.0%) | 36.0 |
Fertility by Education by Marriage Status in Cabo Rojo
60.9% of women with births in Cabo Rojo are unmarried. Women with the educational attainment of graduate degree are most likely to be married with 100.0% of them married at childbirth, while women with the educational attainment of college or associate's degree are least likely to be married with 100.0% of them unmarried at childbirth.
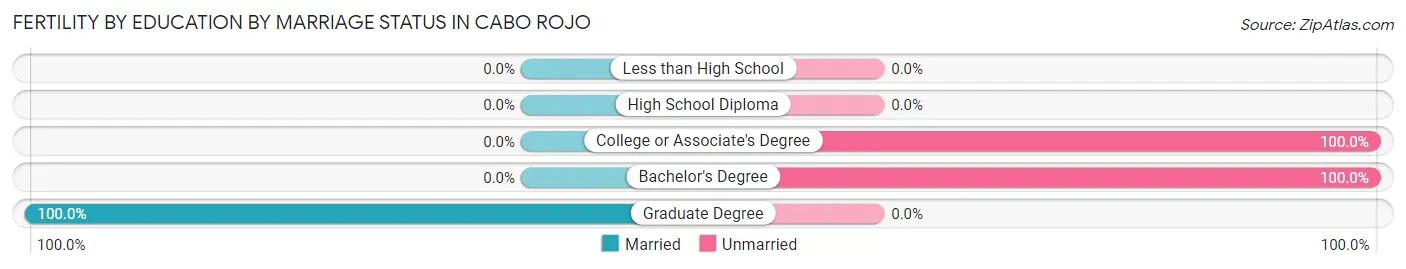
| Educational Attainment | Married | Unmarried |
| Less than High School | 0 (0.0%) | 0 (0.0%) |
| High School Diploma | 0 (0.0%) | 0 (0.0%) |
| College or Associate's Degree | 0 (0.0%) | 32 (100.0%) |
| Bachelor's Degree | 0 (0.0%) | 21 (100.0%) |
| Graduate Degree | 34 (100.0%) | 0 (0.0%) |
| Total | 34 (39.1%) | 53 (60.9%) |
Employment Characteristics in Cabo Rojo
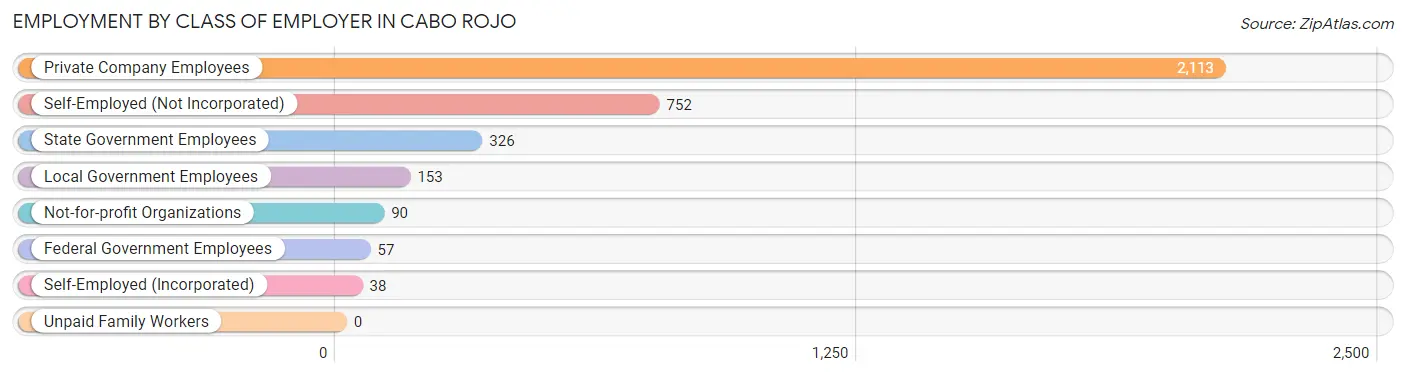
Employment by Class of Employer in Cabo Rojo
Among the 3,529 employed individuals in Cabo Rojo, private company employees (2,113 | 59.9%), self-employed (not incorporated) (752 | 21.3%), and state government employees (326 | 9.2%) make up the most common classes of employment.
| Employer Class | # Employees | % Employees |
| Private Company Employees | 2,113 | 59.9% |
| Self-Employed (Incorporated) | 38 | 1.1% |
| Self-Employed (Not Incorporated) | 752 | 21.3% |
| Not-for-profit Organizations | 90 | 2.5% |
| Local Government Employees | 153 | 4.3% |
| State Government Employees | 326 | 9.2% |
| Federal Government Employees | 57 | 1.6% |
| Unpaid Family Workers | 0 | 0.0% |
| Total | 3,529 | 100.0% |
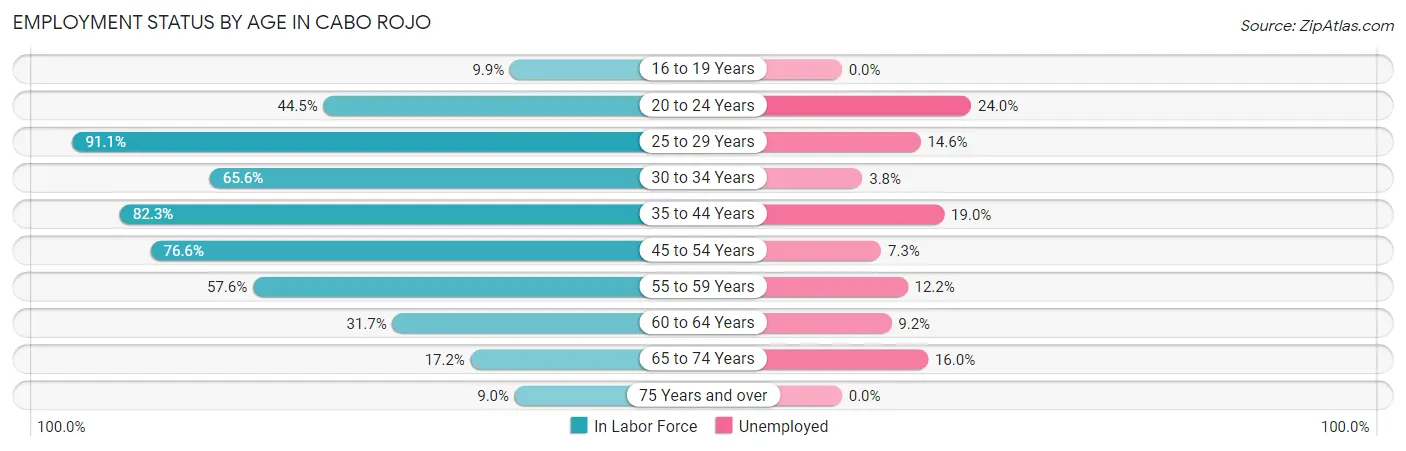
Employment Status by Age in Cabo Rojo
According to the labor force statistics for Cabo Rojo, out of the total population over 16 years of age (8,780), 47.1% or 4,135 individuals are in the labor force, with 12.4% or 513 of them unemployed. The age group with the highest labor force participation rate is 25 to 29 years, with 91.1% or 453 individuals in the labor force. Within the labor force, the 20 to 24 years age range has the highest percentage of unemployed individuals, with 24.0% or 69 of them being unemployed.
| Age Bracket | In Labor Force | Unemployed |
| 16 to 19 Years | 79 (9.9%) | 0 (0.0%) |
| 20 to 24 Years | 288 (44.5%) | 69 (24.0%) |
| 25 to 29 Years | 453 (91.1%) | 66 (14.6%) |
| 30 to 34 Years | 422 (65.6%) | 16 (3.8%) |
| 35 to 44 Years | 965 (82.3%) | 183 (19.0%) |
| 45 to 54 Years | 924 (76.6%) | 67 (7.3%) |
| 55 to 59 Years | 451 (57.6%) | 55 (12.2%) |
| 60 to 64 Years | 251 (31.7%) | 23 (9.2%) |
| 65 to 74 Years | 206 (17.2%) | 33 (16.0%) |
| 75 Years and over | 94 (9.0%) | 0 (0.0%) |
| Total | 4,135 (47.1%) | 513 (12.4%) |
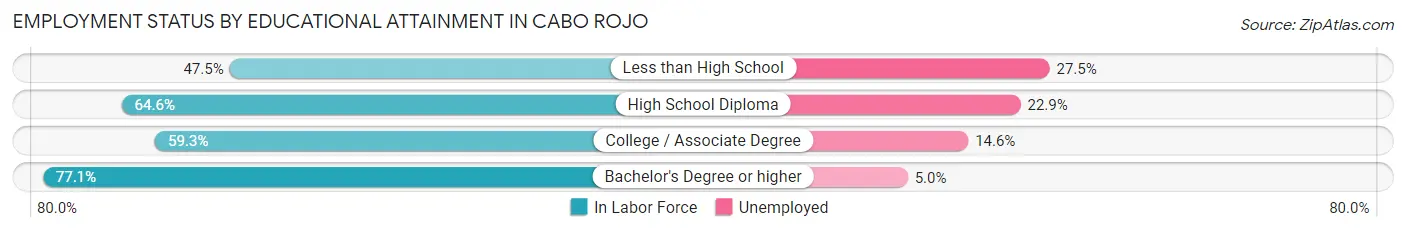
Employment Status by Educational Attainment in Cabo Rojo
According to labor force statistics for Cabo Rojo, 68.0% of individuals (3,464) out of the total population between 25 and 64 years of age (5,094) are in the labor force, with 11.8% or 409 of them being unemployed. The group with the highest labor force participation rate are those with the educational attainment of bachelor's degree or higher, with 77.1% or 1,875 individuals in the labor force. Within the labor force, individuals with less than high school education have the highest percentage of unemployment, with 27.5% or 52 of them being unemployed.
| Educational Attainment | In Labor Force | Unemployed |
| Less than High School | 189 (47.5%) | 109 (27.5%) |
| High School Diploma | 716 (64.6%) | 254 (22.9%) |
| College / Associate Degree | 686 (59.3%) | 169 (14.6%) |
| Bachelor's Degree or higher | 1,875 (77.1%) | 122 (5.0%) |
| Total | 3,464 (68.0%) | 601 (11.8%) |
Employment Occupations by Sex in Cabo Rojo
Management, Business, Science and Arts Occupations
The most common Management, Business, Science and Arts occupations in Cabo Rojo are Community & Social Service (498 | 13.8%), Health Diagnosing & Treating (319 | 8.8%), Education Instruction & Library (271 | 7.5%), Management (236 | 6.5%), and Legal Services & Support (165 | 4.6%).
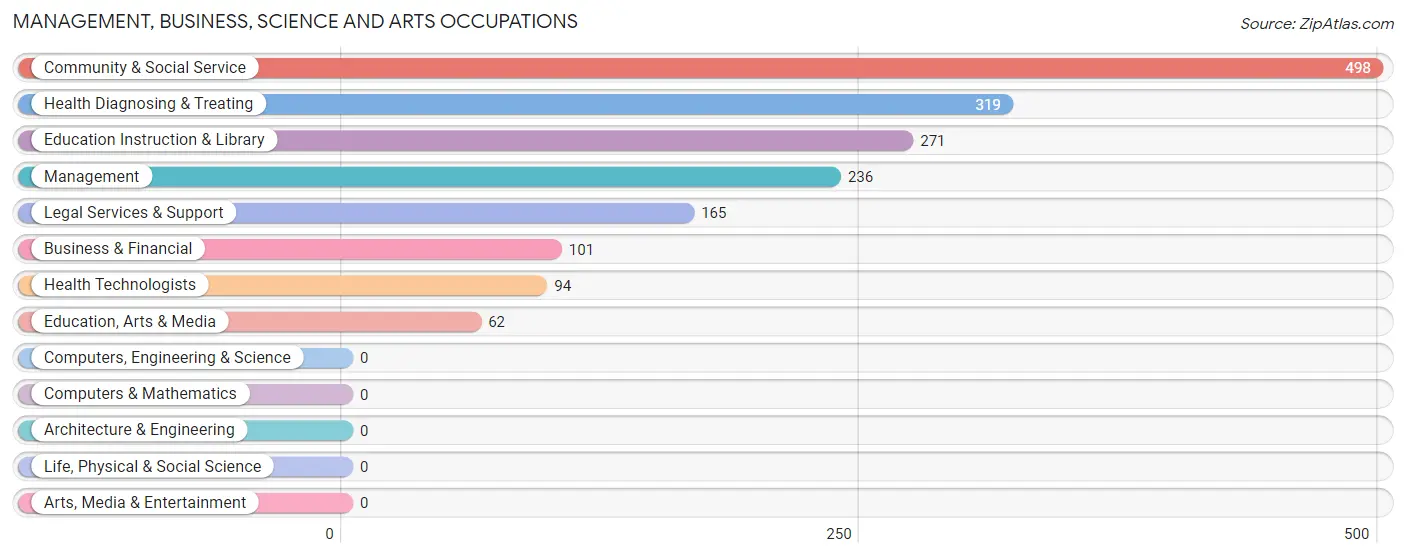
Management, Business, Science and Arts Occupations by Sex
Within the Management, Business, Science and Arts occupations in Cabo Rojo, the most male-oriented occupations are Health Technologists (71.3%), Management (67.4%), and Health Diagnosing & Treating (64.3%), while the most female-oriented occupations are Education Instruction & Library (91.1%), Legal Services & Support (90.9%), and Community & Social Service (89.2%).
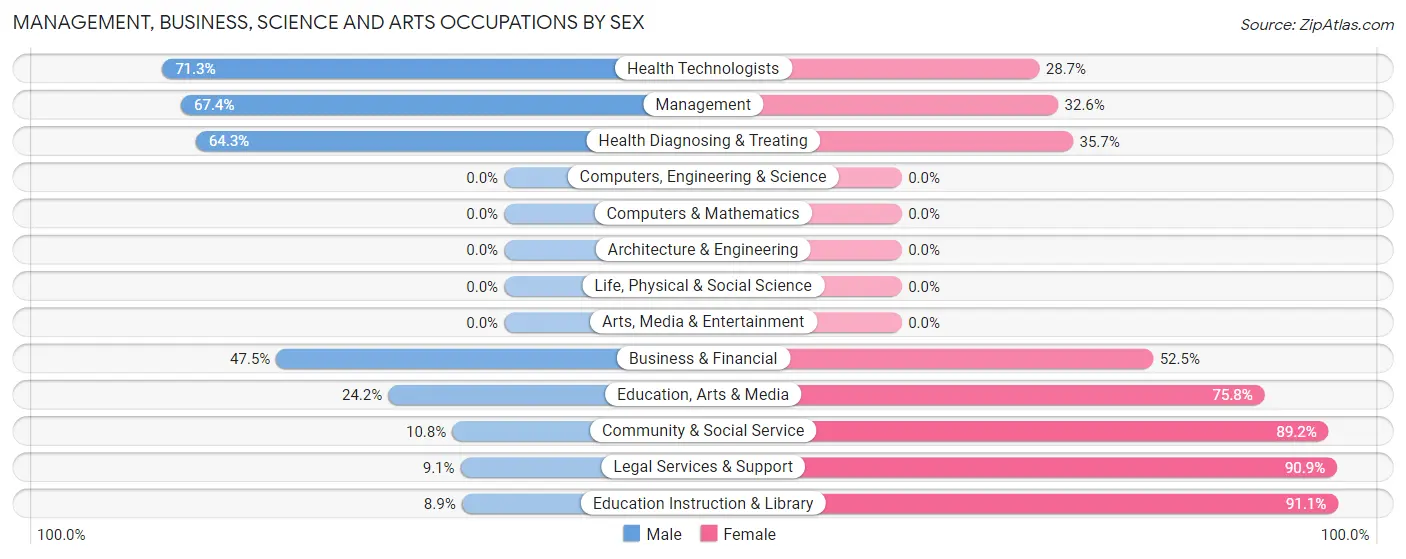
| Occupation | Male | Female |
| Management | 159 (67.4%) | 77 (32.6%) |
| Business & Financial | 48 (47.5%) | 53 (52.5%) |
| Computers, Engineering & Science | 0 (0.0%) | 0 (0.0%) |
| Computers & Mathematics | 0 (0.0%) | 0 (0.0%) |
| Architecture & Engineering | 0 (0.0%) | 0 (0.0%) |
| Life, Physical & Social Science | 0 (0.0%) | 0 (0.0%) |
| Community & Social Service | 54 (10.8%) | 444 (89.2%) |
| Education, Arts & Media | 15 (24.2%) | 47 (75.8%) |
| Legal Services & Support | 15 (9.1%) | 150 (90.9%) |
| Education Instruction & Library | 24 (8.9%) | 247 (91.1%) |
| Arts, Media & Entertainment | 0 (0.0%) | 0 (0.0%) |
| Health Diagnosing & Treating | 205 (64.3%) | 114 (35.7%) |
| Health Technologists | 67 (71.3%) | 27 (28.7%) |
| Total (Category) | 466 (40.4%) | 688 (59.6%) |
| Total (Overall) | 1,849 (51.1%) | 1,771 (48.9%) |
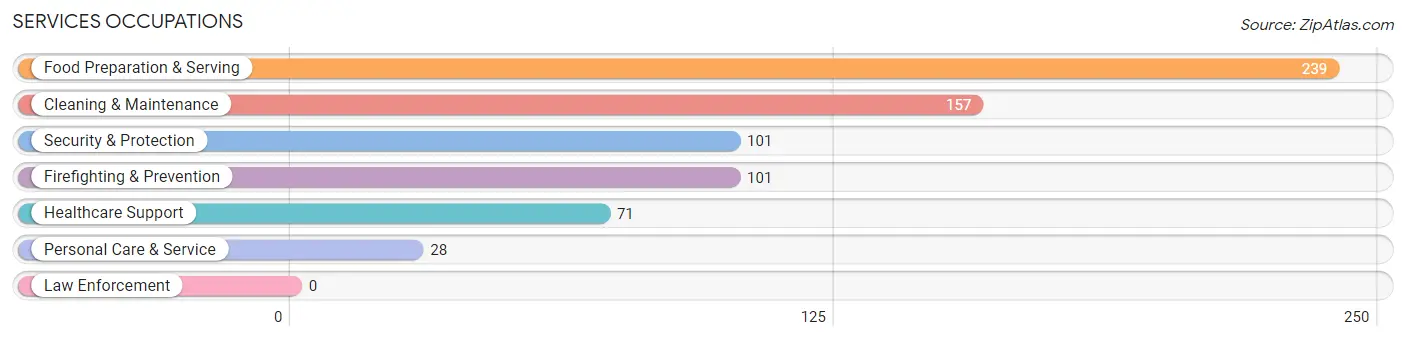
Services Occupations
The most common Services occupations in Cabo Rojo are Food Preparation & Serving (239 | 6.6%), Cleaning & Maintenance (157 | 4.3%), Security & Protection (101 | 2.8%), Firefighting & Prevention (101 | 2.8%), and Healthcare Support (71 | 2.0%).
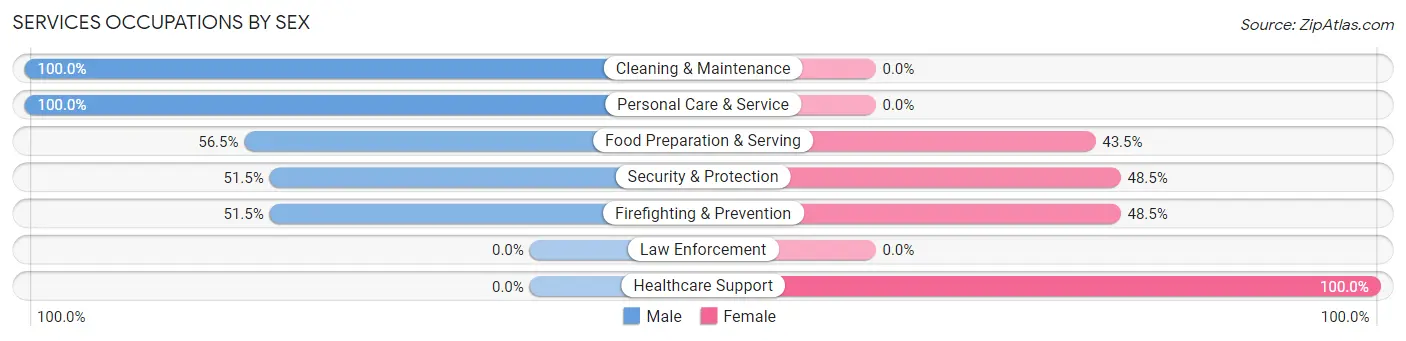
Services Occupations by Sex
Within the Services occupations in Cabo Rojo, the most male-oriented occupations are Cleaning & Maintenance (100.0%), Personal Care & Service (100.0%), and Food Preparation & Serving (56.5%), while the most female-oriented occupations are Healthcare Support (100.0%), Security & Protection (48.5%), and Firefighting & Prevention (48.5%).
| Occupation | Male | Female |
| Healthcare Support | 0 (0.0%) | 71 (100.0%) |
| Security & Protection | 52 (51.5%) | 49 (48.5%) |
| Firefighting & Prevention | 52 (51.5%) | 49 (48.5%) |
| Law Enforcement | 0 (0.0%) | 0 (0.0%) |
| Food Preparation & Serving | 135 (56.5%) | 104 (43.5%) |
| Cleaning & Maintenance | 157 (100.0%) | 0 (0.0%) |
| Personal Care & Service | 28 (100.0%) | 0 (0.0%) |
| Total (Category) | 372 (62.4%) | 224 (37.6%) |
| Total (Overall) | 1,849 (51.1%) | 1,771 (48.9%) |
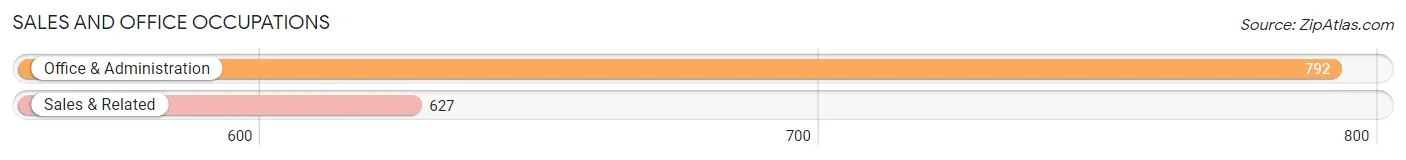
Sales and Office Occupations
The most common Sales and Office occupations in Cabo Rojo are Office & Administration (792 | 21.9%), and Sales & Related (627 | 17.3%).
Sales and Office Occupations by Sex
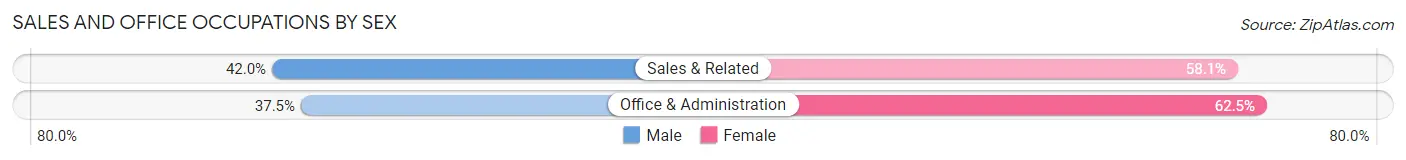
| Occupation | Male | Female |
| Sales & Related | 263 (41.9%) | 364 (58.1%) |
| Office & Administration | 297 (37.5%) | 495 (62.5%) |
| Total (Category) | 560 (39.5%) | 859 (60.5%) |
| Total (Overall) | 1,849 (51.1%) | 1,771 (48.9%) |
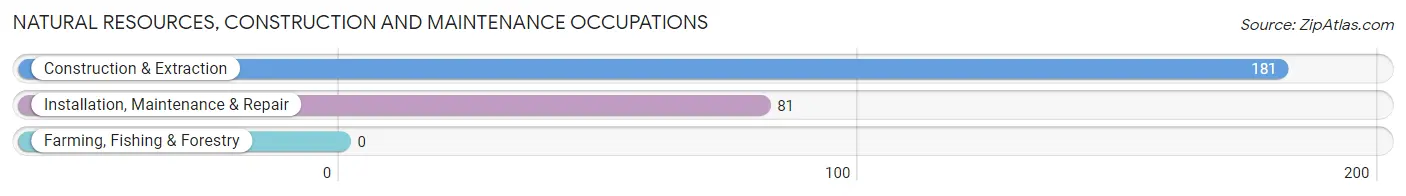
Natural Resources, Construction and Maintenance Occupations
The most common Natural Resources, Construction and Maintenance occupations in Cabo Rojo are Construction & Extraction (181 | 5.0%), and Installation, Maintenance & Repair (81 | 2.2%).
Natural Resources, Construction and Maintenance Occupations by Sex
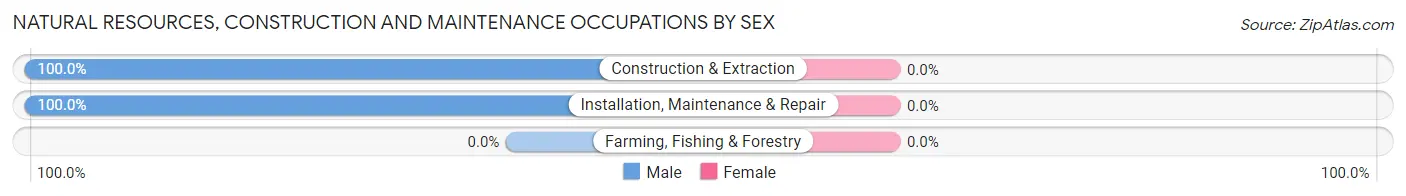
| Occupation | Male | Female |
| Farming, Fishing & Forestry | 0 (0.0%) | 0 (0.0%) |
| Construction & Extraction | 181 (100.0%) | 0 (0.0%) |
| Installation, Maintenance & Repair | 81 (100.0%) | 0 (0.0%) |
| Total (Category) | 262 (100.0%) | 0 (0.0%) |
| Total (Overall) | 1,849 (51.1%) | 1,771 (48.9%) |
Production, Transportation and Moving Occupations
The most common Production, Transportation and Moving occupations in Cabo Rojo are Production (105 | 2.9%), and Material Moving (84 | 2.3%).
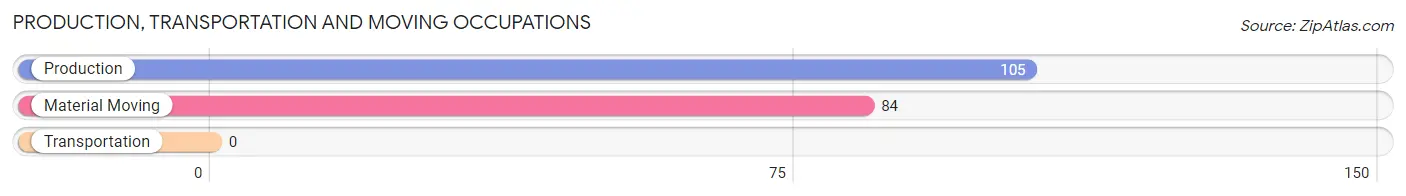
Production, Transportation and Moving Occupations by Sex
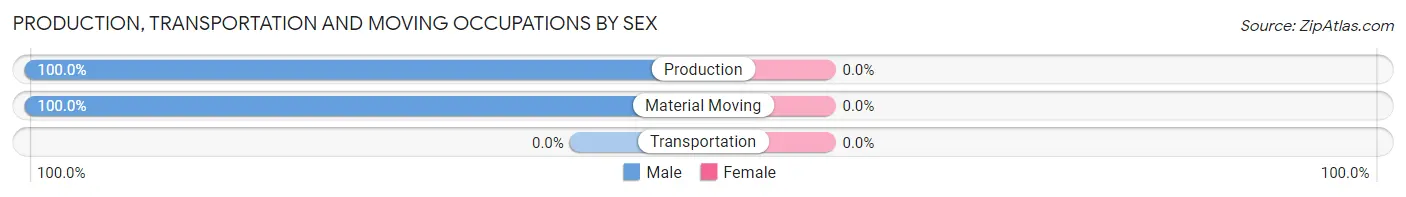
| Occupation | Male | Female |
| Production | 105 (100.0%) | 0 (0.0%) |
| Transportation | 0 (0.0%) | 0 (0.0%) |
| Material Moving | 84 (100.0%) | 0 (0.0%) |
| Total (Category) | 189 (100.0%) | 0 (0.0%) |
| Total (Overall) | 1,849 (51.1%) | 1,771 (48.9%) |
Employment Industries by Sex in Cabo Rojo
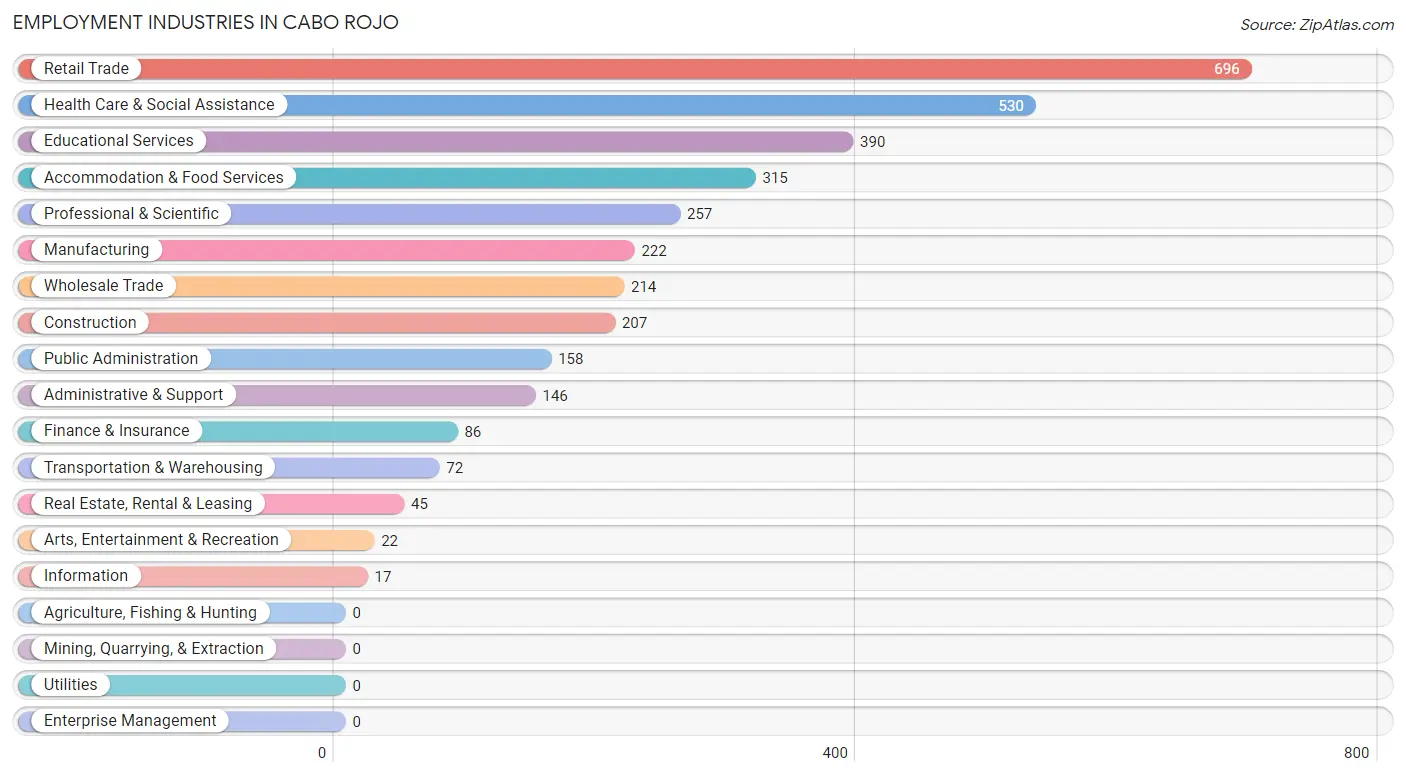
Employment Industries in Cabo Rojo
The major employment industries in Cabo Rojo include Retail Trade (696 | 19.2%), Health Care & Social Assistance (530 | 14.6%), Educational Services (390 | 10.8%), Accommodation & Food Services (315 | 8.7%), and Professional & Scientific (257 | 7.1%).
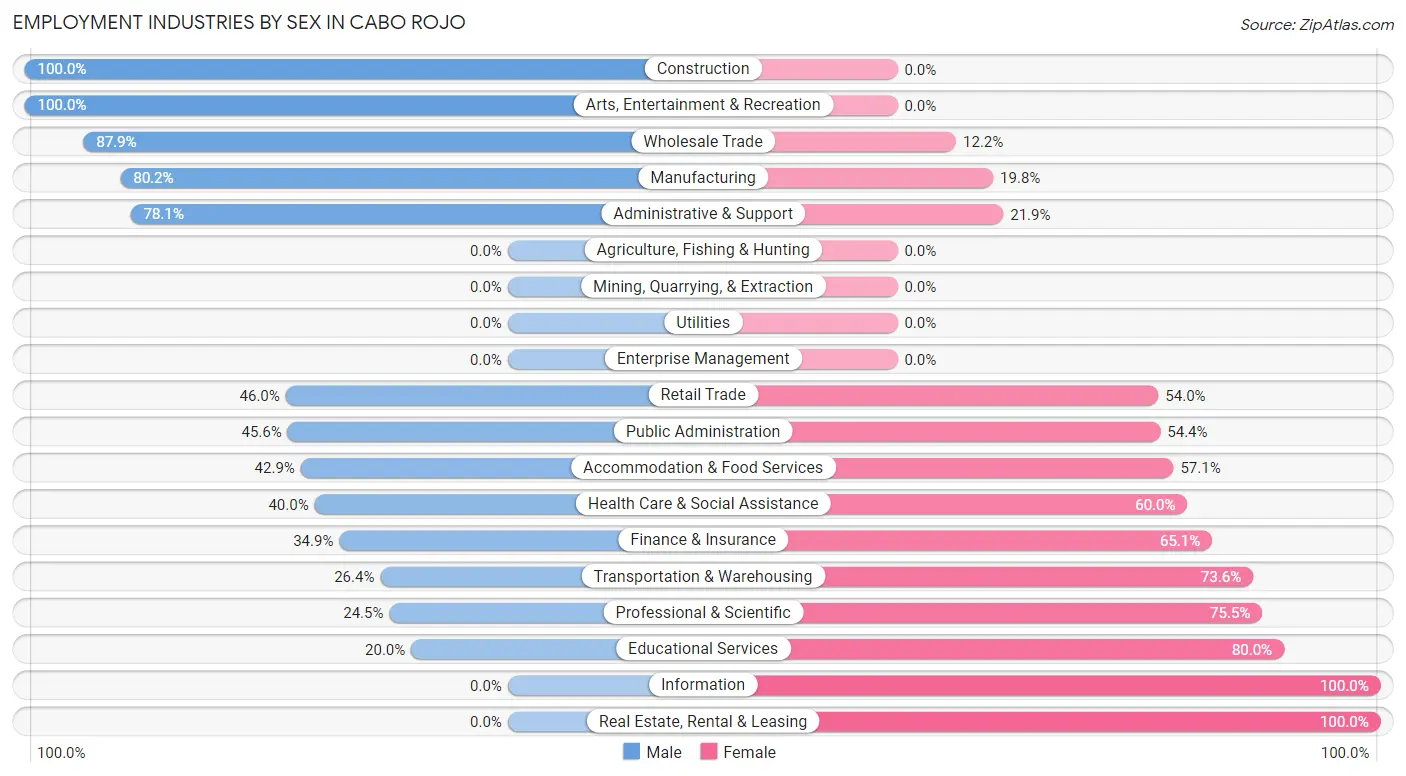
Employment Industries by Sex in Cabo Rojo
The Cabo Rojo industries that see more men than women are Construction (100.0%), Arts, Entertainment & Recreation (100.0%), and Wholesale Trade (87.8%), whereas the industries that tend to have a higher number of women are Information (100.0%), Real Estate, Rental & Leasing (100.0%), and Educational Services (80.0%).
| Industry | Male | Female |
| Agriculture, Fishing & Hunting | 0 (0.0%) | 0 (0.0%) |
| Mining, Quarrying, & Extraction | 0 (0.0%) | 0 (0.0%) |
| Construction | 207 (100.0%) | 0 (0.0%) |
| Manufacturing | 178 (80.2%) | 44 (19.8%) |
| Wholesale Trade | 188 (87.8%) | 26 (12.1%) |
| Retail Trade | 320 (46.0%) | 376 (54.0%) |
| Transportation & Warehousing | 19 (26.4%) | 53 (73.6%) |
| Utilities | 0 (0.0%) | 0 (0.0%) |
| Information | 0 (0.0%) | 17 (100.0%) |
| Finance & Insurance | 30 (34.9%) | 56 (65.1%) |
| Real Estate, Rental & Leasing | 0 (0.0%) | 45 (100.0%) |
| Professional & Scientific | 63 (24.5%) | 194 (75.5%) |
| Enterprise Management | 0 (0.0%) | 0 (0.0%) |
| Administrative & Support | 114 (78.1%) | 32 (21.9%) |
| Educational Services | 78 (20.0%) | 312 (80.0%) |
| Health Care & Social Assistance | 212 (40.0%) | 318 (60.0%) |
| Arts, Entertainment & Recreation | 22 (100.0%) | 0 (0.0%) |
| Accommodation & Food Services | 135 (42.9%) | 180 (57.1%) |
| Public Administration | 72 (45.6%) | 86 (54.4%) |
| Total | 1,849 (51.1%) | 1,771 (48.9%) |
Education in Cabo Rojo
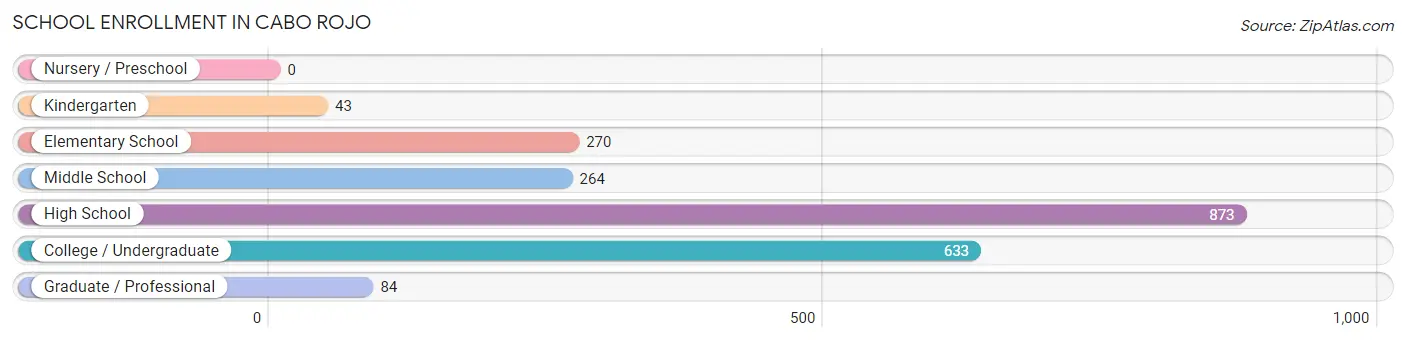
School Enrollment in Cabo Rojo
The most common levels of schooling among the 2,167 students in Cabo Rojo are high school (873 | 40.3%), college / undergraduate (633 | 29.2%), and elementary school (270 | 12.5%).
| School Level | # Students | % Students |
| Nursery / Preschool | 0 | 0.0% |
| Kindergarten | 43 | 2.0% |
| Elementary School | 270 | 12.5% |
| Middle School | 264 | 12.2% |
| High School | 873 | 40.3% |
| College / Undergraduate | 633 | 29.2% |
| Graduate / Professional | 84 | 3.9% |
| Total | 2,167 | 100.0% |
School Enrollment by Age by Funding Source in Cabo Rojo
Out of a total of 2,167 students who are enrolled in schools in Cabo Rojo, 1,270 (58.6%) attend a private institution, while the remaining 897 (41.4%) are enrolled in public schools. The age group of 25 to 34 year olds has the highest likelihood of being enrolled in private schools, with 160 (100.0% in the age bracket) enrolled. Conversely, the age group of 10 to 14 year olds has the lowest likelihood of being enrolled in a private school, with 372 (66.2% in the age bracket) attending a public institution.
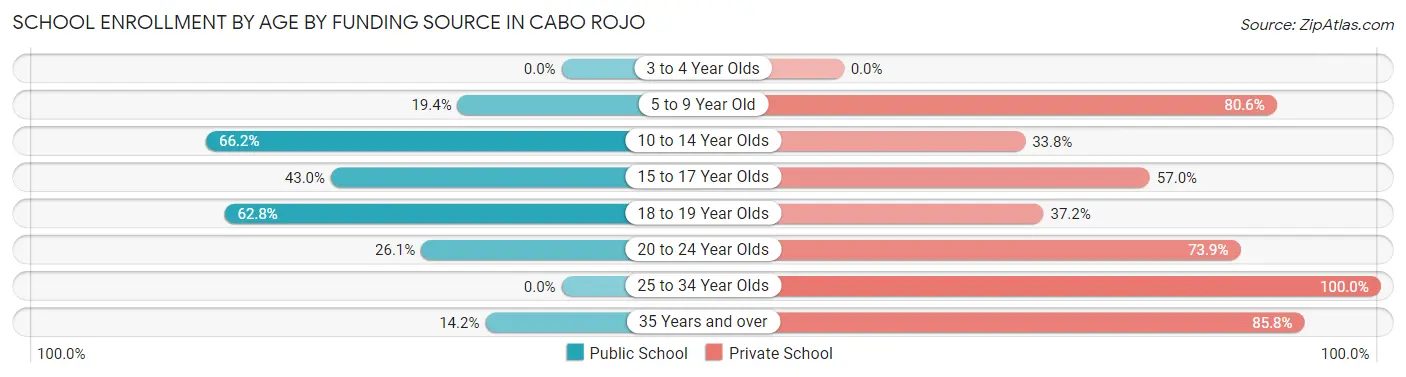
| Age Bracket | Public School | Private School |
| 3 to 4 Year Olds | 0 (0.0%) | 0 (0.0%) |
| 5 to 9 Year Old | 43 (19.4%) | 179 (80.6%) |
| 10 to 14 Year Olds | 372 (66.2%) | 190 (33.8%) |
| 15 to 17 Year Olds | 250 (43.0%) | 332 (57.0%) |
| 18 to 19 Year Olds | 145 (62.8%) | 86 (37.2%) |
| 20 to 24 Year Olds | 63 (26.1%) | 178 (73.9%) |
| 25 to 34 Year Olds | 0 (0.0%) | 160 (100.0%) |
| 35 Years and over | 24 (14.2%) | 145 (85.8%) |
| Total | 897 (41.4%) | 1,270 (58.6%) |
Educational Attainment by Field of Study in Cabo Rojo
Business (928 | 33.6%), education (451 | 16.3%), bio, nature & agricultural (297 | 10.7%), arts & humanities (259 | 9.4%), and science & technology (244 | 8.8%) are the most common fields of study among 2,762 individuals in Cabo Rojo who have obtained a bachelor's degree or higher.
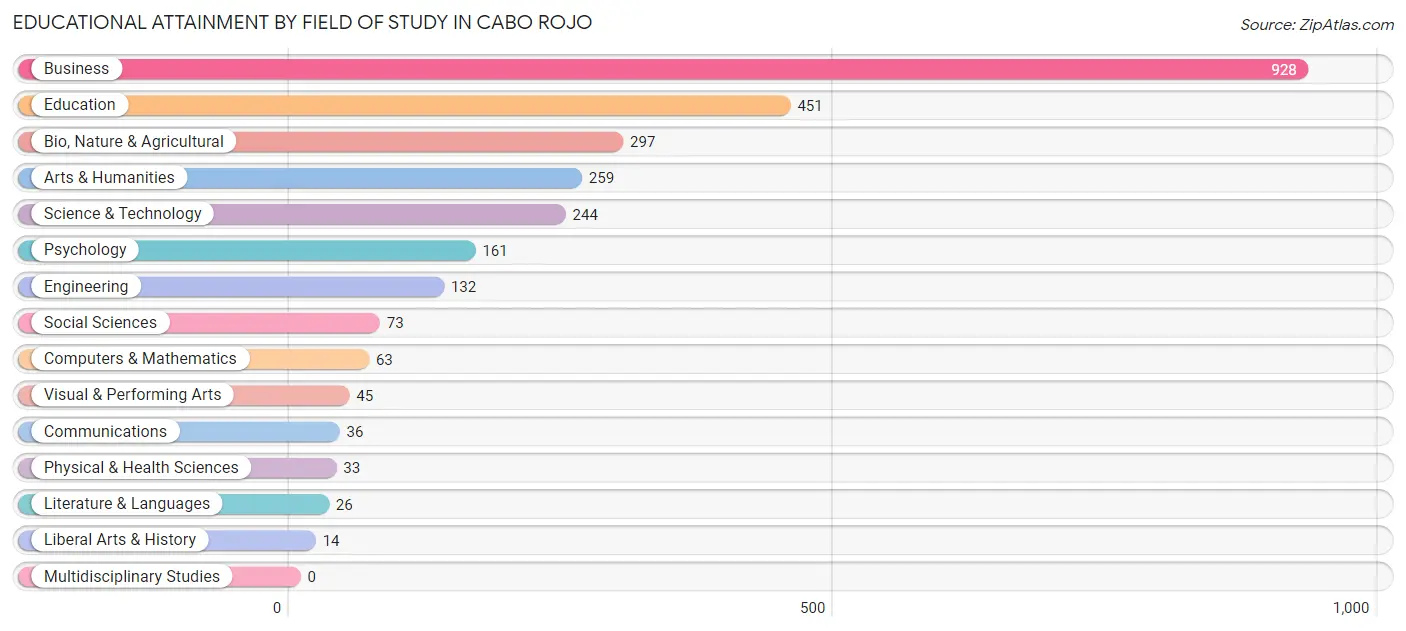
| Field of Study | # Graduates | % Graduates |
| Computers & Mathematics | 63 | 2.3% |
| Bio, Nature & Agricultural | 297 | 10.7% |
| Physical & Health Sciences | 33 | 1.2% |
| Psychology | 161 | 5.8% |
| Social Sciences | 73 | 2.6% |
| Engineering | 132 | 4.8% |
| Multidisciplinary Studies | 0 | 0.0% |
| Science & Technology | 244 | 8.8% |
| Business | 928 | 33.6% |
| Education | 451 | 16.3% |
| Literature & Languages | 26 | 0.9% |
| Liberal Arts & History | 14 | 0.5% |
| Visual & Performing Arts | 45 | 1.6% |
| Communications | 36 | 1.3% |
| Arts & Humanities | 259 | 9.4% |
| Total | 2,762 | 100.0% |
Transportation & Commute in Cabo Rojo
Vehicle Availability by Sex in Cabo Rojo
The most prevalent vehicle ownership categories in Cabo Rojo are males with 2 vehicles (765, accounting for 41.8%) and females with 2 vehicles (433, making up 45.0%).
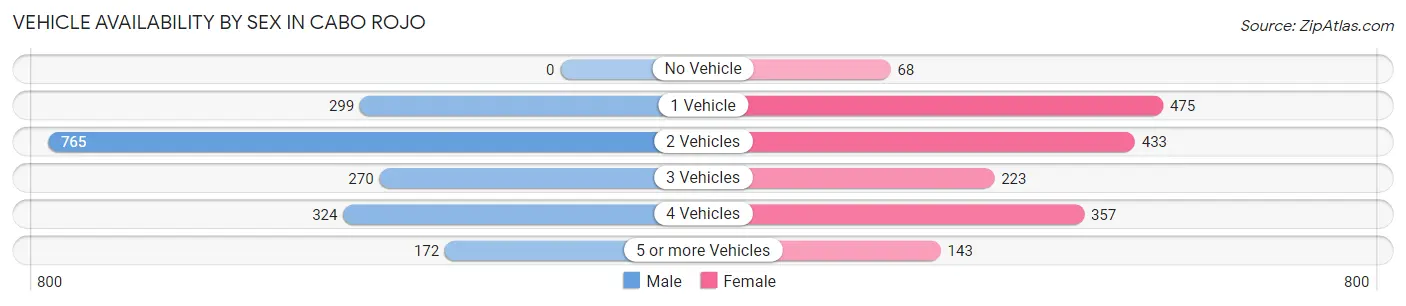
| Vehicles Available | Male | Female |
| No Vehicle | 0 (0.0%) | 68 (4.0%) |
| 1 Vehicle | 299 (16.3%) | 475 (28.0%) |
| 2 Vehicles | 765 (41.8%) | 433 (25.5%) |
| 3 Vehicles | 270 (14.7%) | 223 (13.1%) |
| 4 Vehicles | 324 (17.7%) | 357 (21.0%) |
| 5 or more Vehicles | 172 (9.4%) | 143 (8.4%) |
| Total | 1,830 (100.0%) | 1,699 (100.0%) |
Commute Time in Cabo Rojo
The most frequently occuring commute durations in Cabo Rojo are 10 to 14 minutes (778 commuters, 23.7%), 20 to 24 minutes (562 commuters, 17.2%), and 15 to 19 minutes (445 commuters, 13.6%).
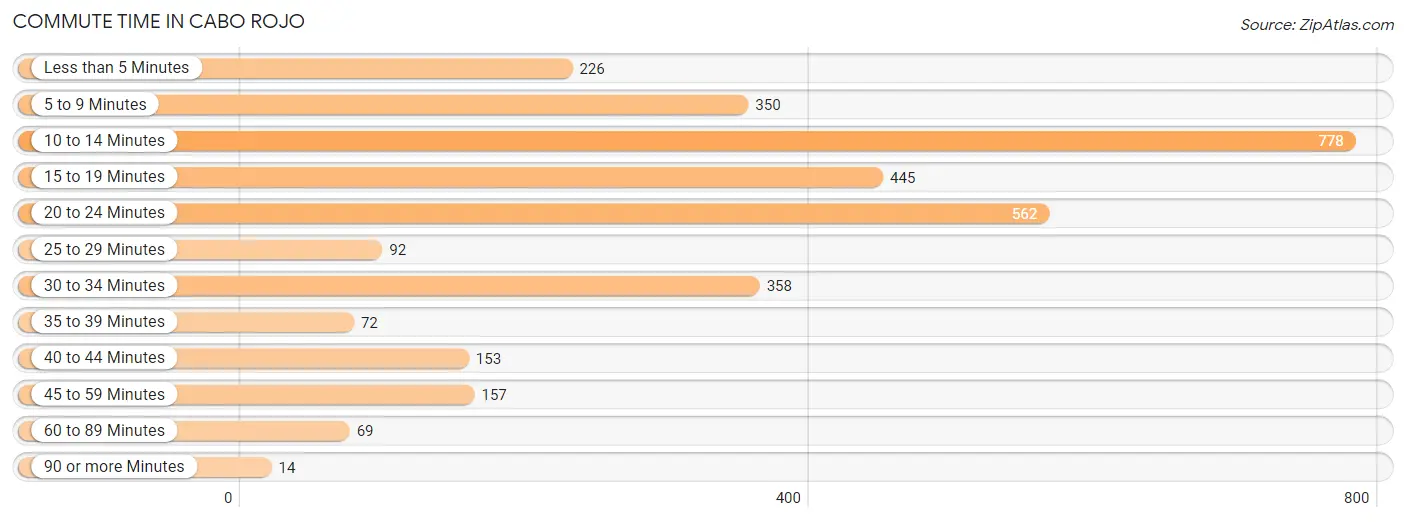
| Commute Time | # Commuters | % Commuters |
| Less than 5 Minutes | 226 | 6.9% |
| 5 to 9 Minutes | 350 | 10.7% |
| 10 to 14 Minutes | 778 | 23.7% |
| 15 to 19 Minutes | 445 | 13.6% |
| 20 to 24 Minutes | 562 | 17.2% |
| 25 to 29 Minutes | 92 | 2.8% |
| 30 to 34 Minutes | 358 | 10.9% |
| 35 to 39 Minutes | 72 | 2.2% |
| 40 to 44 Minutes | 153 | 4.7% |
| 45 to 59 Minutes | 157 | 4.8% |
| 60 to 89 Minutes | 69 | 2.1% |
| 90 or more Minutes | 14 | 0.4% |
Commute Time by Sex in Cabo Rojo
The most common commute times in Cabo Rojo are 10 to 14 minutes (359 commuters, 21.0%) for males and 10 to 14 minutes (419 commuters, 26.8%) for females.
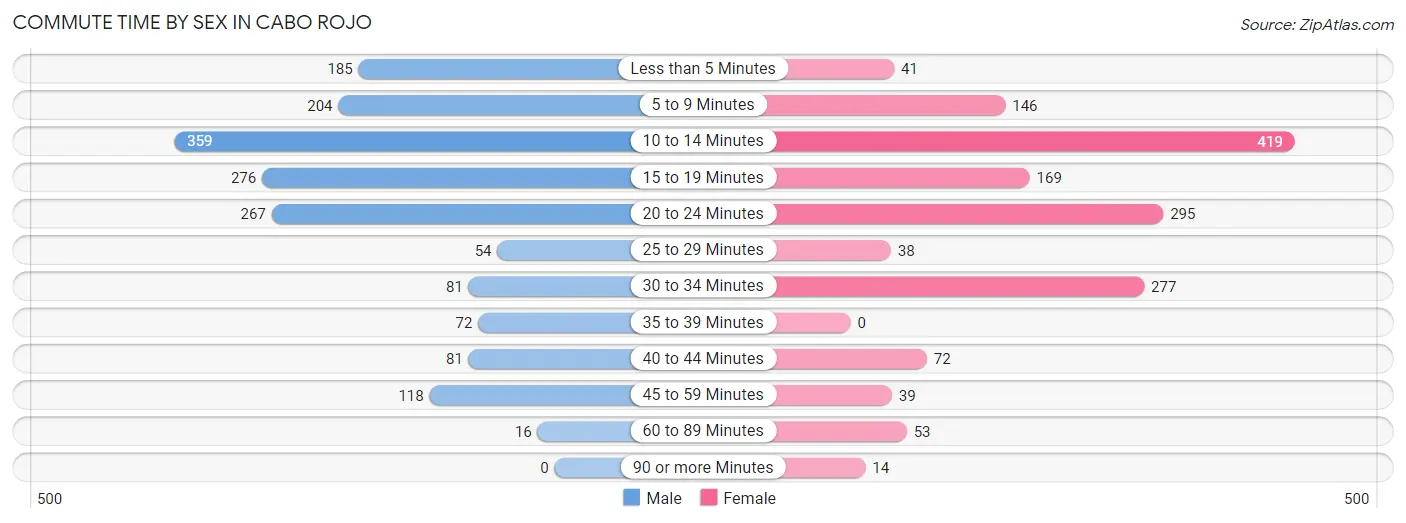
| Commute Time | Male | Female |
| Less than 5 Minutes | 185 (10.8%) | 41 (2.6%) |
| 5 to 9 Minutes | 204 (11.9%) | 146 (9.3%) |
| 10 to 14 Minutes | 359 (21.0%) | 419 (26.8%) |
| 15 to 19 Minutes | 276 (16.1%) | 169 (10.8%) |
| 20 to 24 Minutes | 267 (15.6%) | 295 (18.9%) |
| 25 to 29 Minutes | 54 (3.2%) | 38 (2.4%) |
| 30 to 34 Minutes | 81 (4.7%) | 277 (17.7%) |
| 35 to 39 Minutes | 72 (4.2%) | 0 (0.0%) |
| 40 to 44 Minutes | 81 (4.7%) | 72 (4.6%) |
| 45 to 59 Minutes | 118 (6.9%) | 39 (2.5%) |
| 60 to 89 Minutes | 16 (0.9%) | 53 (3.4%) |
| 90 or more Minutes | 0 (0.0%) | 14 (0.9%) |
Time of Departure to Work by Sex in Cabo Rojo
The most frequent times of departure to work in Cabo Rojo are 6:30 AM to 6:59 AM (391, 22.8%) for males and 7:00 AM to 7:29 AM (278, 17.8%) for females.
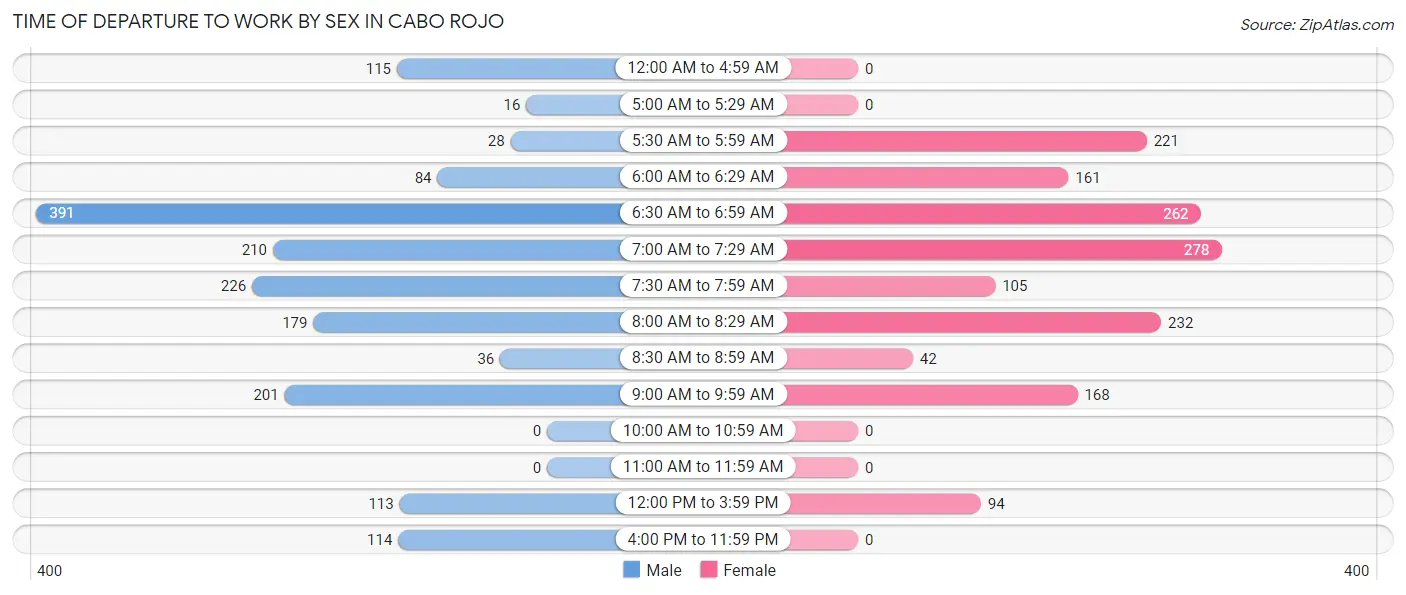
| Time of Departure | Male | Female |
| 12:00 AM to 4:59 AM | 115 (6.7%) | 0 (0.0%) |
| 5:00 AM to 5:29 AM | 16 (0.9%) | 0 (0.0%) |
| 5:30 AM to 5:59 AM | 28 (1.6%) | 221 (14.1%) |
| 6:00 AM to 6:29 AM | 84 (4.9%) | 161 (10.3%) |
| 6:30 AM to 6:59 AM | 391 (22.8%) | 262 (16.8%) |
| 7:00 AM to 7:29 AM | 210 (12.3%) | 278 (17.8%) |
| 7:30 AM to 7:59 AM | 226 (13.2%) | 105 (6.7%) |
| 8:00 AM to 8:29 AM | 179 (10.4%) | 232 (14.8%) |
| 8:30 AM to 8:59 AM | 36 (2.1%) | 42 (2.7%) |
| 9:00 AM to 9:59 AM | 201 (11.7%) | 168 (10.7%) |
| 10:00 AM to 10:59 AM | 0 (0.0%) | 0 (0.0%) |
| 11:00 AM to 11:59 AM | 0 (0.0%) | 0 (0.0%) |
| 12:00 PM to 3:59 PM | 113 (6.6%) | 94 (6.0%) |
| 4:00 PM to 11:59 PM | 114 (6.7%) | 0 (0.0%) |
| Total | 1,713 (100.0%) | 1,563 (100.0%) |
Housing Occupancy in Cabo Rojo
Occupancy by Ownership in Cabo Rojo
Of the total 3,572 dwellings in Cabo Rojo, owner-occupied units account for 2,705 (75.7%), while renter-occupied units make up 867 (24.3%).
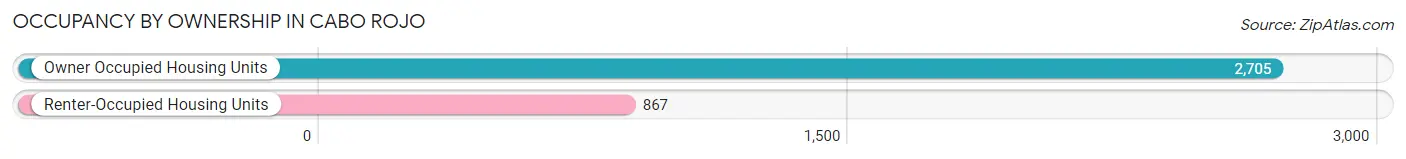
| Occupancy | # Housing Units | % Housing Units |
| Owner Occupied Housing Units | 2,705 | 75.7% |
| Renter-Occupied Housing Units | 867 | 24.3% |
| Total Occupied Housing Units | 3,572 | 100.0% |
Occupancy by Household Size in Cabo Rojo
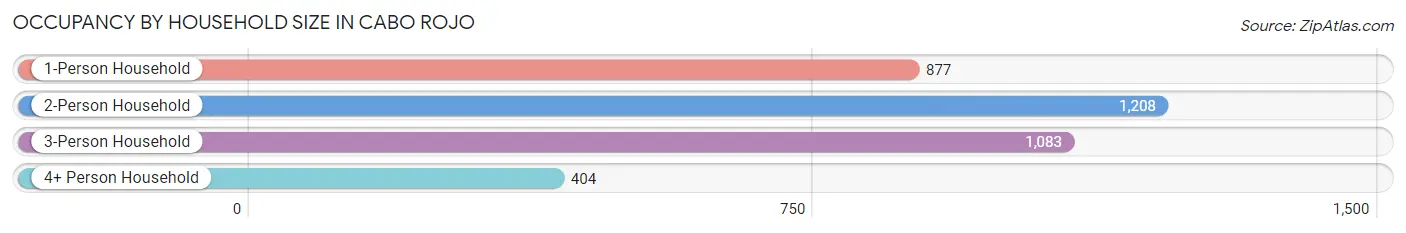
| Household Size | # Housing Units | % Housing Units |
| 1-Person Household | 877 | 24.5% |
| 2-Person Household | 1,208 | 33.8% |
| 3-Person Household | 1,083 | 30.3% |
| 4+ Person Household | 404 | 11.3% |
| Total Housing Units | 3,572 | 100.0% |
Occupancy by Ownership by Household Size in Cabo Rojo
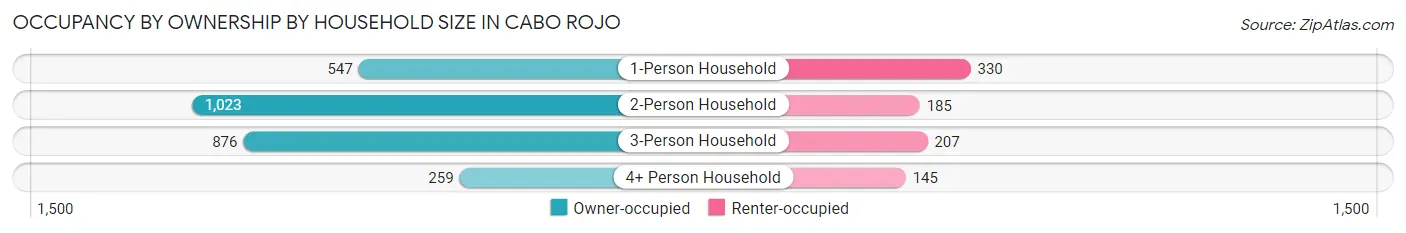
| Household Size | Owner-occupied | Renter-occupied |
| 1-Person Household | 547 (62.4%) | 330 (37.6%) |
| 2-Person Household | 1,023 (84.7%) | 185 (15.3%) |
| 3-Person Household | 876 (80.9%) | 207 (19.1%) |
| 4+ Person Household | 259 (64.1%) | 145 (35.9%) |
| Total Housing Units | 2,705 (75.7%) | 867 (24.3%) |
Occupancy by Educational Attainment in Cabo Rojo
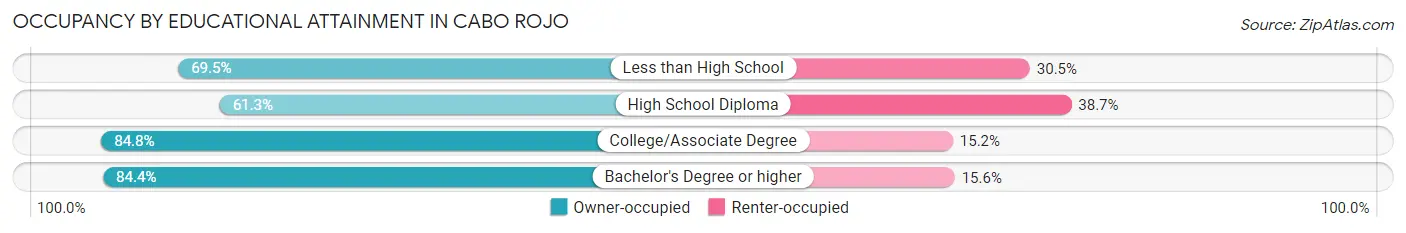
| Household Size | Owner-occupied | Renter-occupied |
| Less than High School | 470 (69.5%) | 206 (30.5%) |
| High School Diploma | 564 (61.3%) | 356 (38.7%) |
| College/Associate Degree | 652 (84.8%) | 117 (15.2%) |
| Bachelor's Degree or higher | 1,019 (84.4%) | 188 (15.6%) |
Occupancy by Age of Householder in Cabo Rojo
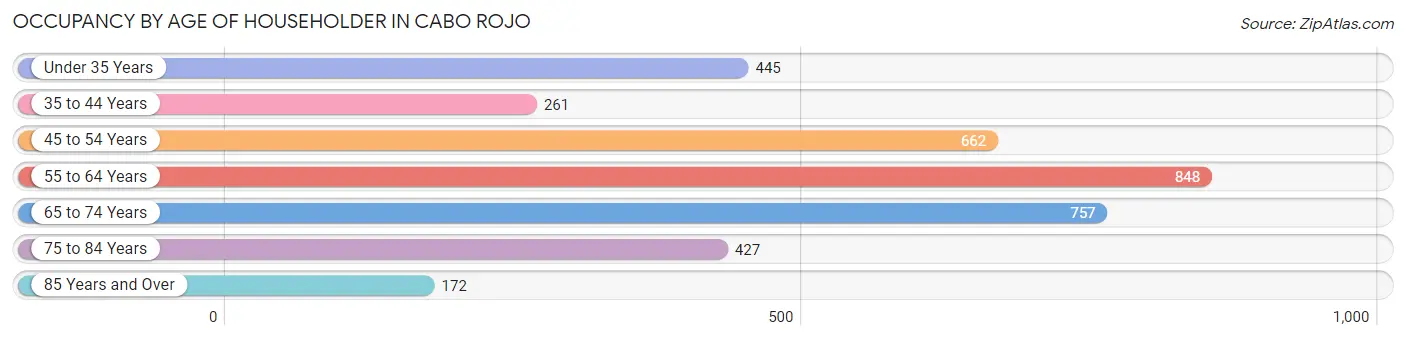
| Age Bracket | # Households | % Households |
| Under 35 Years | 445 | 12.5% |
| 35 to 44 Years | 261 | 7.3% |
| 45 to 54 Years | 662 | 18.5% |
| 55 to 64 Years | 848 | 23.7% |
| 65 to 74 Years | 757 | 21.2% |
| 75 to 84 Years | 427 | 11.9% |
| 85 Years and Over | 172 | 4.8% |
| Total | 3,572 | 100.0% |
Housing Finances in Cabo Rojo
Median Income by Occupancy in Cabo Rojo
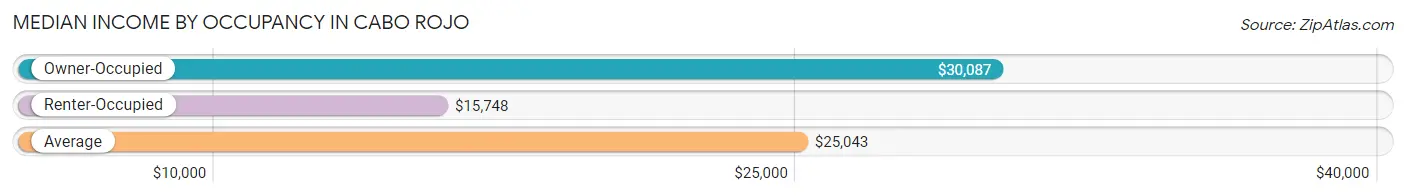
| Occupancy Type | # Households | Median Income |
| Owner-Occupied | 2,705 (75.7%) | $30,087 |
| Renter-Occupied | 867 (24.3%) | $15,748 |
| Average | 3,572 (100.0%) | $25,043 |
Occupancy by Householder Income Bracket in Cabo Rojo
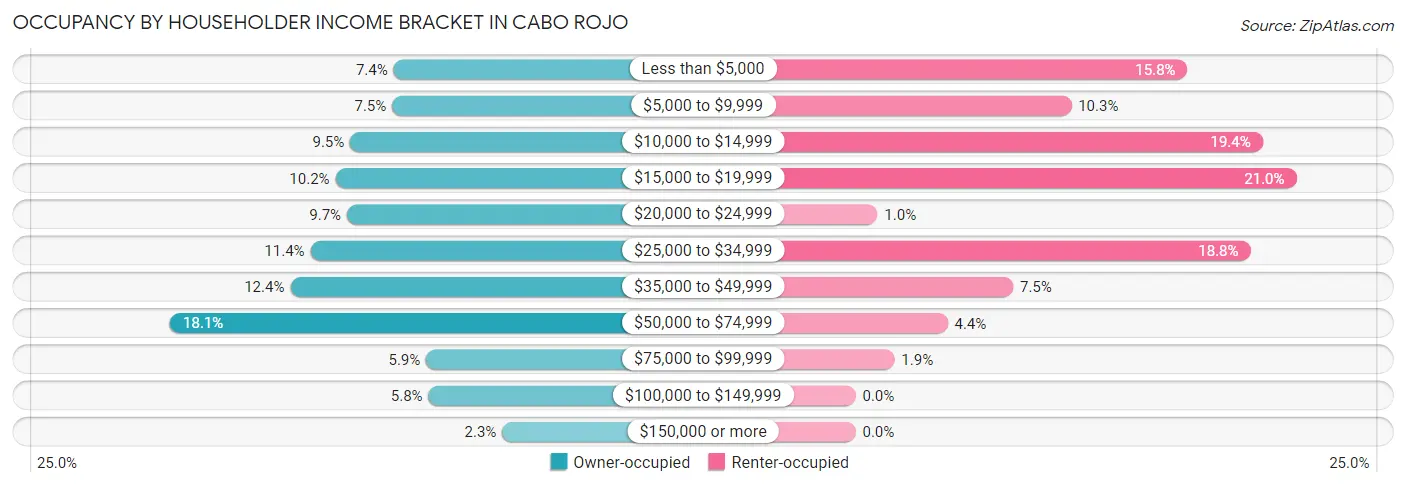
| Income Bracket | Owner-occupied | Renter-occupied |
| Less than $5,000 | 201 (7.4%) | 137 (15.8%) |
| $5,000 to $9,999 | 203 (7.5%) | 89 (10.3%) |
| $10,000 to $14,999 | 257 (9.5%) | 168 (19.4%) |
| $15,000 to $19,999 | 276 (10.2%) | 182 (21.0%) |
| $20,000 to $24,999 | 261 (9.7%) | 9 (1.0%) |
| $25,000 to $34,999 | 308 (11.4%) | 163 (18.8%) |
| $35,000 to $49,999 | 334 (12.3%) | 65 (7.5%) |
| $50,000 to $74,999 | 489 (18.1%) | 38 (4.4%) |
| $75,000 to $99,999 | 159 (5.9%) | 16 (1.8%) |
| $100,000 to $149,999 | 156 (5.8%) | 0 (0.0%) |
| $150,000 or more | 61 (2.3%) | 0 (0.0%) |
| Total | 2,705 (100.0%) | 867 (100.0%) |
Monthly Housing Cost Tiers in Cabo Rojo
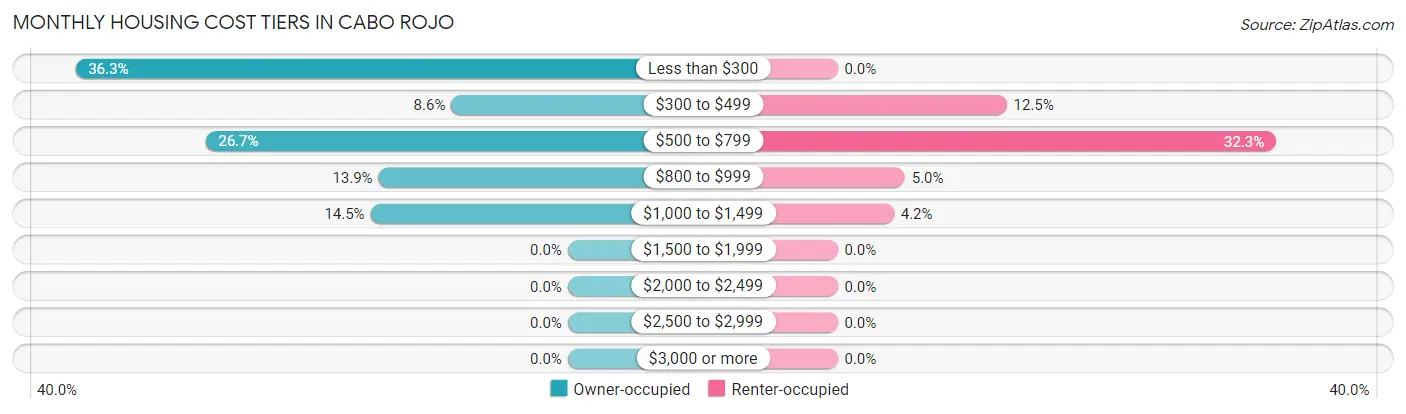
| Monthly Cost | Owner-occupied | Renter-occupied |
| Less than $300 | 981 (36.3%) | 0 (0.0%) |
| $300 to $499 | 232 (8.6%) | 108 (12.5%) |
| $500 to $799 | 722 (26.7%) | 280 (32.3%) |
| $800 to $999 | 377 (13.9%) | 43 (5.0%) |
| $1,000 to $1,499 | 393 (14.5%) | 36 (4.2%) |
| $1,500 to $1,999 | 0 (0.0%) | 0 (0.0%) |
| $2,000 to $2,499 | 0 (0.0%) | 0 (0.0%) |
| $2,500 to $2,999 | 0 (0.0%) | 0 (0.0%) |
| $3,000 or more | 0 (0.0%) | 0 (0.0%) |
| Total | 2,705 (100.0%) | 867 (100.0%) |
Physical Housing Characteristics in Cabo Rojo
Housing Structures in Cabo Rojo
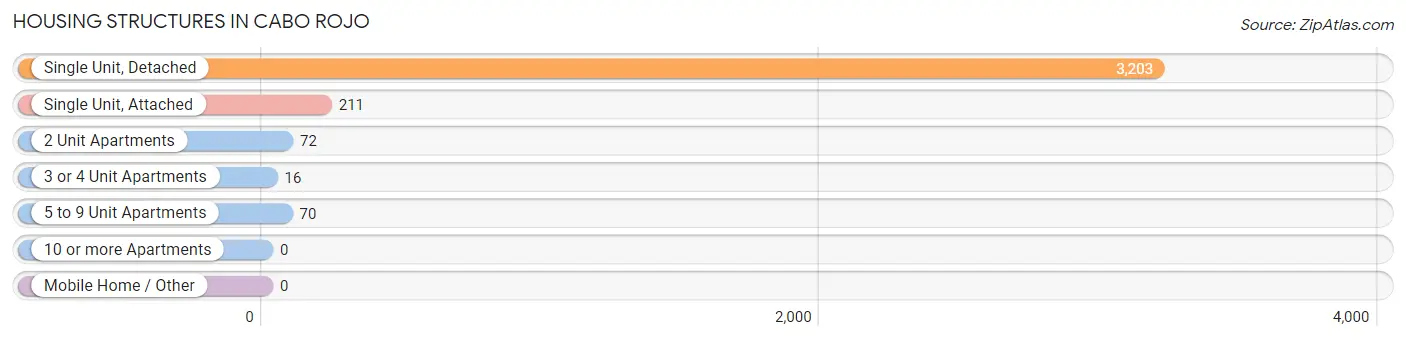
| Structure Type | # Housing Units | % Housing Units |
| Single Unit, Detached | 3,203 | 89.7% |
| Single Unit, Attached | 211 | 5.9% |
| 2 Unit Apartments | 72 | 2.0% |
| 3 or 4 Unit Apartments | 16 | 0.4% |
| 5 to 9 Unit Apartments | 70 | 2.0% |
| 10 or more Apartments | 0 | 0.0% |
| Mobile Home / Other | 0 | 0.0% |
| Total | 3,572 | 100.0% |
Housing Structures by Occupancy in Cabo Rojo
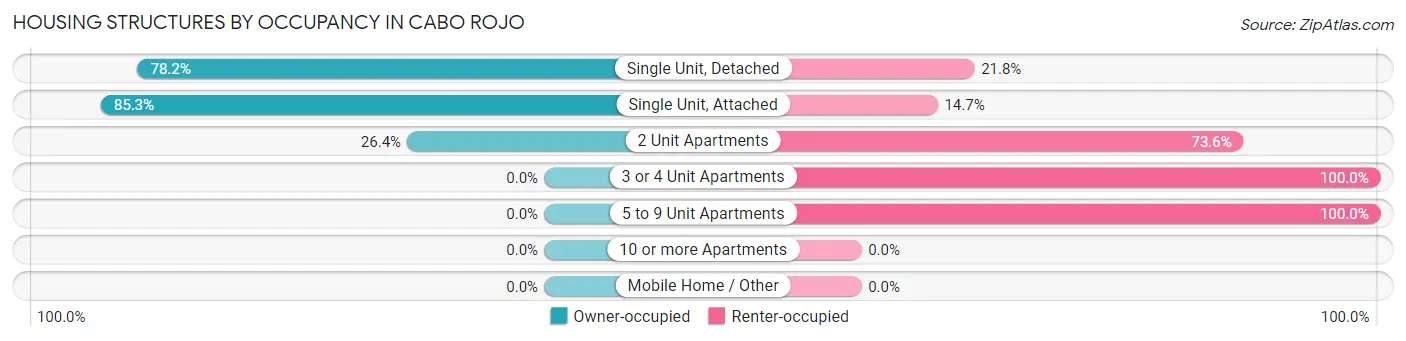
| Structure Type | Owner-occupied | Renter-occupied |
| Single Unit, Detached | 2,506 (78.2%) | 697 (21.8%) |
| Single Unit, Attached | 180 (85.3%) | 31 (14.7%) |
| 2 Unit Apartments | 19 (26.4%) | 53 (73.6%) |
| 3 or 4 Unit Apartments | 0 (0.0%) | 16 (100.0%) |
| 5 to 9 Unit Apartments | 0 (0.0%) | 70 (100.0%) |
| 10 or more Apartments | 0 (0.0%) | 0 (0.0%) |
| Mobile Home / Other | 0 (0.0%) | 0 (0.0%) |
| Total | 2,705 (75.7%) | 867 (24.3%) |
Housing Structures by Number of Rooms in Cabo Rojo
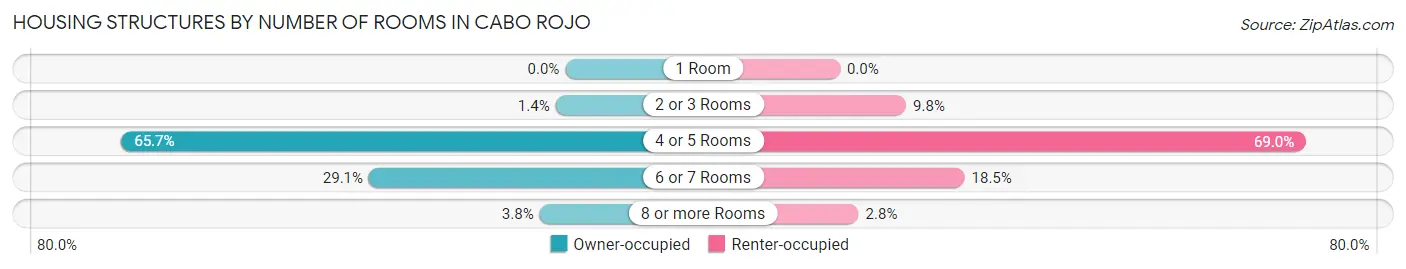
| Number of Rooms | Owner-occupied | Renter-occupied |
| 1 Room | 0 (0.0%) | 0 (0.0%) |
| 2 or 3 Rooms | 39 (1.4%) | 85 (9.8%) |
| 4 or 5 Rooms | 1,777 (65.7%) | 598 (69.0%) |
| 6 or 7 Rooms | 786 (29.1%) | 160 (18.4%) |
| 8 or more Rooms | 103 (3.8%) | 24 (2.8%) |
| Total | 2,705 (100.0%) | 867 (100.0%) |
Housing Structure by Heating Type in Cabo Rojo
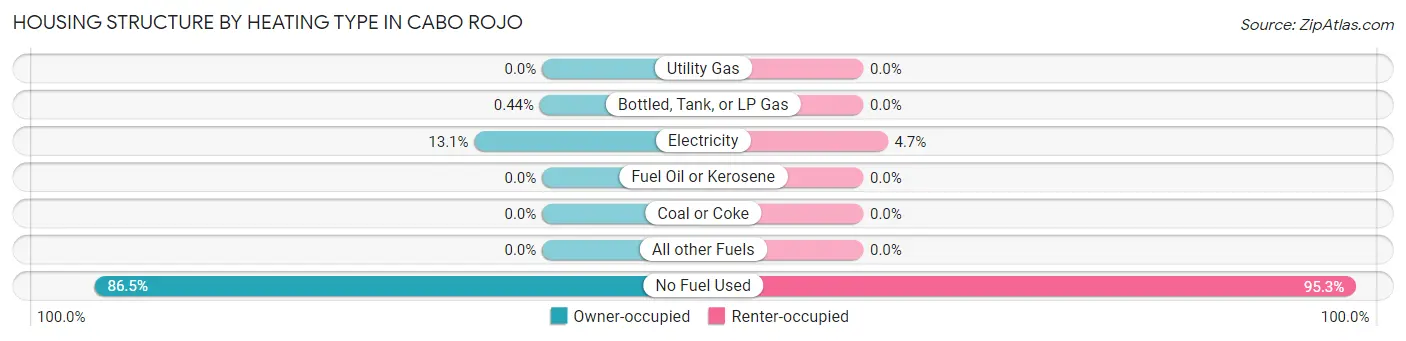
| Heating Type | Owner-occupied | Renter-occupied |
| Utility Gas | 0 (0.0%) | 0 (0.0%) |
| Bottled, Tank, or LP Gas | 12 (0.4%) | 0 (0.0%) |
| Electricity | 354 (13.1%) | 41 (4.7%) |
| Fuel Oil or Kerosene | 0 (0.0%) | 0 (0.0%) |
| Coal or Coke | 0 (0.0%) | 0 (0.0%) |
| All other Fuels | 0 (0.0%) | 0 (0.0%) |
| No Fuel Used | 2,339 (86.5%) | 826 (95.3%) |
| Total | 2,705 (100.0%) | 867 (100.0%) |
Household Vehicle Usage in Cabo Rojo
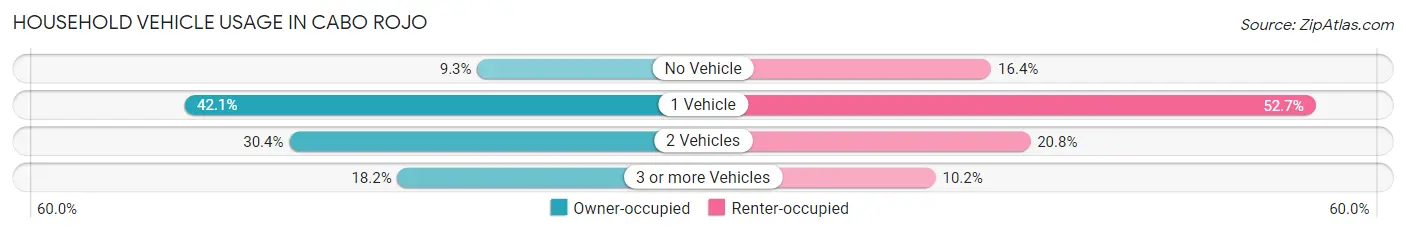
| Vehicles per Household | Owner-occupied | Renter-occupied |
| No Vehicle | 251 (9.3%) | 142 (16.4%) |
| 1 Vehicle | 1,140 (42.1%) | 457 (52.7%) |
| 2 Vehicles | 821 (30.3%) | 180 (20.8%) |
| 3 or more Vehicles | 493 (18.2%) | 88 (10.2%) |
| Total | 2,705 (100.0%) | 867 (100.0%) |
Real Estate & Mortgages in Cabo Rojo
Real Estate and Mortgage Overview in Cabo Rojo
| Characteristic | Without Mortgage | With Mortgage |
| Housing Units | 1,230 | 1,475 |
| Median Property Value | $111,300 | $136,700 |
| Median Household Income | $23,500 | $31 |
| Monthly Housing Costs | $181 | $0 |
| Real Estate Taxes | $453 | $1,365 |
Property Value by Mortgage Status in Cabo Rojo
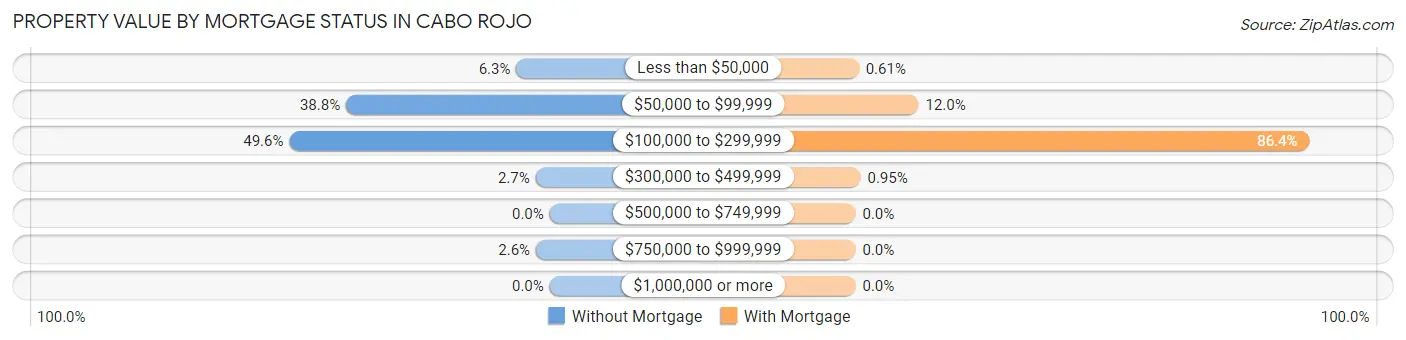
| Property Value | Without Mortgage | With Mortgage |
| Less than $50,000 | 78 (6.3%) | 9 (0.6%) |
| $50,000 to $99,999 | 477 (38.8%) | 177 (12.0%) |
| $100,000 to $299,999 | 610 (49.6%) | 1,275 (86.4%) |
| $300,000 to $499,999 | 33 (2.7%) | 14 (0.9%) |
| $500,000 to $749,999 | 0 (0.0%) | 0 (0.0%) |
| $750,000 to $999,999 | 32 (2.6%) | 0 (0.0%) |
| $1,000,000 or more | 0 (0.0%) | 0 (0.0%) |
| Total | 1,230 (100.0%) | 1,475 (100.0%) |
Household Income by Mortgage Status in Cabo Rojo
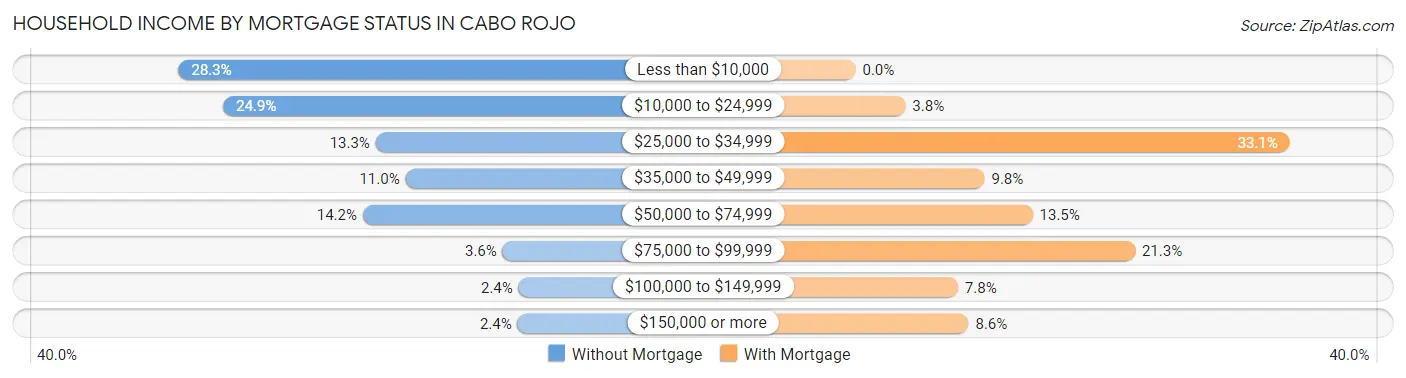
| Household Income | Without Mortgage | With Mortgage |
| Less than $10,000 | 348 (28.3%) | 0 (0.0%) |
| $10,000 to $24,999 | 306 (24.9%) | 56 (3.8%) |
| $25,000 to $34,999 | 163 (13.3%) | 488 (33.1%) |
| $35,000 to $49,999 | 135 (11.0%) | 145 (9.8%) |
| $50,000 to $74,999 | 175 (14.2%) | 199 (13.5%) |
| $75,000 to $99,999 | 44 (3.6%) | 314 (21.3%) |
| $100,000 to $149,999 | 29 (2.4%) | 115 (7.8%) |
| $150,000 or more | 30 (2.4%) | 127 (8.6%) |
| Total | 1,230 (100.0%) | 1,475 (100.0%) |
Property Value to Household Income Ratio in Cabo Rojo
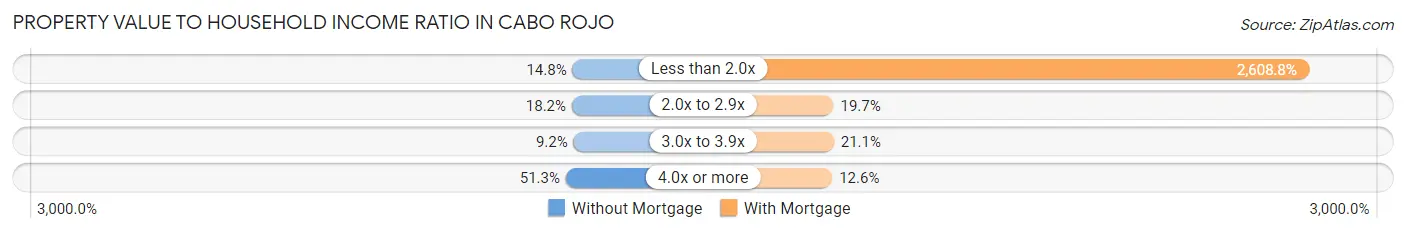
| Value-to-Income Ratio | Without Mortgage | With Mortgage |
| Less than 2.0x | 182 (14.8%) | 38,479 (2,608.7%) |
| 2.0x to 2.9x | 224 (18.2%) | 291 (19.7%) |
| 3.0x to 3.9x | 113 (9.2%) | 311 (21.1%) |
| 4.0x or more | 631 (51.3%) | 186 (12.6%) |
| Total | 1,230 (100.0%) | 1,475 (100.0%) |
Real Estate Taxes by Mortgage Status in Cabo Rojo
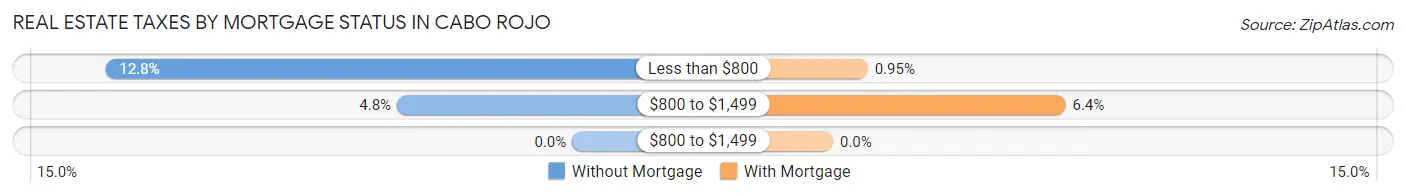
| Property Taxes | Without Mortgage | With Mortgage |
| Less than $800 | 157 (12.8%) | 14 (0.9%) |
| $800 to $1,499 | 59 (4.8%) | 94 (6.4%) |
| $800 to $1,499 | 0 (0.0%) | 0 (0.0%) |
| Total | 1,230 (100.0%) | 1,475 (100.0%) |
Health & Disability in Cabo Rojo
Health Insurance Coverage by Age in Cabo Rojo
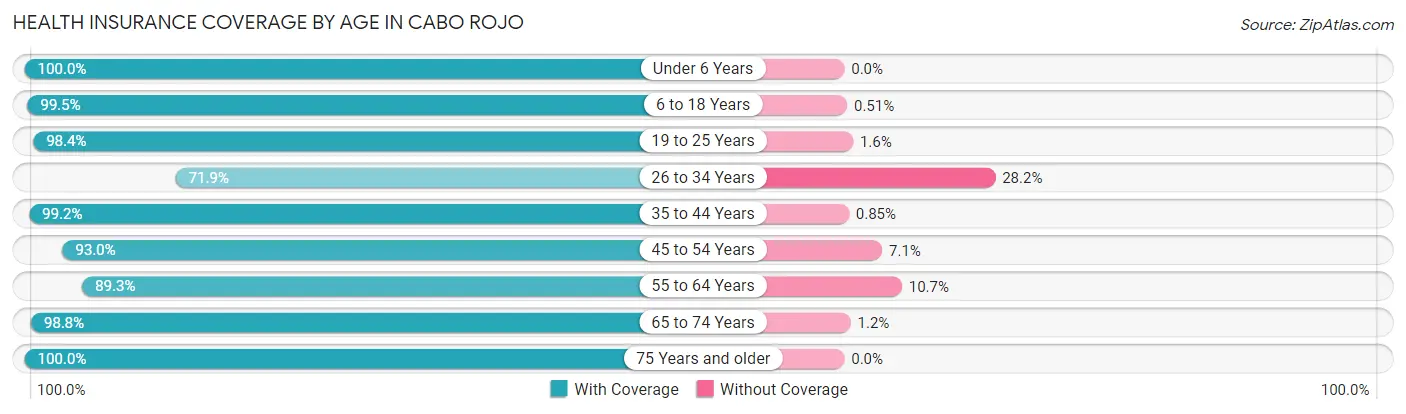
| Age Bracket | With Coverage | Without Coverage |
| Under 6 Years | 248 (100.0%) | 0 (0.0%) |
| 6 to 18 Years | 1,751 (99.5%) | 9 (0.5%) |
| 19 to 25 Years | 857 (98.4%) | 14 (1.6%) |
| 26 to 34 Years | 763 (71.9%) | 299 (28.1%) |
| 35 to 44 Years | 1,162 (99.2%) | 10 (0.9%) |
| 45 to 54 Years | 1,121 (92.9%) | 85 (7.0%) |
| 55 to 64 Years | 1,407 (89.3%) | 169 (10.7%) |
| 65 to 74 Years | 1,184 (98.8%) | 14 (1.2%) |
| 75 Years and older | 1,044 (100.0%) | 0 (0.0%) |
| Total | 9,537 (94.1%) | 600 (5.9%) |
Health Insurance Coverage by Citizenship Status in Cabo Rojo
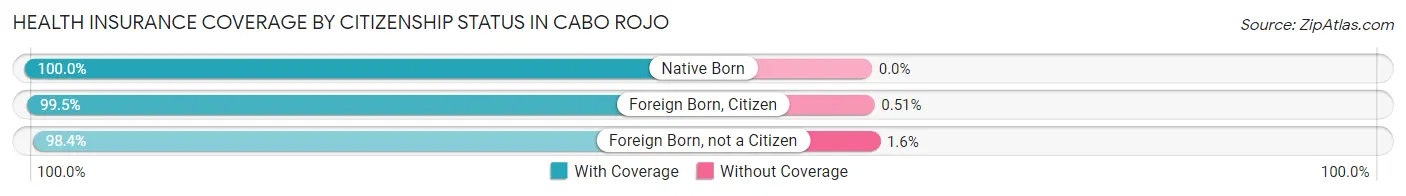
| Citizenship Status | With Coverage | Without Coverage |
| Native Born | 248 (100.0%) | 0 (0.0%) |
| Foreign Born, Citizen | 1,751 (99.5%) | 9 (0.5%) |
| Foreign Born, not a Citizen | 857 (98.4%) | 14 (1.6%) |
Health Insurance Coverage by Household Income in Cabo Rojo
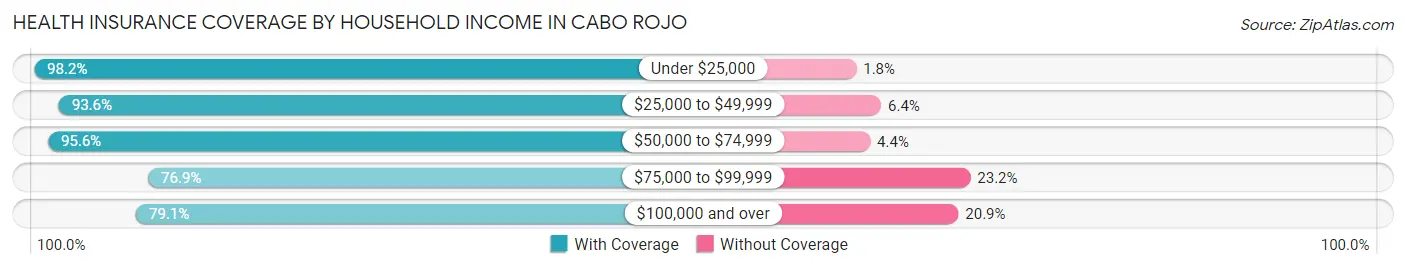
| Household Income | With Coverage | Without Coverage |
| Under $25,000 | 3,866 (98.2%) | 70 (1.8%) |
| $25,000 to $49,999 | 2,465 (93.6%) | 169 (6.4%) |
| $50,000 to $74,999 | 2,273 (95.6%) | 104 (4.4%) |
| $75,000 to $99,999 | 342 (76.8%) | 103 (23.2%) |
| $100,000 and over | 583 (79.1%) | 154 (20.9%) |
Public vs Private Health Insurance Coverage by Age in Cabo Rojo
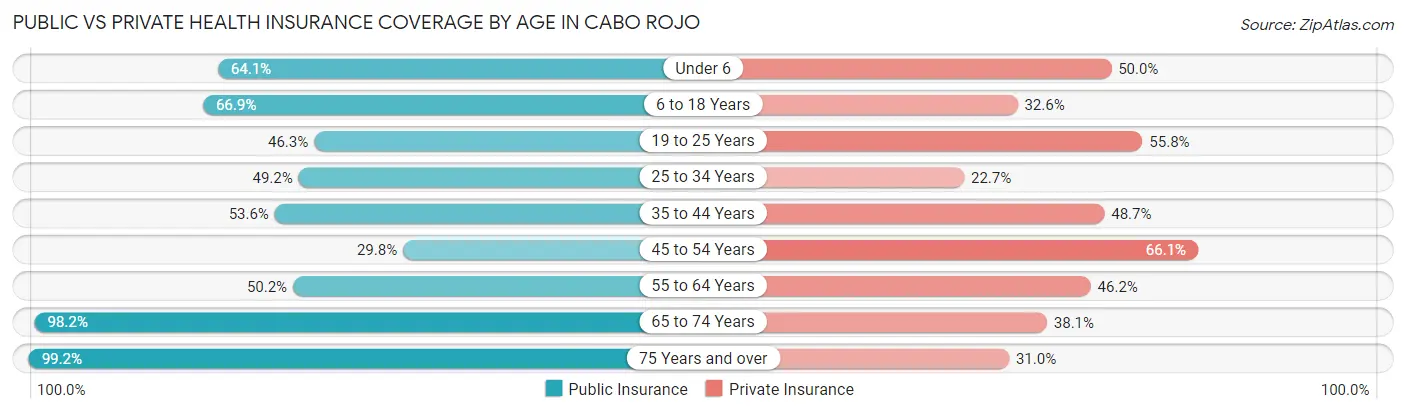
| Age Bracket | Public Insurance | Private Insurance |
| Under 6 | 159 (64.1%) | 124 (50.0%) |
| 6 to 18 Years | 1,177 (66.9%) | 574 (32.6%) |
| 19 to 25 Years | 403 (46.3%) | 486 (55.8%) |
| 25 to 34 Years | 522 (49.1%) | 241 (22.7%) |
| 35 to 44 Years | 628 (53.6%) | 571 (48.7%) |
| 45 to 54 Years | 359 (29.8%) | 797 (66.1%) |
| 55 to 64 Years | 791 (50.2%) | 728 (46.2%) |
| 65 to 74 Years | 1,176 (98.2%) | 456 (38.1%) |
| 75 Years and over | 1,036 (99.2%) | 324 (31.0%) |
| Total | 6,251 (61.7%) | 4,301 (42.4%) |
Disability Status by Sex by Age in Cabo Rojo
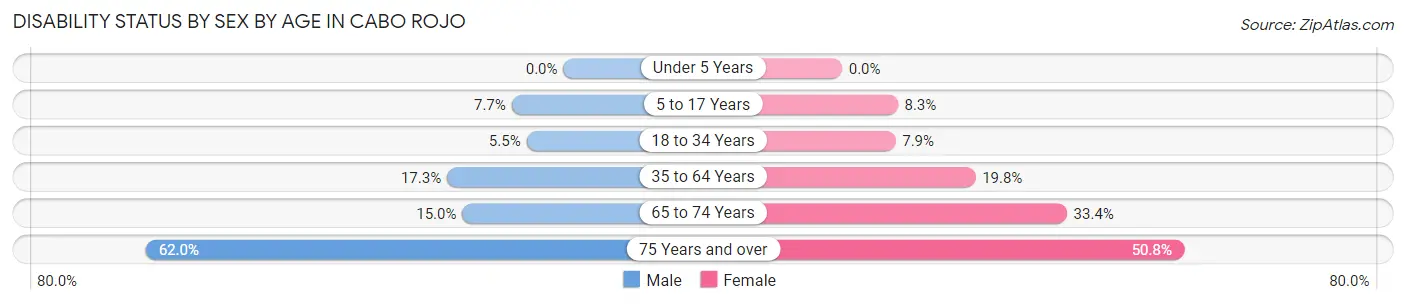
| Age Bracket | Male | Female |
| Under 5 Years | 0 (0.0%) | 0 (0.0%) |
| 5 to 17 Years | 70 (7.7%) | 68 (8.3%) |
| 18 to 34 Years | 60 (5.5%) | 75 (7.9%) |
| 35 to 64 Years | 276 (17.3%) | 467 (19.8%) |
| 65 to 74 Years | 84 (15.0%) | 213 (33.4%) |
| 75 Years and over | 204 (62.0%) | 363 (50.8%) |
Disability Class by Sex by Age in Cabo Rojo
Disability Class: Hearing Difficulty
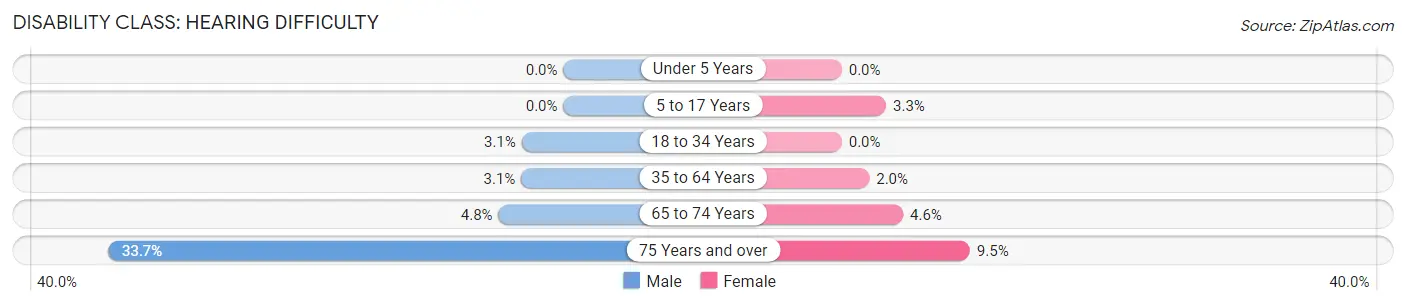
| Age Bracket | Male | Female |
| Under 5 Years | 0 (0.0%) | 0 (0.0%) |
| 5 to 17 Years | 0 (0.0%) | 27 (3.3%) |
| 18 to 34 Years | 34 (3.1%) | 0 (0.0%) |
| 35 to 64 Years | 50 (3.1%) | 48 (2.0%) |
| 65 to 74 Years | 27 (4.8%) | 29 (4.5%) |
| 75 Years and over | 111 (33.7%) | 68 (9.5%) |
Disability Class: Vision Difficulty
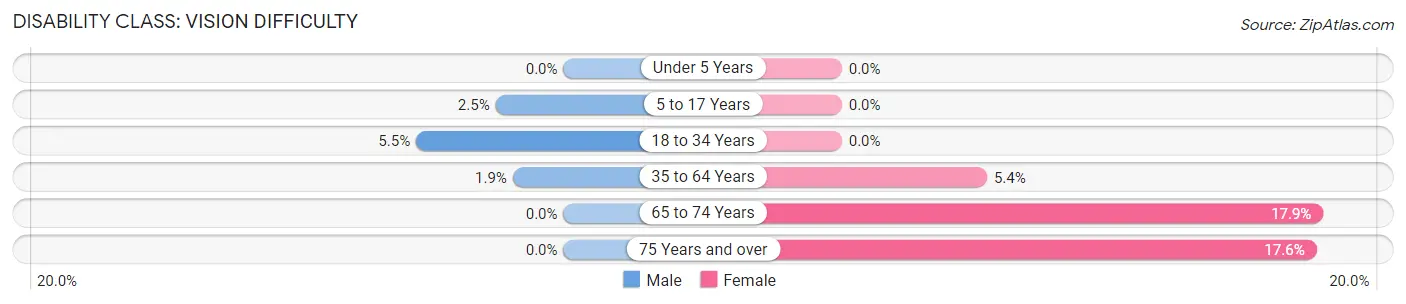
| Age Bracket | Male | Female |
| Under 5 Years | 0 (0.0%) | 0 (0.0%) |
| 5 to 17 Years | 23 (2.5%) | 0 (0.0%) |
| 18 to 34 Years | 60 (5.5%) | 0 (0.0%) |
| 35 to 64 Years | 30 (1.9%) | 127 (5.4%) |
| 65 to 74 Years | 0 (0.0%) | 114 (17.9%) |
| 75 Years and over | 0 (0.0%) | 126 (17.6%) |
Disability Class: Cognitive Difficulty
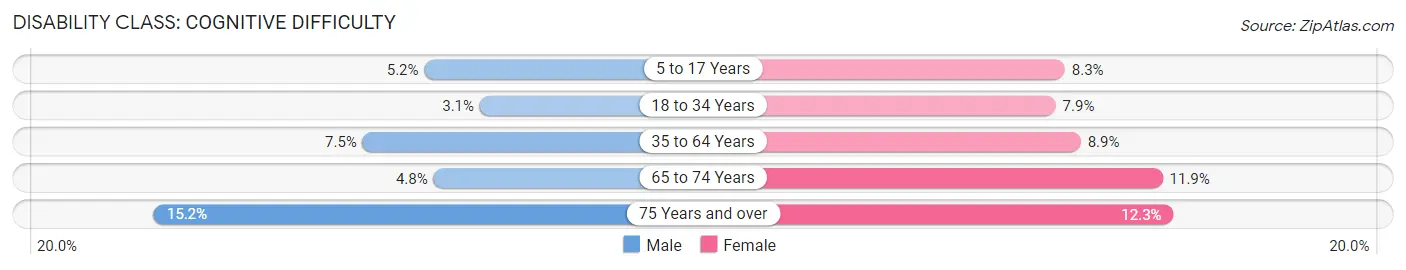
| Age Bracket | Male | Female |
| 5 to 17 Years | 47 (5.2%) | 68 (8.3%) |
| 18 to 34 Years | 34 (3.1%) | 75 (7.9%) |
| 35 to 64 Years | 119 (7.4%) | 209 (8.9%) |
| 65 to 74 Years | 27 (4.8%) | 76 (11.9%) |
| 75 Years and over | 50 (15.2%) | 88 (12.3%) |
Disability Class: Ambulatory Difficulty
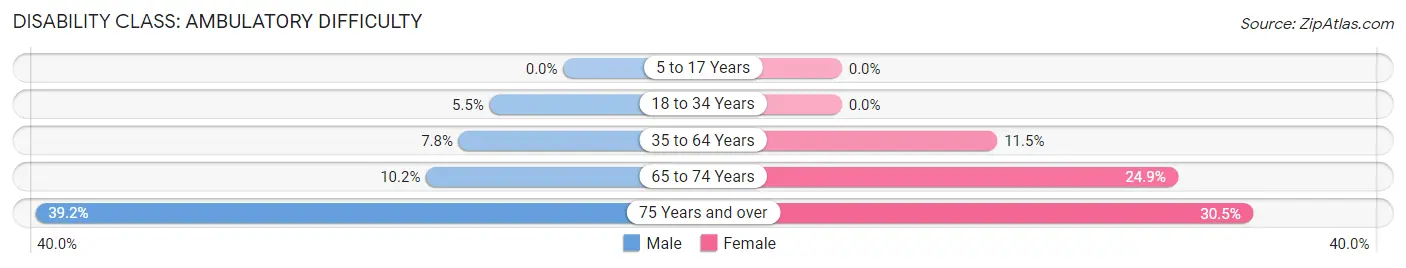
| Age Bracket | Male | Female |
| 5 to 17 Years | 0 (0.0%) | 0 (0.0%) |
| 18 to 34 Years | 60 (5.5%) | 0 (0.0%) |
| 35 to 64 Years | 124 (7.8%) | 272 (11.5%) |
| 65 to 74 Years | 57 (10.2%) | 159 (24.9%) |
| 75 Years and over | 129 (39.2%) | 218 (30.5%) |
Disability Class: Self-Care Difficulty
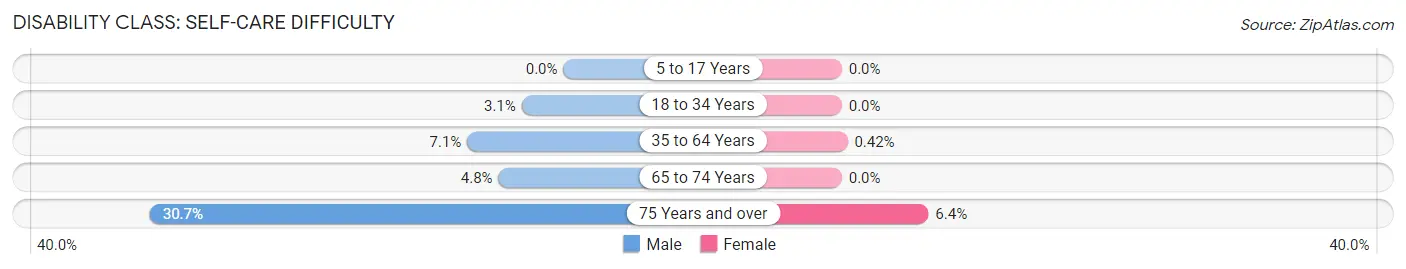
| Age Bracket | Male | Female |
| 5 to 17 Years | 0 (0.0%) | 0 (0.0%) |
| 18 to 34 Years | 34 (3.1%) | 0 (0.0%) |
| 35 to 64 Years | 114 (7.1%) | 10 (0.4%) |
| 65 to 74 Years | 27 (4.8%) | 0 (0.0%) |
| 75 Years and over | 101 (30.7%) | 46 (6.4%) |
Technology Access in Cabo Rojo
Computing Device Access in Cabo Rojo
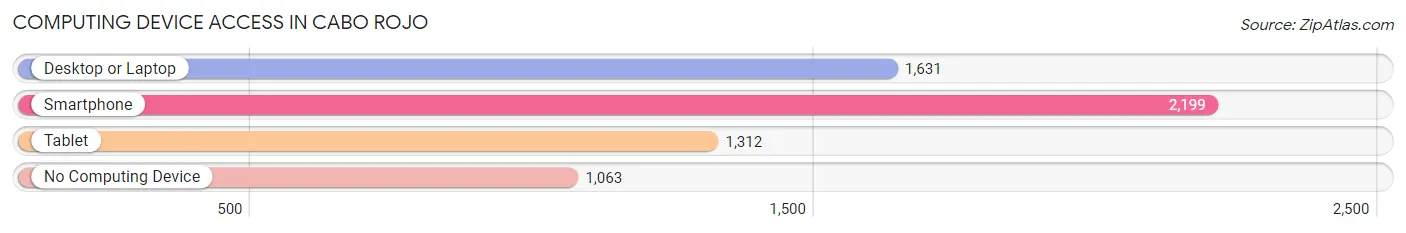
| Device Type | # Households | % Households |
| Desktop or Laptop | 1,631 | 45.7% |
| Smartphone | 2,199 | 61.6% |
| Tablet | 1,312 | 36.7% |
| No Computing Device | 1,063 | 29.8% |
| Total | 3,572 | 100.0% |
Internet Access in Cabo Rojo
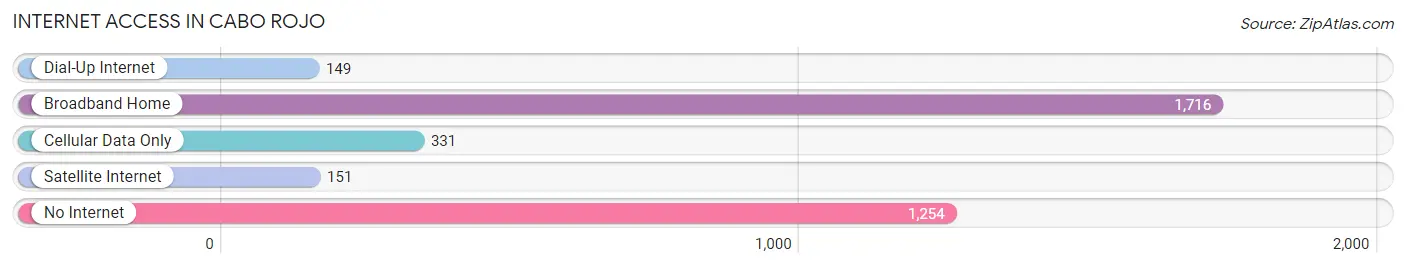
| Internet Type | # Households | % Households |
| Dial-Up Internet | 149 | 4.2% |
| Broadband Home | 1,716 | 48.0% |
| Cellular Data Only | 331 | 9.3% |
| Satellite Internet | 151 | 4.2% |
| No Internet | 1,254 | 35.1% |
| Total | 3,572 | 100.0% |
Cabo Rojo Summary
Cabo Rojo is a municipality located in the southwestern region of Puerto Rico. It is bordered by the municipalities of Lajas, San Germán, Hormigueros, Mayagüez, and San Germán. The municipality is known for its beautiful beaches, its historical sites, and its vibrant culture.
Geography
Cabo Rojo is located in the southwestern region of Puerto Rico, on the western coast of the island. It is bordered by the municipalities of Lajas, San Germán, Hormigueros, Mayagüez, and San Germán. The municipality covers an area of approximately 140 square miles and is divided into seven barrios. The terrain is mostly flat, with some hills in the northern part of the municipality. The highest point is Cerro La Santa, which is located in the barrio of Boquerón and has an elevation of 1,067 feet. The municipality has a tropical climate, with temperatures ranging from the mid-70s to the mid-80s throughout the year.
History
Cabo Rojo was founded in 1771 by Spanish settlers. The name of the municipality comes from the reddish-brown color of the rocks found in the area. During the 19th century, the municipality was an important center for the production of salt. In 1898, the United States invaded Puerto Rico and took control of the island. In the early 20th century, the municipality experienced a period of economic growth, as the sugar industry began to expand. In the 1950s, the municipality began to develop its tourism industry, and today it is a popular destination for both local and international tourists.
Economy
Cabo Rojo’s economy is largely based on tourism, agriculture, and fishing. The municipality is home to several popular tourist attractions, including the Cabo Rojo National Wildlife Refuge, the Boquerón Beach, and the Cabo Rojo Lighthouse. Agriculture is also an important part of the economy, with the main crops being sugarcane, plantains, and bananas. Fishing is also an important industry, with the main catches being shrimp, lobster, and fish.
Demographics
As of the 2010 census, the population of Cabo Rojo was approximately 45,000. The majority of the population is of Puerto Rican descent, with smaller numbers of people of African, Dominican, and other Caribbean descent. The majority of the population is Roman Catholic, with smaller numbers of people belonging to other Christian denominations. The official language of the municipality is Spanish, although English is also widely spoken.
Cabo Rojo is a vibrant municipality with a rich history, beautiful geography, and a diverse economy. It is a popular destination for both local and international tourists, and its economy is largely based on tourism, agriculture, and fishing. The population is mostly of Puerto Rican descent, with smaller numbers of people of African, Dominican, and other Caribbean descent. The official language of the municipality is Spanish, although English is also widely spoken.
Common Questions
What is Per Capita Income in Cabo Rojo?
Per Capita income in Cabo Rojo is $15,393.
What is the Median Family Income in Cabo Rojo?
Median Family Income in Cabo Rojo is $31,198.
What is the Median Household income in Cabo Rojo?
Median Household Income in Cabo Rojo is $25,043.
What is Income or Wage Gap in Cabo Rojo?
Income or Wage Gap in Cabo Rojo is 12.3%.
Women in Cabo Rojo earn 87.7 cents for every dollar earned by a man.
What is Inequality or Gini Index in Cabo Rojo?
Inequality or Gini Index in Cabo Rojo is 0.52.
What is the Total Population of Cabo Rojo?
Total Population of Cabo Rojo is 10,137.
What is the Total Male Population of Cabo Rojo?
Total Male Population of Cabo Rojo is 4,582.
What is the Total Female Population of Cabo Rojo?
Total Female Population of Cabo Rojo is 5,555.
What is the Ratio of Males per 100 Females in Cabo Rojo?
There are 82.48 Males per 100 Females in Cabo Rojo.
What is the Ratio of Females per 100 Males in Cabo Rojo?
There are 121.24 Females per 100 Males in Cabo Rojo.
What is the Median Population Age in Cabo Rojo?
Median Population Age in Cabo Rojo is 44.3 Years.
What is the Average Family Size in Cabo Rojo
Average Family Size in Cabo Rojo is 3.4 People.
What is the Average Household Size in Cabo Rojo
Average Household Size in Cabo Rojo is 2.8 People.
How Large is the Labor Force in Cabo Rojo?
There are 4,135 People in the Labor Forcein in Cabo Rojo.
What is the Percentage of People in the Labor Force in Cabo Rojo?
47.1% of People are in the Labor Force in Cabo Rojo.
What is the Unemployment Rate in Cabo Rojo?
Unemployment Rate in Cabo Rojo is 12.4%.