Utuado, PR Map & Demographics
Utuado Map
Utuado Overview
$9,061
PER CAPITA INCOME
$18,487
AVG FAMILY INCOME
$13,474
AVG HOUSEHOLD INCOME
19.9%
WAGE / INCOME GAP [ % ]
80.1¢/ $1
WAGE / INCOME GAP [ $ ]
$13,023
FAMILY INCOME DEFICIT
0.56
INEQUALITY / GINI INDEX
7,554
TOTAL POPULATION
3,618
MALE POPULATION
3,936
FEMALE POPULATION
91.92
MALES / 100 FEMALES
108.79
FEMALES / 100 MALES
42.5
MEDIAN AGE
3.5
AVG FAMILY SIZE
2.5
AVG HOUSEHOLD SIZE
2,455
LABOR FORCE [ PEOPLE ]
39.4%
PERCENT IN LABOR FORCE
34.2%
UNEMPLOYMENT RATE
Utuado Zip Codes
Utuado Area Codes
Income in Utuado
Income Overview in Utuado
Per Capita Income in Utuado is $9,061, while median incomes of families and households are $18,487 and $13,474 respectively.
| Characteristic | Number | Measure |
| Per Capita Income | 7,554 | $9,061 |
| Median Family Income | 1,733 | $18,487 |
| Mean Family Income | 1,733 | $25,924 |
| Median Household Income | 2,950 | $13,474 |
| Mean Household Income | 2,950 | $20,811 |
| Income Deficit | 1,733 | $13,023 |
| Wage / Income Gap (%) | 7,554 | 19.85% |
| Wage / Income Gap ($) | 7,554 | 80.15¢ per $1 |
| Gini / Inequality Index | 7,554 | 0.56 |
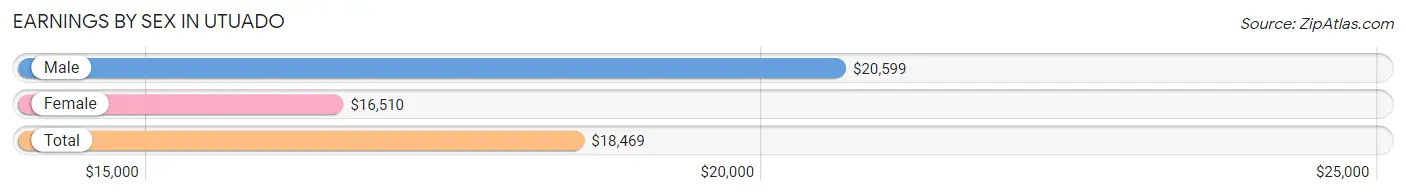
Earnings by Sex in Utuado
Average Earnings in Utuado are $18,469, $20,599 for men and $16,510 for women, a difference of 19.9%.
| Sex | Number | Average Earnings |
| Male | 844 (46.0%) | $20,599 |
| Female | 991 (54.0%) | $16,510 |
| Total | 1,835 (100.0%) | $18,469 |
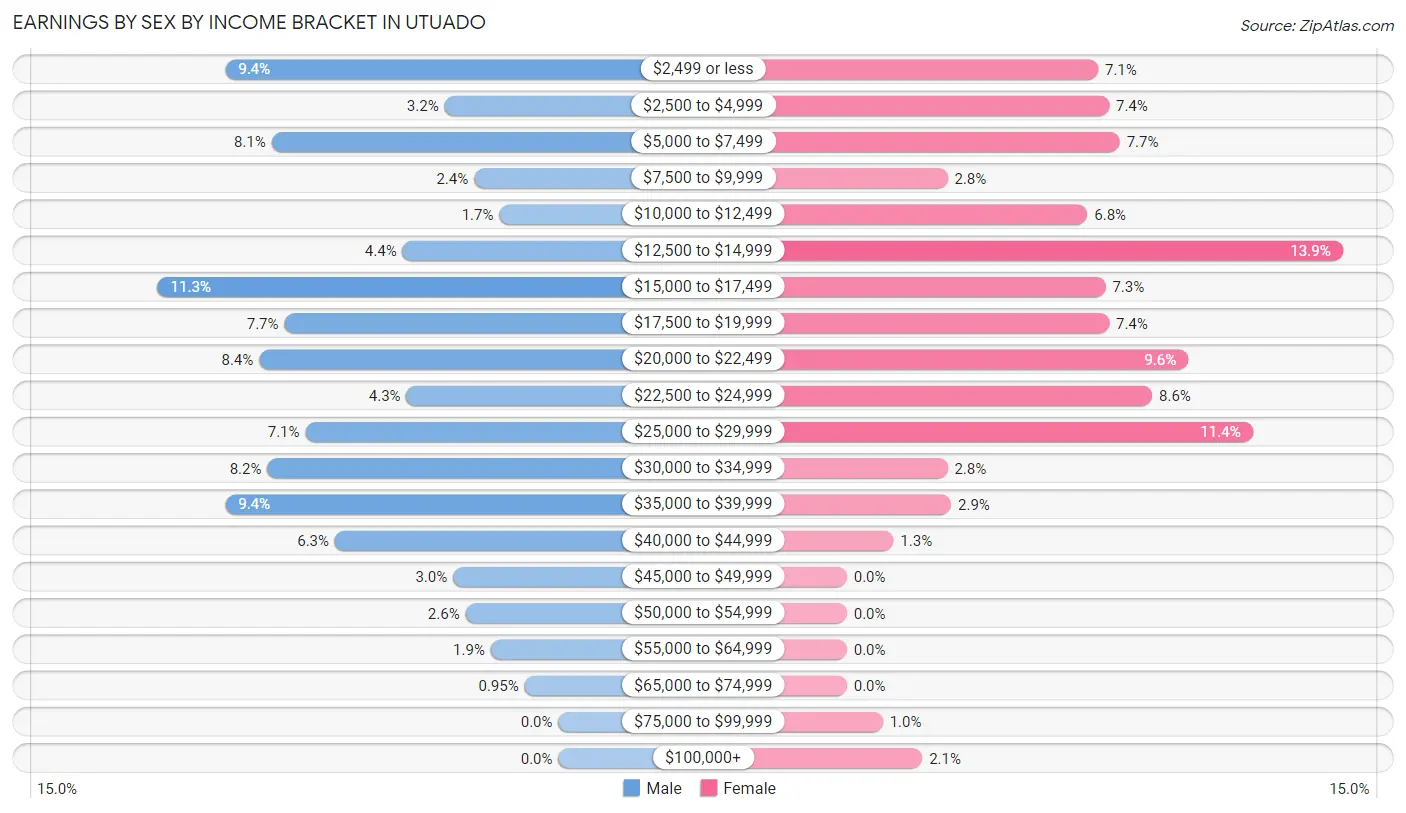
Earnings by Sex by Income Bracket in Utuado
The most common earnings brackets in Utuado are $15,000 to $17,499 for men (95 | 11.3%) and $12,500 to $14,999 for women (138 | 13.9%).
| Income | Male | Female |
| $2,499 or less | 79 (9.4%) | 70 (7.1%) |
| $2,500 to $4,999 | 27 (3.2%) | 73 (7.4%) |
| $5,000 to $7,499 | 68 (8.1%) | 76 (7.7%) |
| $7,500 to $9,999 | 20 (2.4%) | 28 (2.8%) |
| $10,000 to $12,499 | 14 (1.7%) | 67 (6.8%) |
| $12,500 to $14,999 | 37 (4.4%) | 138 (13.9%) |
| $15,000 to $17,499 | 95 (11.3%) | 72 (7.3%) |
| $17,500 to $19,999 | 65 (7.7%) | 73 (7.4%) |
| $20,000 to $22,499 | 71 (8.4%) | 95 (9.6%) |
| $22,500 to $24,999 | 36 (4.3%) | 85 (8.6%) |
| $25,000 to $29,999 | 60 (7.1%) | 113 (11.4%) |
| $30,000 to $34,999 | 69 (8.2%) | 28 (2.8%) |
| $35,000 to $39,999 | 79 (9.4%) | 29 (2.9%) |
| $40,000 to $44,999 | 53 (6.3%) | 13 (1.3%) |
| $45,000 to $49,999 | 25 (3.0%) | 0 (0.0%) |
| $50,000 to $54,999 | 22 (2.6%) | 0 (0.0%) |
| $55,000 to $64,999 | 16 (1.9%) | 0 (0.0%) |
| $65,000 to $74,999 | 8 (0.9%) | 0 (0.0%) |
| $75,000 to $99,999 | 0 (0.0%) | 10 (1.0%) |
| $100,000+ | 0 (0.0%) | 21 (2.1%) |
| Total | 844 (100.0%) | 991 (100.0%) |
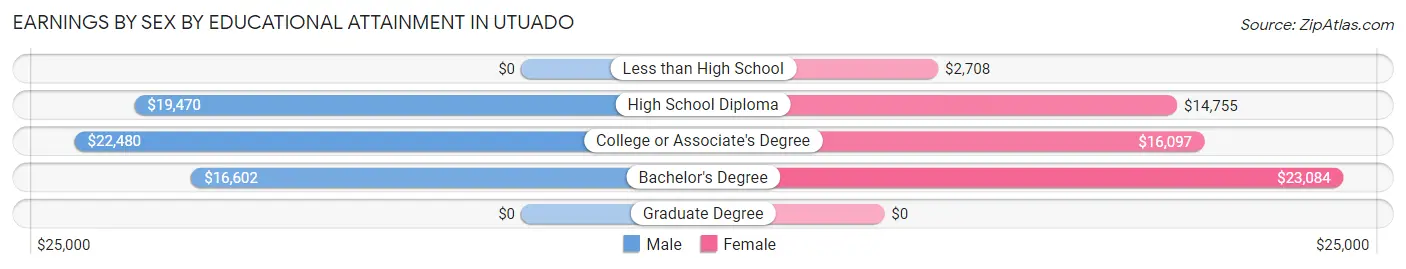
Earnings by Sex by Educational Attainment in Utuado
Average earnings in Utuado are $20,264 for men and $18,065 for women, a difference of 10.8%. Men with an educational attainment of college or associate's degree enjoy the highest average annual earnings of $22,480, while those with bachelor's degree education earn the least with $16,602. Women with an educational attainment of bachelor's degree earn the most with the average annual earnings of $23,084, while those with less than high school education have the smallest earnings of $2,708.
| Educational Attainment | Male Income | Female Income |
| Less than High School | - | - |
| High School Diploma | $19,470 | $14,755 |
| College or Associate's Degree | $22,480 | $16,097 |
| Bachelor's Degree | $16,602 | $23,084 |
| Graduate Degree | - | - |
| Total | $20,264 | $18,065 |
Family Income in Utuado
Family Income Brackets in Utuado
According to the Utuado family income data, there are 620 families falling into the less than $10,000 income range, which is the most common income bracket and makes up 35.8% of all families.
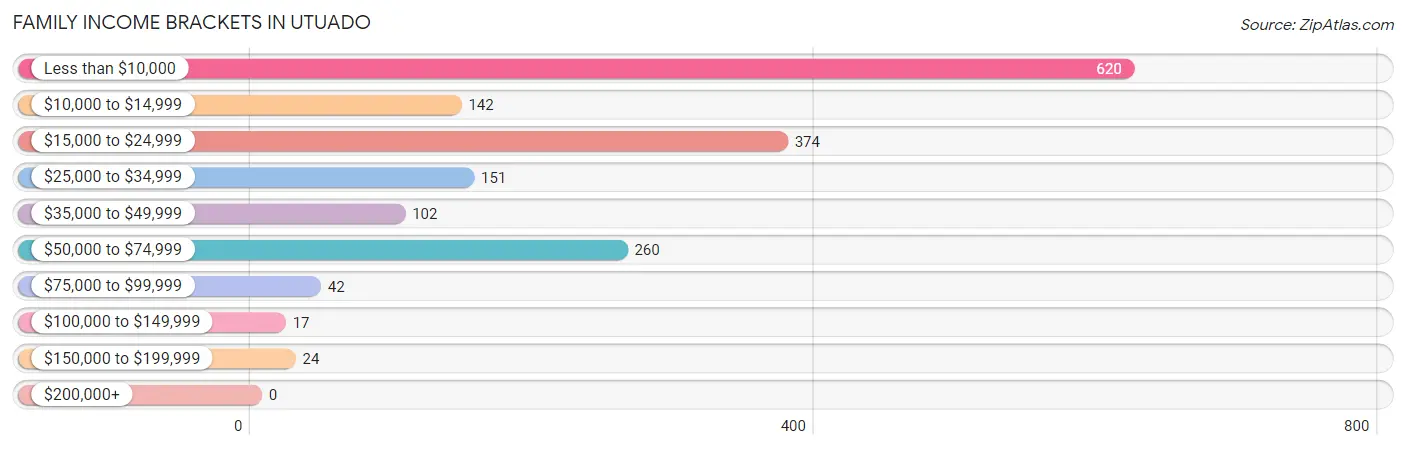
| Income Bracket | # Families | % Families |
| Less than $10,000 | 620 | 35.8% |
| $10,000 to $14,999 | 142 | 8.2% |
| $15,000 to $24,999 | 374 | 21.6% |
| $25,000 to $34,999 | 151 | 8.7% |
| $35,000 to $49,999 | 102 | 5.9% |
| $50,000 to $74,999 | 260 | 15.0% |
| $75,000 to $99,999 | 42 | 2.4% |
| $100,000 to $149,999 | 17 | 1.0% |
| $150,000 to $199,999 | 24 | 1.4% |
| $200,000+ | 0 | 0.0% |
Family Income by Famaliy Size in Utuado
4-person families (161 | 9.3%) account for the highest median family income in Utuado with $21,849 per family, while 2-person families (931 | 53.7%) have the highest median income of $8,388 per family member.
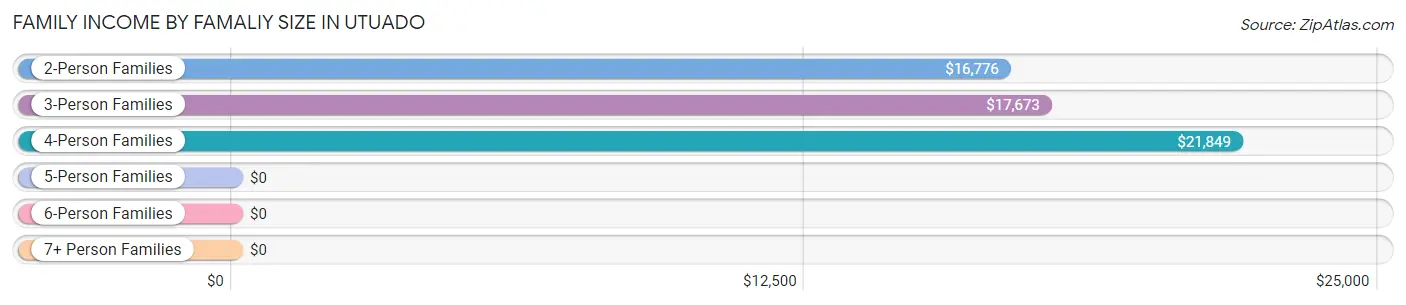
| Income Bracket | # Families | Median Income |
| 2-Person Families | 931 (53.7%) | $16,776 |
| 3-Person Families | 505 (29.1%) | $17,673 |
| 4-Person Families | 161 (9.3%) | $21,849 |
| 5-Person Families | 118 (6.8%) | $0 |
| 6-Person Families | 10 (0.6%) | $0 |
| 7+ Person Families | 8 (0.5%) | $0 |
| Total | 1,733 (100.0%) | $18,487 |
Family Income by Number of Earners in Utuado
The median family income in Utuado is $18,487, with families comprising 3+ earners (42) having the highest median family income of $89,167, while families with no earners (887) have the lowest median family income of $6,317, accounting for 2.4% and 51.2% of families, respectively.
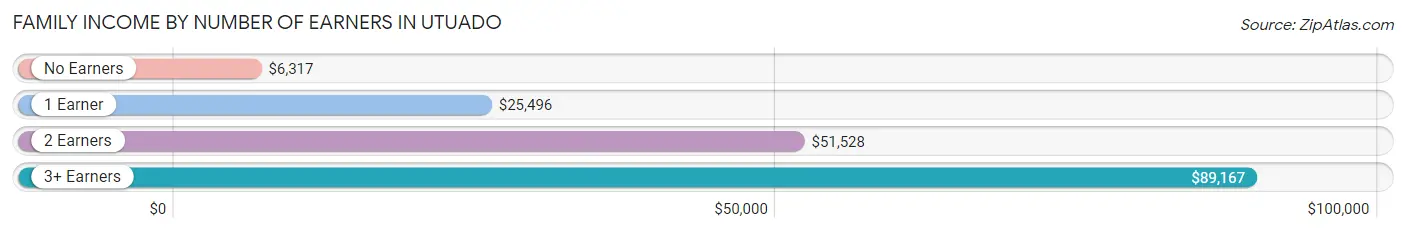
| Number of Earners | # Families | Median Income |
| No Earners | 887 (51.2%) | $6,317 |
| 1 Earner | 561 (32.4%) | $25,496 |
| 2 Earners | 243 (14.0%) | $51,528 |
| 3+ Earners | 42 (2.4%) | $89,167 |
| Total | 1,733 (100.0%) | $18,487 |
Household Income in Utuado
Household Income Brackets in Utuado
With 1,274 households falling in the category, the less than $10,000 income range is the most frequent in Utuado, accounting for 43.2% of all households.
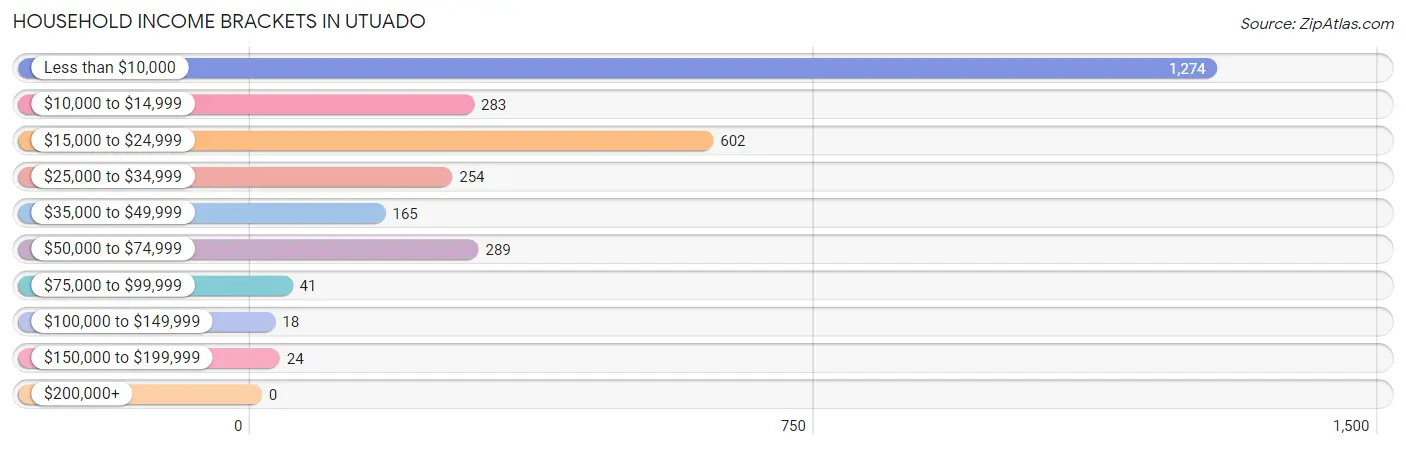
| Income Bracket | # Households | % Households |
| Less than $10,000 | 1,274 | 43.2% |
| $10,000 to $14,999 | 283 | 9.6% |
| $15,000 to $24,999 | 602 | 20.4% |
| $25,000 to $34,999 | 254 | 8.6% |
| $35,000 to $49,999 | 165 | 5.6% |
| $50,000 to $74,999 | 289 | 9.8% |
| $75,000 to $99,999 | 41 | 1.4% |
| $100,000 to $149,999 | 18 | 0.6% |
| $150,000 to $199,999 | 24 | 0.8% |
| $200,000+ | 0 | 0.0% |
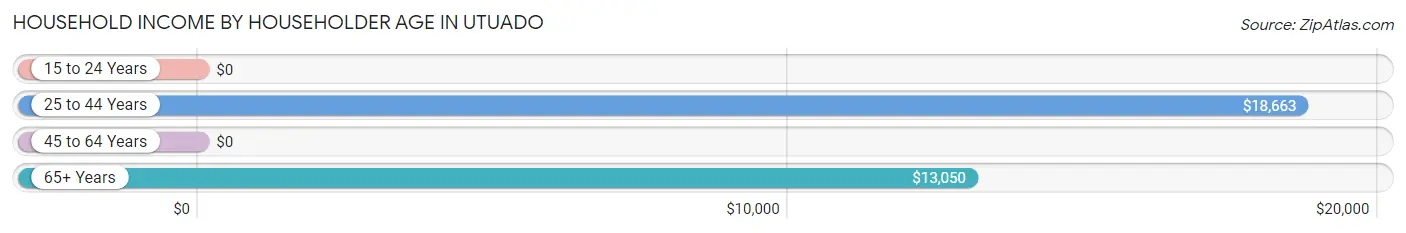
Household Income by Householder Age in Utuado
The median household income in Utuado is $13,474, with the highest median household income of $18,663 found in the 25 to 44 years age bracket for the primary householder. A total of 796 households (27.0%) fall into this category.
| Income Bracket | # Households | Median Income |
| 15 to 24 Years | 0 (0.0%) | $0 |
| 25 to 44 Years | 796 (27.0%) | $18,663 |
| 45 to 64 Years | 837 (28.4%) | $0 |
| 65+ Years | 1,317 (44.6%) | $13,050 |
| Total | 2,950 (100.0%) | $13,474 |
Poverty in Utuado
Income Below Poverty by Sex and Age in Utuado
With 59.8% poverty level for males and 60.2% for females among the residents of Utuado, 5 year old males and 5 year old females are the most vulnerable to poverty, with 16 males (100.0%) and 23 females (100.0%) in their respective age groups living below the poverty level.
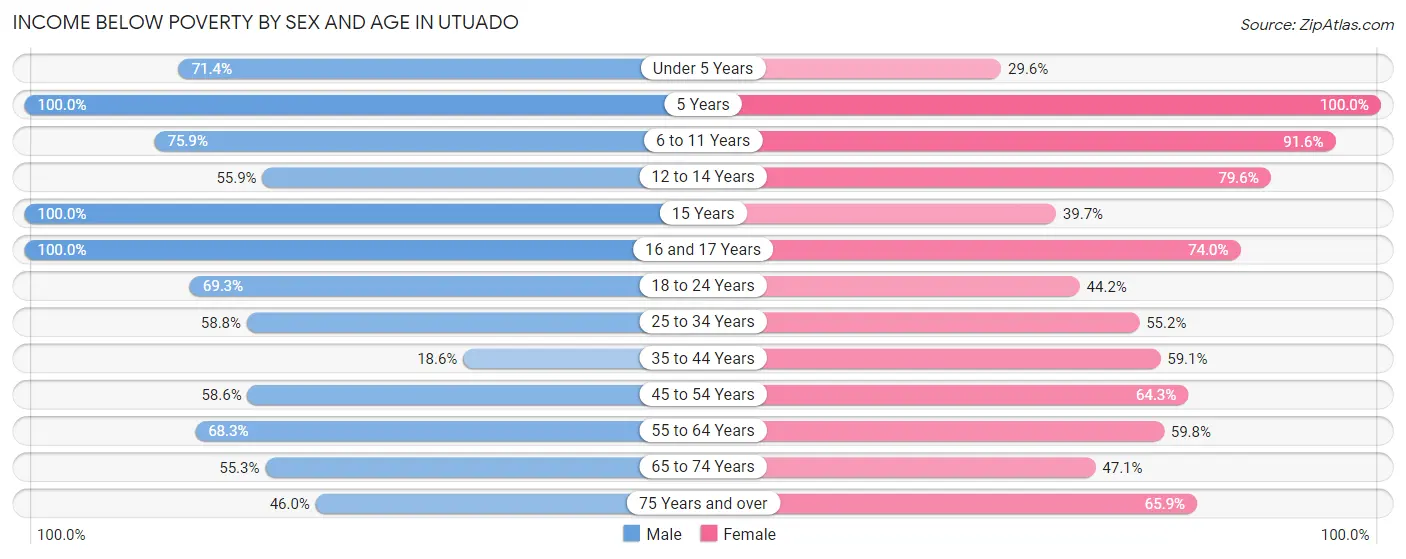
| Age Bracket | Male | Female |
| Under 5 Years | 202 (71.4%) | 34 (29.6%) |
| 5 Years | 16 (100.0%) | 23 (100.0%) |
| 6 to 11 Years | 129 (75.9%) | 251 (91.6%) |
| 12 to 14 Years | 105 (55.8%) | 113 (79.6%) |
| 15 Years | 34 (100.0%) | 31 (39.7%) |
| 16 and 17 Years | 151 (100.0%) | 54 (74.0%) |
| 18 to 24 Years | 296 (69.3%) | 117 (44.2%) |
| 25 to 34 Years | 198 (58.8%) | 270 (55.2%) |
| 35 to 44 Years | 66 (18.6%) | 295 (59.1%) |
| 45 to 54 Years | 197 (58.6%) | 313 (64.3%) |
| 55 to 64 Years | 384 (68.3%) | 260 (59.8%) |
| 65 to 74 Years | 208 (55.3%) | 216 (47.1%) |
| 75 Years and over | 171 (46.0%) | 375 (65.9%) |
| Total | 2,157 (59.8%) | 2,352 (60.2%) |
Income Above Poverty by Sex and Age in Utuado
According to the poverty statistics in Utuado, males aged 35 to 44 years and females aged under 5 years are the age groups that are most secure financially, with 81.4% of males and 70.4% of females in these age groups living above the poverty line.
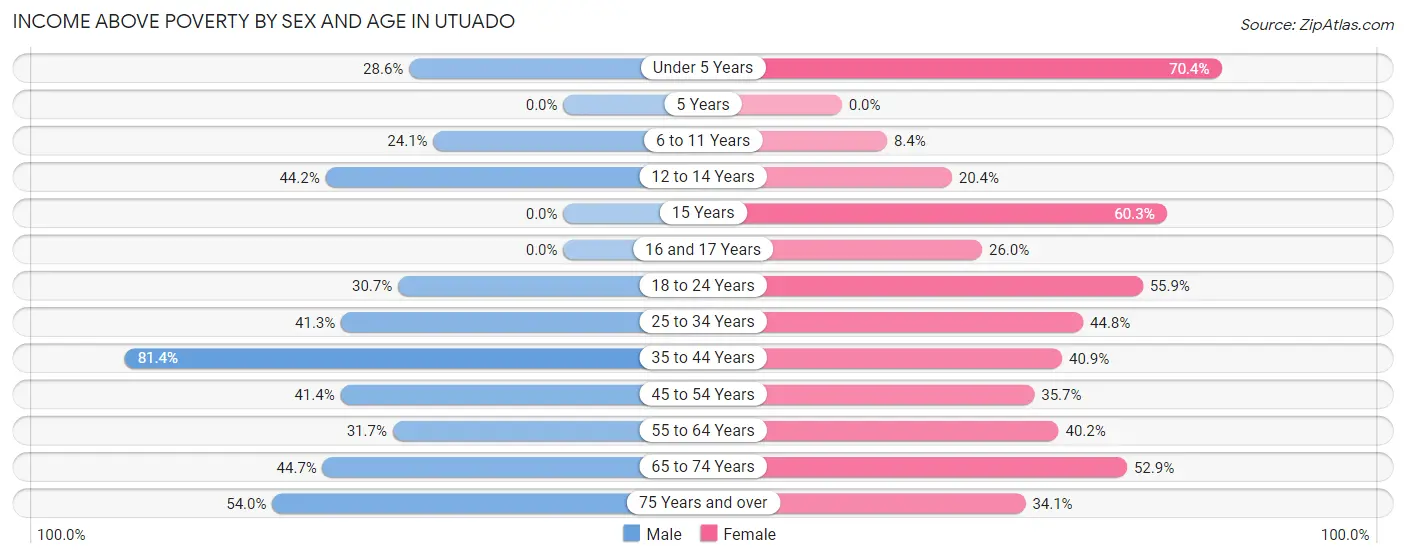
| Age Bracket | Male | Female |
| Under 5 Years | 81 (28.6%) | 81 (70.4%) |
| 5 Years | 0 (0.0%) | 0 (0.0%) |
| 6 to 11 Years | 41 (24.1%) | 23 (8.4%) |
| 12 to 14 Years | 83 (44.2%) | 29 (20.4%) |
| 15 Years | 0 (0.0%) | 47 (60.3%) |
| 16 and 17 Years | 0 (0.0%) | 19 (26.0%) |
| 18 to 24 Years | 131 (30.7%) | 148 (55.8%) |
| 25 to 34 Years | 139 (41.2%) | 219 (44.8%) |
| 35 to 44 Years | 289 (81.4%) | 204 (40.9%) |
| 45 to 54 Years | 139 (41.4%) | 174 (35.7%) |
| 55 to 64 Years | 178 (31.7%) | 175 (40.2%) |
| 65 to 74 Years | 168 (44.7%) | 243 (52.9%) |
| 75 Years and over | 201 (54.0%) | 194 (34.1%) |
| Total | 1,450 (40.2%) | 1,556 (39.8%) |
Income Below Poverty Among Married-Couple Families in Utuado
The poverty statistics for married-couple families in Utuado show that 36.6% or 306 of the total 835 families live below the poverty line. Families with 3 or 4 children have the highest poverty rate of 39.2%, comprising of 20 families. On the other hand, families with no children have the lowest poverty rate of 36.3%, which includes 235 families.
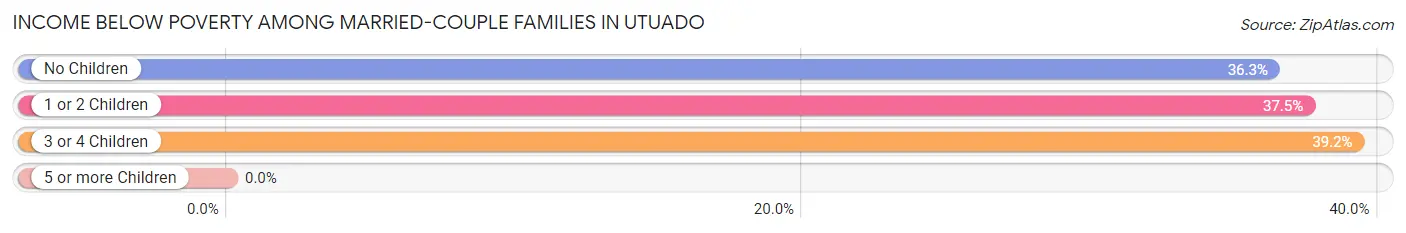
| Children | Above Poverty | Below Poverty |
| No Children | 413 (63.7%) | 235 (36.3%) |
| 1 or 2 Children | 85 (62.5%) | 51 (37.5%) |
| 3 or 4 Children | 31 (60.8%) | 20 (39.2%) |
| 5 or more Children | 0 (0.0%) | 0 (0.0%) |
| Total | 529 (63.3%) | 306 (36.6%) |
Income Below Poverty Among Single-Parent Households in Utuado
According to the poverty data in Utuado, 83.6% or 225 single-father households and 73.8% or 464 single-mother households are living below the poverty line. Among single-father households, those with 1 or 2 children have the highest poverty rate, with 140 households (84.3%) experiencing poverty. Likewise, among single-mother households, those with 3 or 4 children have the highest poverty rate, with 60 households (100.0%) falling below the poverty line.
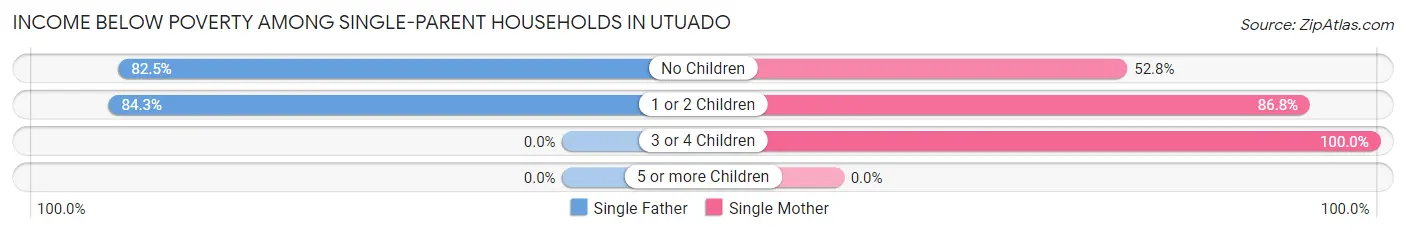
| Children | Single Father | Single Mother |
| No Children | 85 (82.5%) | 140 (52.8%) |
| 1 or 2 Children | 140 (84.3%) | 264 (86.8%) |
| 3 or 4 Children | 0 (0.0%) | 60 (100.0%) |
| 5 or more Children | 0 (0.0%) | 0 (0.0%) |
| Total | 225 (83.6%) | 464 (73.8%) |
Income Below Poverty Among Married-Couple vs Single-Parent Households in Utuado
The poverty data for Utuado shows that 306 of the married-couple family households (36.6%) and 689 of the single-parent households (76.7%) are living below the poverty level. Within the married-couple family households, those with 3 or 4 children have the highest poverty rate, with 20 households (39.2%) falling below the poverty line. Among the single-parent households, those with 3 or 4 children have the highest poverty rate, with 60 household (100.0%) living below poverty.
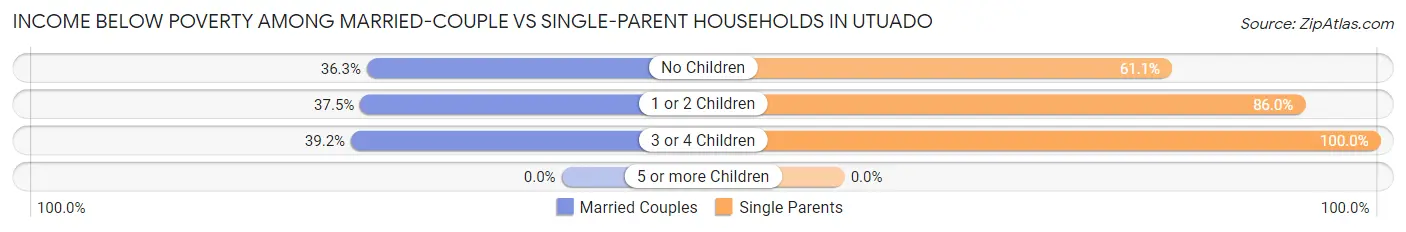
| Children | Married-Couple Families | Single-Parent Households |
| No Children | 235 (36.3%) | 225 (61.1%) |
| 1 or 2 Children | 51 (37.5%) | 404 (86.0%) |
| 3 or 4 Children | 20 (39.2%) | 60 (100.0%) |
| 5 or more Children | 0 (0.0%) | 0 (0.0%) |
| Total | 306 (36.6%) | 689 (76.7%) |
Race in Utuado
The most populous races in Utuado are Hispanic or Latino (7,428 | 98.3%), Some other Race (3,521 | 46.6%), and White / Caucasian (3,058 | 40.5%).
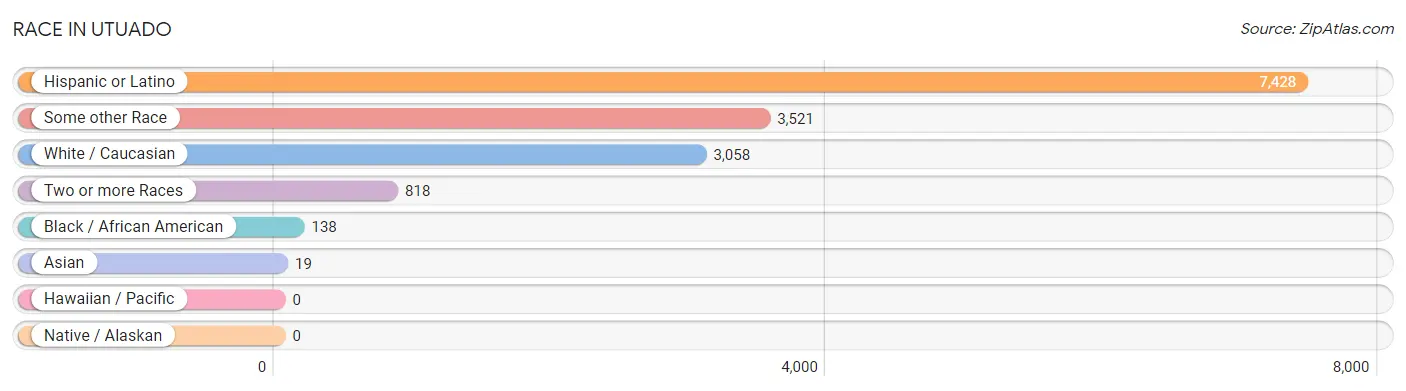
| Race | # Population | % Population |
| Asian | 19 | 0.3% |
| Black / African American | 138 | 1.8% |
| Hawaiian / Pacific | 0 | 0.0% |
| Hispanic or Latino | 7,428 | 98.3% |
| Native / Alaskan | 0 | 0.0% |
| White / Caucasian | 3,058 | 40.5% |
| Two or more Races | 818 | 10.8% |
| Some other Race | 3,521 | 46.6% |
| Total | 7,554 | 100.0% |
Ancestry in Utuado
The most populous ancestries reported in Utuado are Puerto Rican (7,383 | 97.7%), American (207 | 2.7%), Spanish American Indian (127 | 1.7%), Mexican (22 | 0.3%), and Thai (19 | 0.3%), together accounting for 102.7% of all Utuado residents.
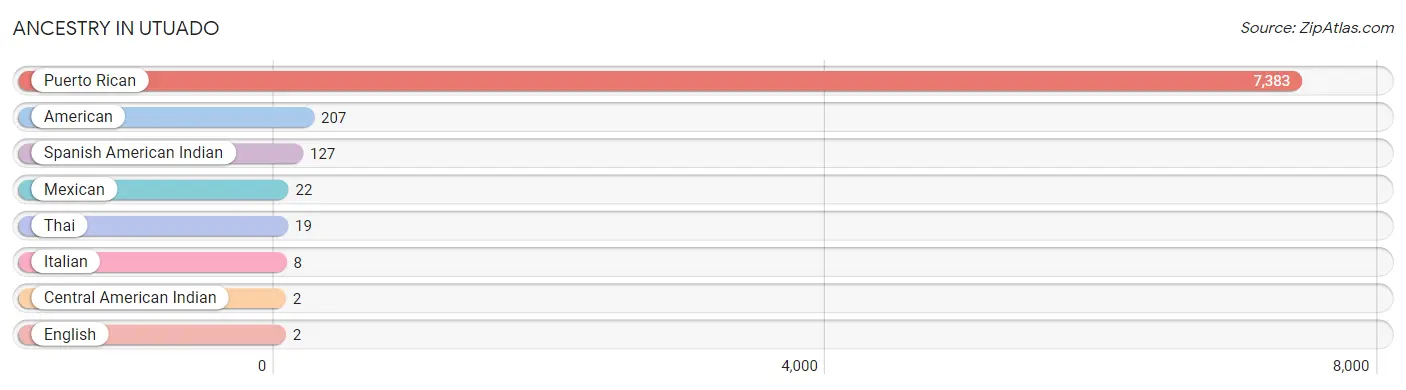
| Ancestry | # Population | % Population |
| American | 207 | 2.7% |
| Central American Indian | 2 | 0.0% |
| English | 2 | 0.0% |
| Italian | 8 | 0.1% |
| Mexican | 22 | 0.3% |
| Puerto Rican | 7,383 | 97.7% |
| Spanish American Indian | 127 | 1.7% |
| Thai | 19 | 0.3% | View All 8 Rows |
Immigrants in Utuado

| Immigration Origin | # Population | % Population | View All 0 Rows |
Sex and Age in Utuado
Sex and Age in Utuado
The most populous age groups in Utuado are 15 to 19 Years (387 | 10.7%) for men and 40 to 44 Years (325 | 8.3%) for women.
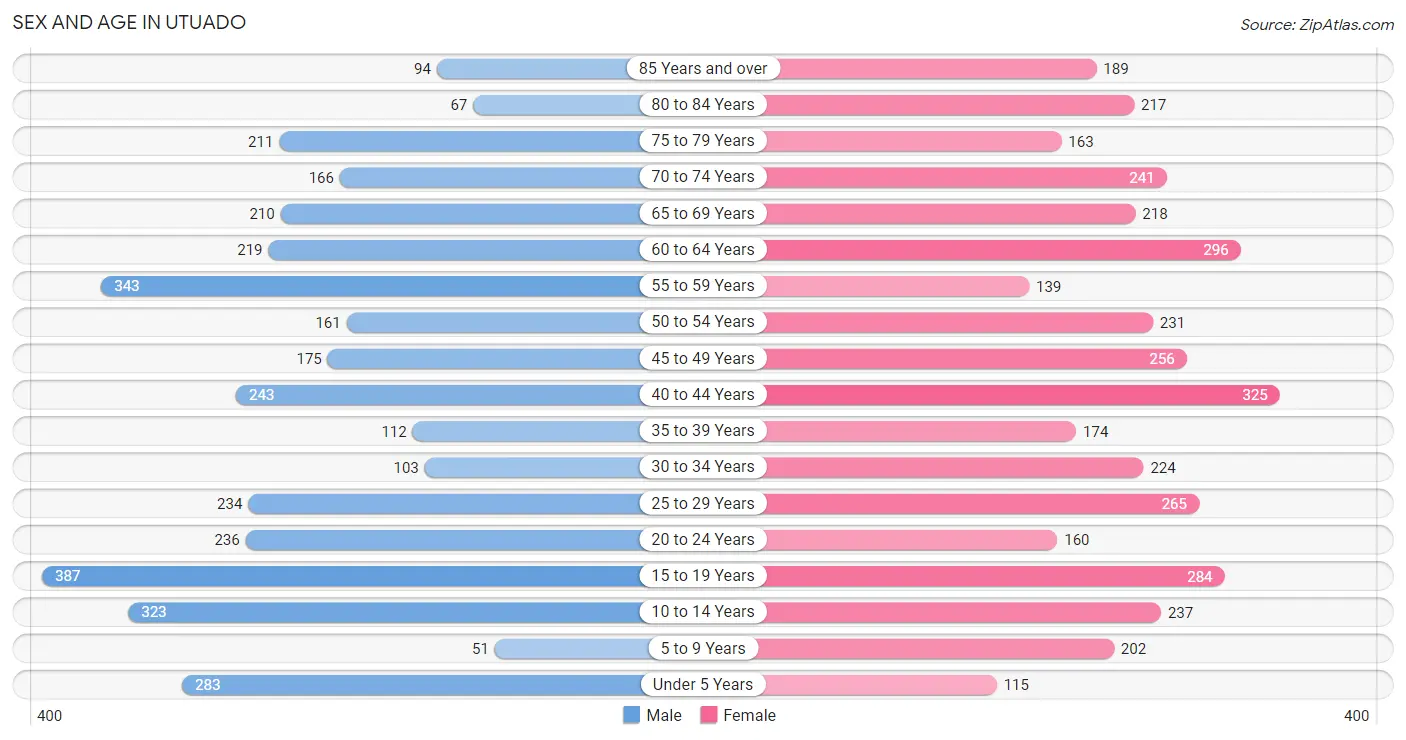
| Age Bracket | Male | Female |
| Under 5 Years | 283 (7.8%) | 115 (2.9%) |
| 5 to 9 Years | 51 (1.4%) | 202 (5.1%) |
| 10 to 14 Years | 323 (8.9%) | 237 (6.0%) |
| 15 to 19 Years | 387 (10.7%) | 284 (7.2%) |
| 20 to 24 Years | 236 (6.5%) | 160 (4.1%) |
| 25 to 29 Years | 234 (6.5%) | 265 (6.7%) |
| 30 to 34 Years | 103 (2.9%) | 224 (5.7%) |
| 35 to 39 Years | 112 (3.1%) | 174 (4.4%) |
| 40 to 44 Years | 243 (6.7%) | 325 (8.3%) |
| 45 to 49 Years | 175 (4.8%) | 256 (6.5%) |
| 50 to 54 Years | 161 (4.4%) | 231 (5.9%) |
| 55 to 59 Years | 343 (9.5%) | 139 (3.5%) |
| 60 to 64 Years | 219 (6.0%) | 296 (7.5%) |
| 65 to 69 Years | 210 (5.8%) | 218 (5.5%) |
| 70 to 74 Years | 166 (4.6%) | 241 (6.1%) |
| 75 to 79 Years | 211 (5.8%) | 163 (4.1%) |
| 80 to 84 Years | 67 (1.8%) | 217 (5.5%) |
| 85 Years and over | 94 (2.6%) | 189 (4.8%) |
| Total | 3,618 (100.0%) | 3,936 (100.0%) |
Families and Households in Utuado
Median Family Size in Utuado
The median family size in Utuado is 3.46 persons per family, with single female/mother families (629 | 36.3%) accounting for the largest median family size of 3.63 persons per family. On the other hand, single male/father families (269 | 15.5%) represent the smallest median family size with 3.30 persons per family.
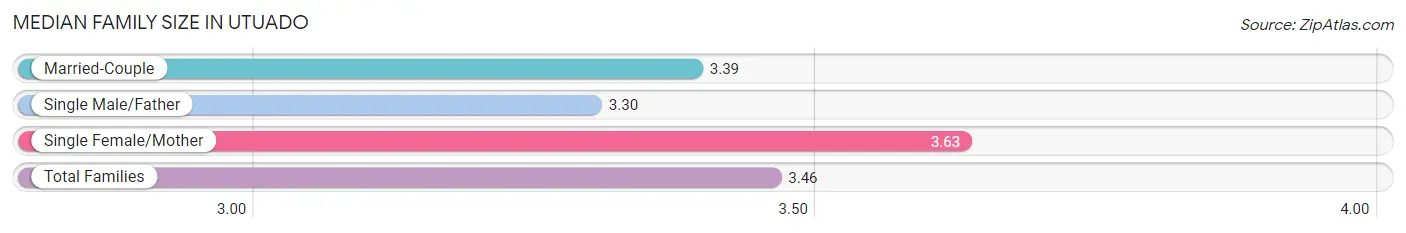
| Family Type | # Families | Family Size |
| Married-Couple | 835 (48.2%) | 3.39 |
| Single Male/Father | 269 (15.5%) | 3.30 |
| Single Female/Mother | 629 (36.3%) | 3.63 |
| Total Families | 1,733 (100.0%) | 3.46 |
Median Household Size in Utuado
The median household size in Utuado is 2.54 persons per household, with single female/mother households (629 | 21.3%) accounting for the largest median household size of 3.68 persons per household. non-family households (1,217 | 41.2%) represent the smallest median household size with 1.14 persons per household.
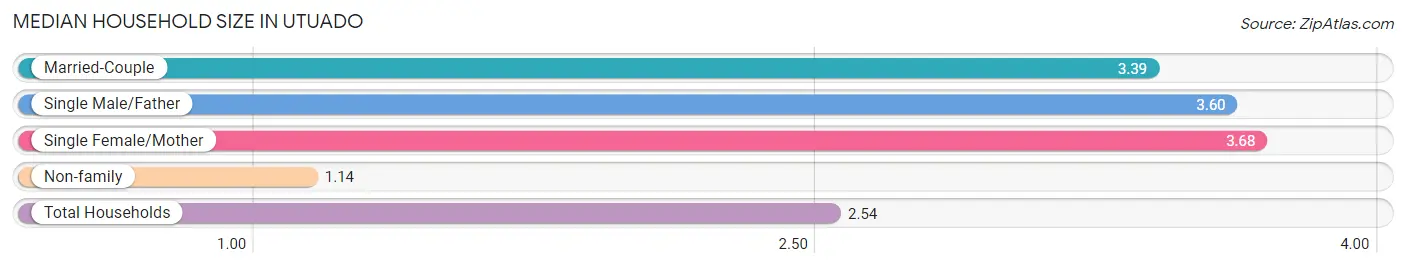
| Household Type | # Households | Household Size |
| Married-Couple | 835 (28.3%) | 3.39 |
| Single Male/Father | 269 (9.1%) | 3.60 |
| Single Female/Mother | 629 (21.3%) | 3.68 |
| Non-family | 1,217 (41.2%) | 1.14 |
| Total Households | 2,950 (100.0%) | 2.54 |
Household Size by Marriage Status in Utuado
Out of a total of 2,950 households in Utuado, 1,733 (58.8%) are family households, while 1,217 (41.2%) are nonfamily households. The most numerous type of family households are 2-person households, comprising 855, and the most common type of nonfamily households are 1-person households, comprising 1,088.
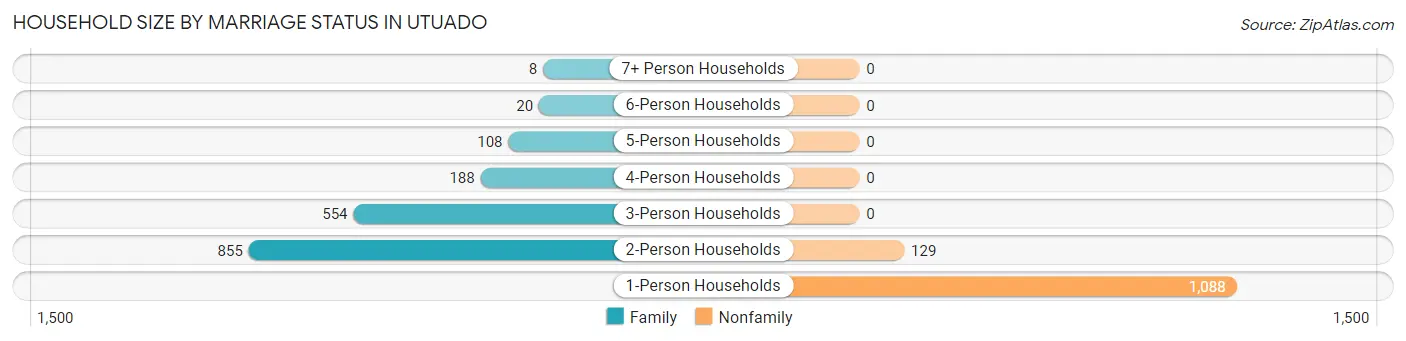
| Household Size | Family Households | Nonfamily Households |
| 1-Person Households | - | 1,088 (36.9%) |
| 2-Person Households | 855 (29.0%) | 129 (4.4%) |
| 3-Person Households | 554 (18.8%) | 0 (0.0%) |
| 4-Person Households | 188 (6.4%) | 0 (0.0%) |
| 5-Person Households | 108 (3.7%) | 0 (0.0%) |
| 6-Person Households | 20 (0.7%) | 0 (0.0%) |
| 7+ Person Households | 8 (0.3%) | 0 (0.0%) |
| Total | 1,733 (58.8%) | 1,217 (41.2%) |
Female Fertility in Utuado
Fertility by Age in Utuado
Average fertility rate in Utuado is 31.0 births per 1,000 women. Women in the age bracket of 20 to 34 years have the highest fertility rate with 68.0 births per 1,000 women. Women in the age bracket of 20 to 34 years acount for 81.5% of all women with births.
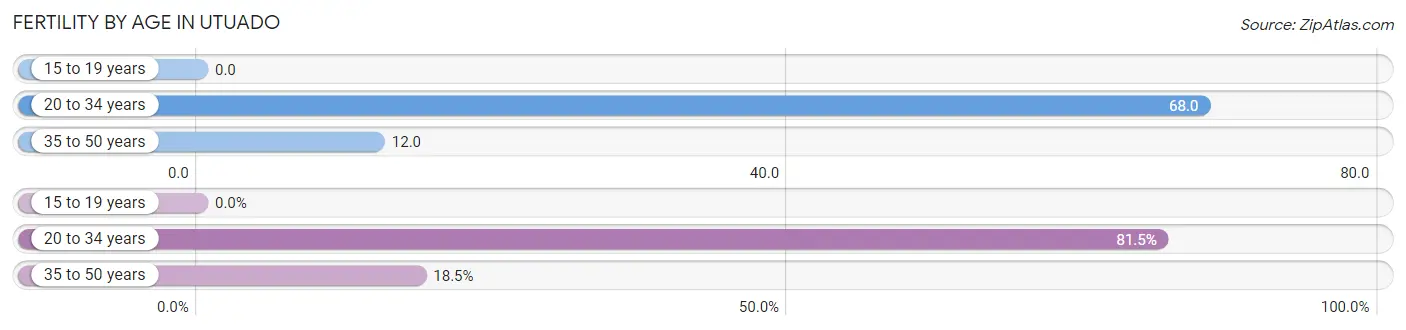
| Age Bracket | Women with Births | Births / 1,000 Women |
| 15 to 19 years | 0 (0.0%) | 0.0 |
| 20 to 34 years | 44 (81.5%) | 68.0 |
| 35 to 50 years | 10 (18.5%) | 12.0 |
| Total | 54 (100.0%) | 31.0 |
Fertility by Age by Marriage Status in Utuado
57.4% of women with births (54) in Utuado are married. The highest percentage of unmarried women with births falls into 20 to 34 years age bracket with 52.3% of them unmarried at the time of birth, while the lowest percentage of unmarried women with births belong to 35 to 50 years age bracket with 0.0% of them unmarried.
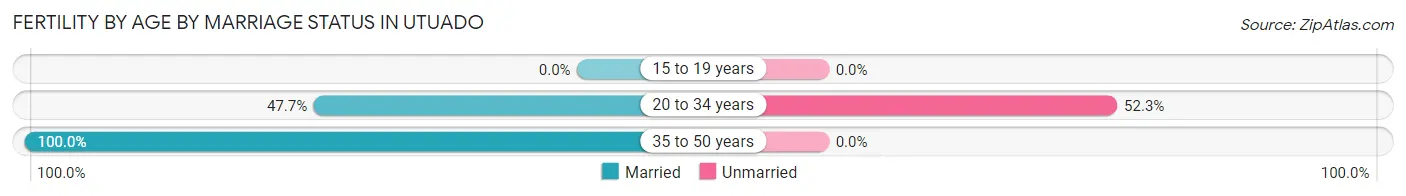
| Age Bracket | Married | Unmarried |
| 15 to 19 years | 0 (0.0%) | 0 (0.0%) |
| 20 to 34 years | 21 (47.7%) | 23 (52.3%) |
| 35 to 50 years | 10 (100.0%) | 0 (0.0%) |
| Total | 31 (57.4%) | 23 (42.6%) |
Fertility by Education in Utuado
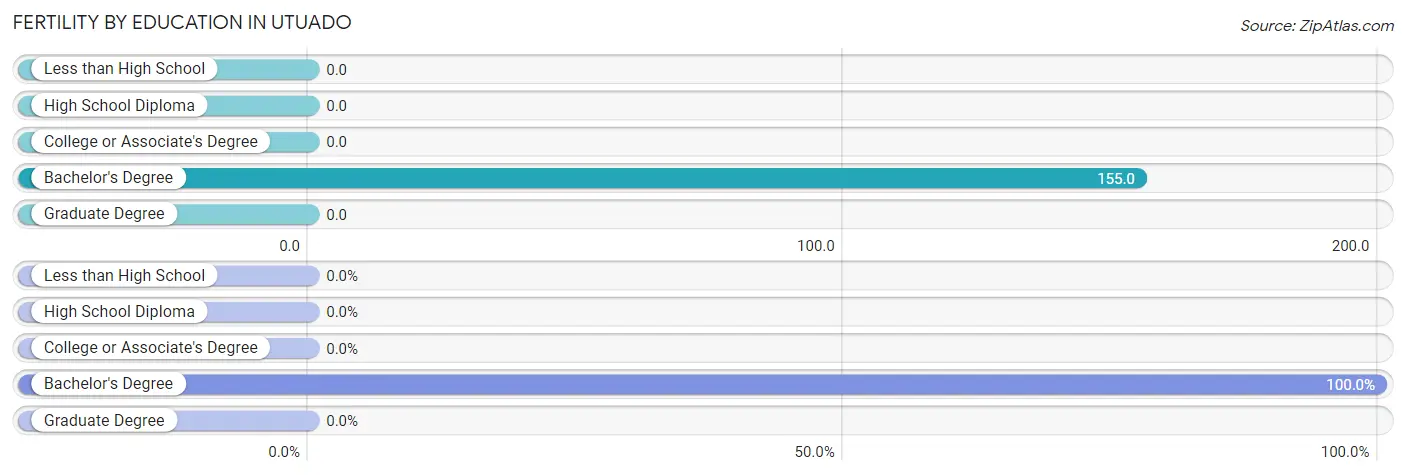
| Educational Attainment | Women with Births | Births / 1,000 Women |
| Less than High School | 0 (0.0%) | 0.0 |
| High School Diploma | 0 (0.0%) | 0.0 |
| College or Associate's Degree | 0 (0.0%) | 0.0 |
| Bachelor's Degree | 54 (100.0%) | 155.0 |
| Graduate Degree | 0 (0.0%) | 0.0 |
| Total | 54 (100.0%) | 31.0 |
Fertility by Education by Marriage Status in Utuado
42.6% of women with births in Utuado are unmarried. Women with the educational attainment of bachelor's degree are most likely to be married with 57.4% of them married at childbirth, while women with the educational attainment of bachelor's degree are least likely to be married with 42.6% of them unmarried at childbirth.
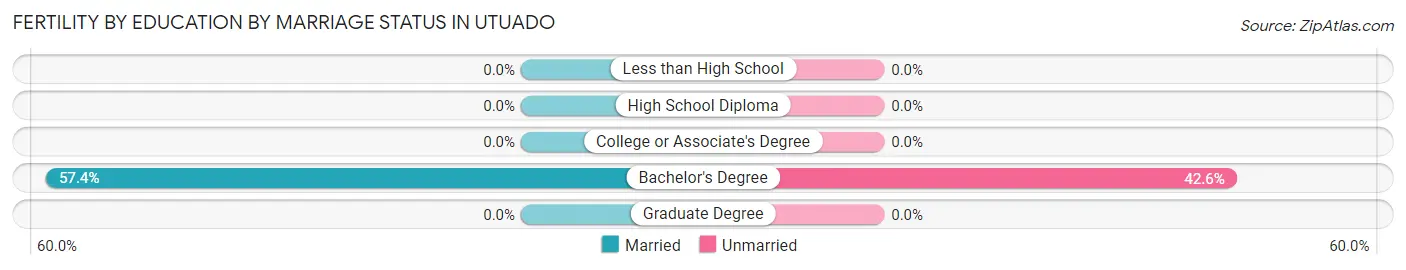
| Educational Attainment | Married | Unmarried |
| Less than High School | 0 (0.0%) | 0 (0.0%) |
| High School Diploma | 0 (0.0%) | 0 (0.0%) |
| College or Associate's Degree | 0 (0.0%) | 0 (0.0%) |
| Bachelor's Degree | 31 (57.4%) | 23 (42.6%) |
| Graduate Degree | 0 (0.0%) | 0 (0.0%) |
| Total | 31 (57.4%) | 23 (42.6%) |
Employment Characteristics in Utuado
Employment by Class of Employer in Utuado
Among the 1,595 employed individuals in Utuado, private company employees (911 | 57.1%), state government employees (382 | 23.9%), and federal government employees (92 | 5.8%) make up the most common classes of employment.
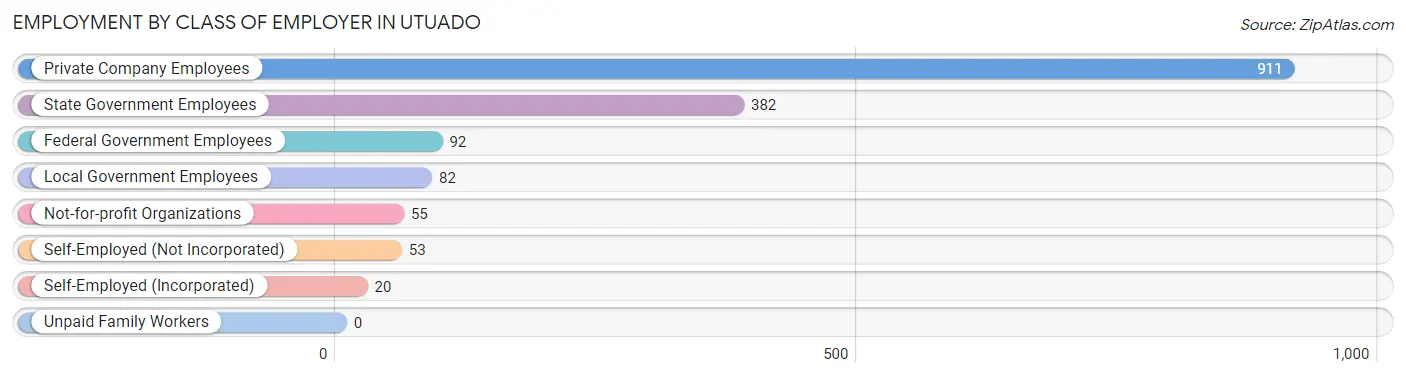
| Employer Class | # Employees | % Employees |
| Private Company Employees | 911 | 57.1% |
| Self-Employed (Incorporated) | 20 | 1.3% |
| Self-Employed (Not Incorporated) | 53 | 3.3% |
| Not-for-profit Organizations | 55 | 3.5% |
| Local Government Employees | 82 | 5.1% |
| State Government Employees | 382 | 23.9% |
| Federal Government Employees | 92 | 5.8% |
| Unpaid Family Workers | 0 | 0.0% |
| Total | 1,595 | 100.0% |
Employment Status by Age in Utuado
According to the labor force statistics for Utuado, out of the total population over 16 years of age (6,231), 39.4% or 2,455 individuals are in the labor force, with 34.2% or 840 of them unemployed. The age group with the highest labor force participation rate is 30 to 34 years, with 85.0% or 278 individuals in the labor force. Within the labor force, the 16 to 19 years age range has the highest percentage of unemployed individuals, with 65.8% or 52 of them being unemployed.
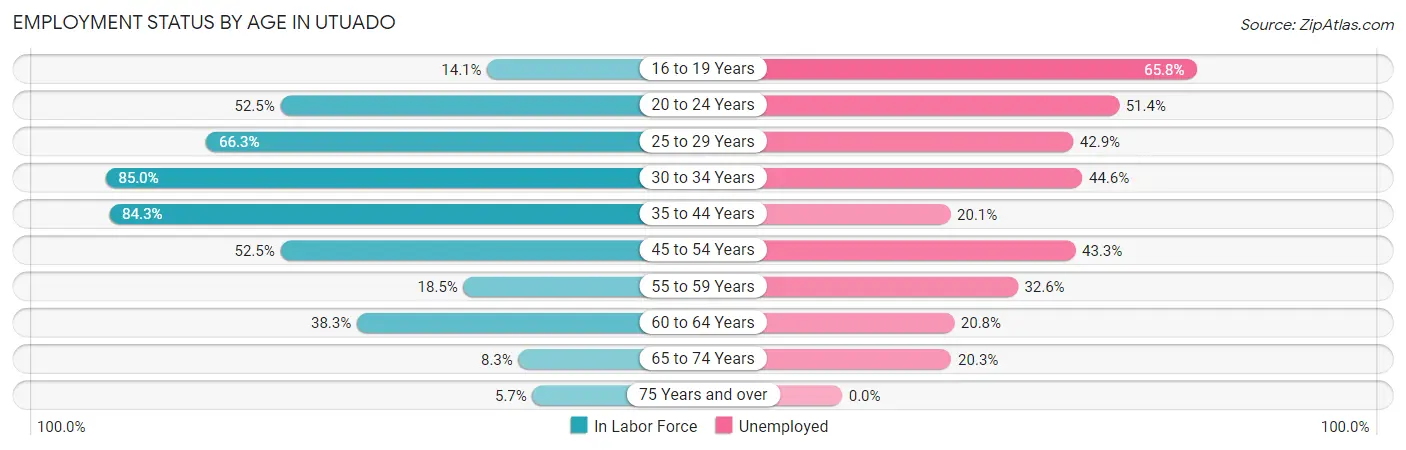
| Age Bracket | In Labor Force | Unemployed |
| 16 to 19 Years | 79 (14.1%) | 52 (65.8%) |
| 20 to 24 Years | 208 (52.5%) | 107 (51.4%) |
| 25 to 29 Years | 331 (66.3%) | 142 (42.9%) |
| 30 to 34 Years | 278 (85.0%) | 124 (44.6%) |
| 35 to 44 Years | 720 (84.3%) | 145 (20.1%) |
| 45 to 54 Years | 432 (52.5%) | 187 (43.3%) |
| 55 to 59 Years | 89 (18.5%) | 29 (32.6%) |
| 60 to 64 Years | 197 (38.3%) | 41 (20.8%) |
| 65 to 74 Years | 69 (8.3%) | 14 (20.3%) |
| 75 Years and over | 54 (5.7%) | 0 (0.0%) |
| Total | 2,455 (39.4%) | 840 (34.2%) |
Employment Status by Educational Attainment in Utuado
According to labor force statistics for Utuado, 58.5% of individuals (2,047) out of the total population between 25 and 64 years of age (3,500) are in the labor force, with 32.6% or 667 of them being unemployed. The group with the highest labor force participation rate are those with the educational attainment of bachelor's degree or higher, with 79.2% or 606 individuals in the labor force. Within the labor force, individuals with less than high school education have the highest percentage of unemployment, with 76.7% or 79 of them being unemployed.
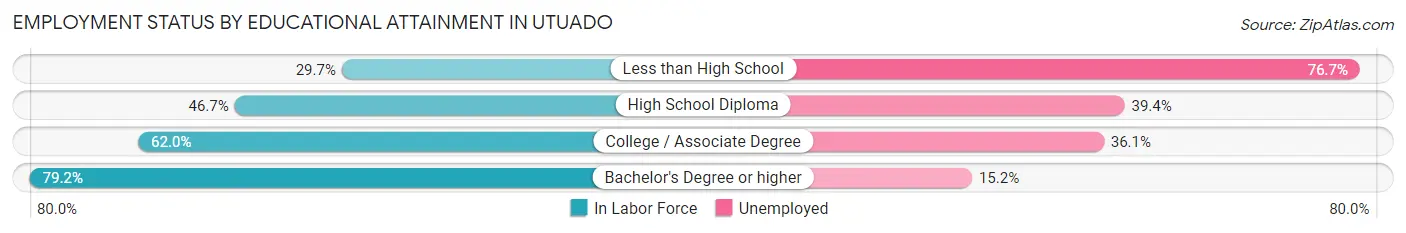
| Educational Attainment | In Labor Force | Unemployed |
| Less than High School | 103 (29.7%) | 266 (76.7%) |
| High School Diploma | 432 (46.7%) | 365 (39.4%) |
| College / Associate Degree | 906 (62.0%) | 528 (36.1%) |
| Bachelor's Degree or higher | 606 (79.2%) | 116 (15.2%) |
| Total | 2,048 (58.5%) | 1,141 (32.6%) |
Employment Occupations by Sex in Utuado
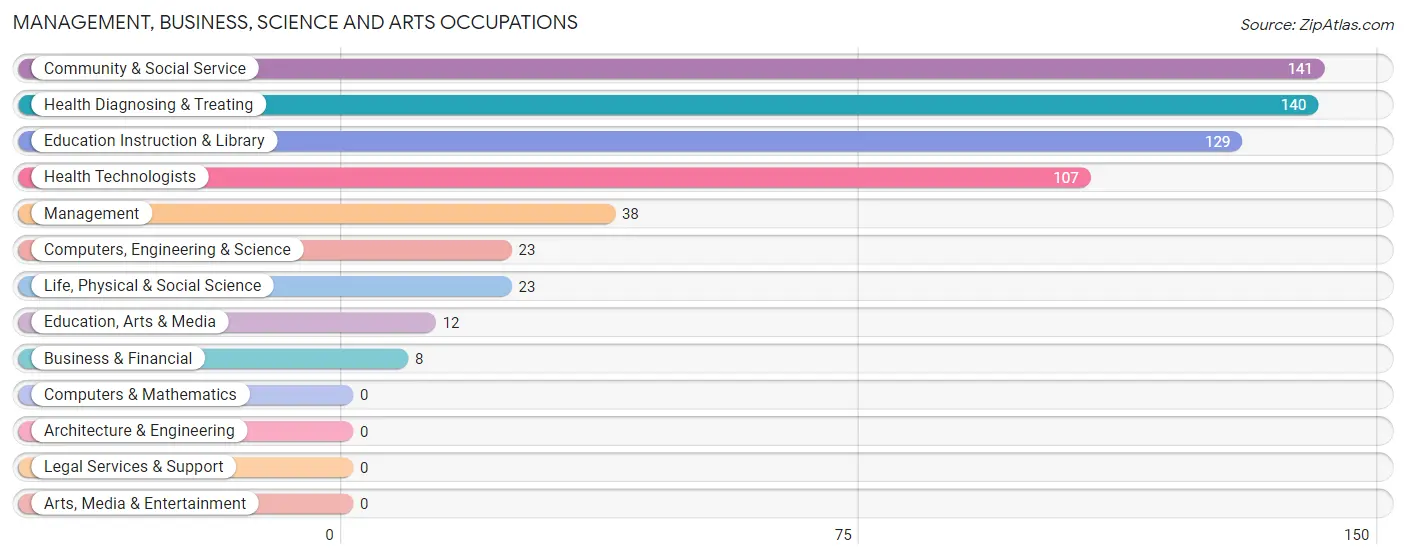
Management, Business, Science and Arts Occupations
The most common Management, Business, Science and Arts occupations in Utuado are Community & Social Service (141 | 8.7%), Health Diagnosing & Treating (140 | 8.7%), Education Instruction & Library (129 | 8.0%), Health Technologists (107 | 6.6%), and Management (38 | 2.4%).
Management, Business, Science and Arts Occupations by Sex
Within the Management, Business, Science and Arts occupations in Utuado, the most male-oriented occupations are Education, Arts & Media (100.0%), Health Diagnosing & Treating (79.3%), and Health Technologists (72.9%), while the most female-oriented occupations are Management (100.0%), Business & Financial (100.0%), and Education Instruction & Library (80.6%).
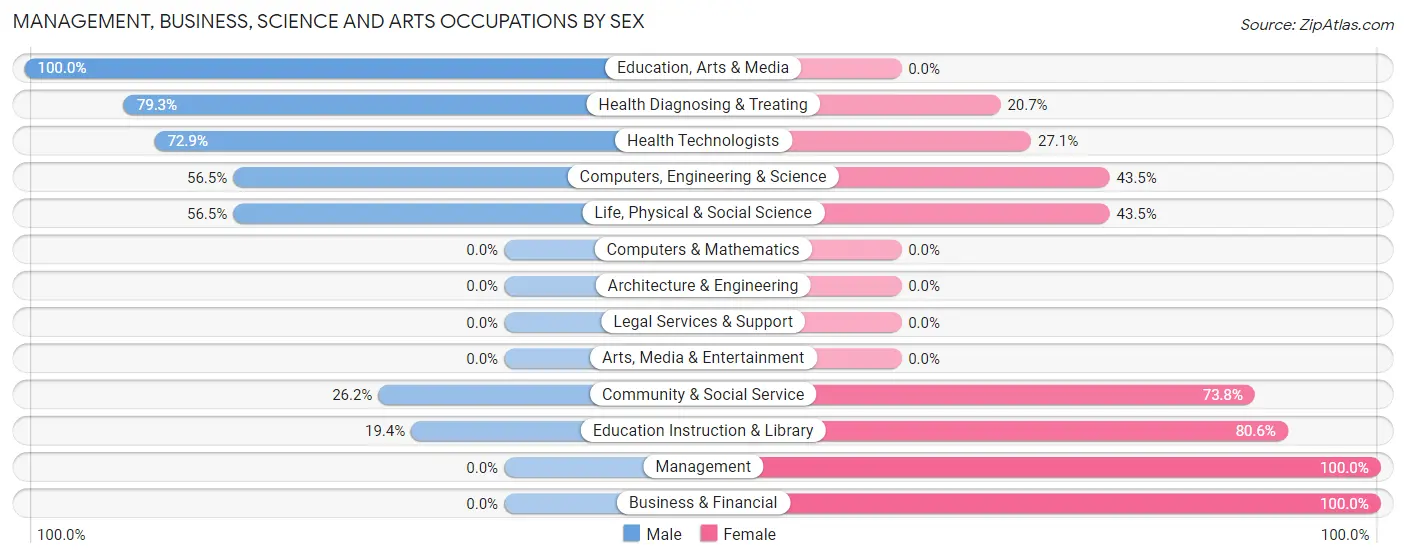
| Occupation | Male | Female |
| Management | 0 (0.0%) | 38 (100.0%) |
| Business & Financial | 0 (0.0%) | 8 (100.0%) |
| Computers, Engineering & Science | 13 (56.5%) | 10 (43.5%) |
| Computers & Mathematics | 0 (0.0%) | 0 (0.0%) |
| Architecture & Engineering | 0 (0.0%) | 0 (0.0%) |
| Life, Physical & Social Science | 13 (56.5%) | 10 (43.5%) |
| Community & Social Service | 37 (26.2%) | 104 (73.8%) |
| Education, Arts & Media | 12 (100.0%) | 0 (0.0%) |
| Legal Services & Support | 0 (0.0%) | 0 (0.0%) |
| Education Instruction & Library | 25 (19.4%) | 104 (80.6%) |
| Arts, Media & Entertainment | 0 (0.0%) | 0 (0.0%) |
| Health Diagnosing & Treating | 111 (79.3%) | 29 (20.7%) |
| Health Technologists | 78 (72.9%) | 29 (27.1%) |
| Total (Category) | 161 (46.0%) | 189 (54.0%) |
| Total (Overall) | 740 (45.8%) | 876 (54.2%) |
Services Occupations
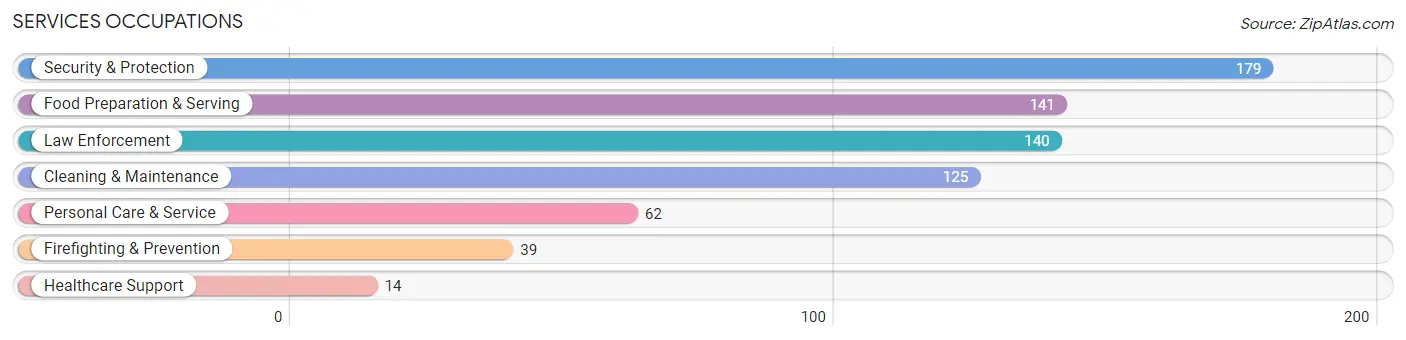
The most common Services occupations in Utuado are Security & Protection (179 | 11.1%), Food Preparation & Serving (141 | 8.7%), Law Enforcement (140 | 8.7%), Cleaning & Maintenance (125 | 7.7%), and Personal Care & Service (62 | 3.8%).
Services Occupations by Sex
Within the Services occupations in Utuado, the most male-oriented occupations are Cleaning & Maintenance (87.2%), Law Enforcement (86.4%), and Security & Protection (76.5%), while the most female-oriented occupations are Healthcare Support (100.0%), Food Preparation & Serving (73.1%), and Firefighting & Prevention (59.0%).
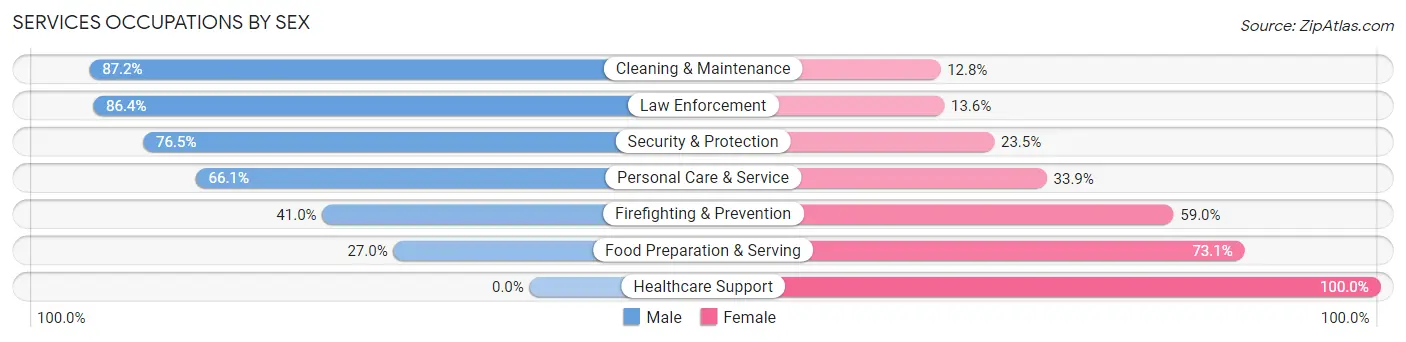
| Occupation | Male | Female |
| Healthcare Support | 0 (0.0%) | 14 (100.0%) |
| Security & Protection | 137 (76.5%) | 42 (23.5%) |
| Firefighting & Prevention | 16 (41.0%) | 23 (59.0%) |
| Law Enforcement | 121 (86.4%) | 19 (13.6%) |
| Food Preparation & Serving | 38 (27.0%) | 103 (73.1%) |
| Cleaning & Maintenance | 109 (87.2%) | 16 (12.8%) |
| Personal Care & Service | 41 (66.1%) | 21 (33.9%) |
| Total (Category) | 325 (62.4%) | 196 (37.6%) |
| Total (Overall) | 740 (45.8%) | 876 (54.2%) |
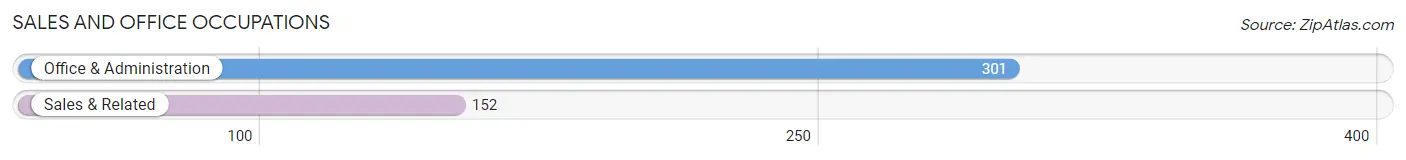
Sales and Office Occupations
The most common Sales and Office occupations in Utuado are Office & Administration (301 | 18.6%), and Sales & Related (152 | 9.4%).
Sales and Office Occupations by Sex
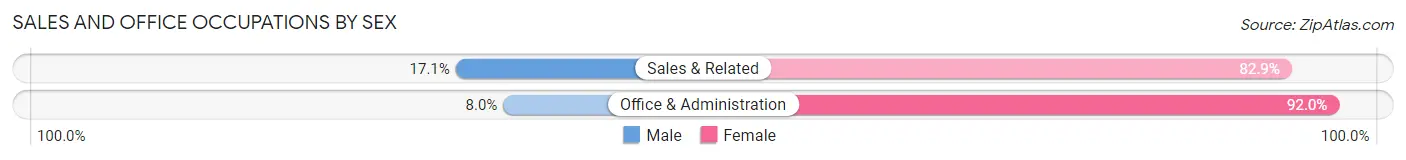
| Occupation | Male | Female |
| Sales & Related | 26 (17.1%) | 126 (82.9%) |
| Office & Administration | 24 (8.0%) | 277 (92.0%) |
| Total (Category) | 50 (11.0%) | 403 (89.0%) |
| Total (Overall) | 740 (45.8%) | 876 (54.2%) |
Natural Resources, Construction and Maintenance Occupations
The most common Natural Resources, Construction and Maintenance occupations in Utuado are Installation, Maintenance & Repair (97 | 6.0%), and Construction & Extraction (55 | 3.4%).
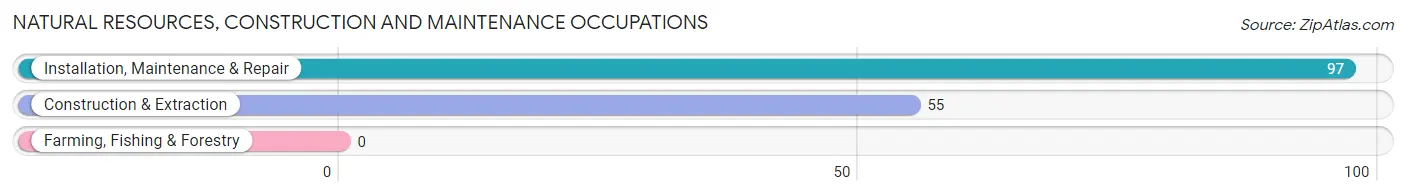
Natural Resources, Construction and Maintenance Occupations by Sex
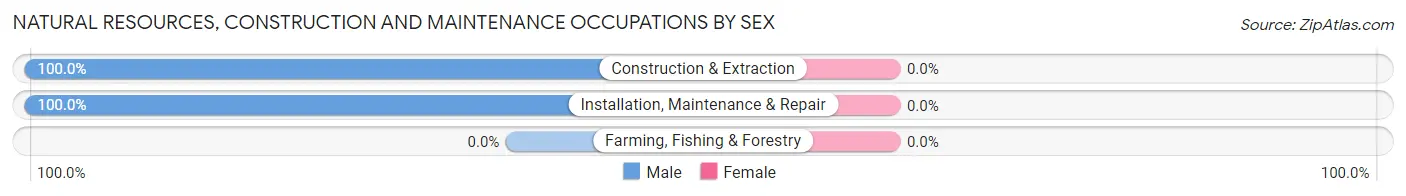
| Occupation | Male | Female |
| Farming, Fishing & Forestry | 0 (0.0%) | 0 (0.0%) |
| Construction & Extraction | 55 (100.0%) | 0 (0.0%) |
| Installation, Maintenance & Repair | 97 (100.0%) | 0 (0.0%) |
| Total (Category) | 152 (100.0%) | 0 (0.0%) |
| Total (Overall) | 740 (45.8%) | 876 (54.2%) |
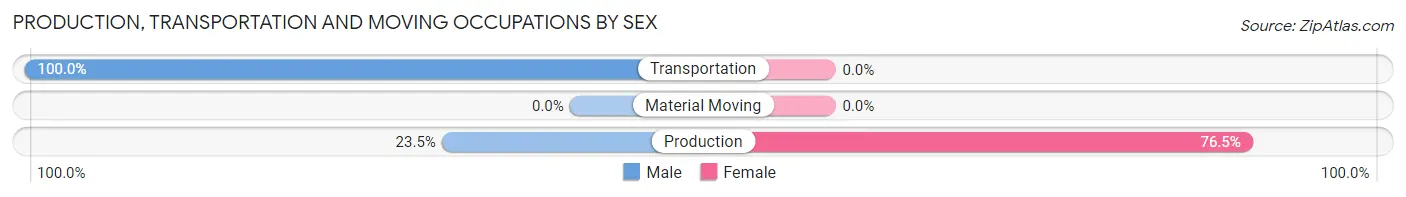
Production, Transportation and Moving Occupations
The most common Production, Transportation and Moving occupations in Utuado are Production (115 | 7.1%), and Transportation (25 | 1.5%).
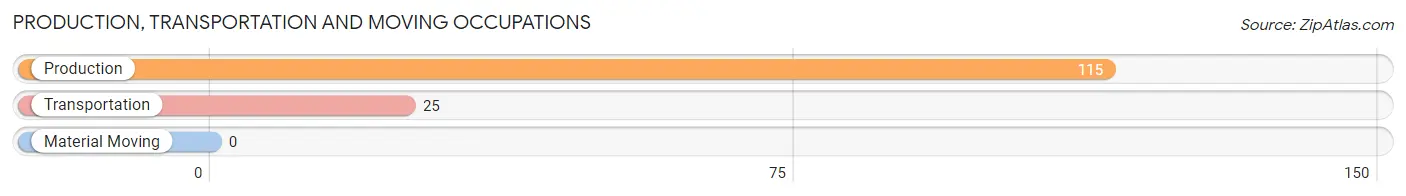
Production, Transportation and Moving Occupations by Sex
| Occupation | Male | Female |
| Production | 27 (23.5%) | 88 (76.5%) |
| Transportation | 25 (100.0%) | 0 (0.0%) |
| Material Moving | 0 (0.0%) | 0 (0.0%) |
| Total (Category) | 52 (37.1%) | 88 (62.9%) |
| Total (Overall) | 740 (45.8%) | 876 (54.2%) |
Employment Industries by Sex in Utuado
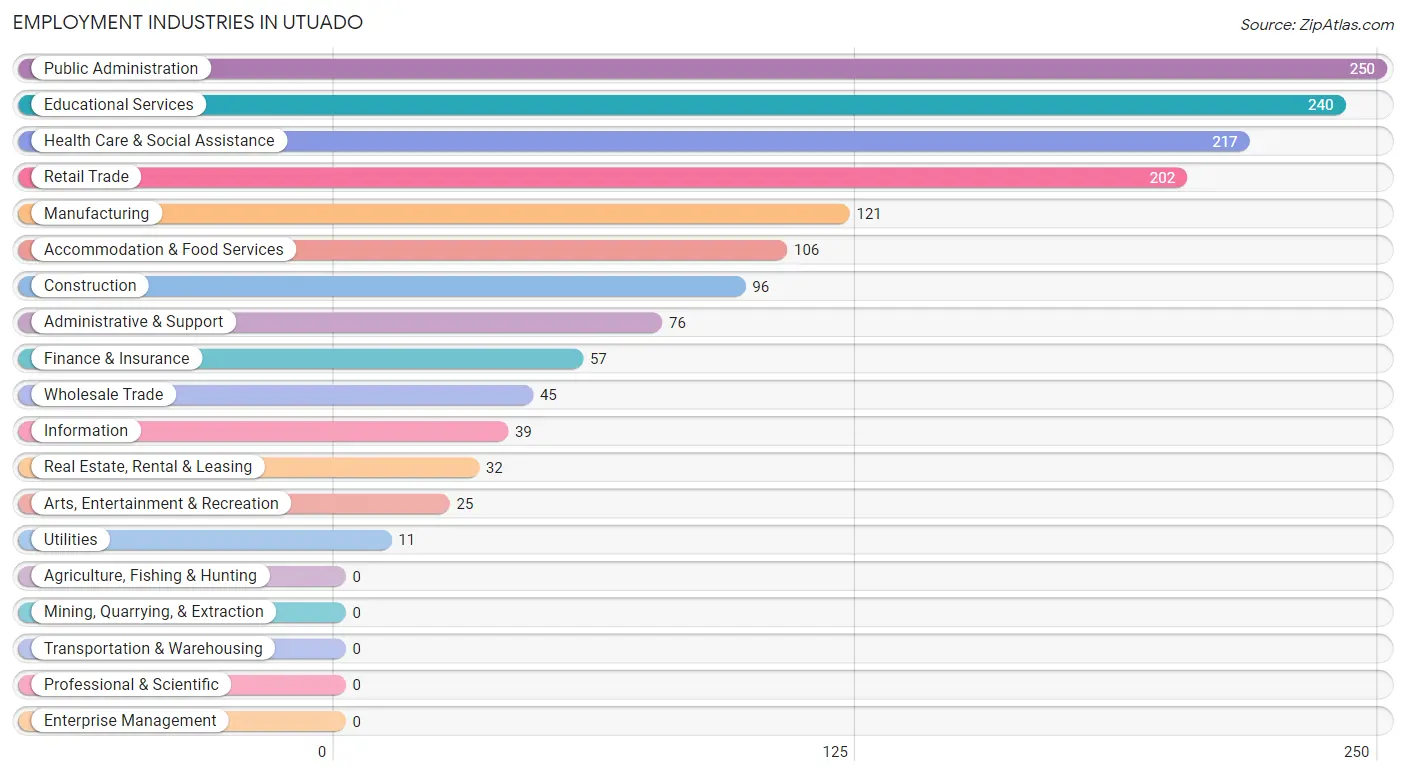
Employment Industries in Utuado
The major employment industries in Utuado include Public Administration (250 | 15.5%), Educational Services (240 | 14.8%), Health Care & Social Assistance (217 | 13.4%), Retail Trade (202 | 12.5%), and Manufacturing (121 | 7.5%).
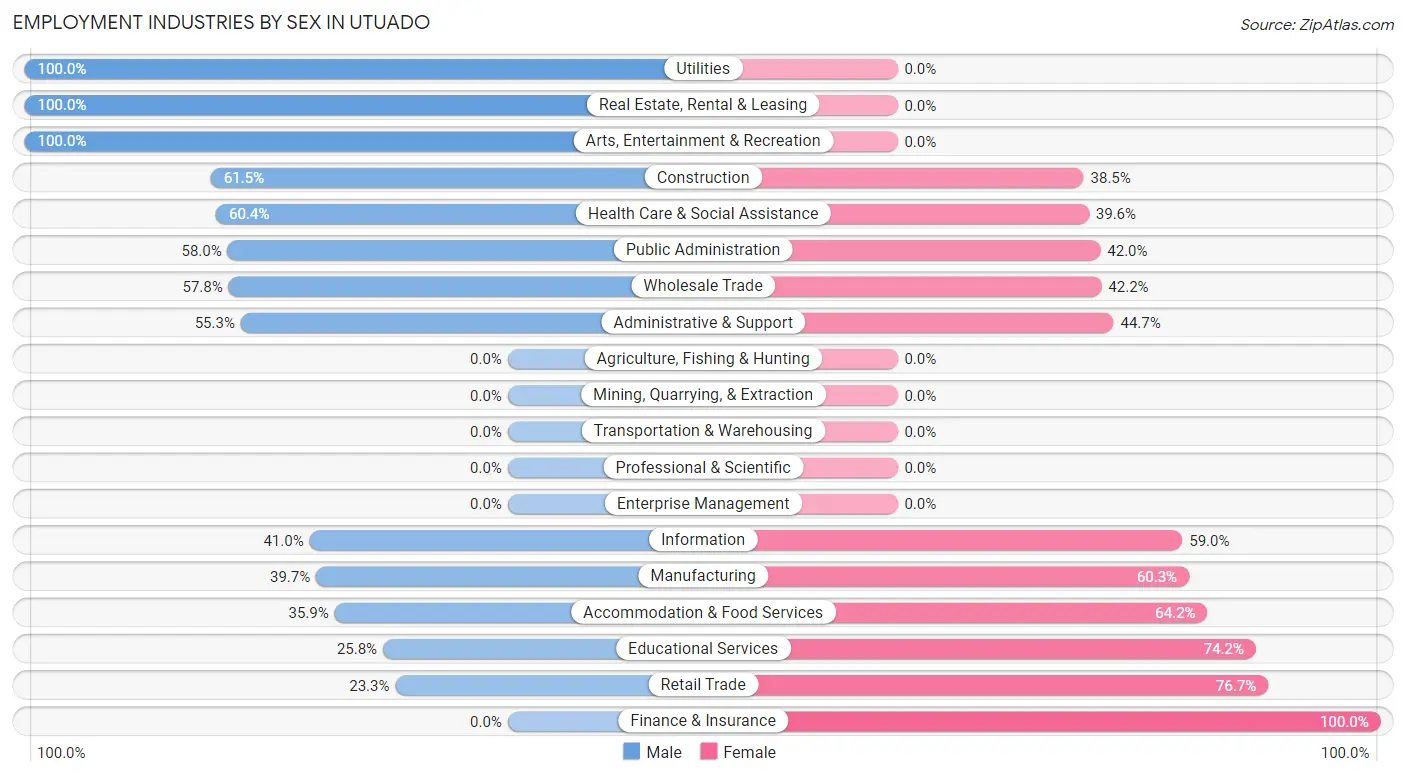
Employment Industries by Sex in Utuado
The Utuado industries that see more men than women are Utilities (100.0%), Real Estate, Rental & Leasing (100.0%), and Arts, Entertainment & Recreation (100.0%), whereas the industries that tend to have a higher number of women are Finance & Insurance (100.0%), Retail Trade (76.7%), and Educational Services (74.2%).
| Industry | Male | Female |
| Agriculture, Fishing & Hunting | 0 (0.0%) | 0 (0.0%) |
| Mining, Quarrying, & Extraction | 0 (0.0%) | 0 (0.0%) |
| Construction | 59 (61.5%) | 37 (38.5%) |
| Manufacturing | 48 (39.7%) | 73 (60.3%) |
| Wholesale Trade | 26 (57.8%) | 19 (42.2%) |
| Retail Trade | 47 (23.3%) | 155 (76.7%) |
| Transportation & Warehousing | 0 (0.0%) | 0 (0.0%) |
| Utilities | 11 (100.0%) | 0 (0.0%) |
| Information | 16 (41.0%) | 23 (59.0%) |
| Finance & Insurance | 0 (0.0%) | 57 (100.0%) |
| Real Estate, Rental & Leasing | 32 (100.0%) | 0 (0.0%) |
| Professional & Scientific | 0 (0.0%) | 0 (0.0%) |
| Enterprise Management | 0 (0.0%) | 0 (0.0%) |
| Administrative & Support | 42 (55.3%) | 34 (44.7%) |
| Educational Services | 62 (25.8%) | 178 (74.2%) |
| Health Care & Social Assistance | 131 (60.4%) | 86 (39.6%) |
| Arts, Entertainment & Recreation | 25 (100.0%) | 0 (0.0%) |
| Accommodation & Food Services | 38 (35.8%) | 68 (64.1%) |
| Public Administration | 145 (58.0%) | 105 (42.0%) |
| Total | 740 (45.8%) | 876 (54.2%) |
Education in Utuado
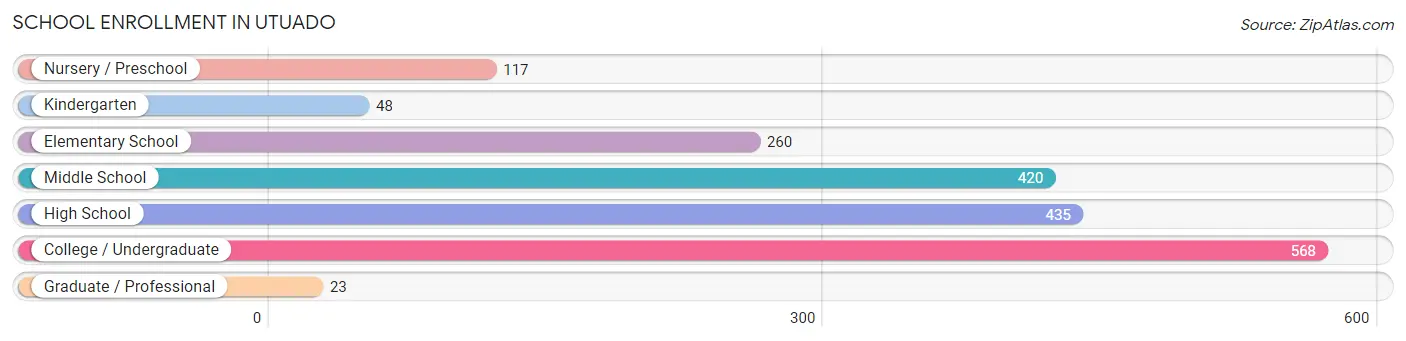
School Enrollment in Utuado
The most common levels of schooling among the 1,871 students in Utuado are college / undergraduate (568 | 30.4%), high school (435 | 23.3%), and middle school (420 | 22.5%).
| School Level | # Students | % Students |
| Nursery / Preschool | 117 | 6.2% |
| Kindergarten | 48 | 2.6% |
| Elementary School | 260 | 13.9% |
| Middle School | 420 | 22.5% |
| High School | 435 | 23.3% |
| College / Undergraduate | 568 | 30.4% |
| Graduate / Professional | 23 | 1.2% |
| Total | 1,871 | 100.0% |
School Enrollment by Age by Funding Source in Utuado
Out of a total of 1,871 students who are enrolled in schools in Utuado, 445 (23.8%) attend a private institution, while the remaining 1,426 (76.2%) are enrolled in public schools. The age group of 35 years and over has the highest likelihood of being enrolled in private schools, with 32 (80.0% in the age bracket) enrolled. Conversely, the age group of 15 to 17 year olds has the lowest likelihood of being enrolled in a private school, with 309 (100.0% in the age bracket) attending a public institution.
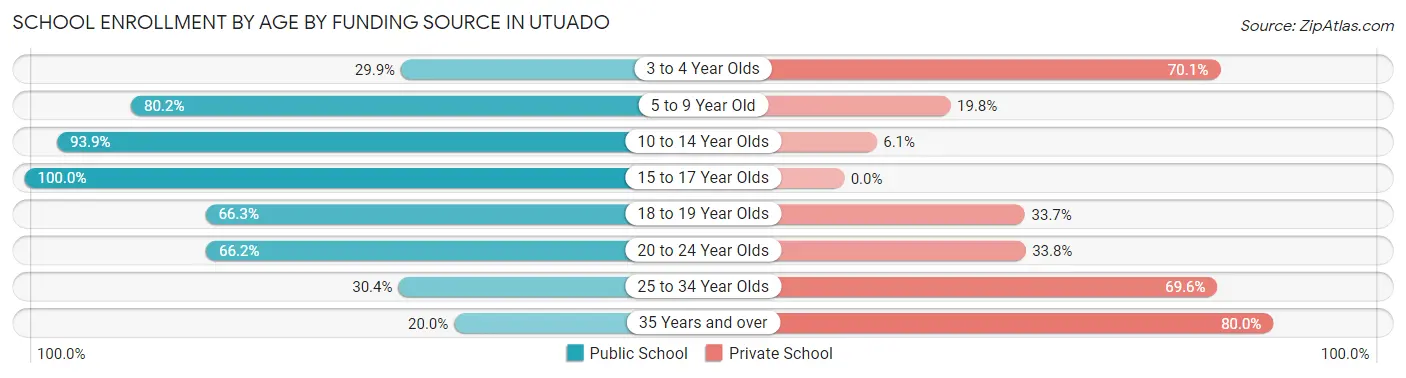
| Age Bracket | Public School | Private School |
| 3 to 4 Year Olds | 35 (29.9%) | 82 (70.1%) |
| 5 to 9 Year Old | 190 (80.2%) | 47 (19.8%) |
| 10 to 14 Year Olds | 526 (93.9%) | 34 (6.1%) |
| 15 to 17 Year Olds | 309 (100.0%) | 0 (0.0%) |
| 18 to 19 Year Olds | 181 (66.3%) | 92 (33.7%) |
| 20 to 24 Year Olds | 139 (66.2%) | 71 (33.8%) |
| 25 to 34 Year Olds | 38 (30.4%) | 87 (69.6%) |
| 35 Years and over | 8 (20.0%) | 32 (80.0%) |
| Total | 1,426 (76.2%) | 445 (23.8%) |
Educational Attainment by Field of Study in Utuado
Education (352 | 31.9%), science & technology (219 | 19.8%), business (200 | 18.1%), arts & humanities (83 | 7.5%), and bio, nature & agricultural (51 | 4.6%) are the most common fields of study among 1,105 individuals in Utuado who have obtained a bachelor's degree or higher.
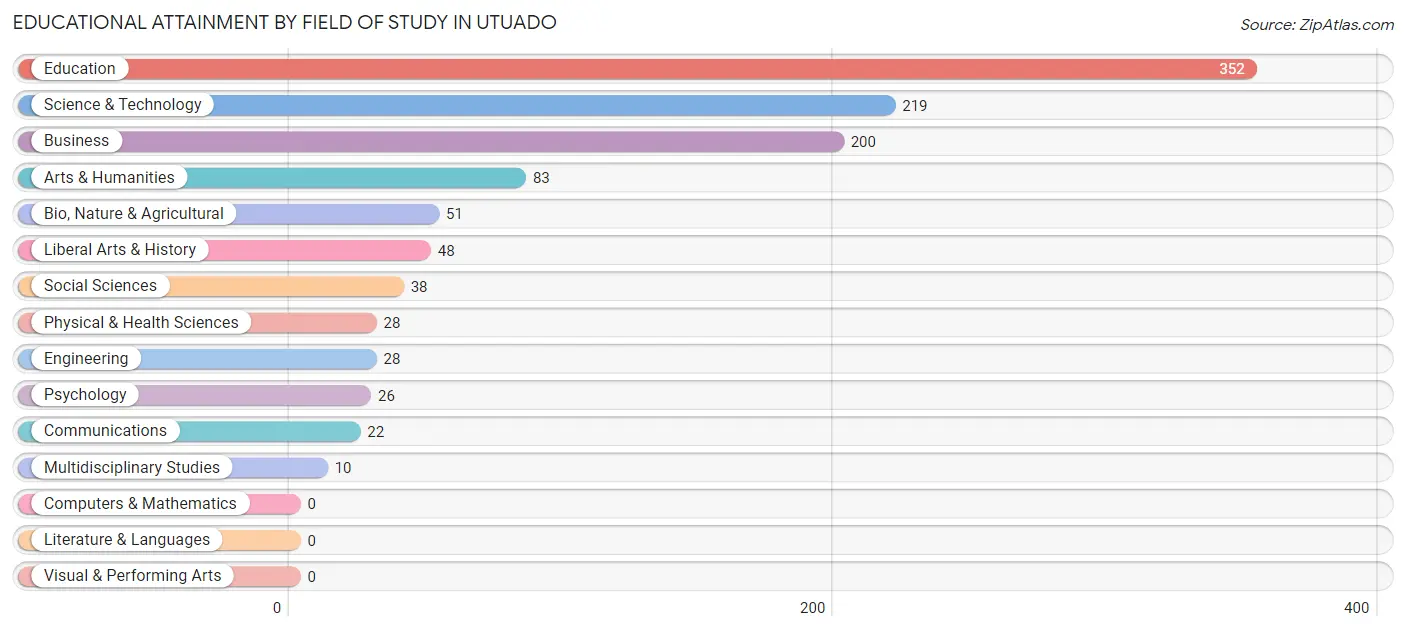
| Field of Study | # Graduates | % Graduates |
| Computers & Mathematics | 0 | 0.0% |
| Bio, Nature & Agricultural | 51 | 4.6% |
| Physical & Health Sciences | 28 | 2.5% |
| Psychology | 26 | 2.4% |
| Social Sciences | 38 | 3.4% |
| Engineering | 28 | 2.5% |
| Multidisciplinary Studies | 10 | 0.9% |
| Science & Technology | 219 | 19.8% |
| Business | 200 | 18.1% |
| Education | 352 | 31.9% |
| Literature & Languages | 0 | 0.0% |
| Liberal Arts & History | 48 | 4.3% |
| Visual & Performing Arts | 0 | 0.0% |
| Communications | 22 | 2.0% |
| Arts & Humanities | 83 | 7.5% |
| Total | 1,105 | 100.0% |
Transportation & Commute in Utuado
Vehicle Availability by Sex in Utuado
The most prevalent vehicle ownership categories in Utuado are males with 2 vehicles (379, accounting for 52.4%) and females with 2 vehicles (224, making up 45.1%).
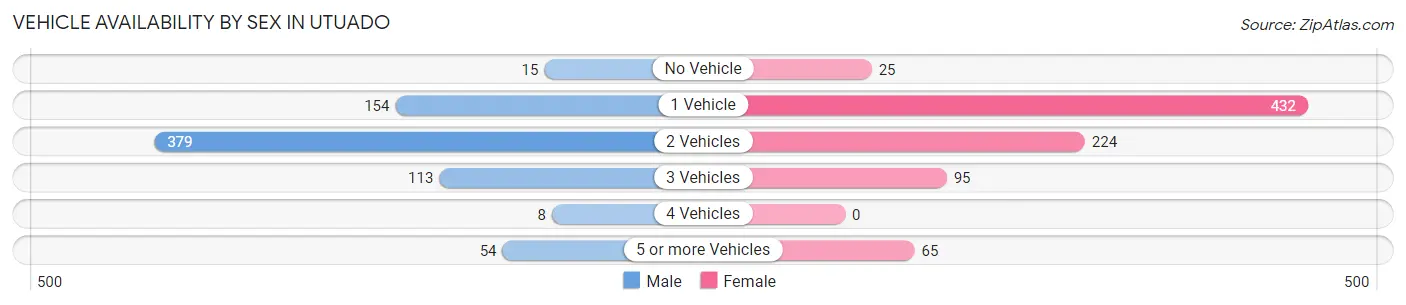
| Vehicles Available | Male | Female |
| No Vehicle | 15 (2.1%) | 25 (3.0%) |
| 1 Vehicle | 154 (21.3%) | 432 (51.4%) |
| 2 Vehicles | 379 (52.4%) | 224 (26.6%) |
| 3 Vehicles | 113 (15.6%) | 95 (11.3%) |
| 4 Vehicles | 8 (1.1%) | 0 (0.0%) |
| 5 or more Vehicles | 54 (7.5%) | 65 (7.7%) |
| Total | 723 (100.0%) | 841 (100.0%) |
Commute Time in Utuado
The most frequently occuring commute durations in Utuado are 5 to 9 minutes (410 commuters, 26.4%), 10 to 14 minutes (320 commuters, 20.6%), and 60 to 89 minutes (199 commuters, 12.8%).
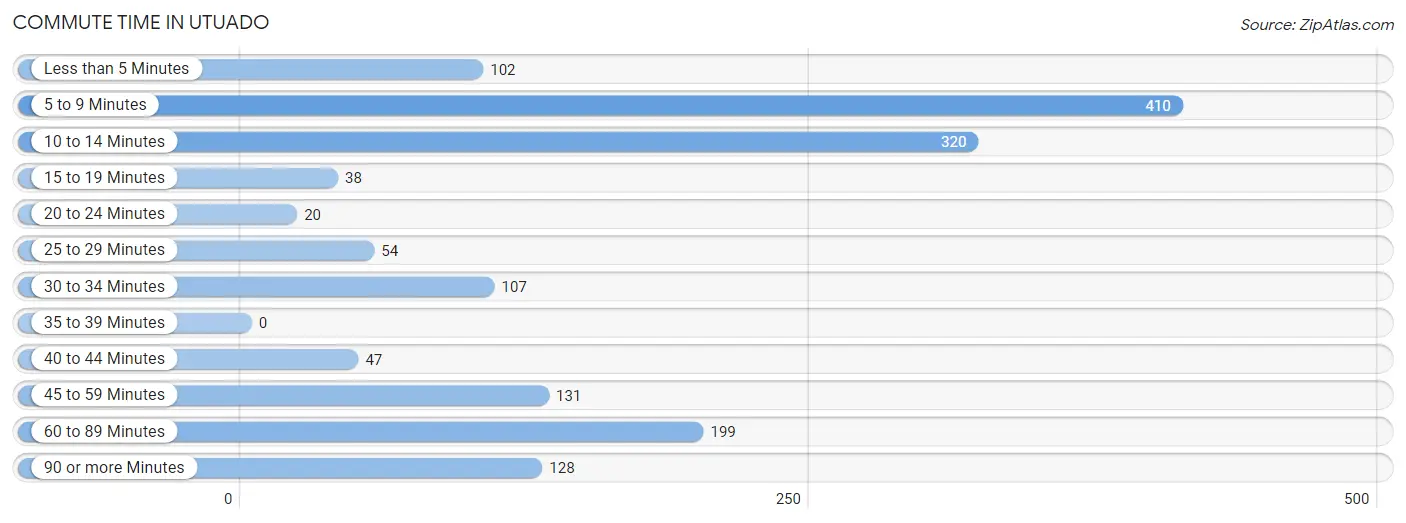
| Commute Time | # Commuters | % Commuters |
| Less than 5 Minutes | 102 | 6.6% |
| 5 to 9 Minutes | 410 | 26.4% |
| 10 to 14 Minutes | 320 | 20.6% |
| 15 to 19 Minutes | 38 | 2.4% |
| 20 to 24 Minutes | 20 | 1.3% |
| 25 to 29 Minutes | 54 | 3.5% |
| 30 to 34 Minutes | 107 | 6.9% |
| 35 to 39 Minutes | 0 | 0.0% |
| 40 to 44 Minutes | 47 | 3.0% |
| 45 to 59 Minutes | 131 | 8.4% |
| 60 to 89 Minutes | 199 | 12.8% |
| 90 or more Minutes | 128 | 8.2% |
Commute Time by Sex in Utuado
The most common commute times in Utuado are 10 to 14 minutes (142 commuters, 19.5%) for males and 5 to 9 minutes (279 commuters, 33.7%) for females.
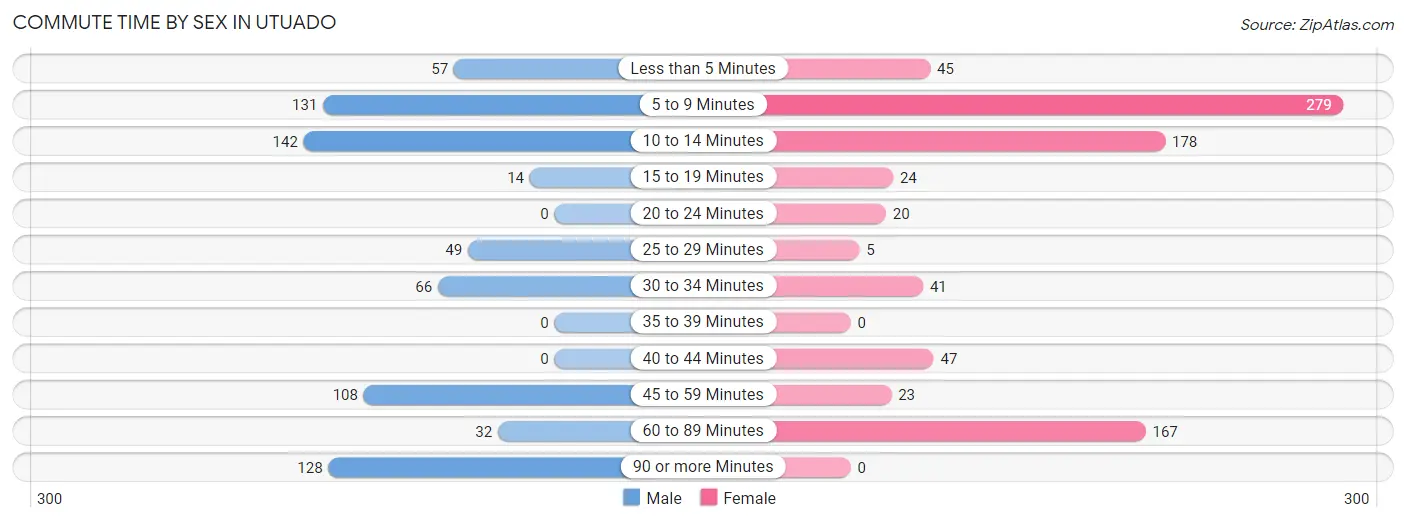
| Commute Time | Male | Female |
| Less than 5 Minutes | 57 (7.8%) | 45 (5.4%) |
| 5 to 9 Minutes | 131 (18.0%) | 279 (33.7%) |
| 10 to 14 Minutes | 142 (19.5%) | 178 (21.5%) |
| 15 to 19 Minutes | 14 (1.9%) | 24 (2.9%) |
| 20 to 24 Minutes | 0 (0.0%) | 20 (2.4%) |
| 25 to 29 Minutes | 49 (6.7%) | 5 (0.6%) |
| 30 to 34 Minutes | 66 (9.1%) | 41 (5.0%) |
| 35 to 39 Minutes | 0 (0.0%) | 0 (0.0%) |
| 40 to 44 Minutes | 0 (0.0%) | 47 (5.7%) |
| 45 to 59 Minutes | 108 (14.9%) | 23 (2.8%) |
| 60 to 89 Minutes | 32 (4.4%) | 167 (20.1%) |
| 90 or more Minutes | 128 (17.6%) | 0 (0.0%) |
Time of Departure to Work by Sex in Utuado
The most frequent times of departure to work in Utuado are 7:30 AM to 7:59 AM (137, 18.8%) for males and 7:30 AM to 7:59 AM (203, 24.5%) for females.
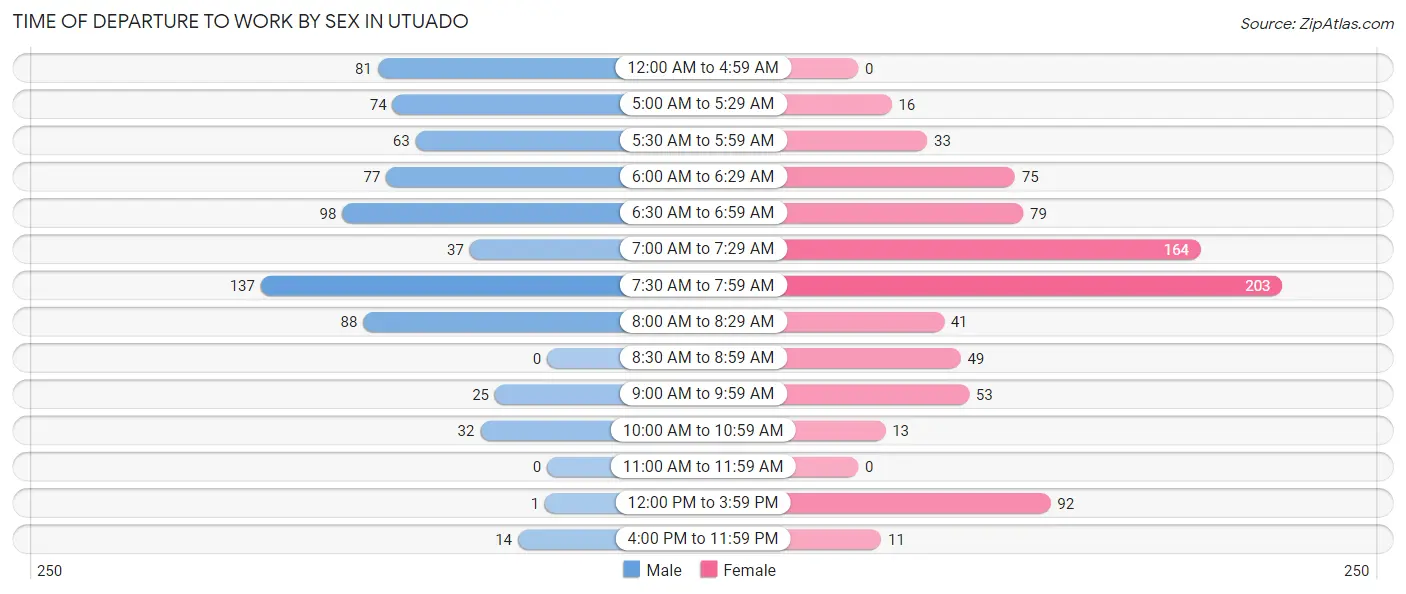
| Time of Departure | Male | Female |
| 12:00 AM to 4:59 AM | 81 (11.1%) | 0 (0.0%) |
| 5:00 AM to 5:29 AM | 74 (10.2%) | 16 (1.9%) |
| 5:30 AM to 5:59 AM | 63 (8.7%) | 33 (4.0%) |
| 6:00 AM to 6:29 AM | 77 (10.6%) | 75 (9.0%) |
| 6:30 AM to 6:59 AM | 98 (13.5%) | 79 (9.5%) |
| 7:00 AM to 7:29 AM | 37 (5.1%) | 164 (19.8%) |
| 7:30 AM to 7:59 AM | 137 (18.8%) | 203 (24.5%) |
| 8:00 AM to 8:29 AM | 88 (12.1%) | 41 (5.0%) |
| 8:30 AM to 8:59 AM | 0 (0.0%) | 49 (5.9%) |
| 9:00 AM to 9:59 AM | 25 (3.4%) | 53 (6.4%) |
| 10:00 AM to 10:59 AM | 32 (4.4%) | 13 (1.6%) |
| 11:00 AM to 11:59 AM | 0 (0.0%) | 0 (0.0%) |
| 12:00 PM to 3:59 PM | 1 (0.1%) | 92 (11.1%) |
| 4:00 PM to 11:59 PM | 14 (1.9%) | 11 (1.3%) |
| Total | 727 (100.0%) | 829 (100.0%) |
Housing Occupancy in Utuado
Occupancy by Ownership in Utuado
Of the total 2,950 dwellings in Utuado, owner-occupied units account for 1,431 (48.5%), while renter-occupied units make up 1,519 (51.5%).
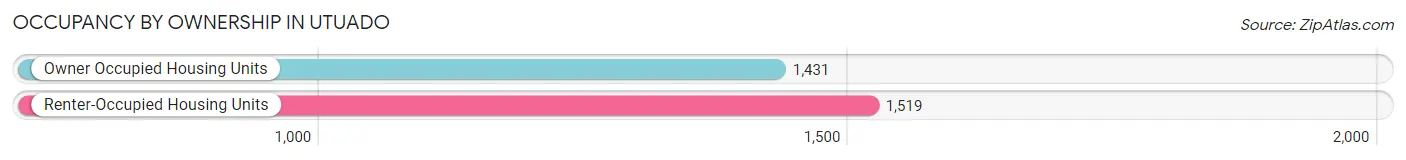
| Occupancy | # Housing Units | % Housing Units |
| Owner Occupied Housing Units | 1,431 | 48.5% |
| Renter-Occupied Housing Units | 1,519 | 51.5% |
| Total Occupied Housing Units | 2,950 | 100.0% |
Occupancy by Household Size in Utuado
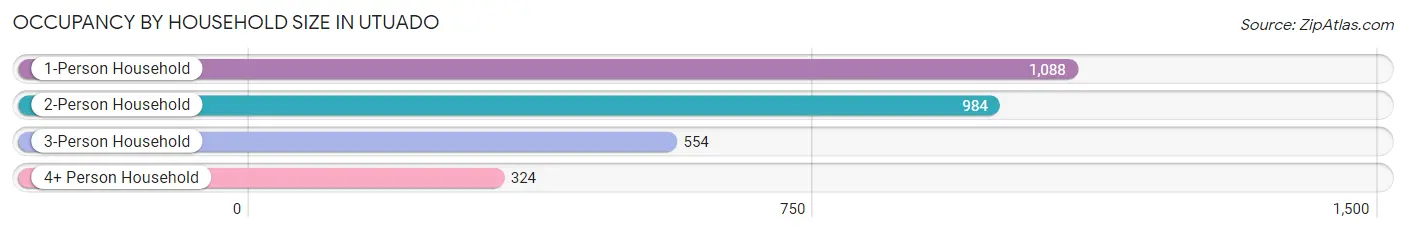
| Household Size | # Housing Units | % Housing Units |
| 1-Person Household | 1,088 | 36.9% |
| 2-Person Household | 984 | 33.4% |
| 3-Person Household | 554 | 18.8% |
| 4+ Person Household | 324 | 11.0% |
| Total Housing Units | 2,950 | 100.0% |
Occupancy by Ownership by Household Size in Utuado
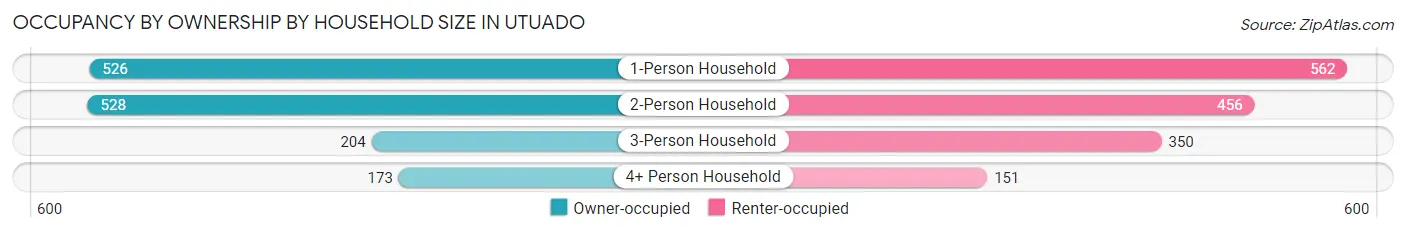
| Household Size | Owner-occupied | Renter-occupied |
| 1-Person Household | 526 (48.3%) | 562 (51.6%) |
| 2-Person Household | 528 (53.7%) | 456 (46.3%) |
| 3-Person Household | 204 (36.8%) | 350 (63.2%) |
| 4+ Person Household | 173 (53.4%) | 151 (46.6%) |
| Total Housing Units | 1,431 (48.5%) | 1,519 (51.5%) |
Occupancy by Educational Attainment in Utuado
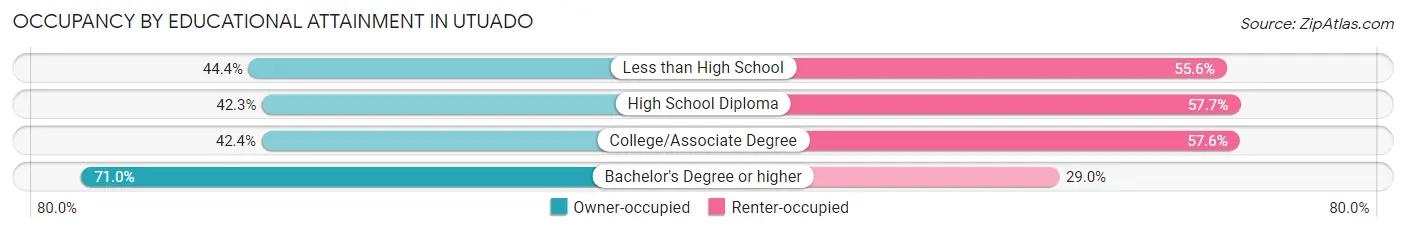
| Household Size | Owner-occupied | Renter-occupied |
| Less than High School | 315 (44.4%) | 394 (55.6%) |
| High School Diploma | 335 (42.3%) | 457 (57.7%) |
| College/Associate Degree | 367 (42.4%) | 499 (57.6%) |
| Bachelor's Degree or higher | 414 (71.0%) | 169 (29.0%) |
Occupancy by Age of Householder in Utuado
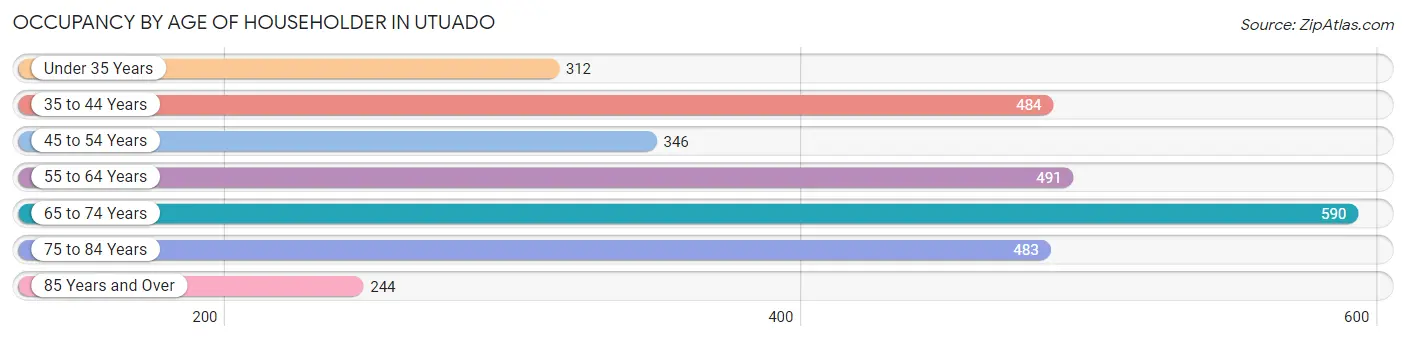
| Age Bracket | # Households | % Households |
| Under 35 Years | 312 | 10.6% |
| 35 to 44 Years | 484 | 16.4% |
| 45 to 54 Years | 346 | 11.7% |
| 55 to 64 Years | 491 | 16.6% |
| 65 to 74 Years | 590 | 20.0% |
| 75 to 84 Years | 483 | 16.4% |
| 85 Years and Over | 244 | 8.3% |
| Total | 2,950 | 100.0% |
Housing Finances in Utuado
Median Income by Occupancy in Utuado
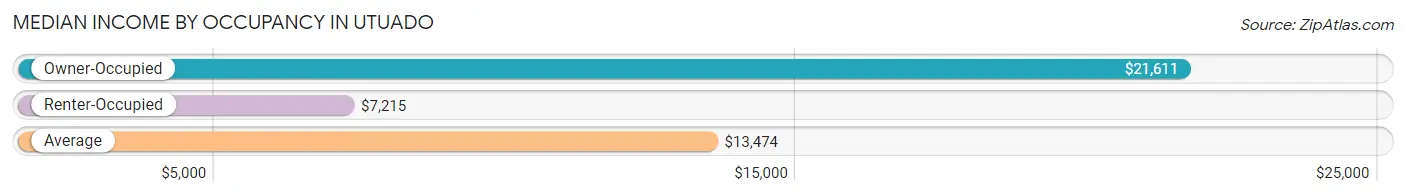
| Occupancy Type | # Households | Median Income |
| Owner-Occupied | 1,431 (48.5%) | $21,611 |
| Renter-Occupied | 1,519 (51.5%) | $7,215 |
| Average | 2,950 (100.0%) | $13,474 |
Occupancy by Householder Income Bracket in Utuado
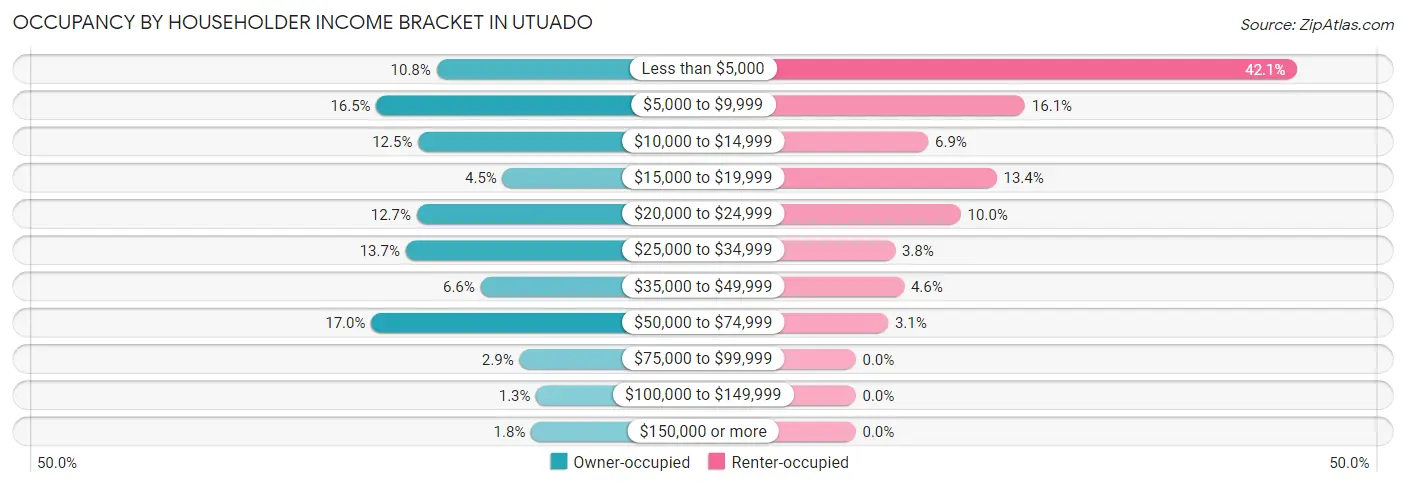
| Income Bracket | Owner-occupied | Renter-occupied |
| Less than $5,000 | 154 (10.8%) | 639 (42.1%) |
| $5,000 to $9,999 | 236 (16.5%) | 245 (16.1%) |
| $10,000 to $14,999 | 179 (12.5%) | 105 (6.9%) |
| $15,000 to $19,999 | 64 (4.5%) | 204 (13.4%) |
| $20,000 to $24,999 | 181 (12.7%) | 152 (10.0%) |
| $25,000 to $34,999 | 196 (13.7%) | 57 (3.7%) |
| $35,000 to $49,999 | 94 (6.6%) | 70 (4.6%) |
| $50,000 to $74,999 | 243 (17.0%) | 47 (3.1%) |
| $75,000 to $99,999 | 41 (2.9%) | 0 (0.0%) |
| $100,000 to $149,999 | 18 (1.3%) | 0 (0.0%) |
| $150,000 or more | 25 (1.8%) | 0 (0.0%) |
| Total | 1,431 (100.0%) | 1,519 (100.0%) |
Monthly Housing Cost Tiers in Utuado
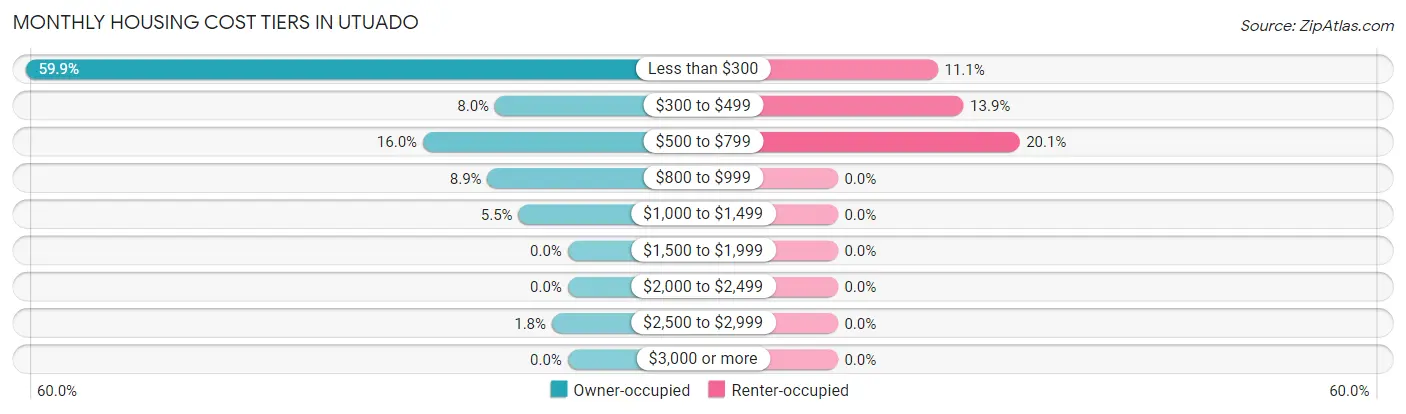
| Monthly Cost | Owner-occupied | Renter-occupied |
| Less than $300 | 857 (59.9%) | 168 (11.1%) |
| $300 to $499 | 115 (8.0%) | 211 (13.9%) |
| $500 to $799 | 229 (16.0%) | 305 (20.1%) |
| $800 to $999 | 127 (8.9%) | 0 (0.0%) |
| $1,000 to $1,499 | 78 (5.4%) | 0 (0.0%) |
| $1,500 to $1,999 | 0 (0.0%) | 0 (0.0%) |
| $2,000 to $2,499 | 0 (0.0%) | 0 (0.0%) |
| $2,500 to $2,999 | 25 (1.8%) | 0 (0.0%) |
| $3,000 or more | 0 (0.0%) | 0 (0.0%) |
| Total | 1,431 (100.0%) | 1,519 (100.0%) |
Physical Housing Characteristics in Utuado
Housing Structures in Utuado
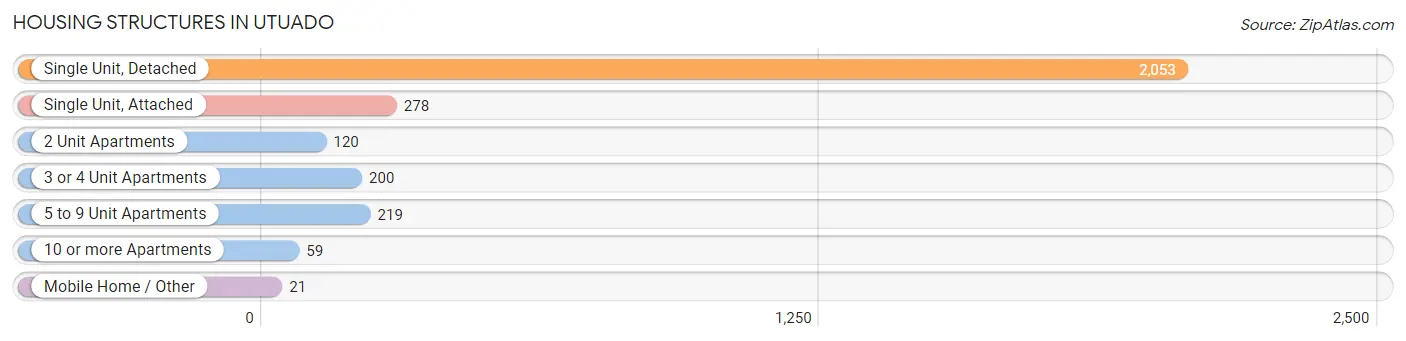
| Structure Type | # Housing Units | % Housing Units |
| Single Unit, Detached | 2,053 | 69.6% |
| Single Unit, Attached | 278 | 9.4% |
| 2 Unit Apartments | 120 | 4.1% |
| 3 or 4 Unit Apartments | 200 | 6.8% |
| 5 to 9 Unit Apartments | 219 | 7.4% |
| 10 or more Apartments | 59 | 2.0% |
| Mobile Home / Other | 21 | 0.7% |
| Total | 2,950 | 100.0% |
Housing Structures by Occupancy in Utuado
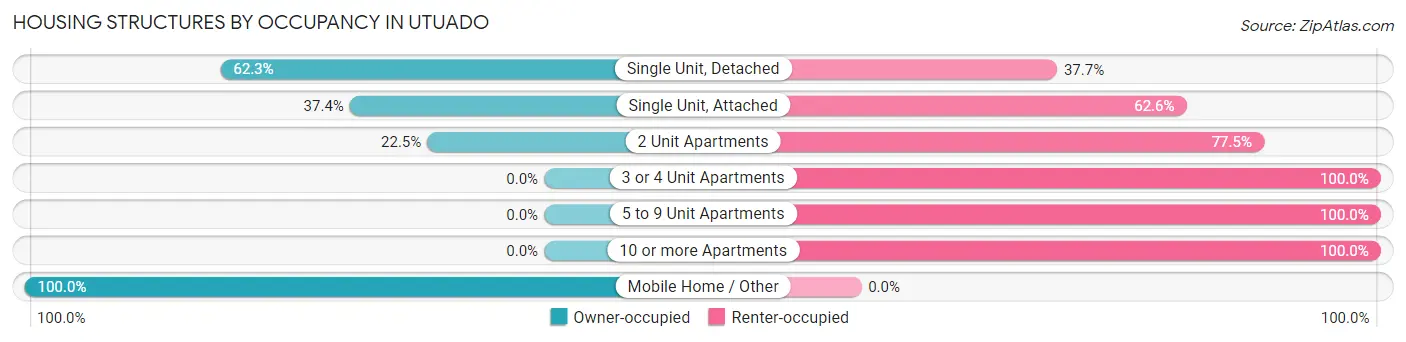
| Structure Type | Owner-occupied | Renter-occupied |
| Single Unit, Detached | 1,279 (62.3%) | 774 (37.7%) |
| Single Unit, Attached | 104 (37.4%) | 174 (62.6%) |
| 2 Unit Apartments | 27 (22.5%) | 93 (77.5%) |
| 3 or 4 Unit Apartments | 0 (0.0%) | 200 (100.0%) |
| 5 to 9 Unit Apartments | 0 (0.0%) | 219 (100.0%) |
| 10 or more Apartments | 0 (0.0%) | 59 (100.0%) |
| Mobile Home / Other | 21 (100.0%) | 0 (0.0%) |
| Total | 1,431 (48.5%) | 1,519 (51.5%) |
Housing Structures by Number of Rooms in Utuado
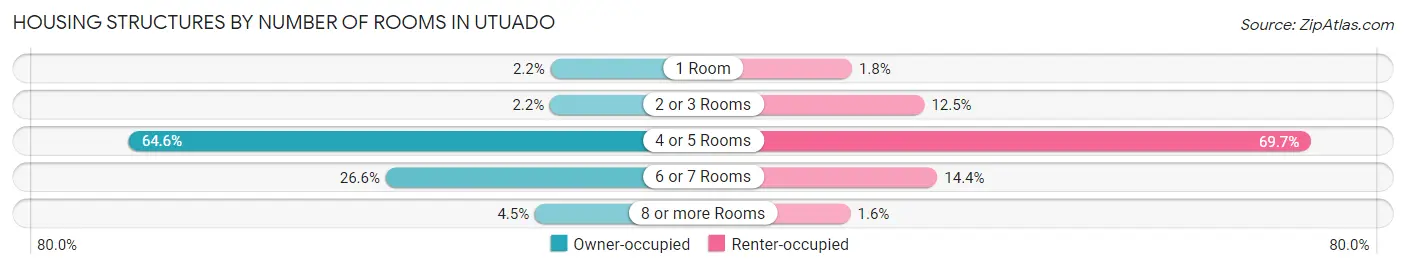
| Number of Rooms | Owner-occupied | Renter-occupied |
| 1 Room | 31 (2.2%) | 27 (1.8%) |
| 2 or 3 Rooms | 32 (2.2%) | 190 (12.5%) |
| 4 or 5 Rooms | 924 (64.6%) | 1,059 (69.7%) |
| 6 or 7 Rooms | 380 (26.6%) | 219 (14.4%) |
| 8 or more Rooms | 64 (4.5%) | 24 (1.6%) |
| Total | 1,431 (100.0%) | 1,519 (100.0%) |
Housing Structure by Heating Type in Utuado
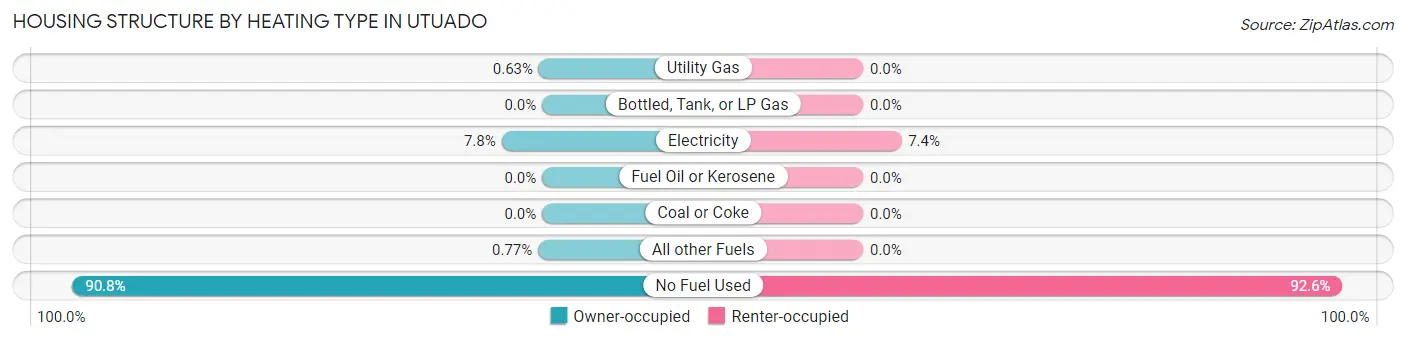
| Heating Type | Owner-occupied | Renter-occupied |
| Utility Gas | 9 (0.6%) | 0 (0.0%) |
| Bottled, Tank, or LP Gas | 0 (0.0%) | 0 (0.0%) |
| Electricity | 112 (7.8%) | 112 (7.4%) |
| Fuel Oil or Kerosene | 0 (0.0%) | 0 (0.0%) |
| Coal or Coke | 0 (0.0%) | 0 (0.0%) |
| All other Fuels | 11 (0.8%) | 0 (0.0%) |
| No Fuel Used | 1,299 (90.8%) | 1,407 (92.6%) |
| Total | 1,431 (100.0%) | 1,519 (100.0%) |
Household Vehicle Usage in Utuado
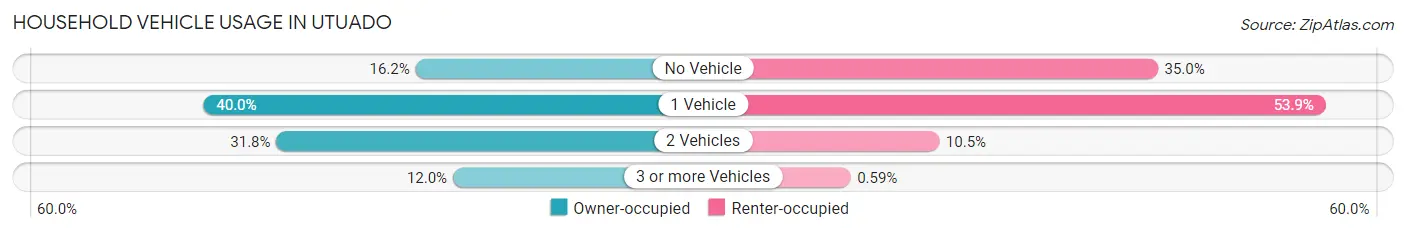
| Vehicles per Household | Owner-occupied | Renter-occupied |
| No Vehicle | 232 (16.2%) | 532 (35.0%) |
| 1 Vehicle | 572 (40.0%) | 818 (53.8%) |
| 2 Vehicles | 455 (31.8%) | 160 (10.5%) |
| 3 or more Vehicles | 172 (12.0%) | 9 (0.6%) |
| Total | 1,431 (100.0%) | 1,519 (100.0%) |
Real Estate & Mortgages in Utuado
Real Estate and Mortgage Overview in Utuado
| Characteristic | Without Mortgage | With Mortgage |
| Housing Units | 973 | 458 |
| Median Property Value | $96,000 | $108,800 |
| Median Household Income | $14,878 | $25 |
| Monthly Housing Costs | $155 | $0 |
| Real Estate Taxes | $199 | $407 |
Property Value by Mortgage Status in Utuado
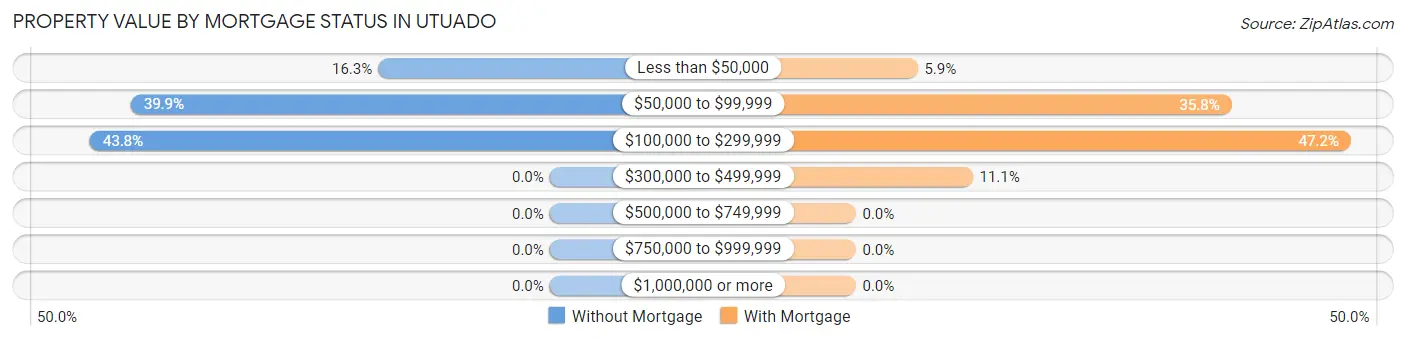
| Property Value | Without Mortgage | With Mortgage |
| Less than $50,000 | 159 (16.3%) | 27 (5.9%) |
| $50,000 to $99,999 | 388 (39.9%) | 164 (35.8%) |
| $100,000 to $299,999 | 426 (43.8%) | 216 (47.2%) |
| $300,000 to $499,999 | 0 (0.0%) | 51 (11.1%) |
| $500,000 to $749,999 | 0 (0.0%) | 0 (0.0%) |
| $750,000 to $999,999 | 0 (0.0%) | 0 (0.0%) |
| $1,000,000 or more | 0 (0.0%) | 0 (0.0%) |
| Total | 973 (100.0%) | 458 (100.0%) |
Household Income by Mortgage Status in Utuado
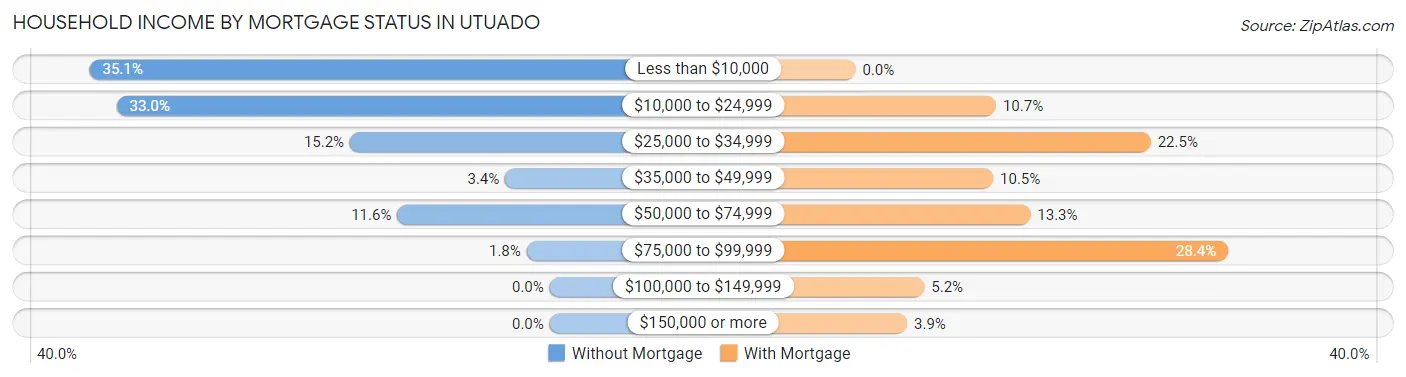
| Household Income | Without Mortgage | With Mortgage |
| Less than $10,000 | 341 (35.0%) | 0 (0.0%) |
| $10,000 to $24,999 | 321 (33.0%) | 49 (10.7%) |
| $25,000 to $34,999 | 148 (15.2%) | 103 (22.5%) |
| $35,000 to $49,999 | 33 (3.4%) | 48 (10.5%) |
| $50,000 to $74,999 | 113 (11.6%) | 61 (13.3%) |
| $75,000 to $99,999 | 17 (1.8%) | 130 (28.4%) |
| $100,000 to $149,999 | 0 (0.0%) | 24 (5.2%) |
| $150,000 or more | 0 (0.0%) | 18 (3.9%) |
| Total | 973 (100.0%) | 458 (100.0%) |
Property Value to Household Income Ratio in Utuado
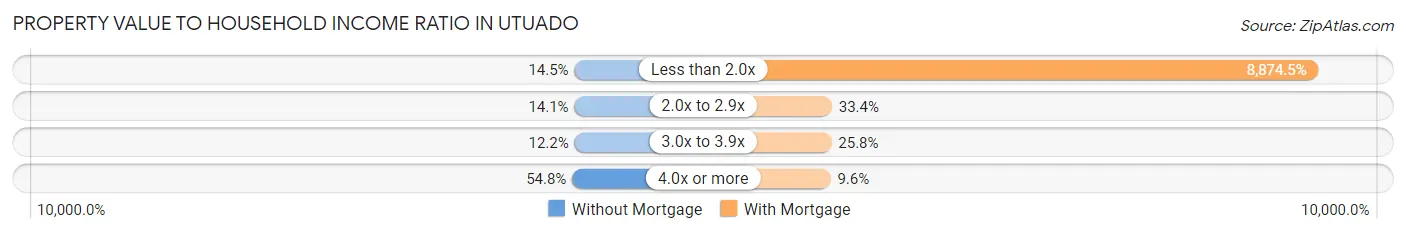
| Value-to-Income Ratio | Without Mortgage | With Mortgage |
| Less than 2.0x | 141 (14.5%) | 40,645 (8,874.5%) |
| 2.0x to 2.9x | 137 (14.1%) | 153 (33.4%) |
| 3.0x to 3.9x | 119 (12.2%) | 118 (25.8%) |
| 4.0x or more | 533 (54.8%) | 44 (9.6%) |
| Total | 973 (100.0%) | 458 (100.0%) |
Real Estate Taxes by Mortgage Status in Utuado
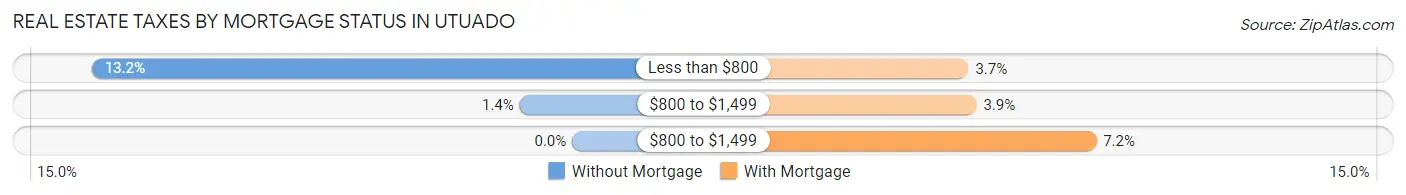
| Property Taxes | Without Mortgage | With Mortgage |
| Less than $800 | 128 (13.2%) | 17 (3.7%) |
| $800 to $1,499 | 14 (1.4%) | 18 (3.9%) |
| $800 to $1,499 | 0 (0.0%) | 33 (7.2%) |
| Total | 973 (100.0%) | 458 (100.0%) |
Health & Disability in Utuado
Health Insurance Coverage by Age in Utuado
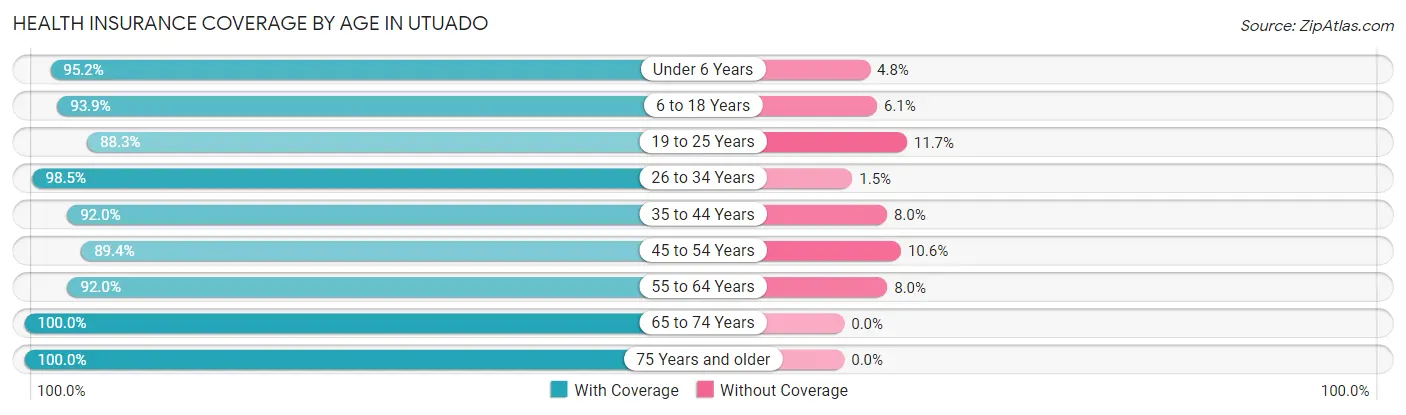
| Age Bracket | With Coverage | Without Coverage |
| Under 6 Years | 416 (95.2%) | 21 (4.8%) |
| 6 to 18 Years | 1,213 (93.9%) | 79 (6.1%) |
| 19 to 25 Years | 507 (88.3%) | 67 (11.7%) |
| 26 to 34 Years | 789 (98.5%) | 12 (1.5%) |
| 35 to 44 Years | 786 (92.0%) | 68 (8.0%) |
| 45 to 54 Years | 736 (89.4%) | 87 (10.6%) |
| 55 to 64 Years | 917 (92.0%) | 80 (8.0%) |
| 65 to 74 Years | 835 (100.0%) | 0 (0.0%) |
| 75 Years and older | 941 (100.0%) | 0 (0.0%) |
| Total | 7,140 (94.5%) | 414 (5.5%) |
Health Insurance Coverage by Citizenship Status in Utuado
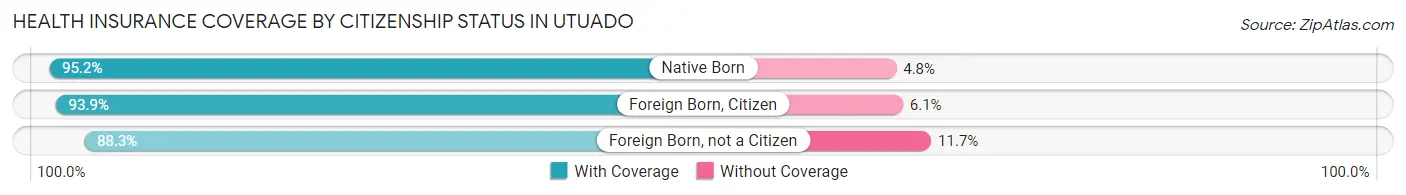
| Citizenship Status | With Coverage | Without Coverage |
| Native Born | 416 (95.2%) | 21 (4.8%) |
| Foreign Born, Citizen | 1,213 (93.9%) | 79 (6.1%) |
| Foreign Born, not a Citizen | 507 (88.3%) | 67 (11.7%) |
Health Insurance Coverage by Household Income in Utuado
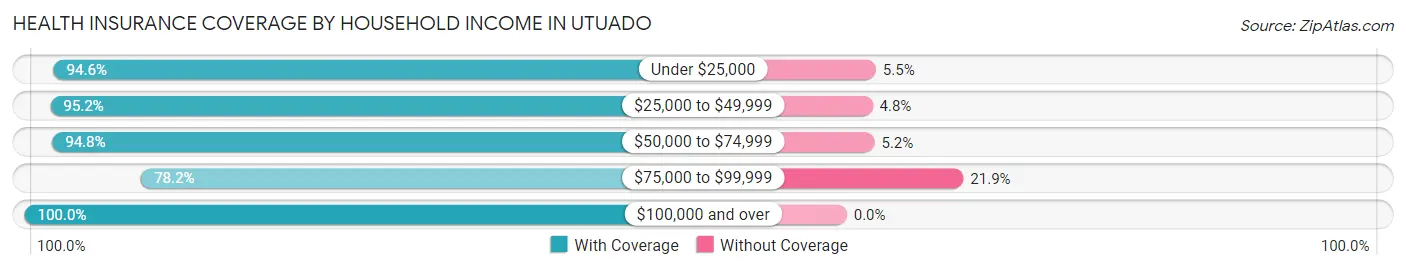
| Household Income | With Coverage | Without Coverage |
| Under $25,000 | 4,669 (94.6%) | 269 (5.4%) |
| $25,000 to $49,999 | 1,043 (95.2%) | 53 (4.8%) |
| $50,000 to $74,999 | 1,076 (94.8%) | 59 (5.2%) |
| $75,000 to $99,999 | 118 (78.1%) | 33 (21.8%) |
| $100,000 and over | 183 (100.0%) | 0 (0.0%) |
Public vs Private Health Insurance Coverage by Age in Utuado
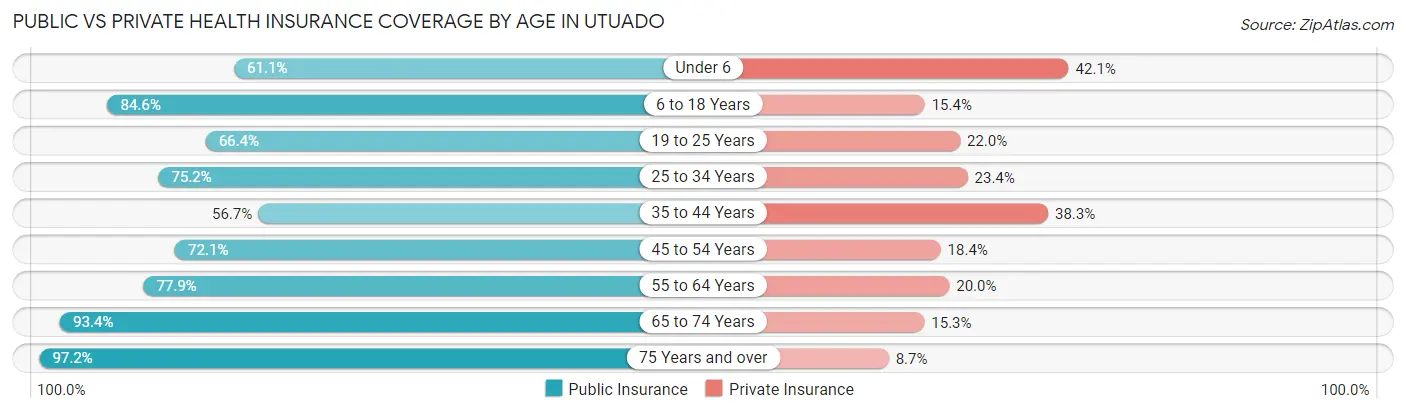
| Age Bracket | Public Insurance | Private Insurance |
| Under 6 | 267 (61.1%) | 184 (42.1%) |
| 6 to 18 Years | 1,093 (84.6%) | 199 (15.4%) |
| 19 to 25 Years | 381 (66.4%) | 126 (22.0%) |
| 25 to 34 Years | 602 (75.2%) | 187 (23.4%) |
| 35 to 44 Years | 484 (56.7%) | 327 (38.3%) |
| 45 to 54 Years | 593 (72.1%) | 151 (18.3%) |
| 55 to 64 Years | 777 (77.9%) | 199 (20.0%) |
| 65 to 74 Years | 780 (93.4%) | 128 (15.3%) |
| 75 Years and over | 915 (97.2%) | 82 (8.7%) |
| Total | 5,892 (78.0%) | 1,583 (21.0%) |
Disability Status by Sex by Age in Utuado
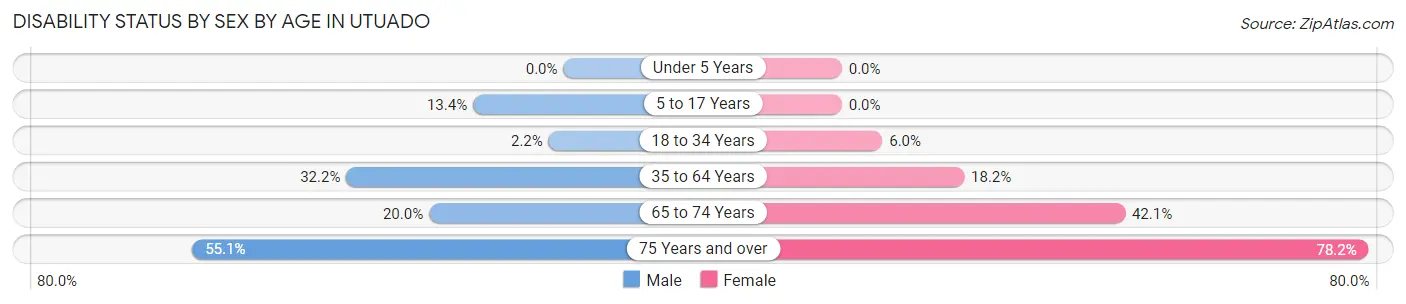
| Age Bracket | Male | Female |
| Under 5 Years | 0 (0.0%) | 0 (0.0%) |
| 5 to 17 Years | 75 (13.4%) | 0 (0.0%) |
| 18 to 34 Years | 17 (2.2%) | 47 (6.0%) |
| 35 to 64 Years | 404 (32.2%) | 258 (18.2%) |
| 65 to 74 Years | 75 (20.0%) | 193 (42.0%) |
| 75 Years and over | 205 (55.1%) | 445 (78.2%) |
Disability Class by Sex by Age in Utuado
Disability Class: Hearing Difficulty

| Age Bracket | Male | Female |
| Under 5 Years | 0 (0.0%) | 0 (0.0%) |
| 5 to 17 Years | 0 (0.0%) | 0 (0.0%) |
| 18 to 34 Years | 14 (1.8%) | 0 (0.0%) |
| 35 to 64 Years | 75 (6.0%) | 33 (2.3%) |
| 65 to 74 Years | 20 (5.3%) | 44 (9.6%) |
| 75 Years and over | 110 (29.6%) | 174 (30.6%) |
Disability Class: Vision Difficulty
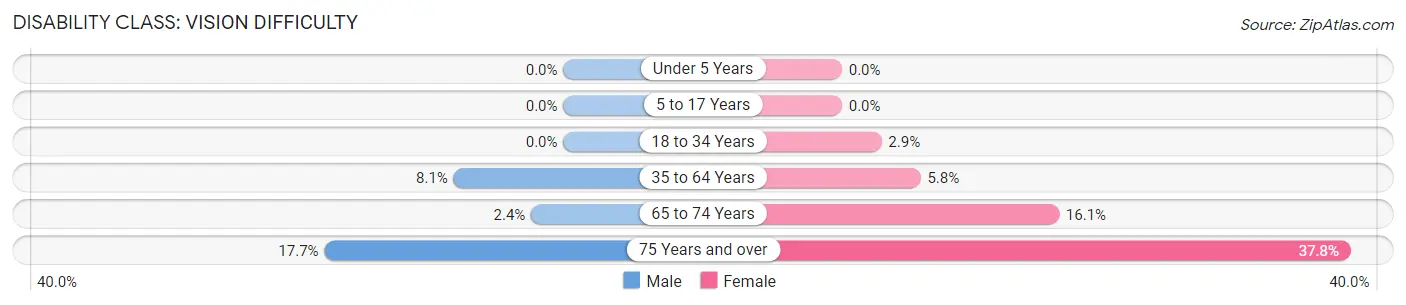
| Age Bracket | Male | Female |
| Under 5 Years | 0 (0.0%) | 0 (0.0%) |
| 5 to 17 Years | 0 (0.0%) | 0 (0.0%) |
| 18 to 34 Years | 0 (0.0%) | 23 (2.9%) |
| 35 to 64 Years | 102 (8.1%) | 83 (5.8%) |
| 65 to 74 Years | 9 (2.4%) | 74 (16.1%) |
| 75 Years and over | 66 (17.7%) | 215 (37.8%) |
Disability Class: Cognitive Difficulty
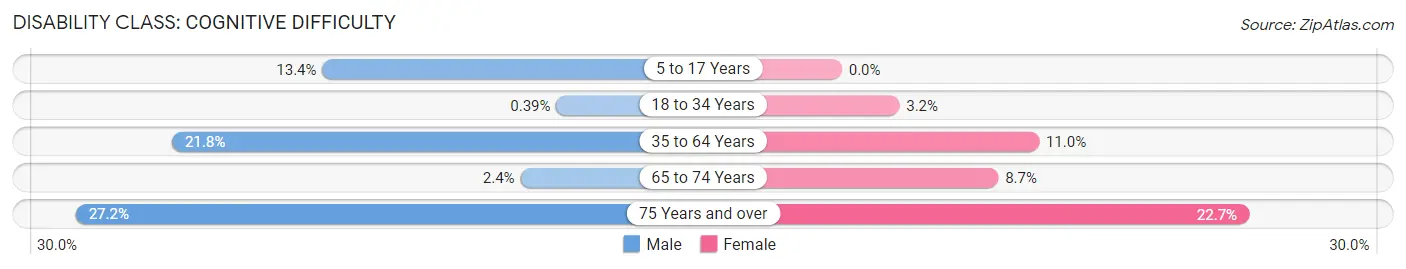
| Age Bracket | Male | Female |
| 5 to 17 Years | 75 (13.4%) | 0 (0.0%) |
| 18 to 34 Years | 3 (0.4%) | 25 (3.2%) |
| 35 to 64 Years | 273 (21.8%) | 156 (11.0%) |
| 65 to 74 Years | 9 (2.4%) | 40 (8.7%) |
| 75 Years and over | 101 (27.2%) | 129 (22.7%) |
Disability Class: Ambulatory Difficulty
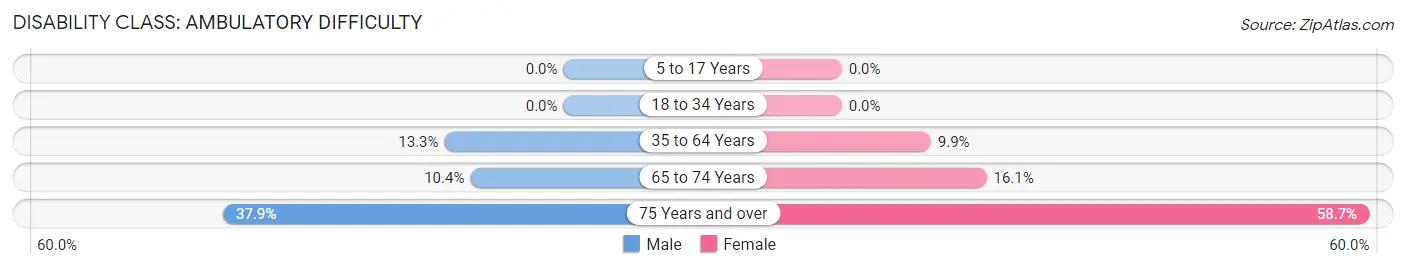
| Age Bracket | Male | Female |
| 5 to 17 Years | 0 (0.0%) | 0 (0.0%) |
| 18 to 34 Years | 0 (0.0%) | 0 (0.0%) |
| 35 to 64 Years | 166 (13.3%) | 141 (9.9%) |
| 65 to 74 Years | 39 (10.4%) | 74 (16.1%) |
| 75 Years and over | 141 (37.9%) | 334 (58.7%) |
Disability Class: Self-Care Difficulty
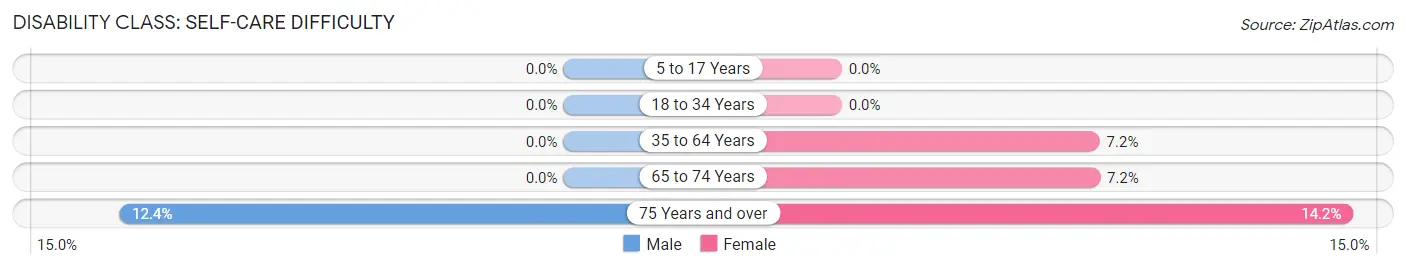
| Age Bracket | Male | Female |
| 5 to 17 Years | 0 (0.0%) | 0 (0.0%) |
| 18 to 34 Years | 0 (0.0%) | 0 (0.0%) |
| 35 to 64 Years | 0 (0.0%) | 102 (7.2%) |
| 65 to 74 Years | 0 (0.0%) | 33 (7.2%) |
| 75 Years and over | 46 (12.4%) | 81 (14.2%) |
Technology Access in Utuado
Computing Device Access in Utuado
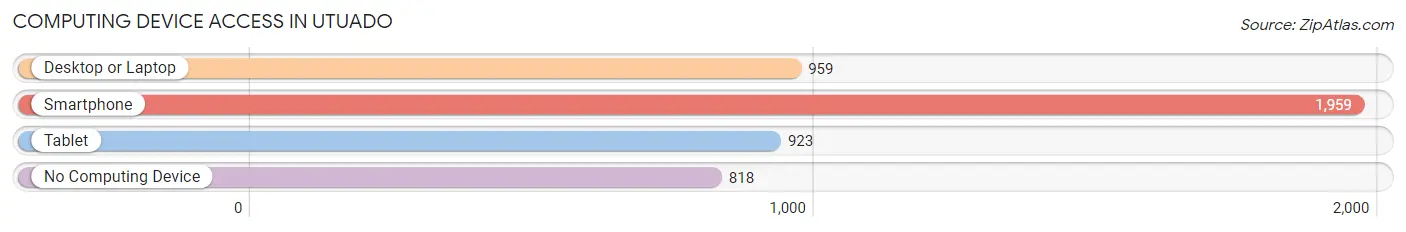
| Device Type | # Households | % Households |
| Desktop or Laptop | 959 | 32.5% |
| Smartphone | 1,959 | 66.4% |
| Tablet | 923 | 31.3% |
| No Computing Device | 818 | 27.7% |
| Total | 2,950 | 100.0% |
Internet Access in Utuado
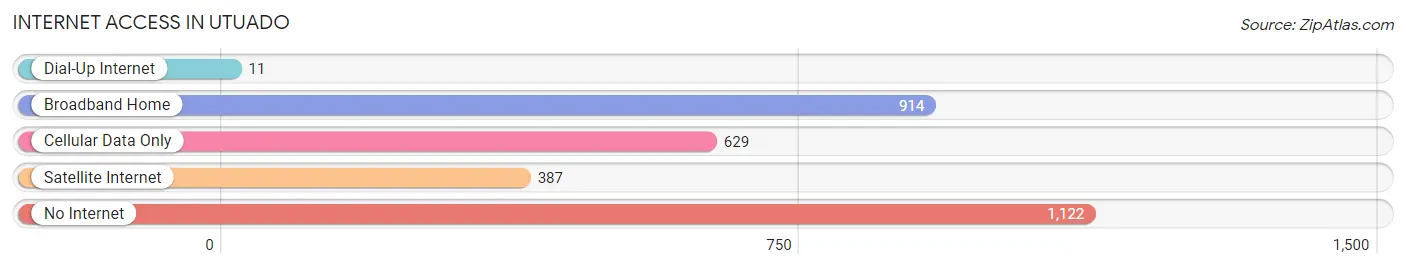
| Internet Type | # Households | % Households |
| Dial-Up Internet | 11 | 0.4% |
| Broadband Home | 914 | 31.0% |
| Cellular Data Only | 629 | 21.3% |
| Satellite Internet | 387 | 13.1% |
| No Internet | 1,122 | 38.0% |
| Total | 2,950 | 100.0% |
Utuado Summary
Utuado is a municipality located in the central mountainous region of Puerto Rico. It is the largest municipality in the island, with a total area of 545.3 square miles. Utuado is bordered by the municipalities of Adjuntas, Jayuya, Lares, Hatillo, and Arecibo. The municipality is divided into 14 barrios, or wards, and is home to a population of approximately 33,000 people.
History
Utuado was founded in 1739 by Spanish settlers, and was originally known as San Antonio de la Tuna. The name was changed to Utuado in 1831, in honor of the indigenous Taíno chief, Utuado. The Taíno people had inhabited the area for centuries prior to the arrival of the Spanish.
Utuado was an important center of the coffee industry in the 19th century, and the town was known as the “Coffee Capital of Puerto Rico.” The town was also the site of the first hydroelectric plant in Puerto Rico, which was built in 1895.
Geography
Utuado is located in the central mountainous region of Puerto Rico, and is the largest municipality in the island. The municipality is bordered by the municipalities of Adjuntas, Jayuya, Lares, Hatillo, and Arecibo. The terrain is mostly mountainous, with elevations ranging from sea level to 3,000 feet. The highest point in the municipality is Cerro de Punta, which is located in the barrio of Punta.
The municipality is divided into 14 barrios, or wards, which are: Anón, Caguana, Caonillas, Ciales, Cidra, Florida, Jayuya, Lares, Maricao, Orocovis, Punta, Sabana Grande, San Sebastián, and Utuado.
Economy
The economy of Utuado is largely based on agriculture, with coffee, plantains, and other fruits and vegetables being the main crops. The municipality is also home to several manufacturing plants, including a pharmaceutical plant and a paper mill. Tourism is also an important part of the economy, with many visitors coming to the area to enjoy the natural beauty of the mountains and rivers.
Demographics
As of the 2010 census, the population of Utuado was 33,068. The population is mostly of mixed European and Taíno descent, with a small percentage of African descent. The majority of the population is Roman Catholic, with a small percentage of other religious affiliations. The median household income in Utuado is $14,845, which is lower than the national average. The unemployment rate in the municipality is also higher than the national average, at 16.2%.
Common Questions
What is Per Capita Income in Utuado?
Per Capita income in Utuado is $9,061.
What is the Median Family Income in Utuado?
Median Family Income in Utuado is $18,487.
What is the Median Household income in Utuado?
Median Household Income in Utuado is $13,474.
What is Income or Wage Gap in Utuado?
Income or Wage Gap in Utuado is 19.9%.
Women in Utuado earn 80.1 cents for every dollar earned by a man.
What is Family Income Deficit in Utuado?
Family Income Deficit in Utuado is $13,023.
Families that are below poverty line in Utuado earn $13,023 less on average than the poverty threshold level.
What is Inequality or Gini Index in Utuado?
Inequality or Gini Index in Utuado is 0.56.
What is the Total Population of Utuado?
Total Population of Utuado is 7,554.
What is the Total Male Population of Utuado?
Total Male Population of Utuado is 3,618.
What is the Total Female Population of Utuado?
Total Female Population of Utuado is 3,936.
What is the Ratio of Males per 100 Females in Utuado?
There are 91.92 Males per 100 Females in Utuado.
What is the Ratio of Females per 100 Males in Utuado?
There are 108.79 Females per 100 Males in Utuado.
What is the Median Population Age in Utuado?
Median Population Age in Utuado is 42.5 Years.
What is the Average Family Size in Utuado
Average Family Size in Utuado is 3.5 People.
What is the Average Household Size in Utuado
Average Household Size in Utuado is 2.5 People.
How Large is the Labor Force in Utuado?
There are 2,455 People in the Labor Forcein in Utuado.
What is the Percentage of People in the Labor Force in Utuado?
39.4% of People are in the Labor Force in Utuado.
What is the Unemployment Rate in Utuado?
Unemployment Rate in Utuado is 34.2%.