Ciales, PR Map & Demographics
Ciales Map
Ciales Overview
$8,722
PER CAPITA INCOME
$25,429
AVG FAMILY INCOME
$19,004
AVG HOUSEHOLD INCOME
0.45
INEQUALITY / GINI INDEX
2,634
TOTAL POPULATION
1,346
MALE POPULATION
1,288
FEMALE POPULATION
104.50
MALES / 100 FEMALES
95.69
FEMALES / 100 MALES
33.7
MEDIAN AGE
3.8
AVG FAMILY SIZE
3.0
AVG HOUSEHOLD SIZE
801
LABOR FORCE [ PEOPLE ]
41.1%
PERCENT IN LABOR FORCE
20.1%
UNEMPLOYMENT RATE
Ciales Zip Codes
Ciales Area Codes
Income in Ciales
Income Overview in Ciales
Per Capita Income in Ciales is $8,722, while median incomes of families and households are $25,429 and $19,004 respectively.
| Characteristic | Number | Measure |
| Per Capita Income | 2,634 | $8,722 |
| Median Family Income | 624 | $25,429 |
| Mean Family Income | 624 | $27,794 |
| Median Household Income | 871 | $19,004 |
| Mean Household Income | 871 | $25,107 |
| Income Deficit | 624 | $0 |
| Wage / Income Gap (%) | 2,634 | 0.00% |
| Wage / Income Gap ($) | 2,634 | 100.00¢ per $1 |
| Gini / Inequality Index | 2,634 | 0.45 |
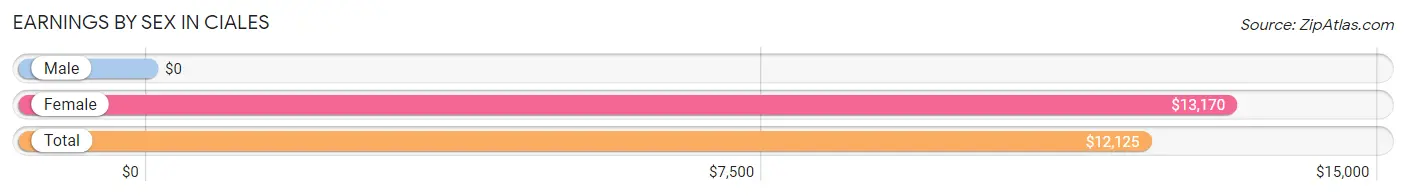
Earnings by Sex in Ciales
| Sex | Number | Average Earnings |
| Male | 373 (50.7%) | $0 |
| Female | 363 (49.3%) | $13,170 |
| Total | 736 (100.0%) | $12,125 |
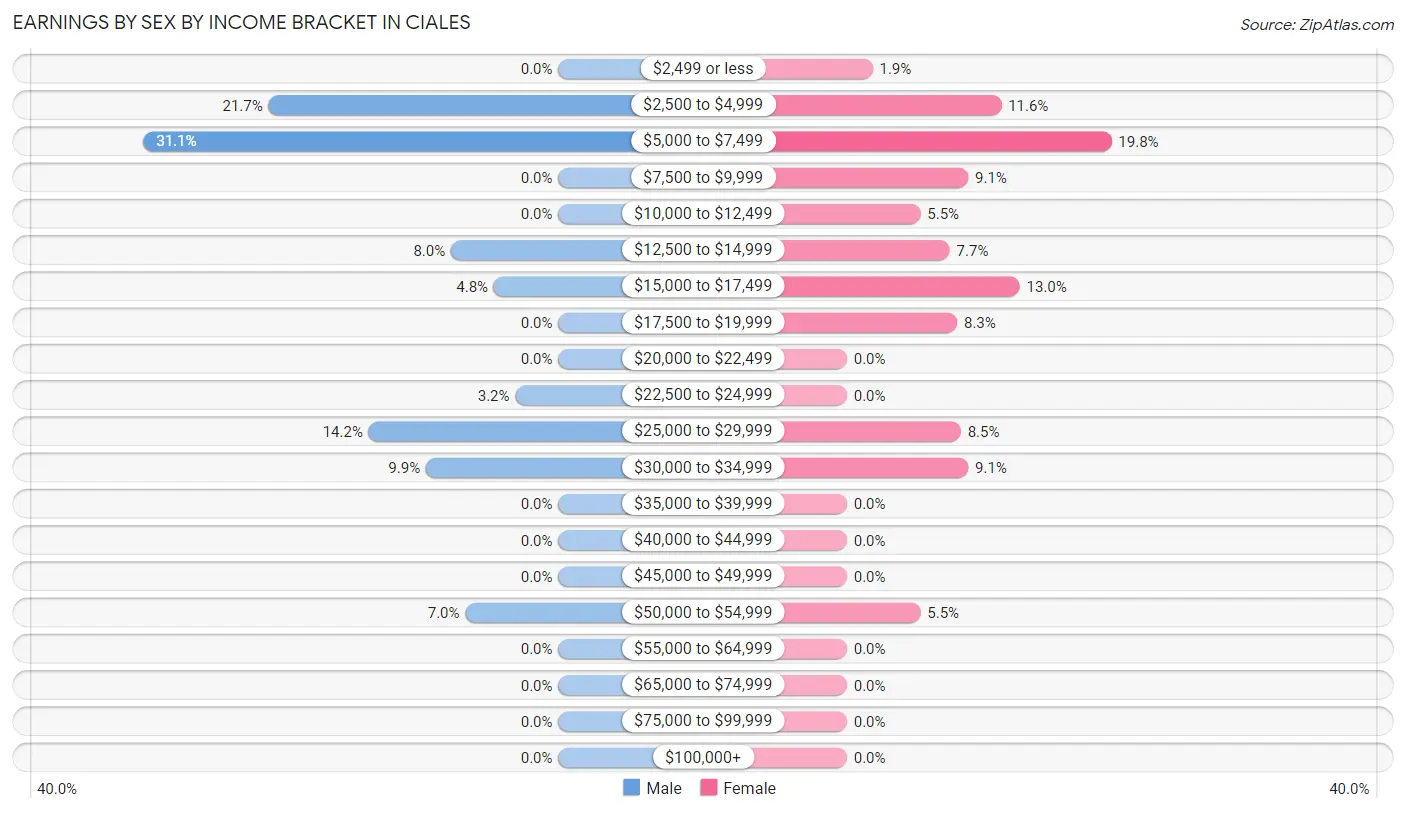
Earnings by Sex by Income Bracket in Ciales
The most common earnings brackets in Ciales are $5,000 to $7,499 for men (116 | 31.1%) and $5,000 to $7,499 for women (72 | 19.8%).
| Income | Male | Female |
| $2,499 or less | 0 (0.0%) | 7 (1.9%) |
| $2,500 to $4,999 | 81 (21.7%) | 42 (11.6%) |
| $5,000 to $7,499 | 116 (31.1%) | 72 (19.8%) |
| $7,500 to $9,999 | 0 (0.0%) | 33 (9.1%) |
| $10,000 to $12,499 | 0 (0.0%) | 20 (5.5%) |
| $12,500 to $14,999 | 30 (8.0%) | 28 (7.7%) |
| $15,000 to $17,499 | 18 (4.8%) | 47 (13.0%) |
| $17,500 to $19,999 | 0 (0.0%) | 30 (8.3%) |
| $20,000 to $22,499 | 0 (0.0%) | 0 (0.0%) |
| $22,500 to $24,999 | 12 (3.2%) | 0 (0.0%) |
| $25,000 to $29,999 | 53 (14.2%) | 31 (8.5%) |
| $30,000 to $34,999 | 37 (9.9%) | 33 (9.1%) |
| $35,000 to $39,999 | 0 (0.0%) | 0 (0.0%) |
| $40,000 to $44,999 | 0 (0.0%) | 0 (0.0%) |
| $45,000 to $49,999 | 0 (0.0%) | 0 (0.0%) |
| $50,000 to $54,999 | 26 (7.0%) | 20 (5.5%) |
| $55,000 to $64,999 | 0 (0.0%) | 0 (0.0%) |
| $65,000 to $74,999 | 0 (0.0%) | 0 (0.0%) |
| $75,000 to $99,999 | 0 (0.0%) | 0 (0.0%) |
| $100,000+ | 0 (0.0%) | 0 (0.0%) |
| Total | 373 (100.0%) | 363 (100.0%) |
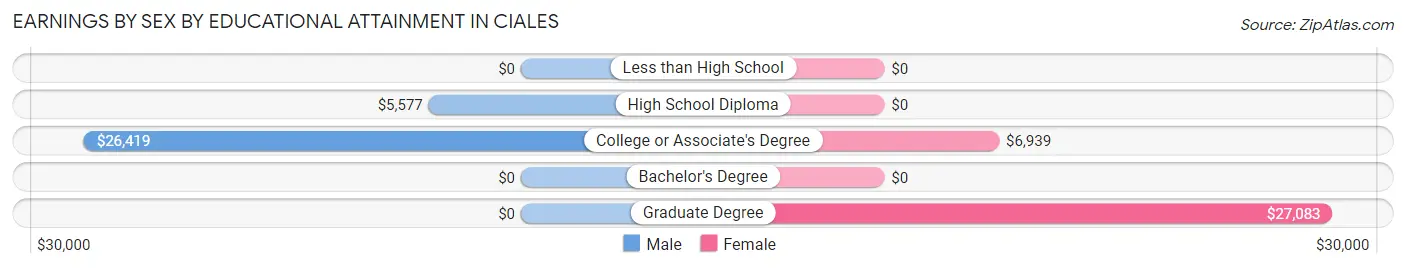
Earnings by Sex by Educational Attainment in Ciales
| Educational Attainment | Male Income | Female Income |
| Less than High School | - | - |
| High School Diploma | $5,577 | $0 |
| College or Associate's Degree | $26,419 | $6,939 |
| Bachelor's Degree | - | - |
| Graduate Degree | - | - |
| Total | - | - |
Family Income in Ciales
Family Income Brackets in Ciales
According to the Ciales family income data, there are 154 families falling into the $25,000 to $34,999 income range, which is the most common income bracket and makes up 24.7% of all families.
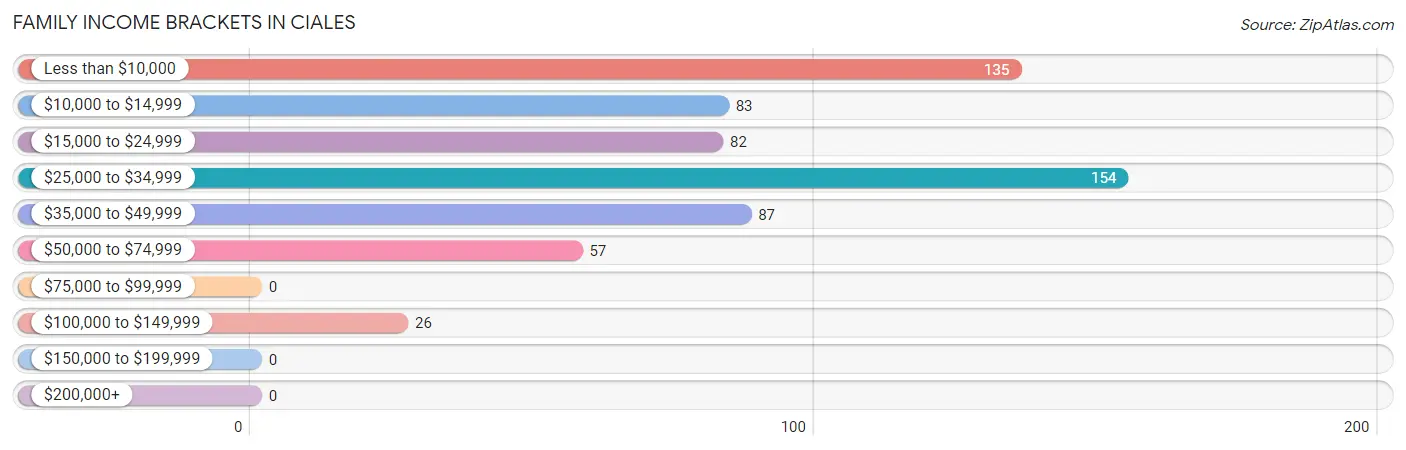
| Income Bracket | # Families | % Families |
| Less than $10,000 | 135 | 21.6% |
| $10,000 to $14,999 | 83 | 13.3% |
| $15,000 to $24,999 | 82 | 13.1% |
| $25,000 to $34,999 | 154 | 24.7% |
| $35,000 to $49,999 | 87 | 13.9% |
| $50,000 to $74,999 | 57 | 9.1% |
| $75,000 to $99,999 | 0 | 0.0% |
| $100,000 to $149,999 | 26 | 4.2% |
| $150,000 to $199,999 | 0 | 0.0% |
| $200,000+ | 0 | 0.0% |
Family Income by Famaliy Size in Ciales
4-person families (112 | 17.9%) account for the highest median family income in Ciales with $37,794 per family, while 2-person families (199 | 31.9%) have the highest median income of $14,398 per family member.
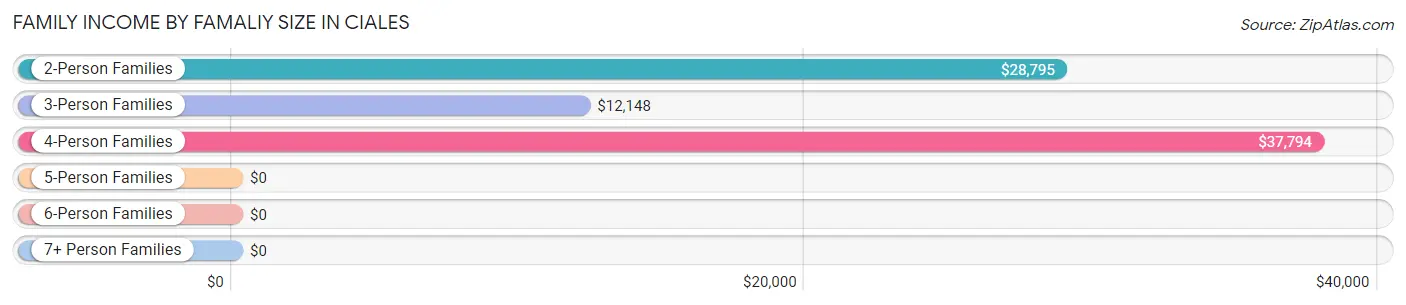
| Income Bracket | # Families | Median Income |
| 2-Person Families | 199 (31.9%) | $28,795 |
| 3-Person Families | 205 (32.9%) | $12,148 |
| 4-Person Families | 112 (17.9%) | $37,794 |
| 5-Person Families | 108 (17.3%) | $0 |
| 6-Person Families | 0 (0.0%) | $0 |
| 7+ Person Families | 0 (0.0%) | $0 |
| Total | 624 (100.0%) | $25,429 |
Family Income by Number of Earners in Ciales
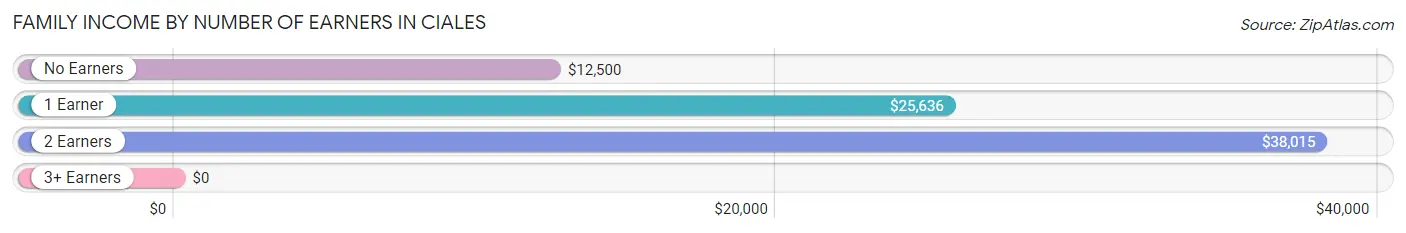
| Number of Earners | # Families | Median Income |
| No Earners | 220 (35.3%) | $12,500 |
| 1 Earner | 260 (41.7%) | $25,636 |
| 2 Earners | 106 (17.0%) | $38,015 |
| 3+ Earners | 38 (6.1%) | $0 |
| Total | 624 (100.0%) | $25,429 |
Household Income in Ciales
Household Income Brackets in Ciales
With 203 households falling in the category, the less than $10,000 income range is the most frequent in Ciales, accounting for 23.3% of all households.
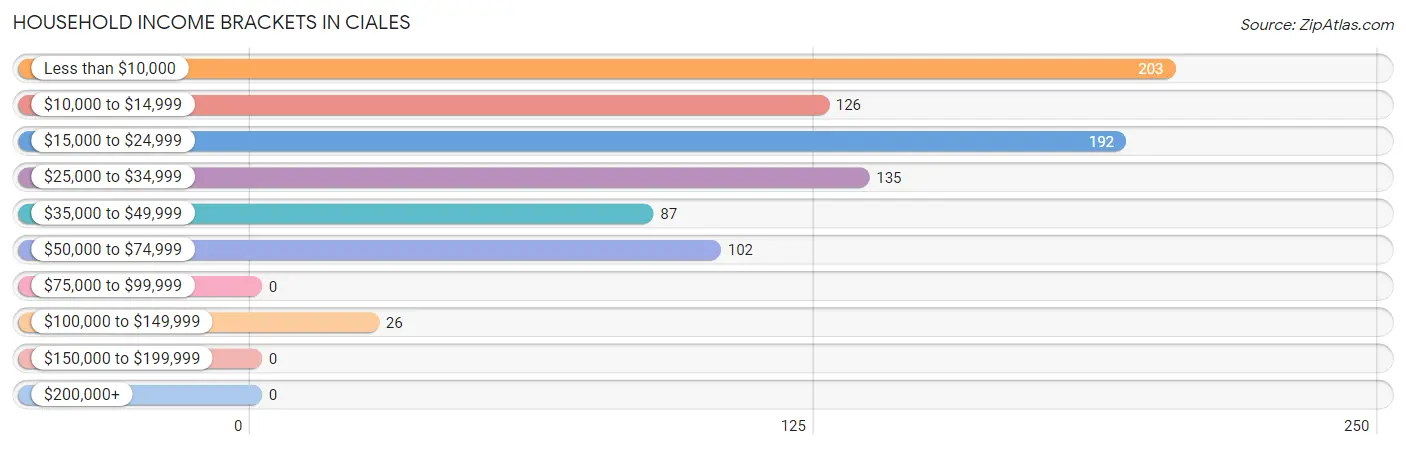
| Income Bracket | # Households | % Households |
| Less than $10,000 | 203 | 23.3% |
| $10,000 to $14,999 | 126 | 14.5% |
| $15,000 to $24,999 | 192 | 22.0% |
| $25,000 to $34,999 | 135 | 15.5% |
| $35,000 to $49,999 | 87 | 10.0% |
| $50,000 to $74,999 | 102 | 11.7% |
| $75,000 to $99,999 | 0 | 0.0% |
| $100,000 to $149,999 | 26 | 3.0% |
| $150,000 to $199,999 | 0 | 0.0% |
| $200,000+ | 0 | 0.0% |
Household Income by Householder Age in Ciales
The median household income in Ciales is $19,004, with the highest median household income of $28,083 found in the 45 to 64 years age bracket for the primary householder. A total of 195 households (22.4%) fall into this category. Meanwhile, the 15 to 24 years age bracket for the primary householder has the lowest median household income of $0, with 22 households (2.5%) in this group.
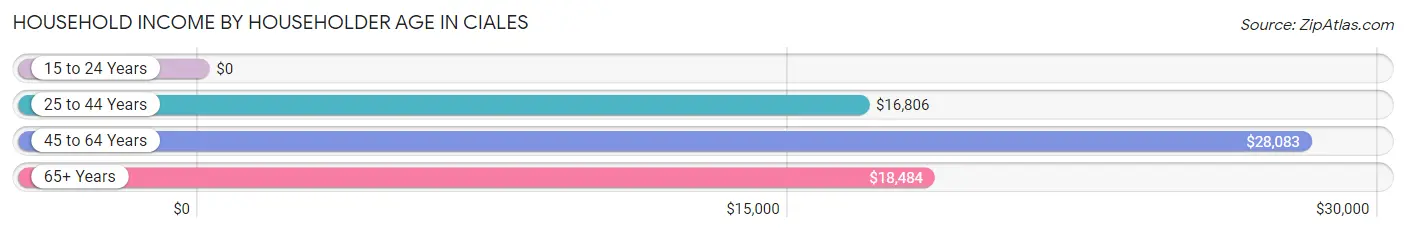
| Income Bracket | # Households | Median Income |
| 15 to 24 Years | 22 (2.5%) | $0 |
| 25 to 44 Years | 287 (33.0%) | $16,806 |
| 45 to 64 Years | 195 (22.4%) | $28,083 |
| 65+ Years | 367 (42.1%) | $18,484 |
| Total | 871 (100.0%) | $19,004 |
Poverty in Ciales
Income Below Poverty by Sex and Age in Ciales
With 45.2% poverty level for males and 68.5% for females among the residents of Ciales, 6 to 11 year old males and under 5 year old females are the most vulnerable to poverty, with 108 males (83.7%) and 108 females (100.0%) in their respective age groups living below the poverty level.
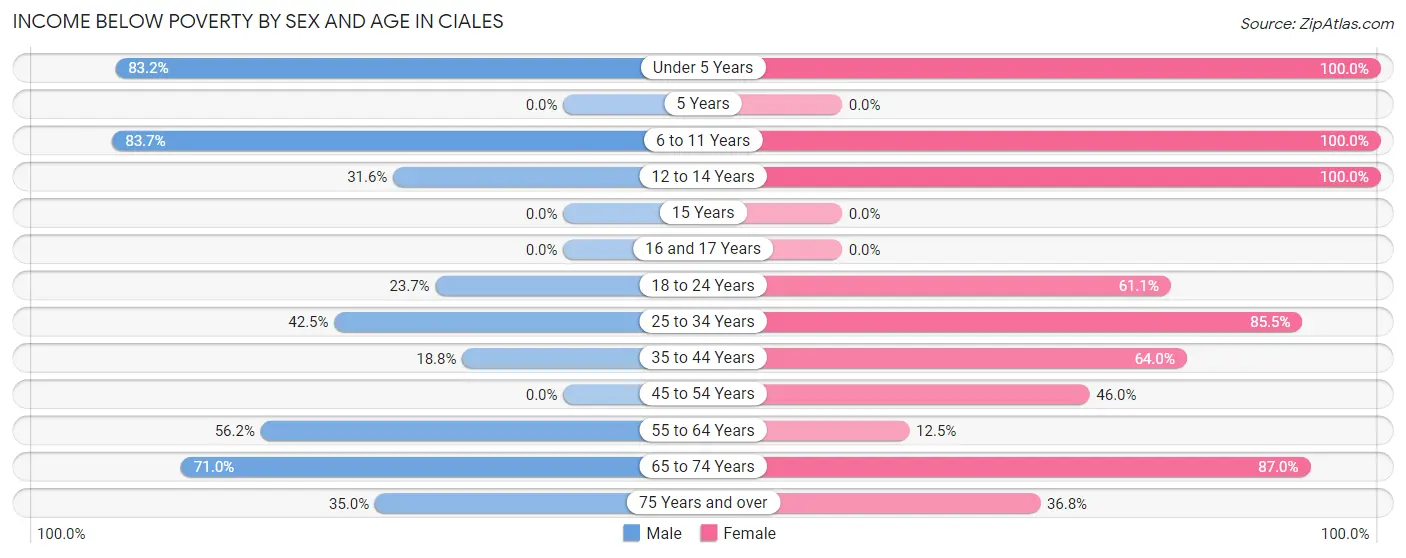
| Age Bracket | Male | Female |
| Under 5 Years | 84 (83.2%) | 108 (100.0%) |
| 5 Years | 0 (0.0%) | 0 (0.0%) |
| 6 to 11 Years | 108 (83.7%) | 135 (100.0%) |
| 12 to 14 Years | 30 (31.6%) | 49 (100.0%) |
| 15 Years | 0 (0.0%) | 0 (0.0%) |
| 16 and 17 Years | 0 (0.0%) | 0 (0.0%) |
| 18 to 24 Years | 52 (23.7%) | 58 (61.1%) |
| 25 to 34 Years | 51 (42.5%) | 159 (85.5%) |
| 35 to 44 Years | 18 (18.8%) | 121 (64.0%) |
| 45 to 54 Years | 0 (0.0%) | 34 (46.0%) |
| 55 to 64 Years | 91 (56.2%) | 9 (12.5%) |
| 65 to 74 Years | 137 (71.0%) | 120 (87.0%) |
| 75 Years and over | 36 (34.9%) | 89 (36.8%) |
| Total | 607 (45.2%) | 882 (68.5%) |
Income Above Poverty by Sex and Age in Ciales
According to the poverty statistics in Ciales, males aged 15 years and females aged 55 to 64 years are the age groups that are most secure financially, with 100.0% of males and 87.5% of females in these age groups living above the poverty line.
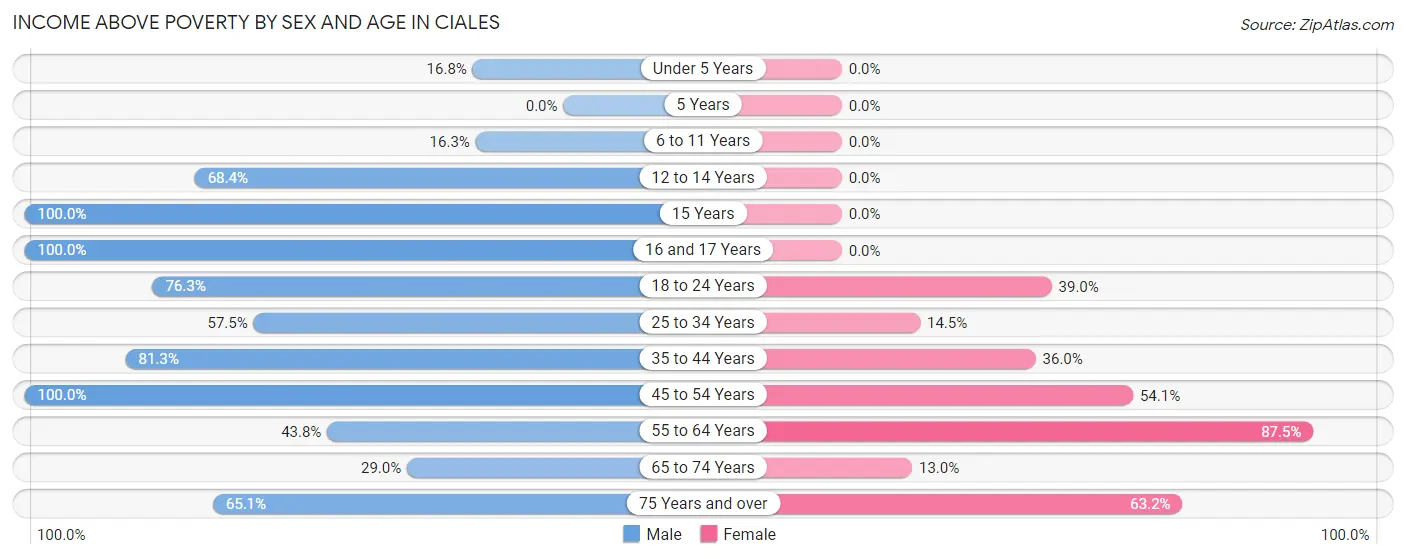
| Age Bracket | Male | Female |
| Under 5 Years | 17 (16.8%) | 0 (0.0%) |
| 5 Years | 0 (0.0%) | 0 (0.0%) |
| 6 to 11 Years | 21 (16.3%) | 0 (0.0%) |
| 12 to 14 Years | 65 (68.4%) | 0 (0.0%) |
| 15 Years | 68 (100.0%) | 0 (0.0%) |
| 16 and 17 Years | 20 (100.0%) | 0 (0.0%) |
| 18 to 24 Years | 167 (76.3%) | 37 (39.0%) |
| 25 to 34 Years | 69 (57.5%) | 27 (14.5%) |
| 35 to 44 Years | 78 (81.2%) | 68 (36.0%) |
| 45 to 54 Years | 38 (100.0%) | 40 (54.0%) |
| 55 to 64 Years | 71 (43.8%) | 63 (87.5%) |
| 65 to 74 Years | 56 (29.0%) | 18 (13.0%) |
| 75 Years and over | 67 (65.0%) | 153 (63.2%) |
| Total | 737 (54.8%) | 406 (31.5%) |
Income Below Poverty Among Married-Couple Families in Ciales
The poverty statistics for married-couple families in Ciales show that 42.2% or 124 of the total 294 families live below the poverty line. Families with 3 or 4 children have the highest poverty rate of 100.0%, comprising of 45 families. On the other hand, families with no children have the lowest poverty rate of 11.6%, which includes 20 families.
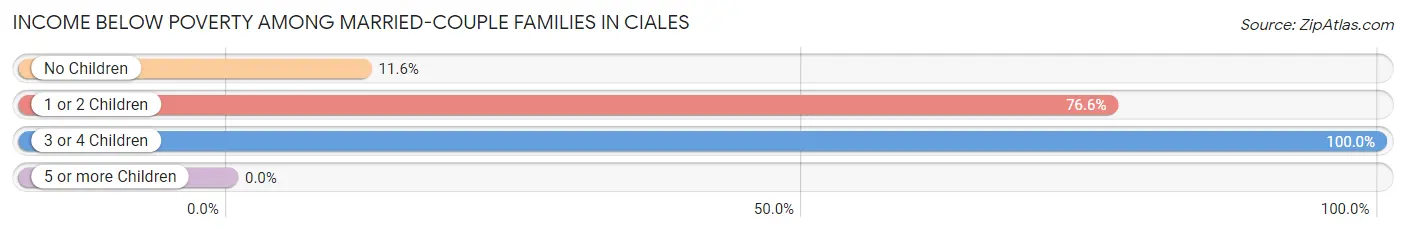
| Children | Above Poverty | Below Poverty |
| No Children | 152 (88.4%) | 20 (11.6%) |
| 1 or 2 Children | 18 (23.4%) | 59 (76.6%) |
| 3 or 4 Children | 0 (0.0%) | 45 (100.0%) |
| 5 or more Children | 0 (0.0%) | 0 (0.0%) |
| Total | 170 (57.8%) | 124 (42.2%) |
Income Below Poverty Among Single-Parent Households in Ciales
According to the poverty data in Ciales, 65.2% or 30 single-father households and 67.2% or 191 single-mother households are living below the poverty line. Among single-father households, those with no children have the highest poverty rate, with 30 households (100.0%) experiencing poverty. Likewise, among single-mother households, those with 3 or 4 children have the highest poverty rate, with 21 households (100.0%) falling below the poverty line.
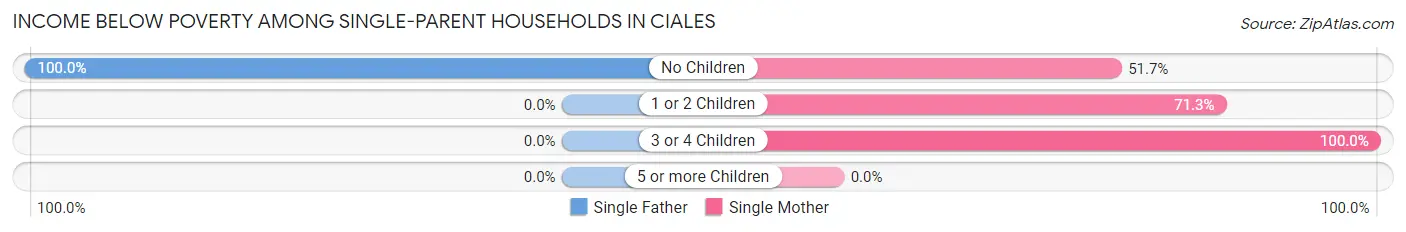
| Children | Single Father | Single Mother |
| No Children | 30 (100.0%) | 46 (51.7%) |
| 1 or 2 Children | 0 (0.0%) | 124 (71.3%) |
| 3 or 4 Children | 0 (0.0%) | 21 (100.0%) |
| 5 or more Children | 0 (0.0%) | 0 (0.0%) |
| Total | 30 (65.2%) | 191 (67.2%) |
Income Below Poverty Among Married-Couple vs Single-Parent Households in Ciales
The poverty data for Ciales shows that 124 of the married-couple family households (42.2%) and 221 of the single-parent households (67.0%) are living below the poverty level. Within the married-couple family households, those with 3 or 4 children have the highest poverty rate, with 45 households (100.0%) falling below the poverty line. Among the single-parent households, those with 3 or 4 children have the highest poverty rate, with 21 household (100.0%) living below poverty.
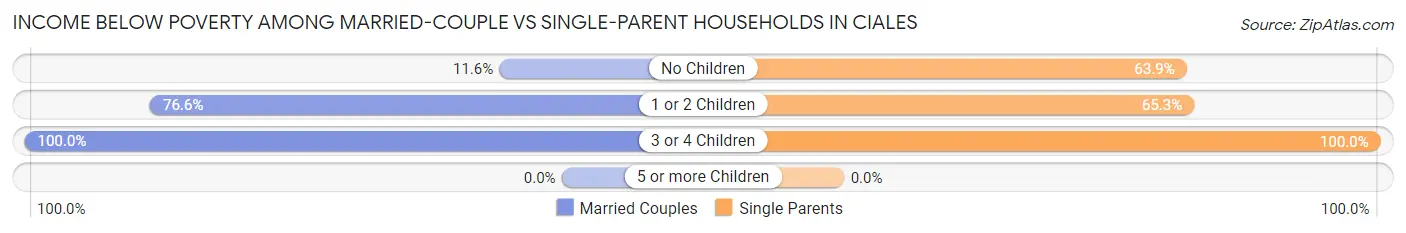
| Children | Married-Couple Families | Single-Parent Households |
| No Children | 20 (11.6%) | 76 (63.9%) |
| 1 or 2 Children | 59 (76.6%) | 124 (65.3%) |
| 3 or 4 Children | 45 (100.0%) | 21 (100.0%) |
| 5 or more Children | 0 (0.0%) | 0 (0.0%) |
| Total | 124 (42.2%) | 221 (67.0%) |
Race in Ciales
The most populous races in Ciales are Hispanic or Latino (2,602 | 98.8%), White / Caucasian (1,183 | 44.9%), and Two or more Races (1,063 | 40.4%).
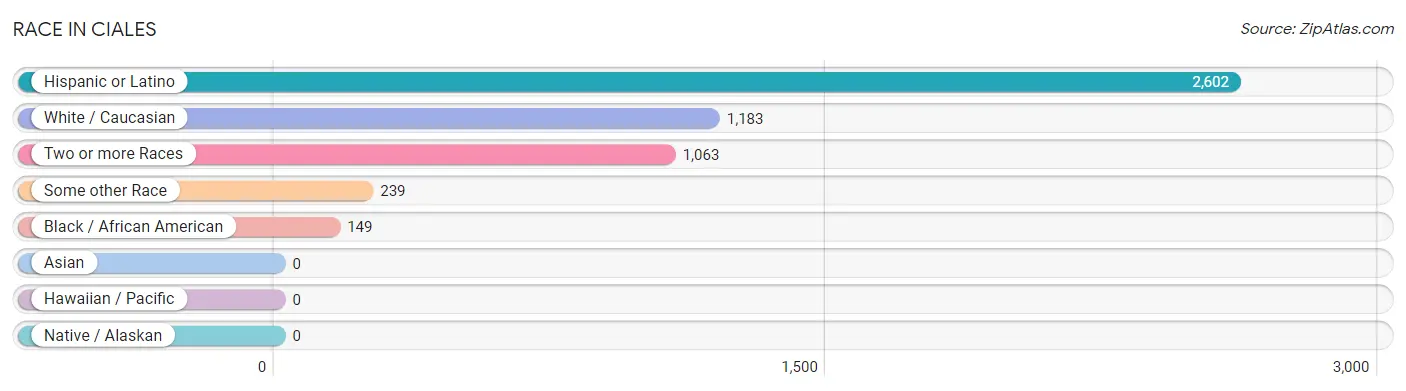
| Race | # Population | % Population |
| Asian | 0 | 0.0% |
| Black / African American | 149 | 5.7% |
| Hawaiian / Pacific | 0 | 0.0% |
| Hispanic or Latino | 2,602 | 98.8% |
| Native / Alaskan | 0 | 0.0% |
| White / Caucasian | 1,183 | 44.9% |
| Two or more Races | 1,063 | 40.4% |
| Some other Race | 239 | 9.1% |
| Total | 2,634 | 100.0% |
Ancestry in Ciales
The most populous ancestries reported in Ciales are Puerto Rican (2,553 | 96.9%), Central American Indian (32 | 1.2%), Mexican (24 | 0.9%), Dominican (15 | 0.6%), and American (10 | 0.4%), together accounting for 100.0% of all Ciales residents.
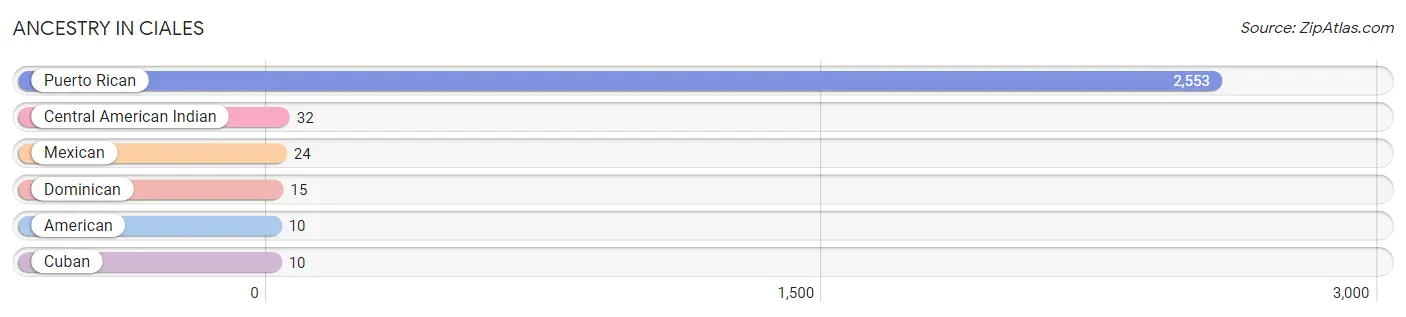
| Ancestry | # Population | % Population |
| American | 10 | 0.4% |
| Central American Indian | 32 | 1.2% |
| Cuban | 10 | 0.4% |
| Dominican | 15 | 0.6% |
| Mexican | 24 | 0.9% |
| Puerto Rican | 2,553 | 96.9% | View All 6 Rows |
Immigrants in Ciales

| Immigration Origin | # Population | % Population | View All 0 Rows |
Sex and Age in Ciales
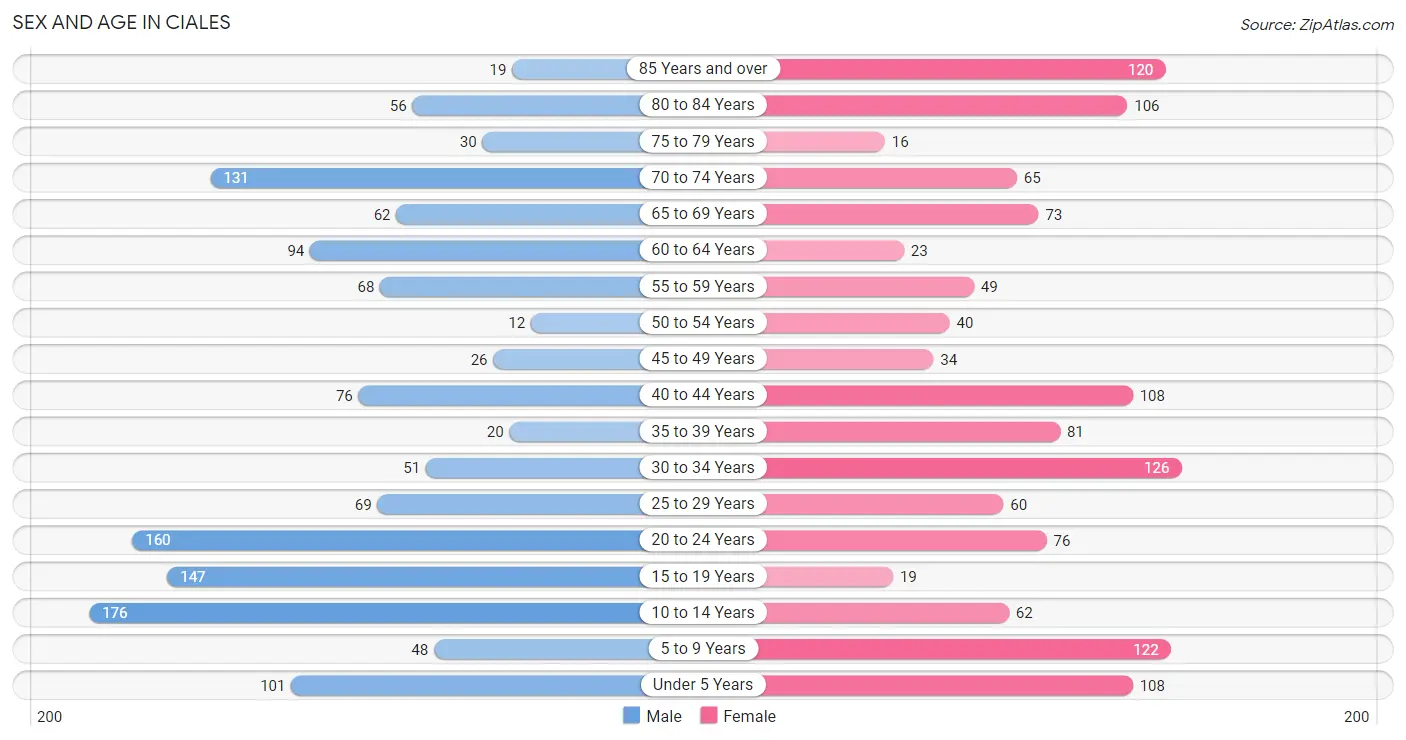
Sex and Age in Ciales
The most populous age groups in Ciales are 10 to 14 Years (176 | 13.1%) for men and 30 to 34 Years (126 | 9.8%) for women.
| Age Bracket | Male | Female |
| Under 5 Years | 101 (7.5%) | 108 (8.4%) |
| 5 to 9 Years | 48 (3.6%) | 122 (9.5%) |
| 10 to 14 Years | 176 (13.1%) | 62 (4.8%) |
| 15 to 19 Years | 147 (10.9%) | 19 (1.5%) |
| 20 to 24 Years | 160 (11.9%) | 76 (5.9%) |
| 25 to 29 Years | 69 (5.1%) | 60 (4.7%) |
| 30 to 34 Years | 51 (3.8%) | 126 (9.8%) |
| 35 to 39 Years | 20 (1.5%) | 81 (6.3%) |
| 40 to 44 Years | 76 (5.7%) | 108 (8.4%) |
| 45 to 49 Years | 26 (1.9%) | 34 (2.6%) |
| 50 to 54 Years | 12 (0.9%) | 40 (3.1%) |
| 55 to 59 Years | 68 (5.1%) | 49 (3.8%) |
| 60 to 64 Years | 94 (7.0%) | 23 (1.8%) |
| 65 to 69 Years | 62 (4.6%) | 73 (5.7%) |
| 70 to 74 Years | 131 (9.7%) | 65 (5.1%) |
| 75 to 79 Years | 30 (2.2%) | 16 (1.2%) |
| 80 to 84 Years | 56 (4.2%) | 106 (8.2%) |
| 85 Years and over | 19 (1.4%) | 120 (9.3%) |
| Total | 1,346 (100.0%) | 1,288 (100.0%) |
Families and Households in Ciales
Median Family Size in Ciales
The median family size in Ciales is 3.77 persons per family, with single male/father families (46 | 7.4%) accounting for the largest median family size of 4.74 persons per family. On the other hand, single female/mother families (284 | 45.5%) represent the smallest median family size with 3.60 persons per family.
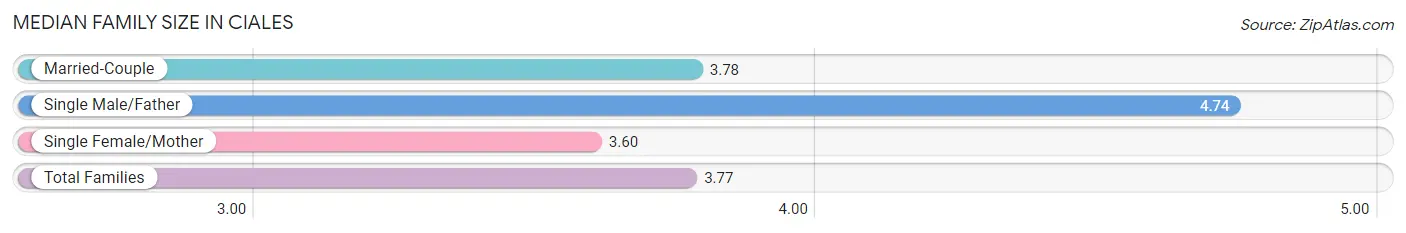
| Family Type | # Families | Family Size |
| Married-Couple | 294 (47.1%) | 3.78 |
| Single Male/Father | 46 (7.4%) | 4.74 |
| Single Female/Mother | 284 (45.5%) | 3.60 |
| Total Families | 624 (100.0%) | 3.77 |
Median Household Size in Ciales
The median household size in Ciales is 3.02 persons per household, with single male/father households (46 | 5.3%) accounting for the largest median household size of 4.74 persons per household. non-family households (247 | 28.4%) represent the smallest median household size with 1.09 persons per household.
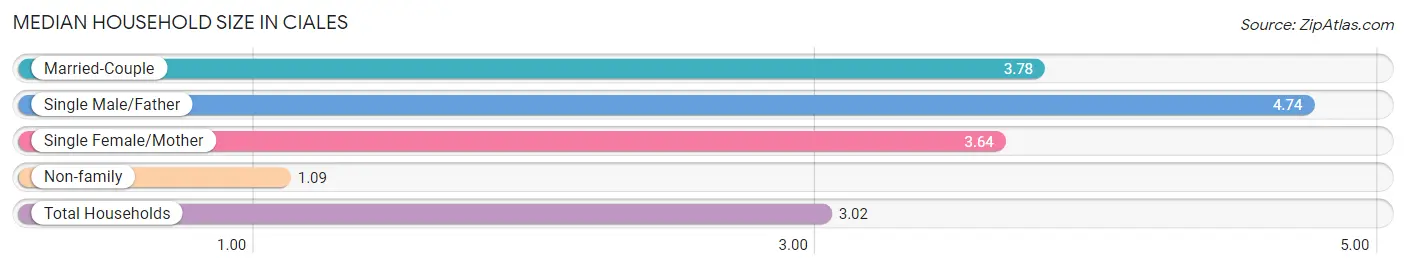
| Household Type | # Households | Household Size |
| Married-Couple | 294 (33.8%) | 3.78 |
| Single Male/Father | 46 (5.3%) | 4.74 |
| Single Female/Mother | 284 (32.6%) | 3.64 |
| Non-family | 247 (28.4%) | 1.09 |
| Total Households | 871 (100.0%) | 3.02 |
Household Size by Marriage Status in Ciales
Out of a total of 871 households in Ciales, 624 (71.6%) are family households, while 247 (28.4%) are nonfamily households. The most numerous type of family households are 2-person households, comprising 199, and the most common type of nonfamily households are 1-person households, comprising 225.
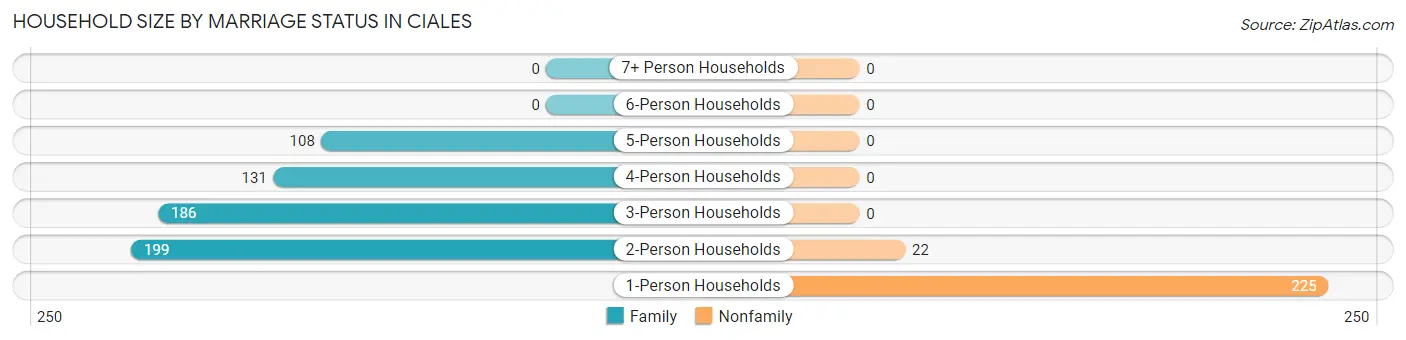
| Household Size | Family Households | Nonfamily Households |
| 1-Person Households | - | 225 (25.8%) |
| 2-Person Households | 199 (22.9%) | 22 (2.5%) |
| 3-Person Households | 186 (21.3%) | 0 (0.0%) |
| 4-Person Households | 131 (15.0%) | 0 (0.0%) |
| 5-Person Households | 108 (12.4%) | 0 (0.0%) |
| 6-Person Households | 0 (0.0%) | 0 (0.0%) |
| 7+ Person Households | 0 (0.0%) | 0 (0.0%) |
| Total | 624 (71.6%) | 247 (28.4%) |
Female Fertility in Ciales
Fertility by Age in Ciales
Average fertility rate in Ciales is 116.0 births per 1,000 women. Women in the age bracket of 20 to 34 years have the highest fertility rate with 240.0 births per 1,000 women. Women in the age bracket of 20 to 34 years acount for 100.0% of all women with births.
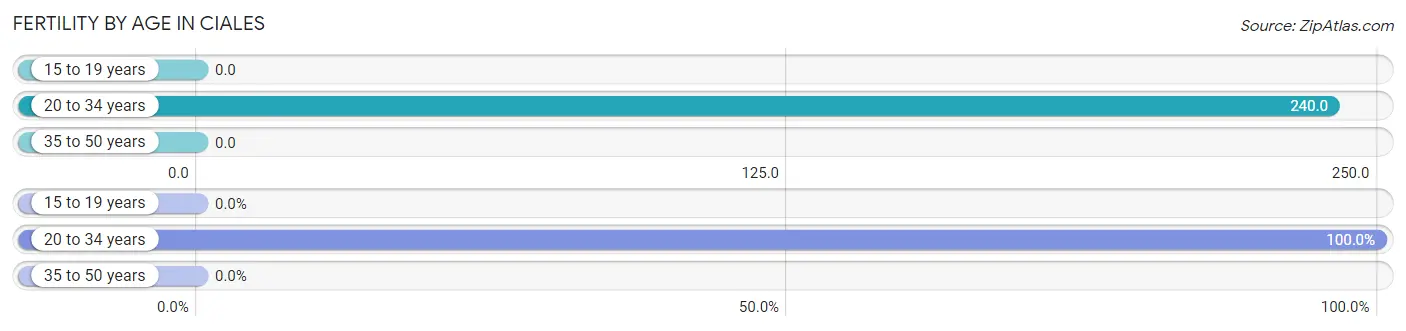
| Age Bracket | Women with Births | Births / 1,000 Women |
| 15 to 19 years | 0 (0.0%) | 0.0 |
| 20 to 34 years | 63 (100.0%) | 240.0 |
| 35 to 50 years | 0 (0.0%) | 0.0 |
| Total | 63 (100.0%) | 116.0 |
Fertility by Age by Marriage Status in Ciales
71.4% of women with births (63) in Ciales are married. The highest percentage of unmarried women with births falls into 20 to 34 years age bracket with 28.6% of them unmarried at the time of birth, while the lowest percentage of unmarried women with births belong to 20 to 34 years age bracket with 28.6% of them unmarried.
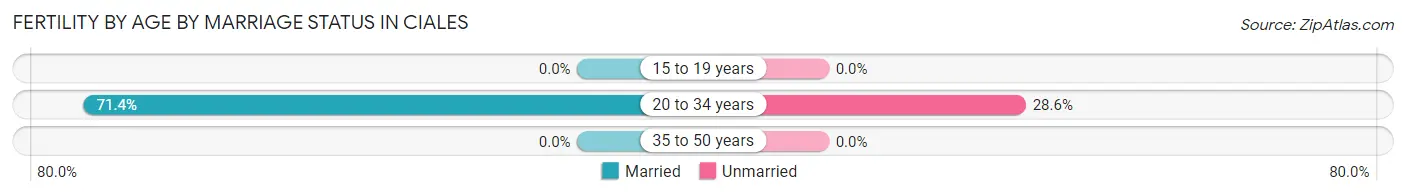
| Age Bracket | Married | Unmarried |
| 15 to 19 years | 0 (0.0%) | 0 (0.0%) |
| 20 to 34 years | 45 (71.4%) | 18 (28.6%) |
| 35 to 50 years | 0 (0.0%) | 0 (0.0%) |
| Total | 45 (71.4%) | 18 (28.6%) |
Fertility by Education in Ciales
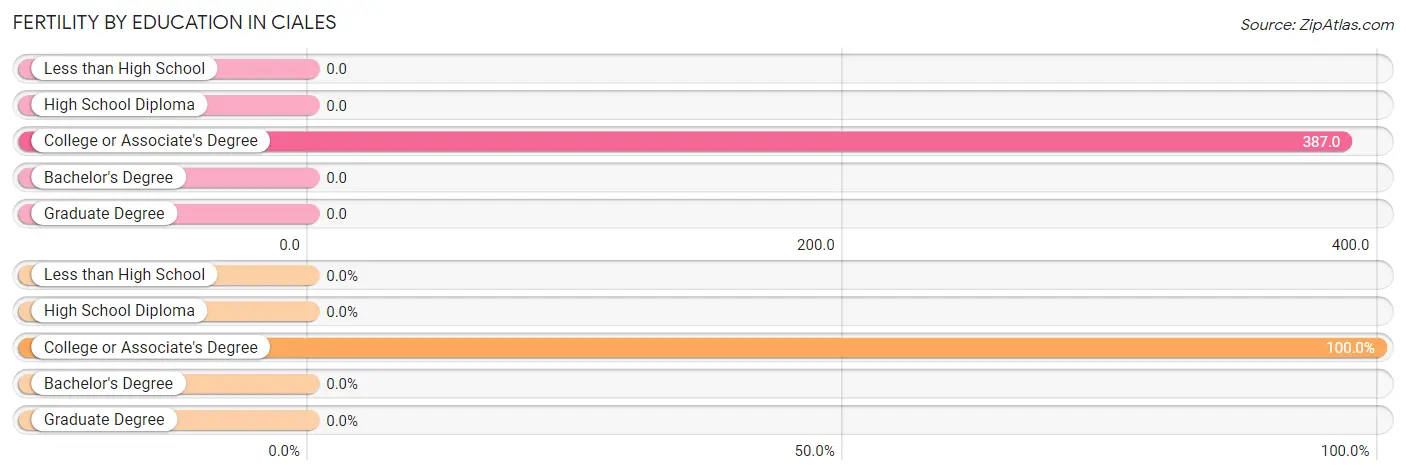
| Educational Attainment | Women with Births | Births / 1,000 Women |
| Less than High School | 0 (0.0%) | 0.0 |
| High School Diploma | 0 (0.0%) | 0.0 |
| College or Associate's Degree | 63 (100.0%) | 387.0 |
| Bachelor's Degree | 0 (0.0%) | 0.0 |
| Graduate Degree | 0 (0.0%) | 0.0 |
| Total | 63 (100.0%) | 116.0 |
Fertility by Education by Marriage Status in Ciales
28.6% of women with births in Ciales are unmarried. Women with the educational attainment of college or associate's degree are most likely to be married with 71.4% of them married at childbirth, while women with the educational attainment of college or associate's degree are least likely to be married with 28.6% of them unmarried at childbirth.
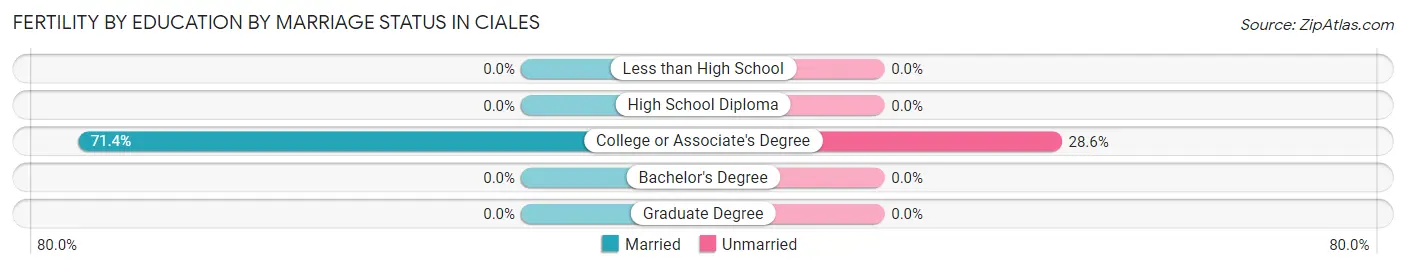
| Educational Attainment | Married | Unmarried |
| Less than High School | 0 (0.0%) | 0 (0.0%) |
| High School Diploma | 0 (0.0%) | 0 (0.0%) |
| College or Associate's Degree | 45 (71.4%) | 18 (28.6%) |
| Bachelor's Degree | 0 (0.0%) | 0 (0.0%) |
| Graduate Degree | 0 (0.0%) | 0 (0.0%) |
| Total | 45 (71.4%) | 18 (28.6%) |
Employment Characteristics in Ciales
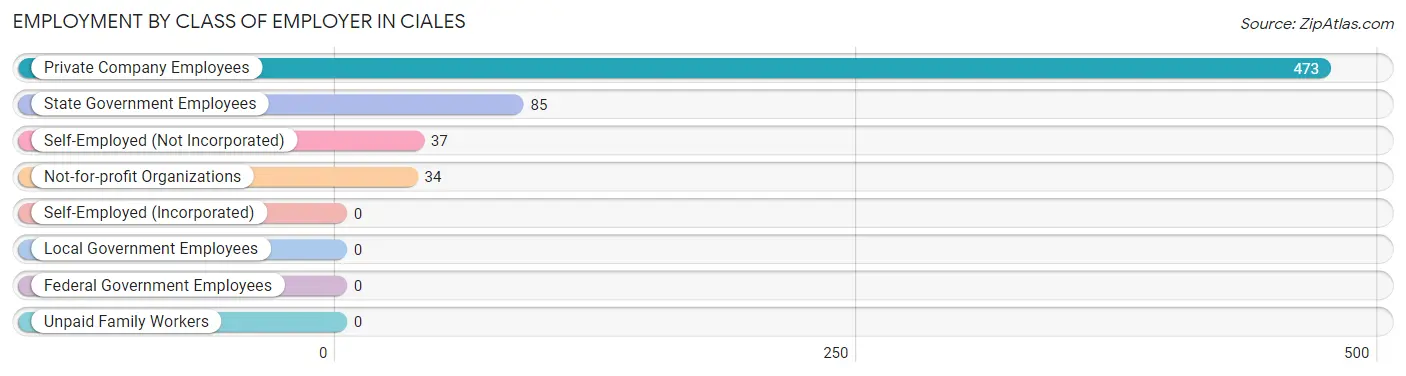
Employment by Class of Employer in Ciales
Among the 629 employed individuals in Ciales, private company employees (473 | 75.2%), state government employees (85 | 13.5%), and self-employed (not incorporated) (37 | 5.9%) make up the most common classes of employment.
| Employer Class | # Employees | % Employees |
| Private Company Employees | 473 | 75.2% |
| Self-Employed (Incorporated) | 0 | 0.0% |
| Self-Employed (Not Incorporated) | 37 | 5.9% |
| Not-for-profit Organizations | 34 | 5.4% |
| Local Government Employees | 0 | 0.0% |
| State Government Employees | 85 | 13.5% |
| Federal Government Employees | 0 | 0.0% |
| Unpaid Family Workers | 0 | 0.0% |
| Total | 629 | 100.0% |
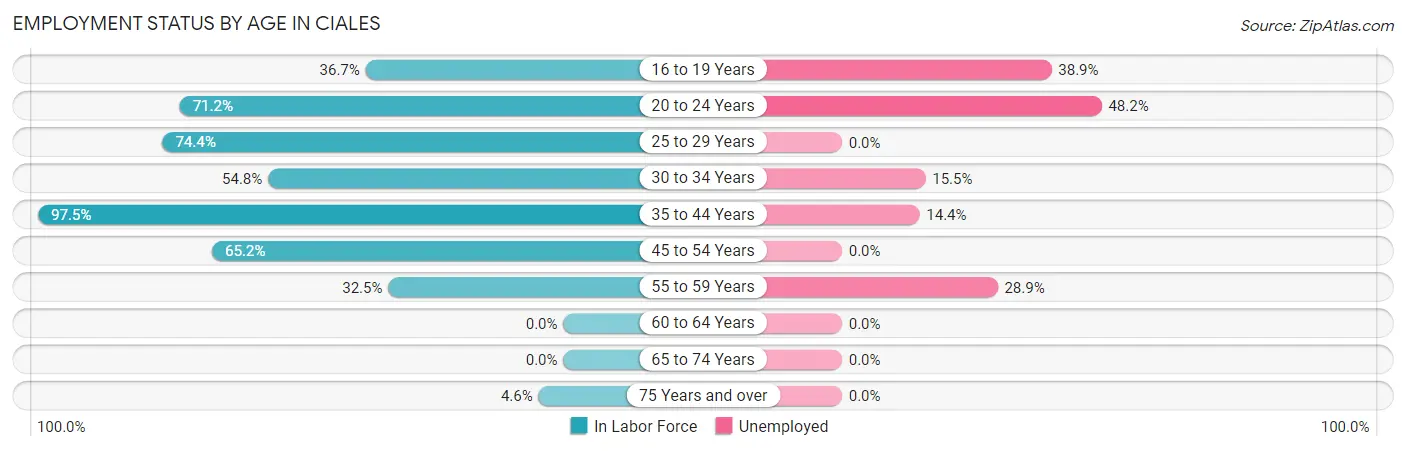
Employment Status by Age in Ciales
According to the labor force statistics for Ciales, out of the total population over 16 years of age (1,949), 41.1% or 801 individuals are in the labor force, with 20.1% or 161 of them unemployed. The age group with the highest labor force participation rate is 35 to 44 years, with 97.5% or 278 individuals in the labor force. Within the labor force, the 20 to 24 years age range has the highest percentage of unemployed individuals, with 48.2% or 81 of them being unemployed.
| Age Bracket | In Labor Force | Unemployed |
| 16 to 19 Years | 36 (36.7%) | 14 (38.9%) |
| 20 to 24 Years | 168 (71.2%) | 81 (48.2%) |
| 25 to 29 Years | 96 (74.4%) | 0 (0.0%) |
| 30 to 34 Years | 97 (54.8%) | 15 (15.5%) |
| 35 to 44 Years | 278 (97.5%) | 40 (14.4%) |
| 45 to 54 Years | 73 (65.2%) | 0 (0.0%) |
| 55 to 59 Years | 38 (32.5%) | 11 (28.9%) |
| 60 to 64 Years | 0 (0.0%) | 0 (0.0%) |
| 65 to 74 Years | 0 (0.0%) | 0 (0.0%) |
| 75 Years and over | 16 (4.6%) | 0 (0.0%) |
| Total | 801 (41.1%) | 161 (20.1%) |
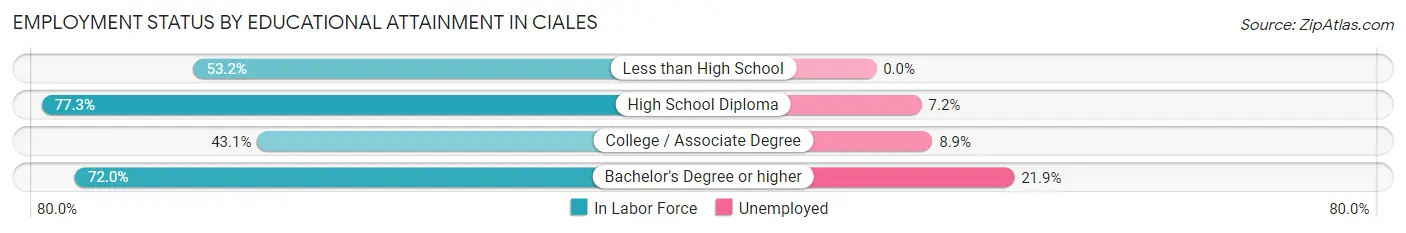
Employment Status by Educational Attainment in Ciales
According to labor force statistics for Ciales, 62.1% of individuals (582) out of the total population between 25 and 64 years of age (937) are in the labor force, with 11.3% or 66 of them being unemployed. The group with the highest labor force participation rate are those with the educational attainment of high school diploma, with 77.3% or 208 individuals in the labor force. Within the labor force, individuals with bachelor's degree or higher education have the highest percentage of unemployment, with 21.9% or 40 of them being unemployed.
| Educational Attainment | In Labor Force | Unemployed |
| Less than High School | 67 (53.2%) | 0 (0.0%) |
| High School Diploma | 208 (77.3%) | 19 (7.2%) |
| College / Associate Degree | 124 (43.1%) | 26 (8.9%) |
| Bachelor's Degree or higher | 183 (72.0%) | 56 (21.9%) |
| Total | 582 (62.1%) | 106 (11.3%) |
Employment Occupations by Sex in Ciales
Management, Business, Science and Arts Occupations
The most common Management, Business, Science and Arts occupations in Ciales are Community & Social Service (90 | 14.0%), Education Instruction & Library (90 | 14.0%), Management (20 | 3.1%), Health Diagnosing & Treating (7 | 1.1%), and Health Technologists (7 | 1.1%).
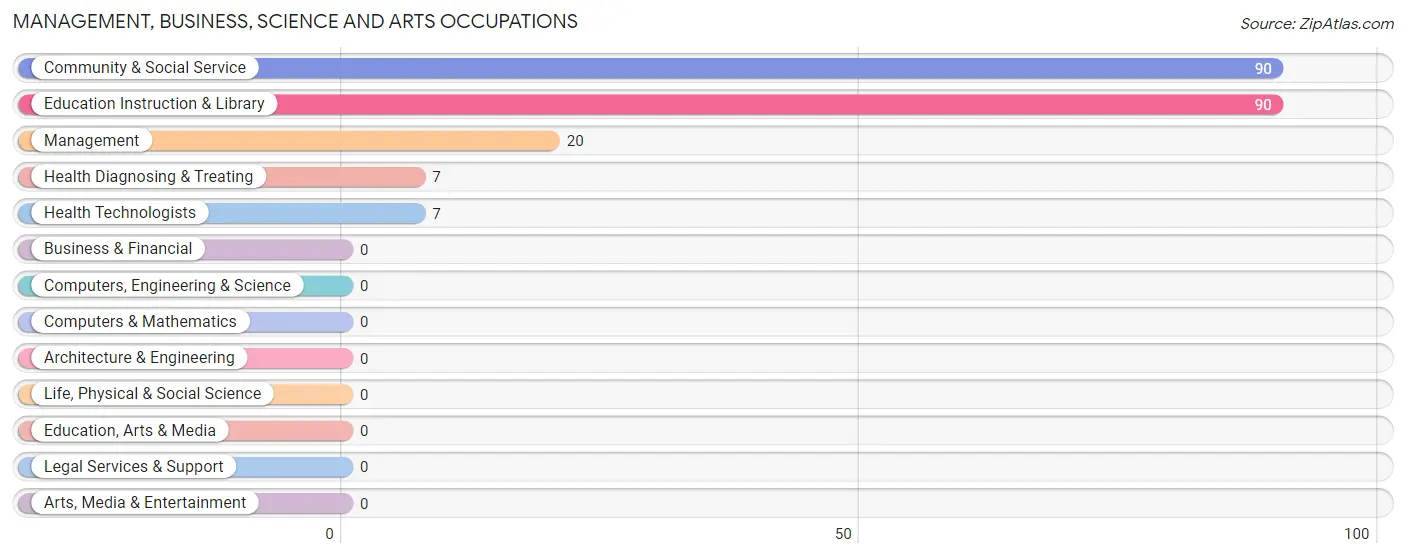
Management, Business, Science and Arts Occupations by Sex
Within the Management, Business, Science and Arts occupations in Ciales, the most male-oriented occupations are Community & Social Service (14.4%), and Education Instruction & Library (14.4%), while the most female-oriented occupations are Management (100.0%), Health Diagnosing & Treating (100.0%), and Health Technologists (100.0%).
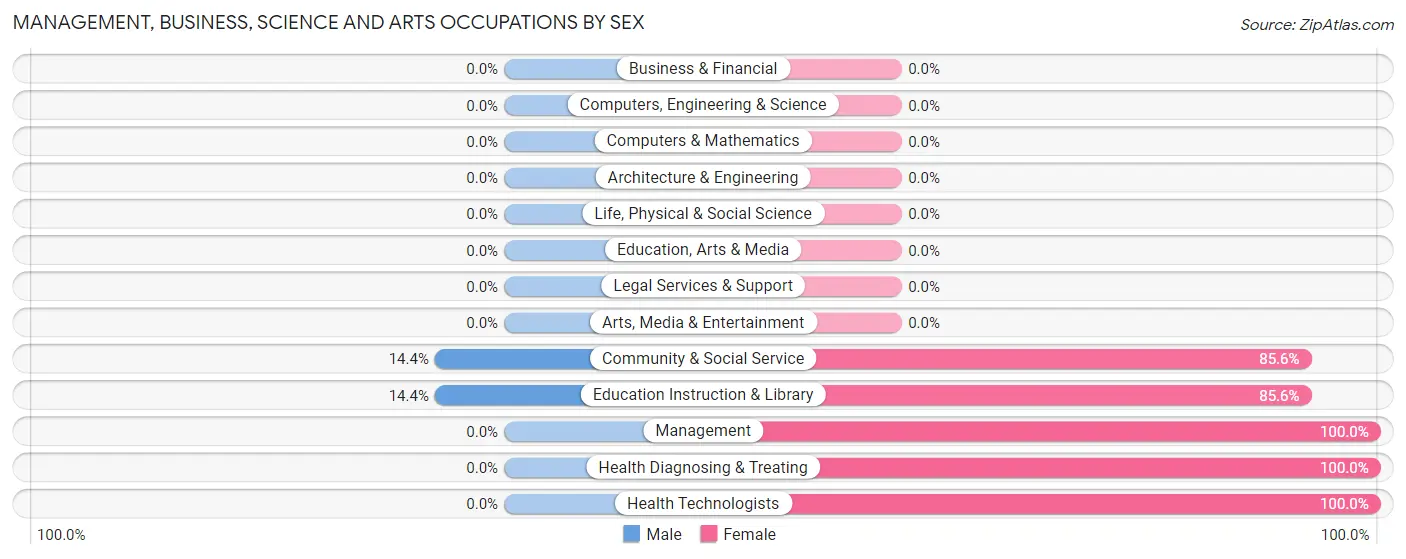
| Occupation | Male | Female |
| Management | 0 (0.0%) | 20 (100.0%) |
| Business & Financial | 0 (0.0%) | 0 (0.0%) |
| Computers, Engineering & Science | 0 (0.0%) | 0 (0.0%) |
| Computers & Mathematics | 0 (0.0%) | 0 (0.0%) |
| Architecture & Engineering | 0 (0.0%) | 0 (0.0%) |
| Life, Physical & Social Science | 0 (0.0%) | 0 (0.0%) |
| Community & Social Service | 13 (14.4%) | 77 (85.6%) |
| Education, Arts & Media | 0 (0.0%) | 0 (0.0%) |
| Legal Services & Support | 0 (0.0%) | 0 (0.0%) |
| Education Instruction & Library | 13 (14.4%) | 77 (85.6%) |
| Arts, Media & Entertainment | 0 (0.0%) | 0 (0.0%) |
| Health Diagnosing & Treating | 0 (0.0%) | 7 (100.0%) |
| Health Technologists | 0 (0.0%) | 7 (100.0%) |
| Total (Category) | 13 (11.1%) | 104 (88.9%) |
| Total (Overall) | 332 (51.8%) | 309 (48.2%) |
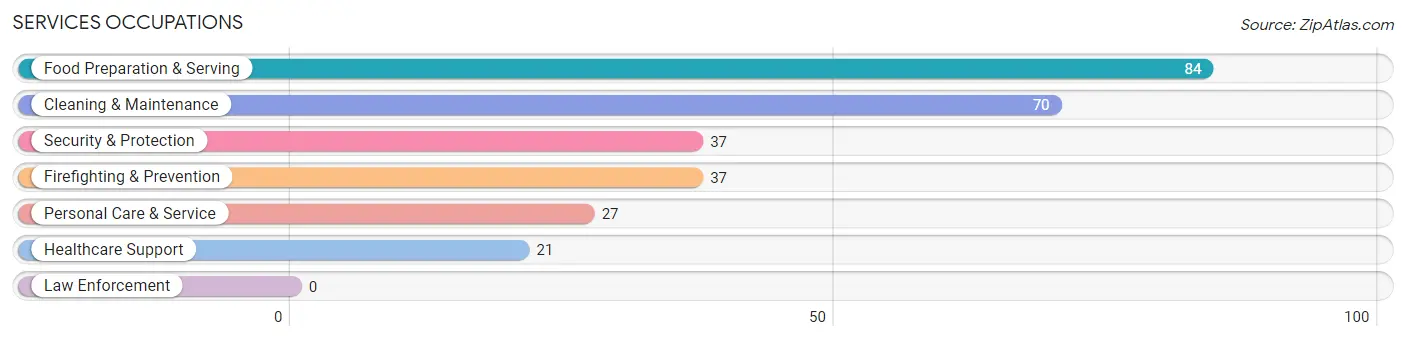
Services Occupations
The most common Services occupations in Ciales are Food Preparation & Serving (84 | 13.1%), Cleaning & Maintenance (70 | 10.9%), Security & Protection (37 | 5.8%), Firefighting & Prevention (37 | 5.8%), and Personal Care & Service (27 | 4.2%).
Services Occupations by Sex
Within the Services occupations in Ciales, the most male-oriented occupations are Security & Protection (100.0%), Firefighting & Prevention (100.0%), and Personal Care & Service (100.0%), while the most female-oriented occupations are Healthcare Support (100.0%), Cleaning & Maintenance (60.0%), and Food Preparation & Serving (51.2%).
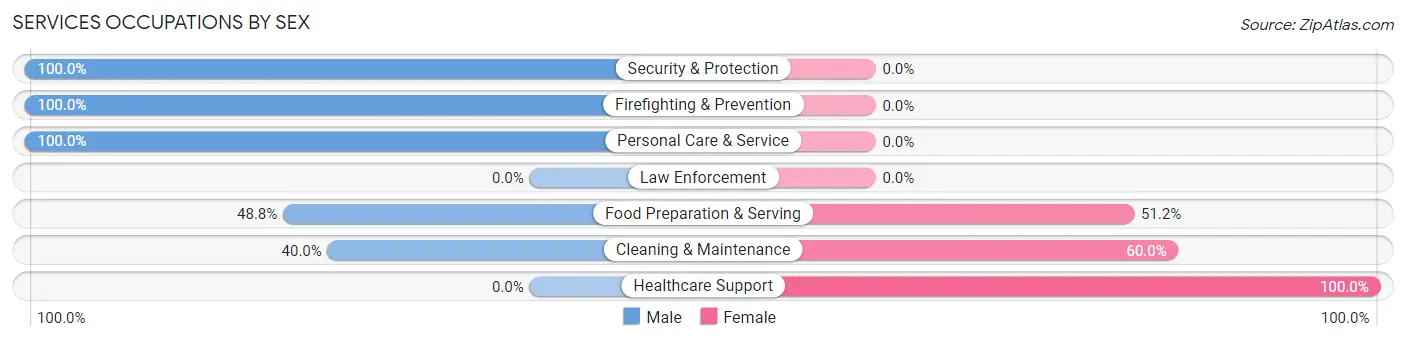
| Occupation | Male | Female |
| Healthcare Support | 0 (0.0%) | 21 (100.0%) |
| Security & Protection | 37 (100.0%) | 0 (0.0%) |
| Firefighting & Prevention | 37 (100.0%) | 0 (0.0%) |
| Law Enforcement | 0 (0.0%) | 0 (0.0%) |
| Food Preparation & Serving | 41 (48.8%) | 43 (51.2%) |
| Cleaning & Maintenance | 28 (40.0%) | 42 (60.0%) |
| Personal Care & Service | 27 (100.0%) | 0 (0.0%) |
| Total (Category) | 133 (55.6%) | 106 (44.4%) |
| Total (Overall) | 332 (51.8%) | 309 (48.2%) |
Sales and Office Occupations
The most common Sales and Office occupations in Ciales are Sales & Related (54 | 8.4%), and Office & Administration (43 | 6.7%).

Sales and Office Occupations by Sex

| Occupation | Male | Female |
| Sales & Related | 0 (0.0%) | 54 (100.0%) |
| Office & Administration | 16 (37.2%) | 27 (62.8%) |
| Total (Category) | 16 (16.5%) | 81 (83.5%) |
| Total (Overall) | 332 (51.8%) | 309 (48.2%) |
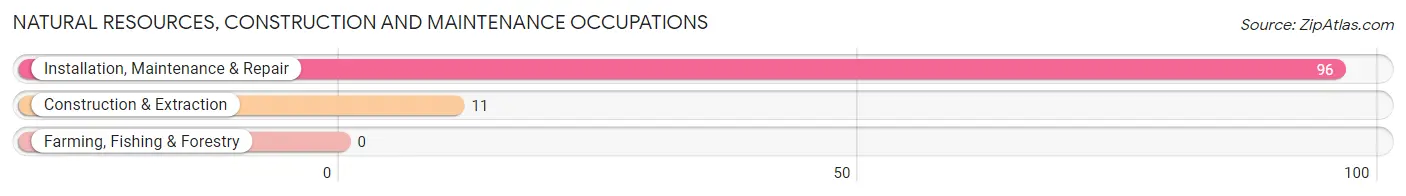
Natural Resources, Construction and Maintenance Occupations
The most common Natural Resources, Construction and Maintenance occupations in Ciales are Installation, Maintenance & Repair (96 | 15.0%), and Construction & Extraction (11 | 1.7%).
Natural Resources, Construction and Maintenance Occupations by Sex
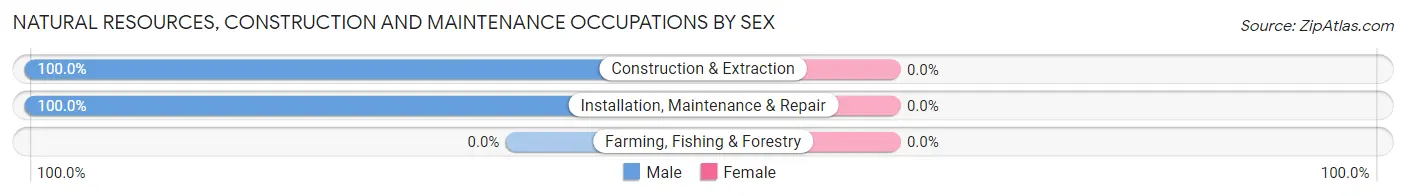
| Occupation | Male | Female |
| Farming, Fishing & Forestry | 0 (0.0%) | 0 (0.0%) |
| Construction & Extraction | 11 (100.0%) | 0 (0.0%) |
| Installation, Maintenance & Repair | 96 (100.0%) | 0 (0.0%) |
| Total (Category) | 107 (100.0%) | 0 (0.0%) |
| Total (Overall) | 332 (51.8%) | 309 (48.2%) |
Production, Transportation and Moving Occupations
The most common Production, Transportation and Moving occupations in Ciales are , and Production (81 | 12.6%).
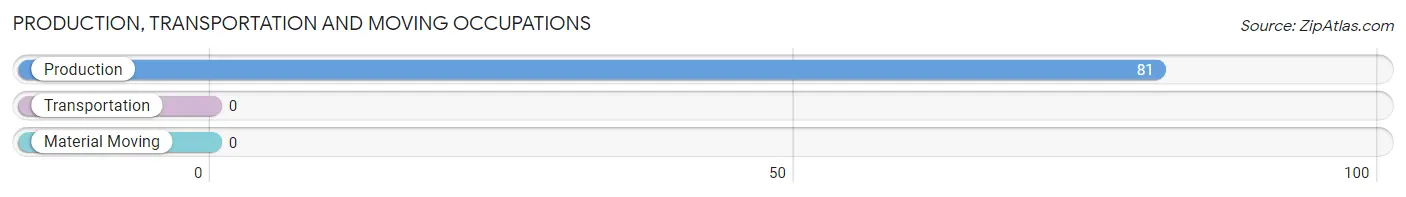
Production, Transportation and Moving Occupations by Sex
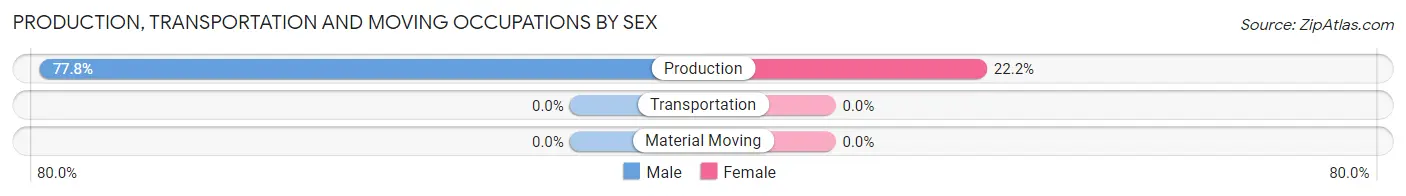
| Occupation | Male | Female |
| Production | 63 (77.8%) | 18 (22.2%) |
| Transportation | 0 (0.0%) | 0 (0.0%) |
| Material Moving | 0 (0.0%) | 0 (0.0%) |
| Total (Category) | 63 (77.8%) | 18 (22.2%) |
| Total (Overall) | 332 (51.8%) | 309 (48.2%) |
Employment Industries by Sex in Ciales
Employment Industries in Ciales
The major employment industries in Ciales include Manufacturing (125 | 19.5%), Educational Services (110 | 17.2%), Administrative & Support (96 | 15.0%), Health Care & Social Assistance (66 | 10.3%), and Accommodation & Food Services (64 | 10.0%).
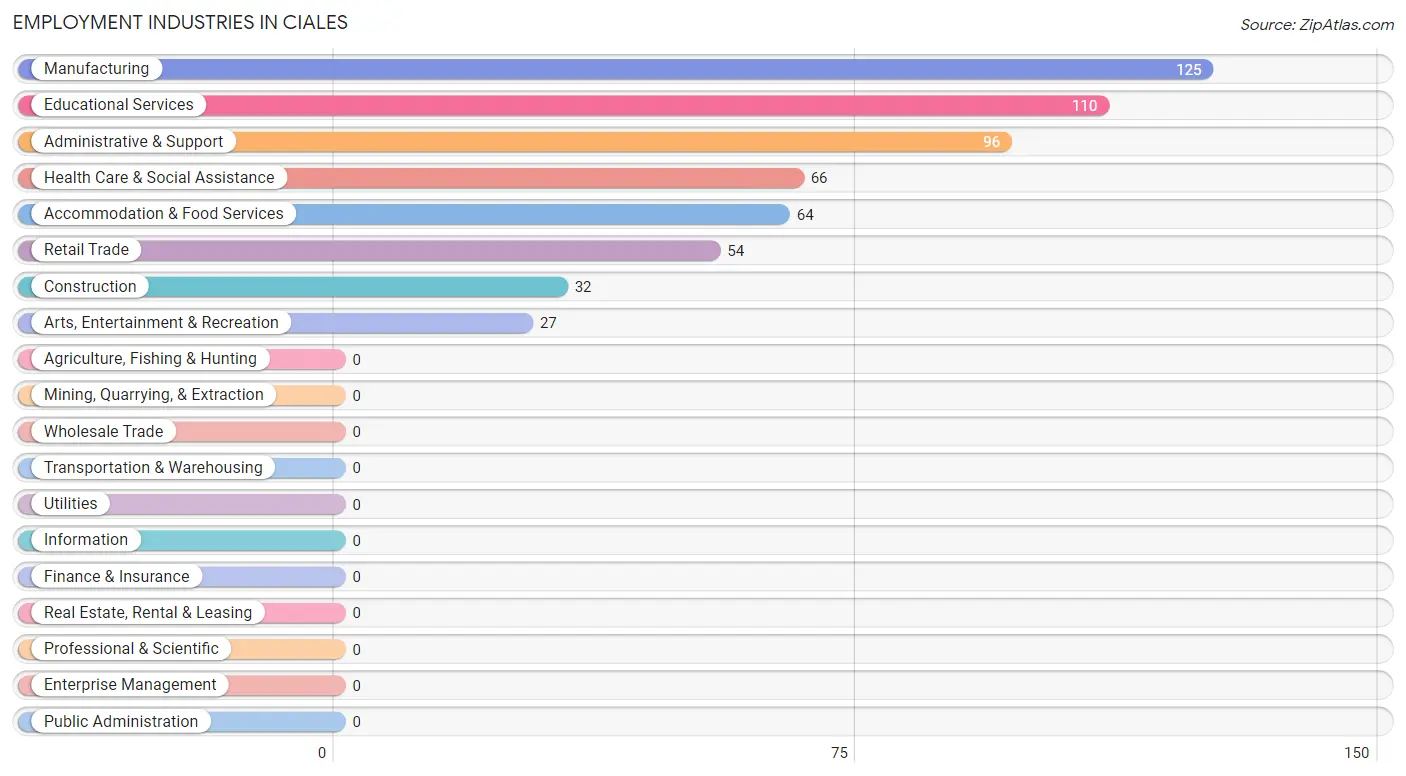
Employment Industries by Sex in Ciales
The Ciales industries that see more men than women are Construction (100.0%), Arts, Entertainment & Recreation (100.0%), and Manufacturing (69.6%), whereas the industries that tend to have a higher number of women are Retail Trade (100.0%), Health Care & Social Assistance (100.0%), and Educational Services (88.2%).
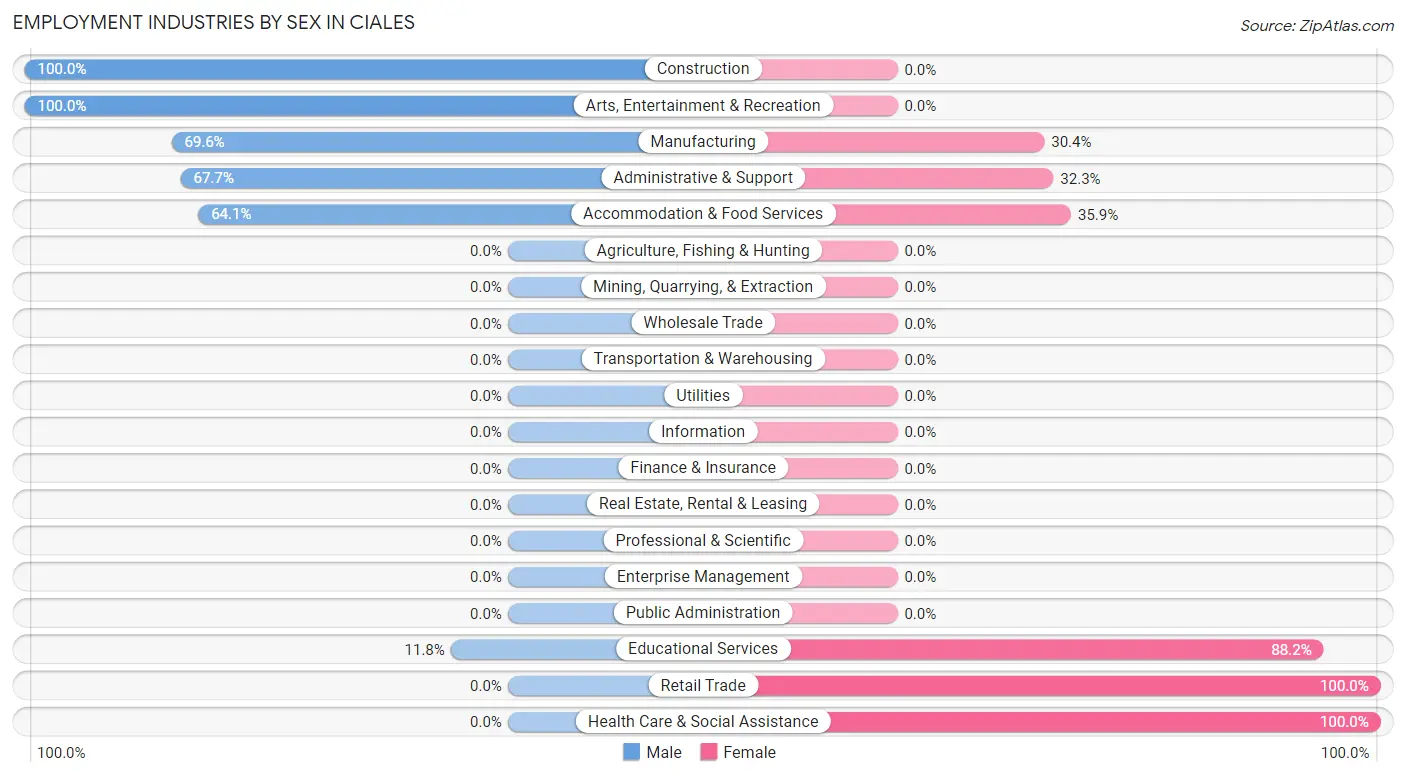
| Industry | Male | Female |
| Agriculture, Fishing & Hunting | 0 (0.0%) | 0 (0.0%) |
| Mining, Quarrying, & Extraction | 0 (0.0%) | 0 (0.0%) |
| Construction | 32 (100.0%) | 0 (0.0%) |
| Manufacturing | 87 (69.6%) | 38 (30.4%) |
| Wholesale Trade | 0 (0.0%) | 0 (0.0%) |
| Retail Trade | 0 (0.0%) | 54 (100.0%) |
| Transportation & Warehousing | 0 (0.0%) | 0 (0.0%) |
| Utilities | 0 (0.0%) | 0 (0.0%) |
| Information | 0 (0.0%) | 0 (0.0%) |
| Finance & Insurance | 0 (0.0%) | 0 (0.0%) |
| Real Estate, Rental & Leasing | 0 (0.0%) | 0 (0.0%) |
| Professional & Scientific | 0 (0.0%) | 0 (0.0%) |
| Enterprise Management | 0 (0.0%) | 0 (0.0%) |
| Administrative & Support | 65 (67.7%) | 31 (32.3%) |
| Educational Services | 13 (11.8%) | 97 (88.2%) |
| Health Care & Social Assistance | 0 (0.0%) | 66 (100.0%) |
| Arts, Entertainment & Recreation | 27 (100.0%) | 0 (0.0%) |
| Accommodation & Food Services | 41 (64.1%) | 23 (35.9%) |
| Public Administration | 0 (0.0%) | 0 (0.0%) |
| Total | 332 (51.8%) | 309 (48.2%) |
Education in Ciales
School Enrollment in Ciales
The most common levels of schooling among the 708 students in Ciales are middle school (259 | 36.6%), elementary school (170 | 24.0%), and college / undergraduate (169 | 23.9%).
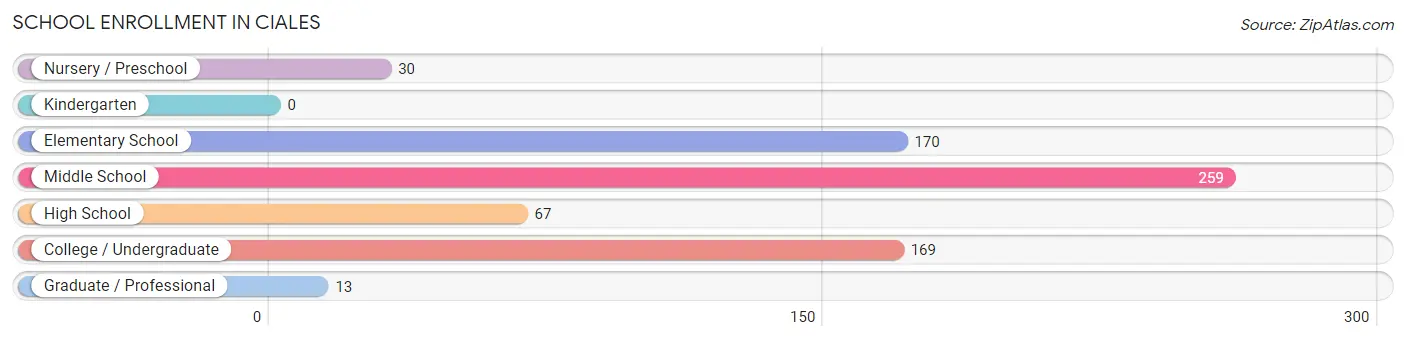
| School Level | # Students | % Students |
| Nursery / Preschool | 30 | 4.2% |
| Kindergarten | 0 | 0.0% |
| Elementary School | 170 | 24.0% |
| Middle School | 259 | 36.6% |
| High School | 67 | 9.5% |
| College / Undergraduate | 169 | 23.9% |
| Graduate / Professional | 13 | 1.8% |
| Total | 708 | 100.0% |
School Enrollment by Age by Funding Source in Ciales
Out of a total of 708 students who are enrolled in schools in Ciales, 144 (20.3%) attend a private institution, while the remaining 564 (79.7%) are enrolled in public schools. The age group of 35 years and over has the highest likelihood of being enrolled in private schools, with 62 (100.0% in the age bracket) enrolled. Conversely, the age group of 10 to 14 year olds has the lowest likelihood of being enrolled in a private school, with 238 (100.0% in the age bracket) attending a public institution.
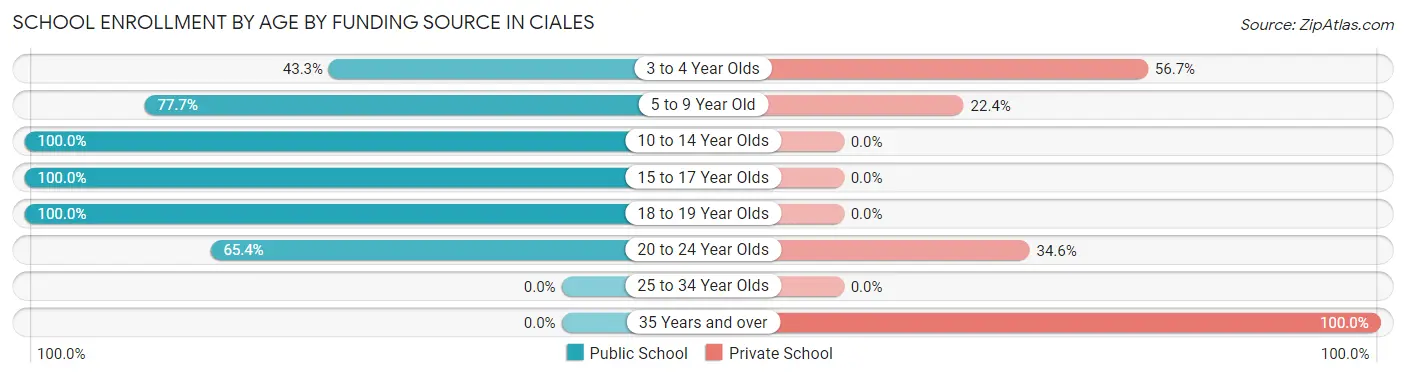
| Age Bracket | Public School | Private School |
| 3 to 4 Year Olds | 13 (43.3%) | 17 (56.7%) |
| 5 to 9 Year Old | 132 (77.6%) | 38 (22.4%) |
| 10 to 14 Year Olds | 238 (100.0%) | 0 (0.0%) |
| 15 to 17 Year Olds | 88 (100.0%) | 0 (0.0%) |
| 18 to 19 Year Olds | 42 (100.0%) | 0 (0.0%) |
| 20 to 24 Year Olds | 51 (65.4%) | 27 (34.6%) |
| 25 to 34 Year Olds | 0 (0.0%) | 0 (0.0%) |
| 35 Years and over | 0 (0.0%) | 62 (100.0%) |
| Total | 564 (79.7%) | 144 (20.3%) |
Educational Attainment by Field of Study in Ciales
Education (213 | 55.8%), bio, nature & agricultural (40 | 10.5%), business (34 | 8.9%), arts & humanities (28 | 7.3%), and science & technology (27 | 7.1%) are the most common fields of study among 382 individuals in Ciales who have obtained a bachelor's degree or higher.
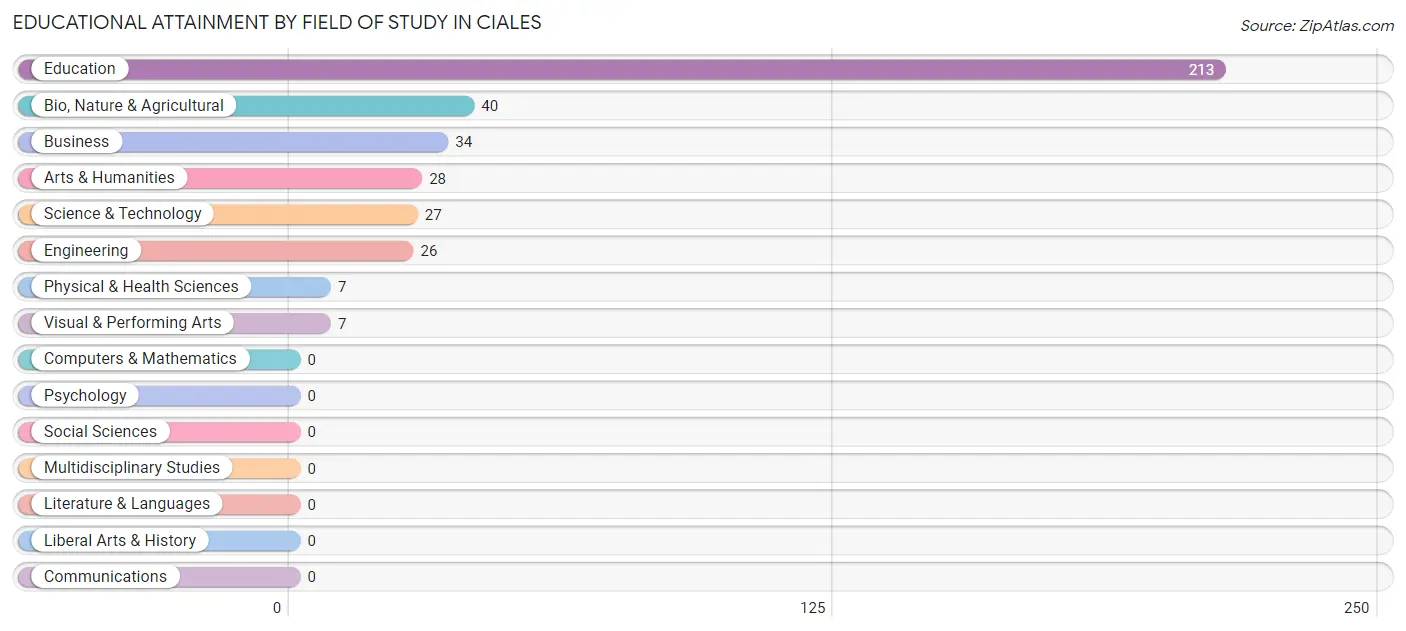
| Field of Study | # Graduates | % Graduates |
| Computers & Mathematics | 0 | 0.0% |
| Bio, Nature & Agricultural | 40 | 10.5% |
| Physical & Health Sciences | 7 | 1.8% |
| Psychology | 0 | 0.0% |
| Social Sciences | 0 | 0.0% |
| Engineering | 26 | 6.8% |
| Multidisciplinary Studies | 0 | 0.0% |
| Science & Technology | 27 | 7.1% |
| Business | 34 | 8.9% |
| Education | 213 | 55.8% |
| Literature & Languages | 0 | 0.0% |
| Liberal Arts & History | 0 | 0.0% |
| Visual & Performing Arts | 7 | 1.8% |
| Communications | 0 | 0.0% |
| Arts & Humanities | 28 | 7.3% |
| Total | 382 | 100.0% |
Transportation & Commute in Ciales
Vehicle Availability by Sex in Ciales
The most prevalent vehicle ownership categories in Ciales are males with 2 vehicles (161, accounting for 48.5%) and females with 2 vehicles (54, making up 54.2%).
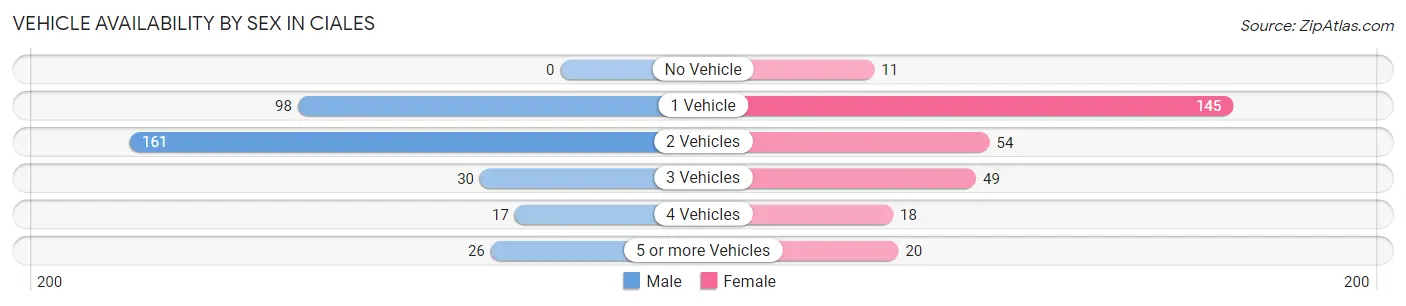
| Vehicles Available | Male | Female |
| No Vehicle | 0 (0.0%) | 11 (3.7%) |
| 1 Vehicle | 98 (29.5%) | 145 (48.8%) |
| 2 Vehicles | 161 (48.5%) | 54 (18.2%) |
| 3 Vehicles | 30 (9.0%) | 49 (16.5%) |
| 4 Vehicles | 17 (5.1%) | 18 (6.1%) |
| 5 or more Vehicles | 26 (7.8%) | 20 (6.7%) |
| Total | 332 (100.0%) | 297 (100.0%) |
Commute Time in Ciales
The most frequently occuring commute durations in Ciales are 5 to 9 minutes (211 commuters, 33.6%), 15 to 19 minutes (150 commuters, 23.8%), and 30 to 34 minutes (75 commuters, 11.9%).
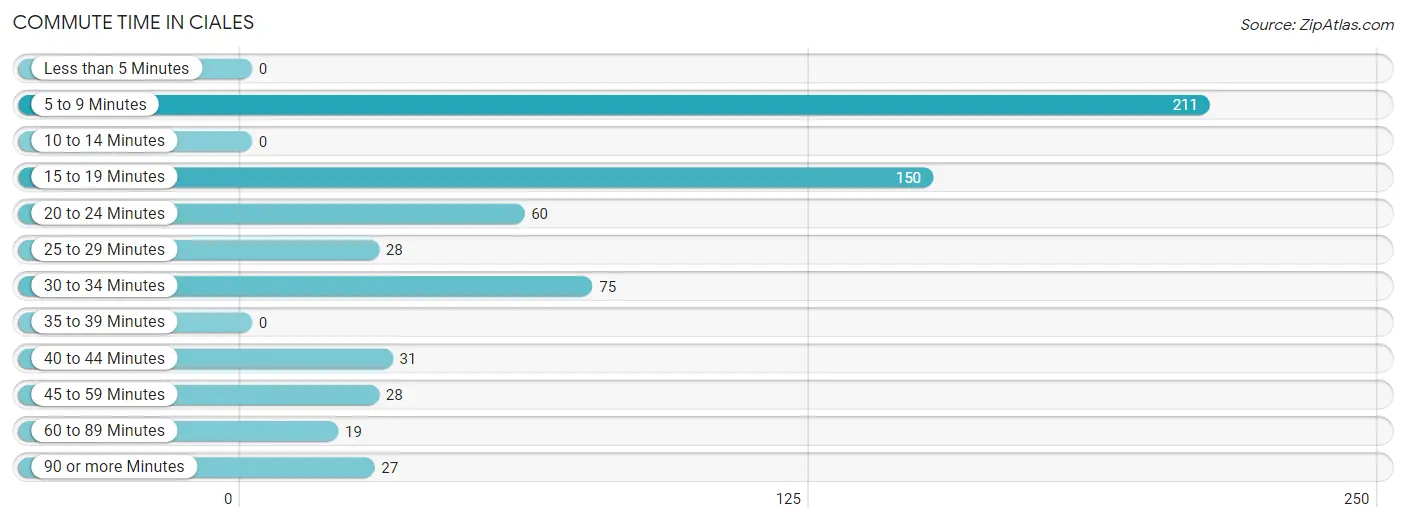
| Commute Time | # Commuters | % Commuters |
| Less than 5 Minutes | 0 | 0.0% |
| 5 to 9 Minutes | 211 | 33.6% |
| 10 to 14 Minutes | 0 | 0.0% |
| 15 to 19 Minutes | 150 | 23.8% |
| 20 to 24 Minutes | 60 | 9.5% |
| 25 to 29 Minutes | 28 | 4.4% |
| 30 to 34 Minutes | 75 | 11.9% |
| 35 to 39 Minutes | 0 | 0.0% |
| 40 to 44 Minutes | 31 | 4.9% |
| 45 to 59 Minutes | 28 | 4.4% |
| 60 to 89 Minutes | 19 | 3.0% |
| 90 or more Minutes | 27 | 4.3% |
Commute Time by Sex in Ciales
The most common commute times in Ciales are 5 to 9 minutes (92 commuters, 27.7%) for males and 5 to 9 minutes (119 commuters, 40.1%) for females.
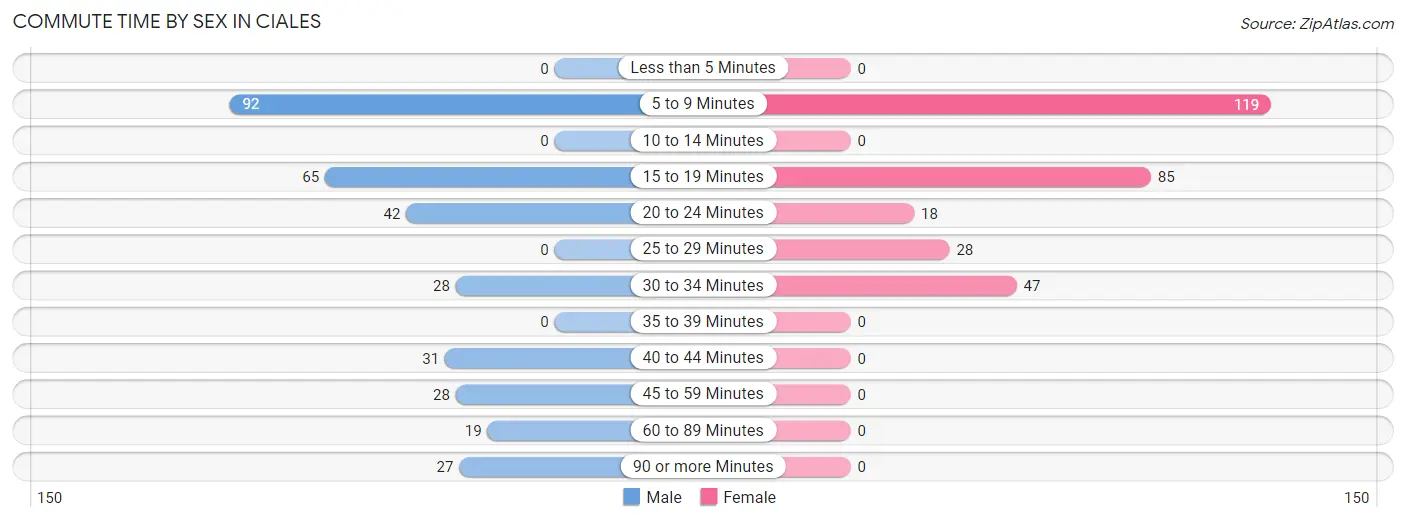
| Commute Time | Male | Female |
| Less than 5 Minutes | 0 (0.0%) | 0 (0.0%) |
| 5 to 9 Minutes | 92 (27.7%) | 119 (40.1%) |
| 10 to 14 Minutes | 0 (0.0%) | 0 (0.0%) |
| 15 to 19 Minutes | 65 (19.6%) | 85 (28.6%) |
| 20 to 24 Minutes | 42 (12.7%) | 18 (6.1%) |
| 25 to 29 Minutes | 0 (0.0%) | 28 (9.4%) |
| 30 to 34 Minutes | 28 (8.4%) | 47 (15.8%) |
| 35 to 39 Minutes | 0 (0.0%) | 0 (0.0%) |
| 40 to 44 Minutes | 31 (9.3%) | 0 (0.0%) |
| 45 to 59 Minutes | 28 (8.4%) | 0 (0.0%) |
| 60 to 89 Minutes | 19 (5.7%) | 0 (0.0%) |
| 90 or more Minutes | 27 (8.1%) | 0 (0.0%) |
Time of Departure to Work by Sex in Ciales
The most frequent times of departure to work in Ciales are 6:00 AM to 6:29 AM (122, 36.7%) for males and 8:00 AM to 8:29 AM (77, 25.9%) for females.
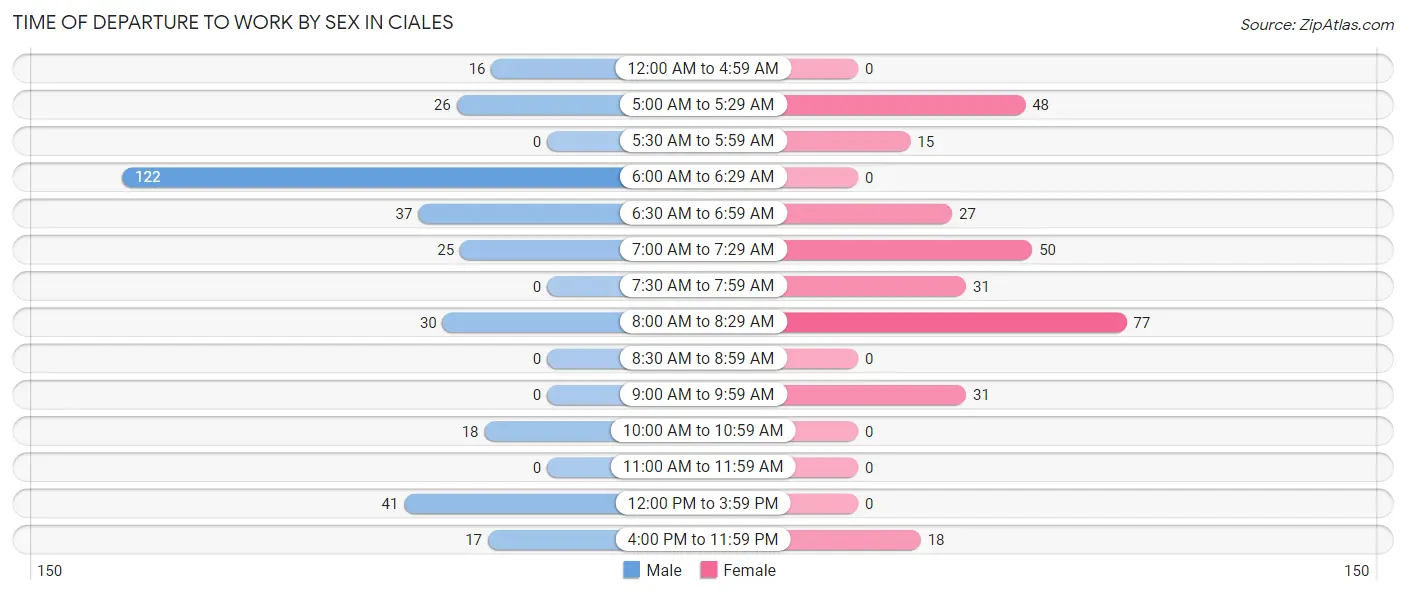
| Time of Departure | Male | Female |
| 12:00 AM to 4:59 AM | 16 (4.8%) | 0 (0.0%) |
| 5:00 AM to 5:29 AM | 26 (7.8%) | 48 (16.2%) |
| 5:30 AM to 5:59 AM | 0 (0.0%) | 15 (5.1%) |
| 6:00 AM to 6:29 AM | 122 (36.7%) | 0 (0.0%) |
| 6:30 AM to 6:59 AM | 37 (11.1%) | 27 (9.1%) |
| 7:00 AM to 7:29 AM | 25 (7.5%) | 50 (16.8%) |
| 7:30 AM to 7:59 AM | 0 (0.0%) | 31 (10.4%) |
| 8:00 AM to 8:29 AM | 30 (9.0%) | 77 (25.9%) |
| 8:30 AM to 8:59 AM | 0 (0.0%) | 0 (0.0%) |
| 9:00 AM to 9:59 AM | 0 (0.0%) | 31 (10.4%) |
| 10:00 AM to 10:59 AM | 18 (5.4%) | 0 (0.0%) |
| 11:00 AM to 11:59 AM | 0 (0.0%) | 0 (0.0%) |
| 12:00 PM to 3:59 PM | 41 (12.3%) | 0 (0.0%) |
| 4:00 PM to 11:59 PM | 17 (5.1%) | 18 (6.1%) |
| Total | 332 (100.0%) | 297 (100.0%) |
Housing Occupancy in Ciales
Occupancy by Ownership in Ciales
Of the total 871 dwellings in Ciales, owner-occupied units account for 455 (52.2%), while renter-occupied units make up 416 (47.8%).
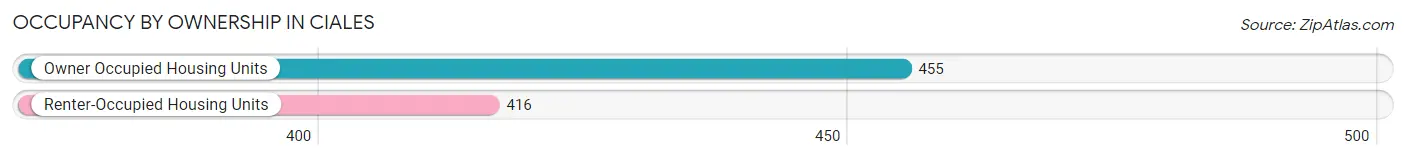
| Occupancy | # Housing Units | % Housing Units |
| Owner Occupied Housing Units | 455 | 52.2% |
| Renter-Occupied Housing Units | 416 | 47.8% |
| Total Occupied Housing Units | 871 | 100.0% |
Occupancy by Household Size in Ciales
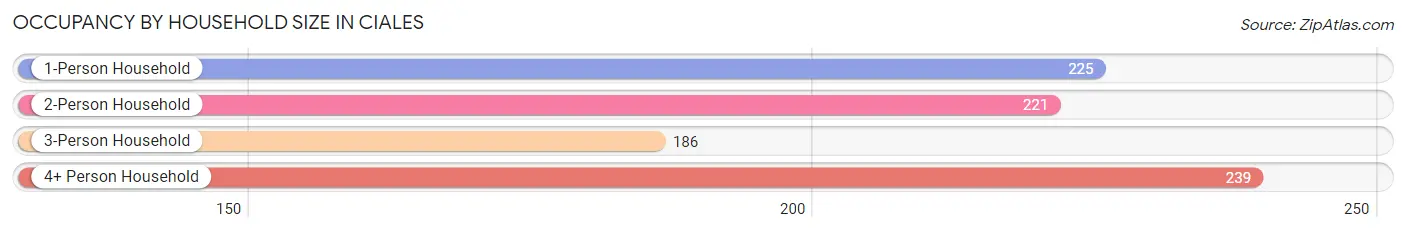
| Household Size | # Housing Units | % Housing Units |
| 1-Person Household | 225 | 25.8% |
| 2-Person Household | 221 | 25.4% |
| 3-Person Household | 186 | 21.3% |
| 4+ Person Household | 239 | 27.4% |
| Total Housing Units | 871 | 100.0% |
Occupancy by Ownership by Household Size in Ciales
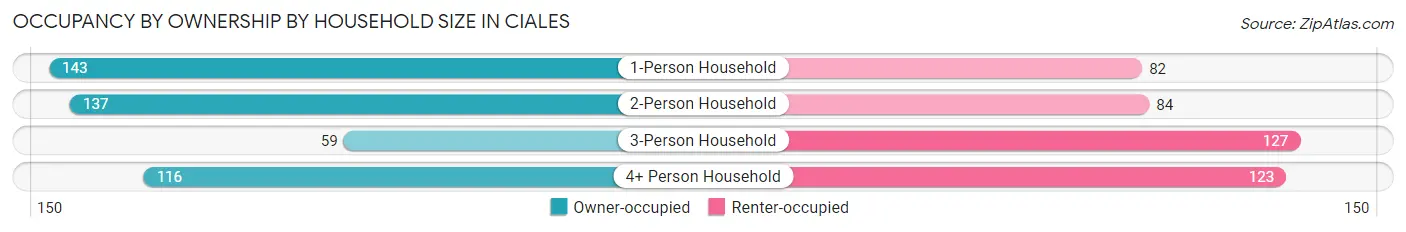
| Household Size | Owner-occupied | Renter-occupied |
| 1-Person Household | 143 (63.6%) | 82 (36.4%) |
| 2-Person Household | 137 (62.0%) | 84 (38.0%) |
| 3-Person Household | 59 (31.7%) | 127 (68.3%) |
| 4+ Person Household | 116 (48.5%) | 123 (51.5%) |
| Total Housing Units | 455 (52.2%) | 416 (47.8%) |
Occupancy by Educational Attainment in Ciales
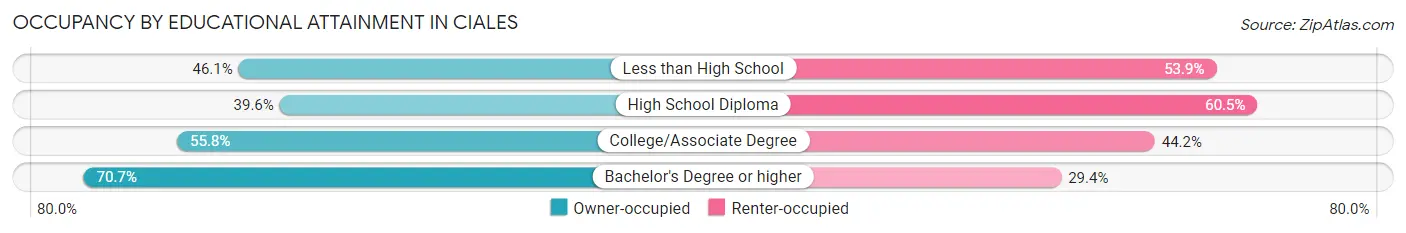
| Household Size | Owner-occupied | Renter-occupied |
| Less than High School | 82 (46.1%) | 96 (53.9%) |
| High School Diploma | 106 (39.6%) | 162 (60.5%) |
| College/Associate Degree | 125 (55.8%) | 99 (44.2%) |
| Bachelor's Degree or higher | 142 (70.7%) | 59 (29.3%) |
Occupancy by Age of Householder in Ciales
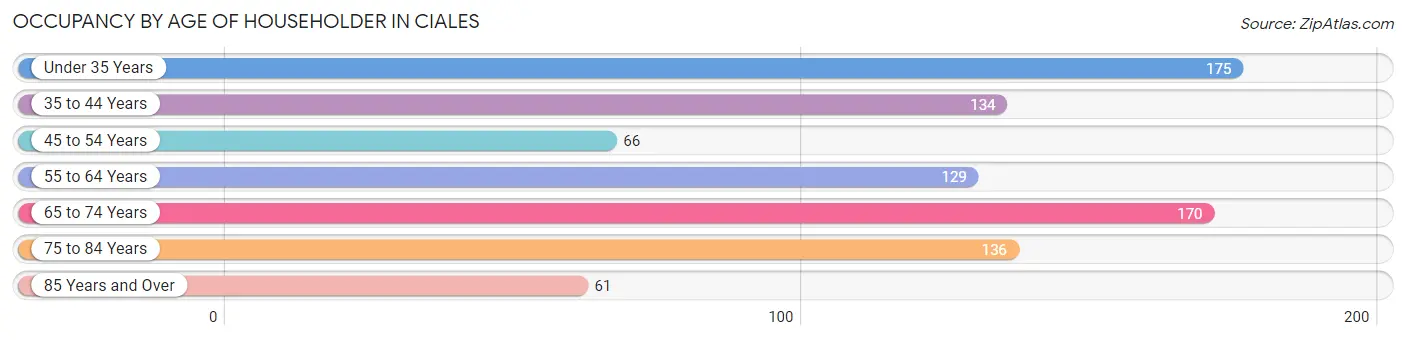
| Age Bracket | # Households | % Households |
| Under 35 Years | 175 | 20.1% |
| 35 to 44 Years | 134 | 15.4% |
| 45 to 54 Years | 66 | 7.6% |
| 55 to 64 Years | 129 | 14.8% |
| 65 to 74 Years | 170 | 19.5% |
| 75 to 84 Years | 136 | 15.6% |
| 85 Years and Over | 61 | 7.0% |
| Total | 871 | 100.0% |
Housing Finances in Ciales
Median Income by Occupancy in Ciales
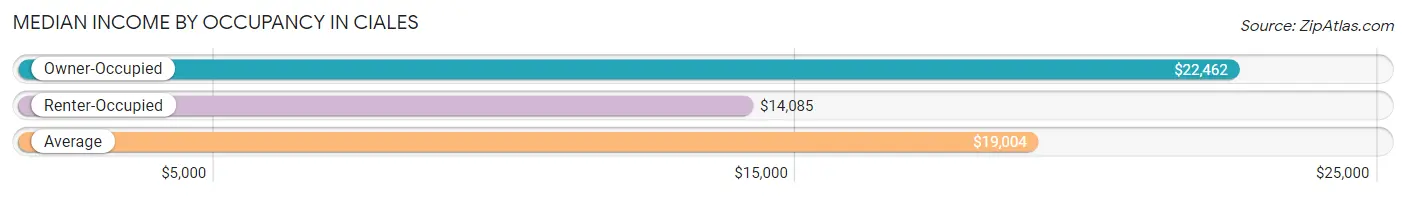
| Occupancy Type | # Households | Median Income |
| Owner-Occupied | 455 (52.2%) | $22,462 |
| Renter-Occupied | 416 (47.8%) | $14,085 |
| Average | 871 (100.0%) | $19,004 |
Occupancy by Householder Income Bracket in Ciales
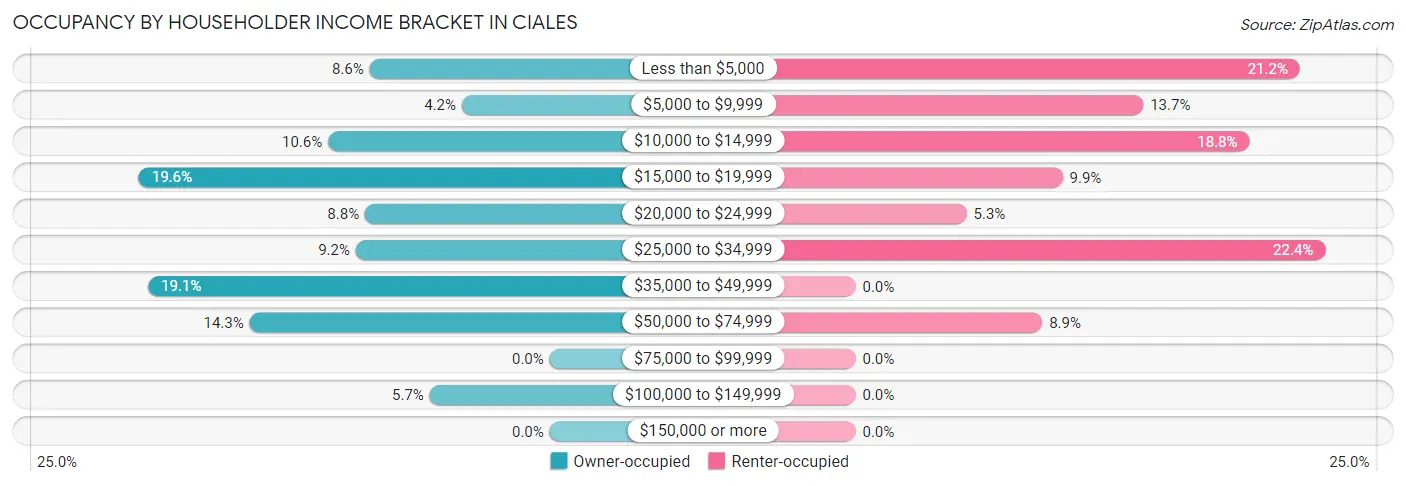
| Income Bracket | Owner-occupied | Renter-occupied |
| Less than $5,000 | 39 (8.6%) | 88 (21.1%) |
| $5,000 to $9,999 | 19 (4.2%) | 57 (13.7%) |
| $10,000 to $14,999 | 48 (10.5%) | 78 (18.8%) |
| $15,000 to $19,999 | 89 (19.6%) | 41 (9.9%) |
| $20,000 to $24,999 | 40 (8.8%) | 22 (5.3%) |
| $25,000 to $34,999 | 42 (9.2%) | 93 (22.4%) |
| $35,000 to $49,999 | 87 (19.1%) | 0 (0.0%) |
| $50,000 to $74,999 | 65 (14.3%) | 37 (8.9%) |
| $75,000 to $99,999 | 0 (0.0%) | 0 (0.0%) |
| $100,000 to $149,999 | 26 (5.7%) | 0 (0.0%) |
| $150,000 or more | 0 (0.0%) | 0 (0.0%) |
| Total | 455 (100.0%) | 416 (100.0%) |
Monthly Housing Cost Tiers in Ciales
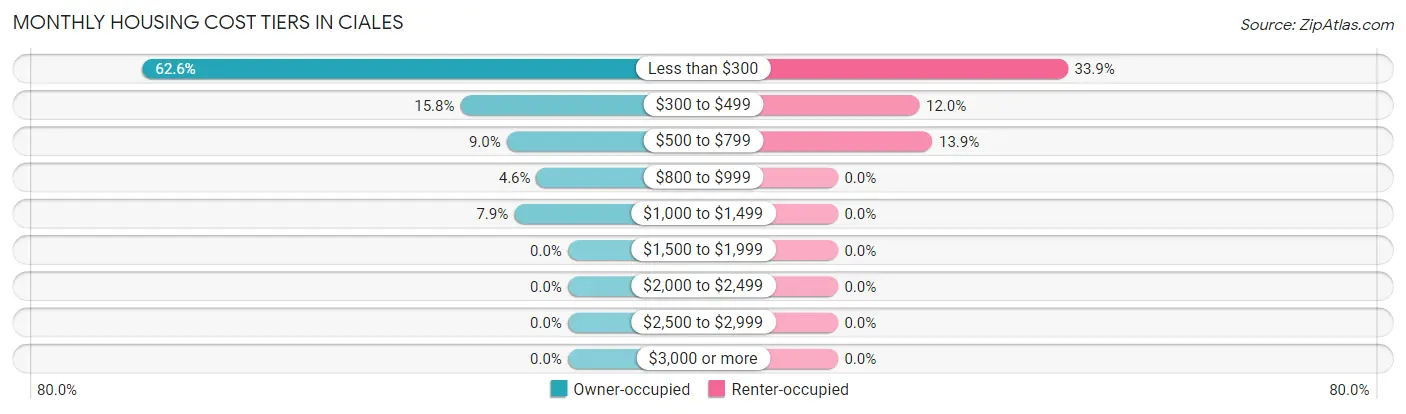
| Monthly Cost | Owner-occupied | Renter-occupied |
| Less than $300 | 285 (62.6%) | 141 (33.9%) |
| $300 to $499 | 72 (15.8%) | 50 (12.0%) |
| $500 to $799 | 41 (9.0%) | 58 (13.9%) |
| $800 to $999 | 21 (4.6%) | 0 (0.0%) |
| $1,000 to $1,499 | 36 (7.9%) | 0 (0.0%) |
| $1,500 to $1,999 | 0 (0.0%) | 0 (0.0%) |
| $2,000 to $2,499 | 0 (0.0%) | 0 (0.0%) |
| $2,500 to $2,999 | 0 (0.0%) | 0 (0.0%) |
| $3,000 or more | 0 (0.0%) | 0 (0.0%) |
| Total | 455 (100.0%) | 416 (100.0%) |
Physical Housing Characteristics in Ciales
Housing Structures in Ciales
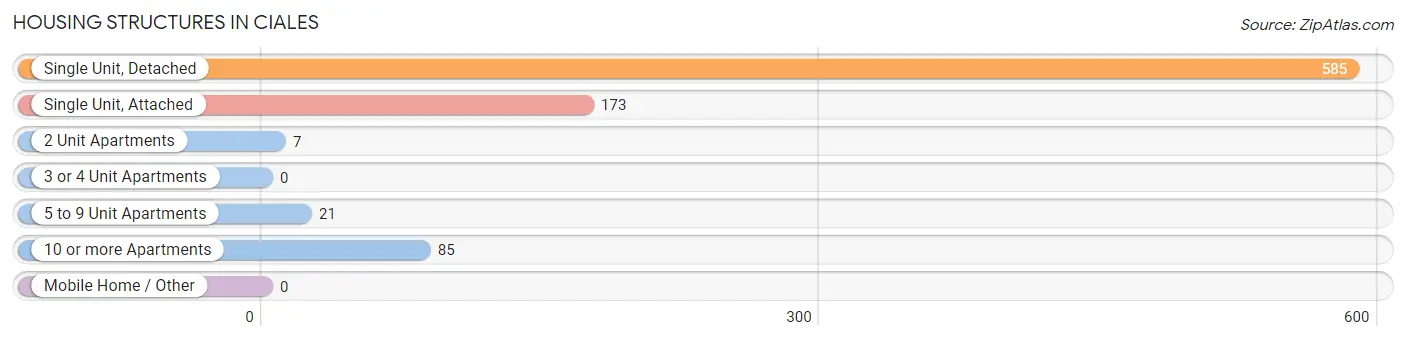
| Structure Type | # Housing Units | % Housing Units |
| Single Unit, Detached | 585 | 67.2% |
| Single Unit, Attached | 173 | 19.9% |
| 2 Unit Apartments | 7 | 0.8% |
| 3 or 4 Unit Apartments | 0 | 0.0% |
| 5 to 9 Unit Apartments | 21 | 2.4% |
| 10 or more Apartments | 85 | 9.8% |
| Mobile Home / Other | 0 | 0.0% |
| Total | 871 | 100.0% |
Housing Structures by Occupancy in Ciales
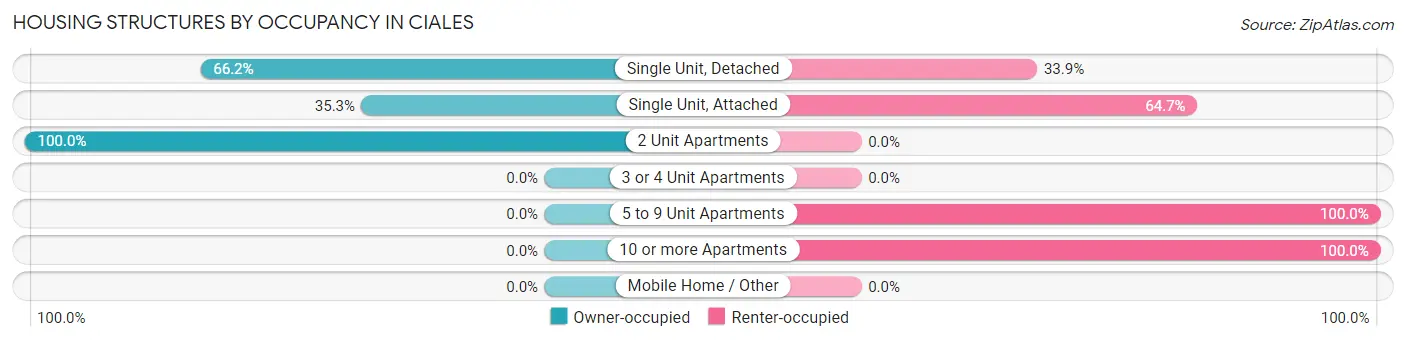
| Structure Type | Owner-occupied | Renter-occupied |
| Single Unit, Detached | 387 (66.1%) | 198 (33.9%) |
| Single Unit, Attached | 61 (35.3%) | 112 (64.7%) |
| 2 Unit Apartments | 7 (100.0%) | 0 (0.0%) |
| 3 or 4 Unit Apartments | 0 (0.0%) | 0 (0.0%) |
| 5 to 9 Unit Apartments | 0 (0.0%) | 21 (100.0%) |
| 10 or more Apartments | 0 (0.0%) | 85 (100.0%) |
| Mobile Home / Other | 0 (0.0%) | 0 (0.0%) |
| Total | 455 (52.2%) | 416 (47.8%) |
Housing Structures by Number of Rooms in Ciales
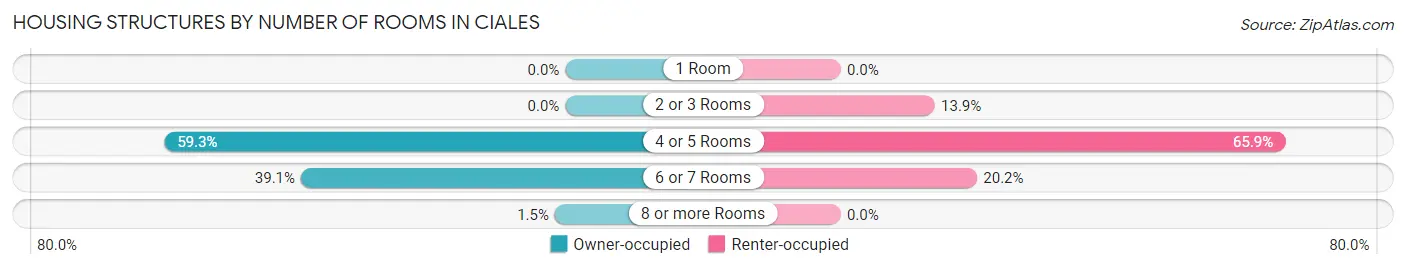
| Number of Rooms | Owner-occupied | Renter-occupied |
| 1 Room | 0 (0.0%) | 0 (0.0%) |
| 2 or 3 Rooms | 0 (0.0%) | 58 (13.9%) |
| 4 or 5 Rooms | 270 (59.3%) | 274 (65.9%) |
| 6 or 7 Rooms | 178 (39.1%) | 84 (20.2%) |
| 8 or more Rooms | 7 (1.5%) | 0 (0.0%) |
| Total | 455 (100.0%) | 416 (100.0%) |
Housing Structure by Heating Type in Ciales
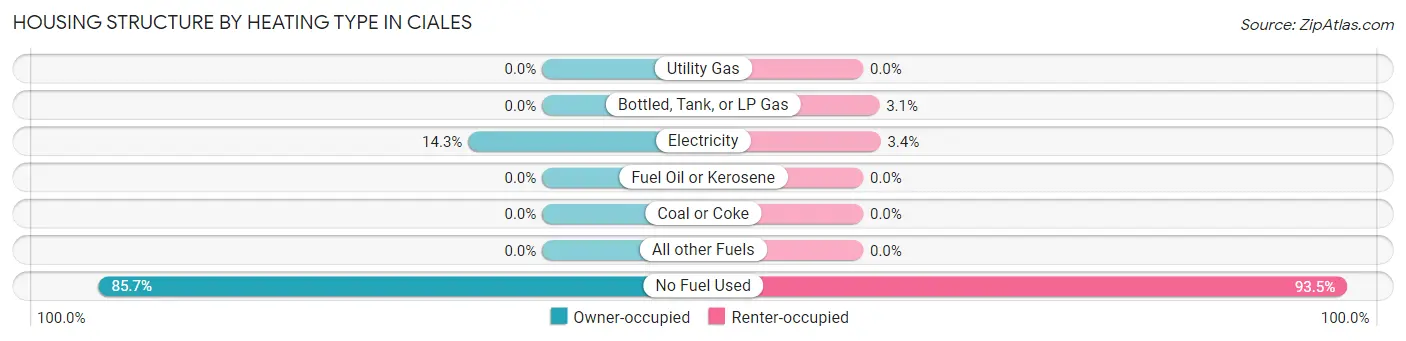
| Heating Type | Owner-occupied | Renter-occupied |
| Utility Gas | 0 (0.0%) | 0 (0.0%) |
| Bottled, Tank, or LP Gas | 0 (0.0%) | 13 (3.1%) |
| Electricity | 65 (14.3%) | 14 (3.4%) |
| Fuel Oil or Kerosene | 0 (0.0%) | 0 (0.0%) |
| Coal or Coke | 0 (0.0%) | 0 (0.0%) |
| All other Fuels | 0 (0.0%) | 0 (0.0%) |
| No Fuel Used | 390 (85.7%) | 389 (93.5%) |
| Total | 455 (100.0%) | 416 (100.0%) |
Household Vehicle Usage in Ciales
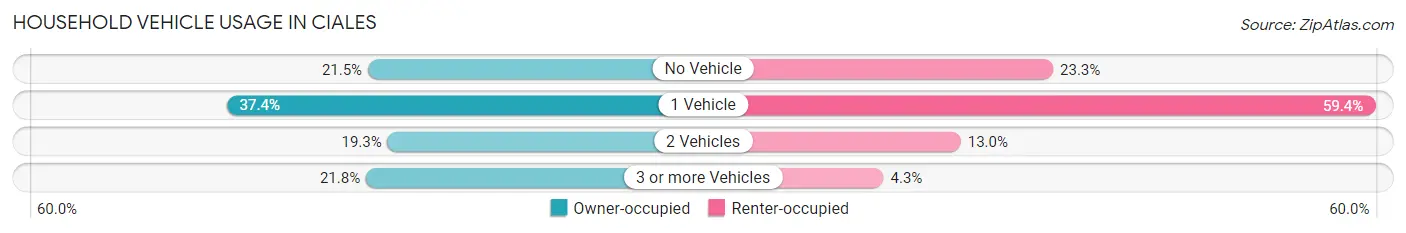
| Vehicles per Household | Owner-occupied | Renter-occupied |
| No Vehicle | 98 (21.5%) | 97 (23.3%) |
| 1 Vehicle | 170 (37.4%) | 247 (59.4%) |
| 2 Vehicles | 88 (19.3%) | 54 (13.0%) |
| 3 or more Vehicles | 99 (21.8%) | 18 (4.3%) |
| Total | 455 (100.0%) | 416 (100.0%) |
Real Estate & Mortgages in Ciales
Real Estate and Mortgage Overview in Ciales
| Characteristic | Without Mortgage | With Mortgage |
| Housing Units | 306 | 149 |
| Median Property Value | $93,400 | $108,200 |
| Median Household Income | $20,076 | $0 |
| Monthly Housing Costs | $132 | $0 |
| Real Estate Taxes | $375 | $128 |
Property Value by Mortgage Status in Ciales
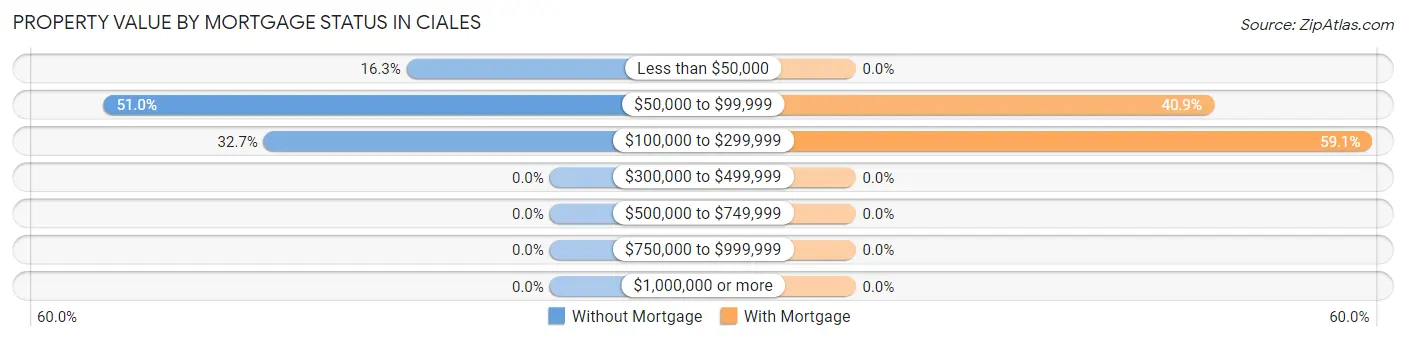
| Property Value | Without Mortgage | With Mortgage |
| Less than $50,000 | 50 (16.3%) | 0 (0.0%) |
| $50,000 to $99,999 | 156 (51.0%) | 61 (40.9%) |
| $100,000 to $299,999 | 100 (32.7%) | 88 (59.1%) |
| $300,000 to $499,999 | 0 (0.0%) | 0 (0.0%) |
| $500,000 to $749,999 | 0 (0.0%) | 0 (0.0%) |
| $750,000 to $999,999 | 0 (0.0%) | 0 (0.0%) |
| $1,000,000 or more | 0 (0.0%) | 0 (0.0%) |
| Total | 306 (100.0%) | 149 (100.0%) |
Household Income by Mortgage Status in Ciales
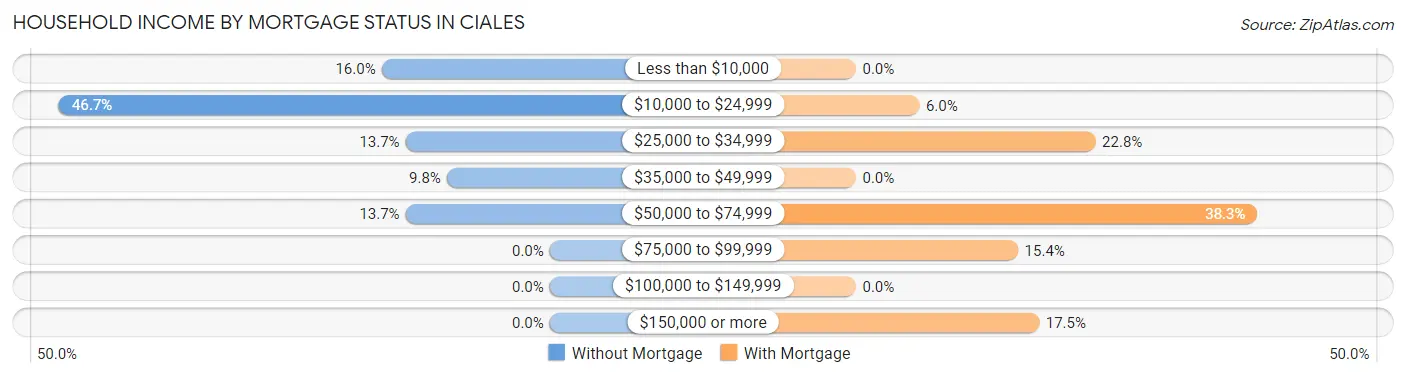
| Household Income | Without Mortgage | With Mortgage |
| Less than $10,000 | 49 (16.0%) | 0 (0.0%) |
| $10,000 to $24,999 | 143 (46.7%) | 9 (6.0%) |
| $25,000 to $34,999 | 42 (13.7%) | 34 (22.8%) |
| $35,000 to $49,999 | 30 (9.8%) | 0 (0.0%) |
| $50,000 to $74,999 | 42 (13.7%) | 57 (38.3%) |
| $75,000 to $99,999 | 0 (0.0%) | 23 (15.4%) |
| $100,000 to $149,999 | 0 (0.0%) | 0 (0.0%) |
| $150,000 or more | 0 (0.0%) | 26 (17.4%) |
| Total | 306 (100.0%) | 149 (100.0%) |
Property Value to Household Income Ratio in Ciales
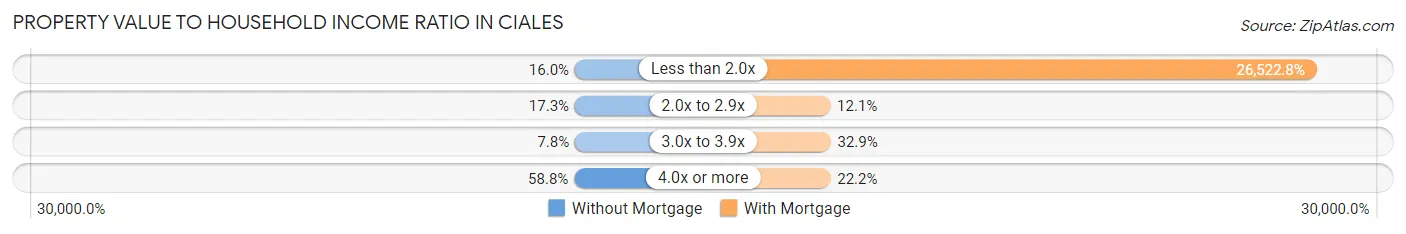
| Value-to-Income Ratio | Without Mortgage | With Mortgage |
| Less than 2.0x | 49 (16.0%) | 39,519 (26,522.8%) |
| 2.0x to 2.9x | 53 (17.3%) | 18 (12.1%) |
| 3.0x to 3.9x | 24 (7.8%) | 49 (32.9%) |
| 4.0x or more | 180 (58.8%) | 33 (22.2%) |
| Total | 306 (100.0%) | 149 (100.0%) |
Real Estate Taxes by Mortgage Status in Ciales
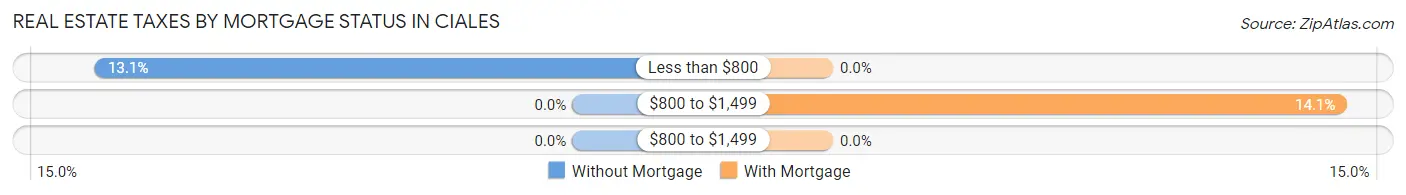
| Property Taxes | Without Mortgage | With Mortgage |
| Less than $800 | 40 (13.1%) | 0 (0.0%) |
| $800 to $1,499 | 0 (0.0%) | 21 (14.1%) |
| $800 to $1,499 | 0 (0.0%) | 0 (0.0%) |
| Total | 306 (100.0%) | 149 (100.0%) |
Health & Disability in Ciales
Health Insurance Coverage by Age in Ciales
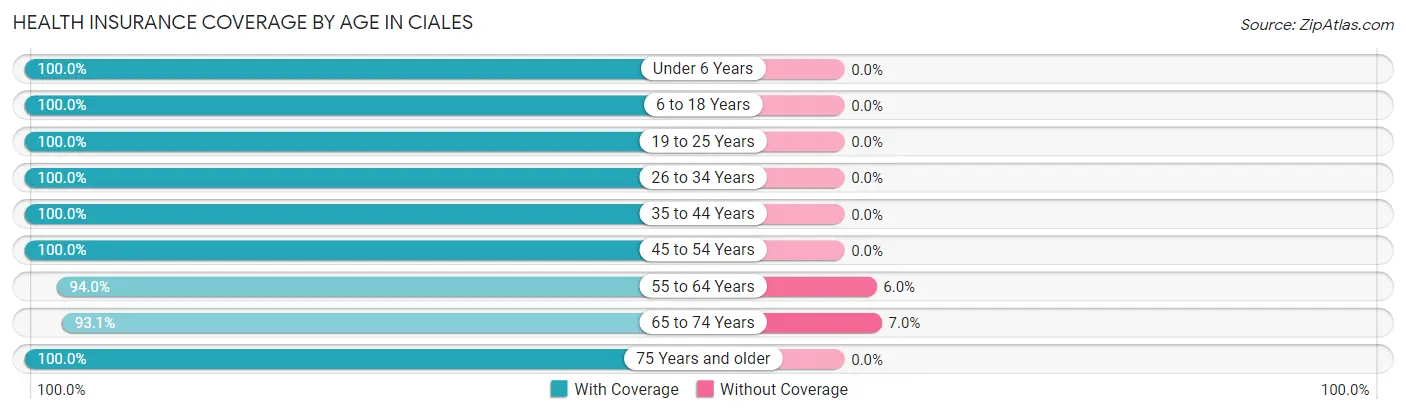
| Age Bracket | With Coverage | Without Coverage |
| Under 6 Years | 209 (100.0%) | 0 (0.0%) |
| 6 to 18 Years | 541 (100.0%) | 0 (0.0%) |
| 19 to 25 Years | 310 (100.0%) | 0 (0.0%) |
| 26 to 34 Years | 265 (100.0%) | 0 (0.0%) |
| 35 to 44 Years | 285 (100.0%) | 0 (0.0%) |
| 45 to 54 Years | 112 (100.0%) | 0 (0.0%) |
| 55 to 64 Years | 220 (94.0%) | 14 (6.0%) |
| 65 to 74 Years | 308 (93.0%) | 23 (7.0%) |
| 75 Years and older | 345 (100.0%) | 0 (0.0%) |
| Total | 2,595 (98.6%) | 37 (1.4%) |
Health Insurance Coverage by Citizenship Status in Ciales
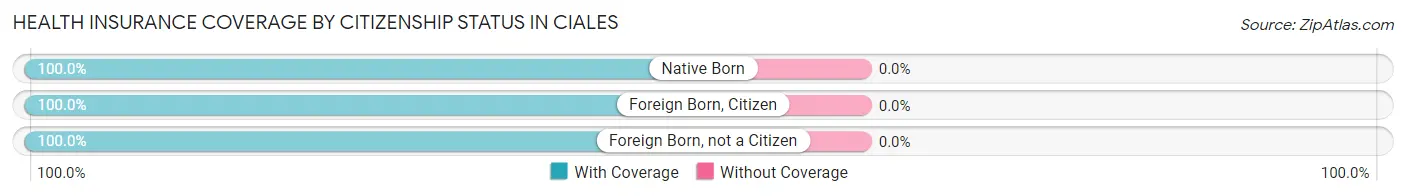
| Citizenship Status | With Coverage | Without Coverage |
| Native Born | 209 (100.0%) | 0 (0.0%) |
| Foreign Born, Citizen | 541 (100.0%) | 0 (0.0%) |
| Foreign Born, not a Citizen | 310 (100.0%) | 0 (0.0%) |
Health Insurance Coverage by Household Income in Ciales
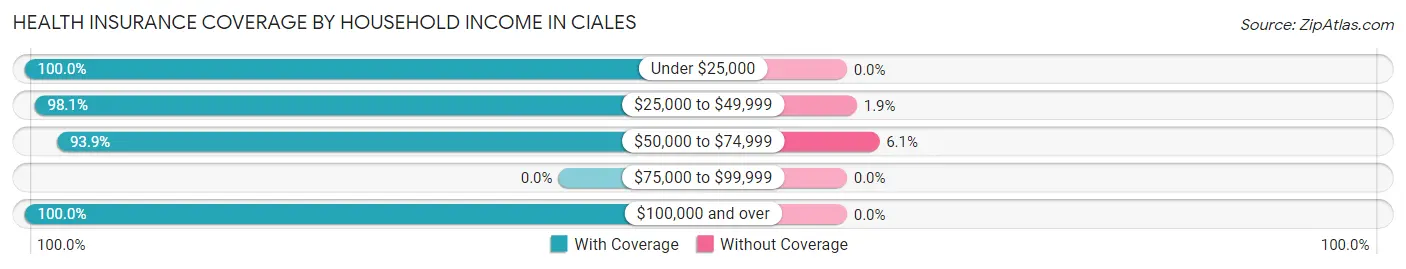
| Household Income | With Coverage | Without Coverage |
| Under $25,000 | 1,399 (100.0%) | 0 (0.0%) |
| $25,000 to $49,999 | 734 (98.1%) | 14 (1.9%) |
| $50,000 to $74,999 | 356 (93.9%) | 23 (6.1%) |
| $75,000 to $99,999 | 0 (0.0%) | 0 (0.0%) |
| $100,000 and over | 106 (100.0%) | 0 (0.0%) |
Public vs Private Health Insurance Coverage by Age in Ciales
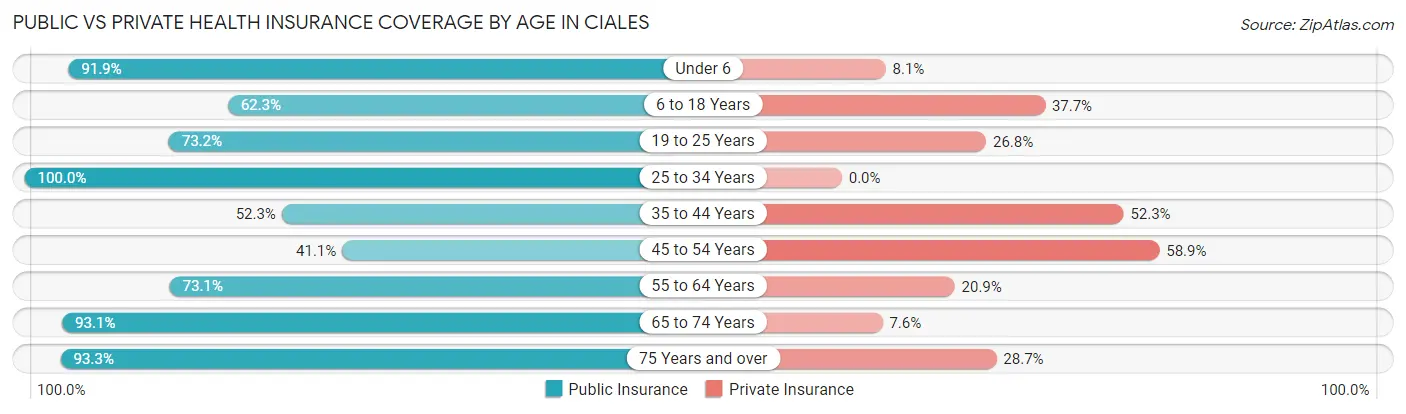
| Age Bracket | Public Insurance | Private Insurance |
| Under 6 | 192 (91.9%) | 17 (8.1%) |
| 6 to 18 Years | 337 (62.3%) | 204 (37.7%) |
| 19 to 25 Years | 227 (73.2%) | 83 (26.8%) |
| 25 to 34 Years | 265 (100.0%) | 0 (0.0%) |
| 35 to 44 Years | 149 (52.3%) | 149 (52.3%) |
| 45 to 54 Years | 46 (41.1%) | 66 (58.9%) |
| 55 to 64 Years | 171 (73.1%) | 49 (20.9%) |
| 65 to 74 Years | 308 (93.0%) | 25 (7.5%) |
| 75 Years and over | 322 (93.3%) | 99 (28.7%) |
| Total | 2,017 (76.6%) | 692 (26.3%) |
Disability Status by Sex by Age in Ciales
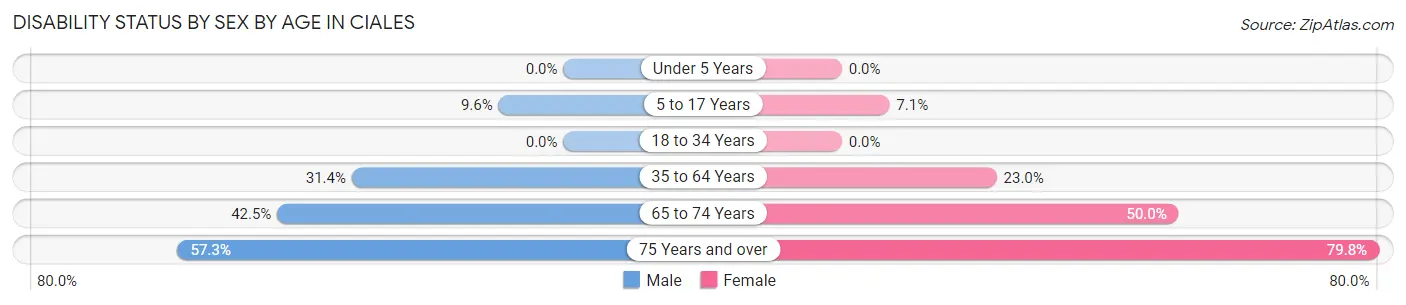
| Age Bracket | Male | Female |
| Under 5 Years | 0 (0.0%) | 0 (0.0%) |
| 5 to 17 Years | 30 (9.6%) | 13 (7.1%) |
| 18 to 34 Years | 0 (0.0%) | 0 (0.0%) |
| 35 to 64 Years | 93 (31.4%) | 77 (23.0%) |
| 65 to 74 Years | 82 (42.5%) | 69 (50.0%) |
| 75 Years and over | 59 (57.3%) | 193 (79.7%) |
Disability Class by Sex by Age in Ciales
Disability Class: Hearing Difficulty
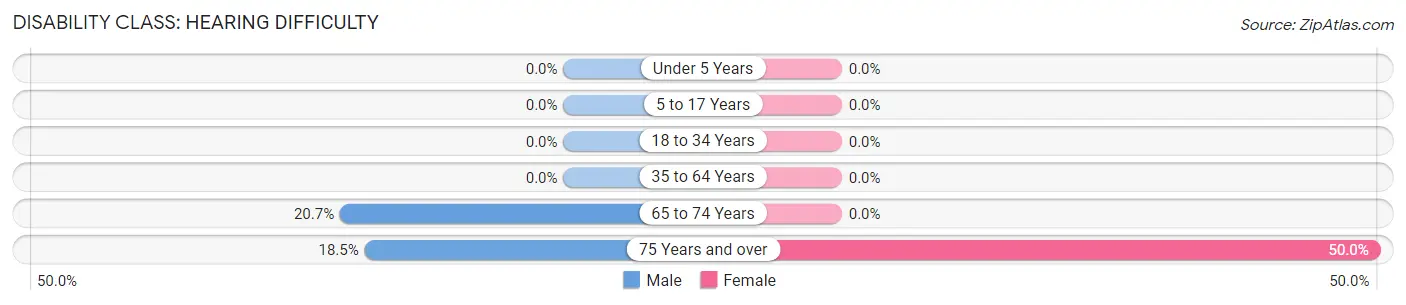
| Age Bracket | Male | Female |
| Under 5 Years | 0 (0.0%) | 0 (0.0%) |
| 5 to 17 Years | 0 (0.0%) | 0 (0.0%) |
| 18 to 34 Years | 0 (0.0%) | 0 (0.0%) |
| 35 to 64 Years | 0 (0.0%) | 0 (0.0%) |
| 65 to 74 Years | 40 (20.7%) | 0 (0.0%) |
| 75 Years and over | 19 (18.4%) | 121 (50.0%) |
Disability Class: Vision Difficulty
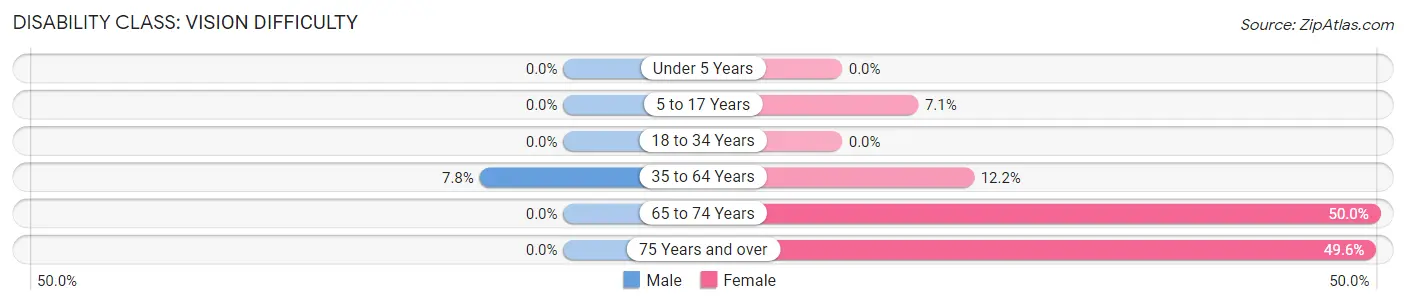
| Age Bracket | Male | Female |
| Under 5 Years | 0 (0.0%) | 0 (0.0%) |
| 5 to 17 Years | 0 (0.0%) | 13 (7.1%) |
| 18 to 34 Years | 0 (0.0%) | 0 (0.0%) |
| 35 to 64 Years | 23 (7.8%) | 41 (12.2%) |
| 65 to 74 Years | 0 (0.0%) | 69 (50.0%) |
| 75 Years and over | 0 (0.0%) | 120 (49.6%) |
Disability Class: Cognitive Difficulty
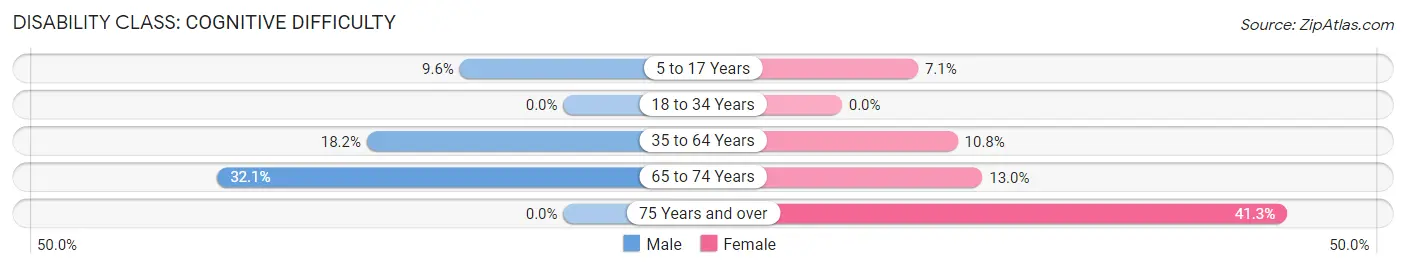
| Age Bracket | Male | Female |
| 5 to 17 Years | 30 (9.6%) | 13 (7.1%) |
| 18 to 34 Years | 0 (0.0%) | 0 (0.0%) |
| 35 to 64 Years | 54 (18.2%) | 36 (10.7%) |
| 65 to 74 Years | 62 (32.1%) | 18 (13.0%) |
| 75 Years and over | 0 (0.0%) | 100 (41.3%) |
Disability Class: Ambulatory Difficulty
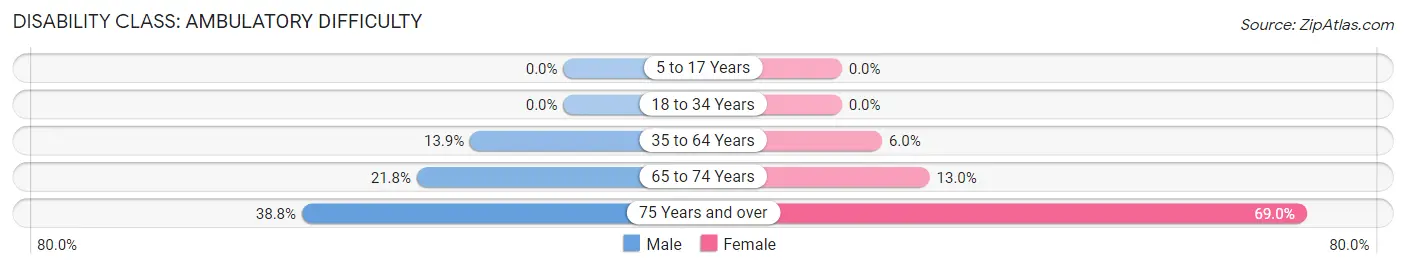
| Age Bracket | Male | Female |
| 5 to 17 Years | 0 (0.0%) | 0 (0.0%) |
| 18 to 34 Years | 0 (0.0%) | 0 (0.0%) |
| 35 to 64 Years | 41 (13.9%) | 20 (6.0%) |
| 65 to 74 Years | 42 (21.8%) | 18 (13.0%) |
| 75 Years and over | 40 (38.8%) | 167 (69.0%) |
Disability Class: Self-Care Difficulty
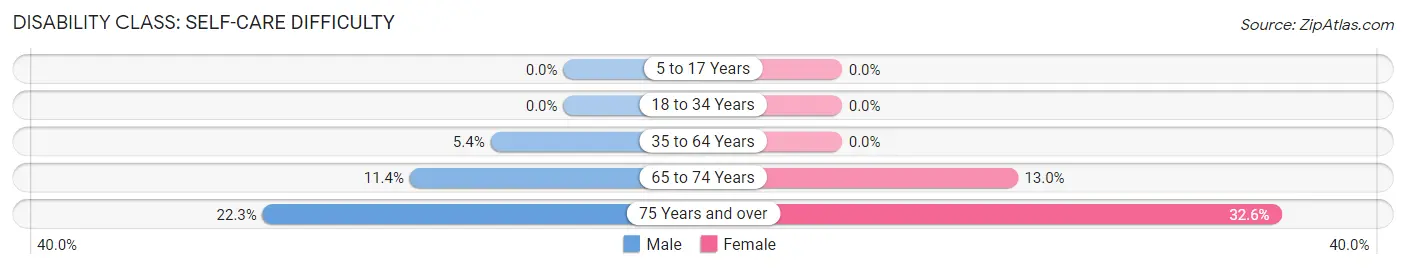
| Age Bracket | Male | Female |
| 5 to 17 Years | 0 (0.0%) | 0 (0.0%) |
| 18 to 34 Years | 0 (0.0%) | 0 (0.0%) |
| 35 to 64 Years | 16 (5.4%) | 0 (0.0%) |
| 65 to 74 Years | 22 (11.4%) | 18 (13.0%) |
| 75 Years and over | 23 (22.3%) | 79 (32.6%) |
Technology Access in Ciales
Computing Device Access in Ciales
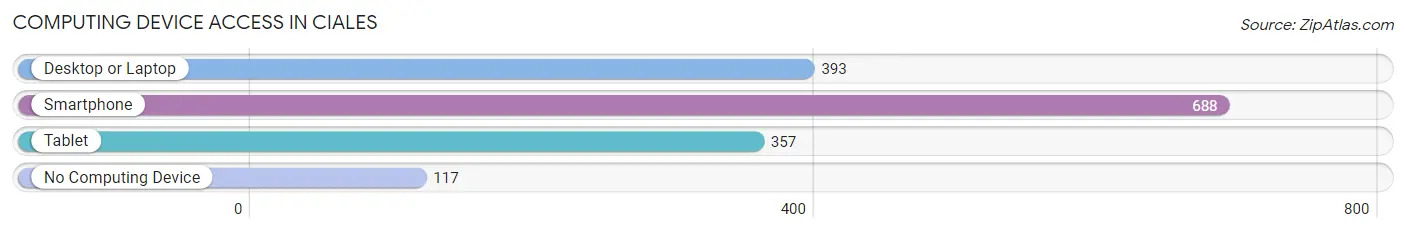
| Device Type | # Households | % Households |
| Desktop or Laptop | 393 | 45.1% |
| Smartphone | 688 | 79.0% |
| Tablet | 357 | 41.0% |
| No Computing Device | 117 | 13.4% |
| Total | 871 | 100.0% |
Internet Access in Ciales
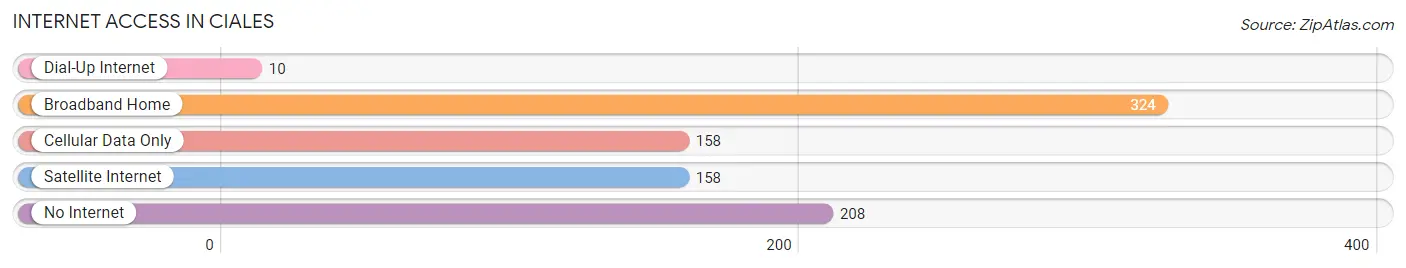
| Internet Type | # Households | % Households |
| Dial-Up Internet | 10 | 1.1% |
| Broadband Home | 324 | 37.2% |
| Cellular Data Only | 158 | 18.1% |
| Satellite Internet | 158 | 18.1% |
| No Internet | 208 | 23.9% |
| Total | 871 | 100.0% |
Ciales Summary
Ciales is a municipality located in the central mountain range of Puerto Rico. It is part of the San Juan-Caguas-Guaynabo Metropolitan Statistical Area. The town is known for its coffee production and its mountainous terrain.
History
The area of Ciales was originally inhabited by the Taíno Indians. The town was founded in 1795 by Don Francisco de Ciales y Otero. The town was named after him and was originally part of the municipality of Manatí. In 1824, Ciales was officially declared a municipality.
Geography
Ciales is located in the central mountain range of Puerto Rico. It is bordered by the municipalities of Manatí, Morovis, Orocovis, and Utuado. The town has a total area of 44.9 square miles and a population of 24,845 as of the 2010 census.
The terrain of Ciales is mostly mountainous, with the highest peak being Cerro de Punta at 1,338 meters. The town is known for its coffee production, with the majority of the coffee plantations located in the mountainous regions.
Economy
The economy of Ciales is largely based on agriculture, with coffee being the main crop. Other crops grown in the area include bananas, plantains, and yams. The town also has a small manufacturing sector, with some factories producing clothing and furniture.
Demographics
As of the 2010 census, Ciales had a population of 24,845. The population is mostly of mixed European and African descent. The town has a median household income of $14,845, which is lower than the national average. The town also has a high poverty rate, with over 40% of the population living below the poverty line.
The town has a high rate of unemployment, with over 20% of the population unemployed. The town also has a high rate of illiteracy, with over 30% of the population not having completed high school.
Conclusion
Ciales is a municipality located in the central mountain range of Puerto Rico. It is known for its coffee production and its mountainous terrain. The economy of Ciales is largely based on agriculture, with coffee being the main crop. The population is mostly of mixed European and African descent, and the town has a high poverty rate and a high rate of unemployment.
Common Questions
What is Per Capita Income in Ciales?
Per Capita income in Ciales is $8,722.
What is the Median Family Income in Ciales?
Median Family Income in Ciales is $25,429.
What is the Median Household income in Ciales?
Median Household Income in Ciales is $19,004.
What is Inequality or Gini Index in Ciales?
Inequality or Gini Index in Ciales is 0.45.
What is the Total Population of Ciales?
Total Population of Ciales is 2,634.
What is the Total Male Population of Ciales?
Total Male Population of Ciales is 1,346.
What is the Total Female Population of Ciales?
Total Female Population of Ciales is 1,288.
What is the Ratio of Males per 100 Females in Ciales?
There are 104.50 Males per 100 Females in Ciales.
What is the Ratio of Females per 100 Males in Ciales?
There are 95.69 Females per 100 Males in Ciales.
What is the Median Population Age in Ciales?
Median Population Age in Ciales is 33.7 Years.
What is the Average Family Size in Ciales
Average Family Size in Ciales is 3.8 People.
What is the Average Household Size in Ciales
Average Household Size in Ciales is 3.0 People.
How Large is the Labor Force in Ciales?
There are 801 People in the Labor Forcein in Ciales.
What is the Percentage of People in the Labor Force in Ciales?
41.1% of People are in the Labor Force in Ciales.
What is the Unemployment Rate in Ciales?
Unemployment Rate in Ciales is 20.1%.