Zip Codes with the Highest Percentage of Mexican Population in Bayamon, PR
RELATED REPORTS & OPTIONS
Mexican
Bayamon
Compare Zip Codes
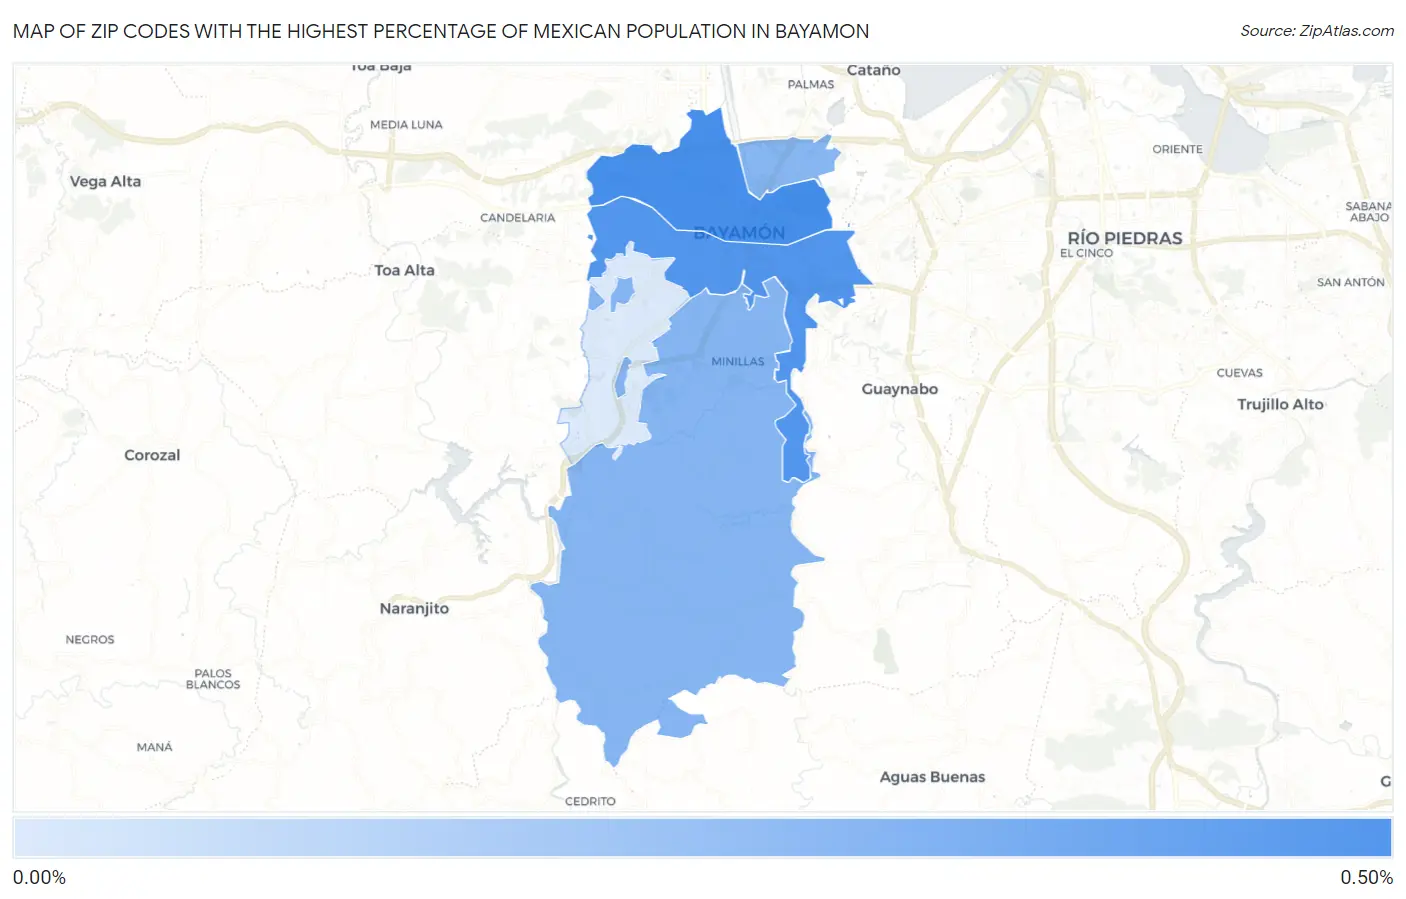
Map of Zip Codes with the Highest Percentage of Mexican Population in Bayamon
0.061%
0.42%
Zip Codes with the Highest Percentage of Mexican Population in Bayamon, PR
| Zip Code | Mexican | vs State | vs National | |
| 1. | 00961 | 0.42% | 0.24%(+0.181)#21 | 11.22%(-10.8)#21,450 |
| 2. | 00959 | 0.39% | 0.24%(+0.150)#24 | 11.22%(-10.8)#21,634 |
| 3. | 00956 | 0.27% | 0.24%(+0.034)#40 | 11.22%(-10.9)#22,457 |
| 4. | 00960 | 0.26% | 0.24%(+0.025)#42 | 11.22%(-11.0)#22,509 |
| 5. | 00957 | 0.061% | 0.24%(-0.179)#83 | 11.22%(-11.2)#23,872 |
1
Common Questions
What are the Top 3 Zip Codes with the Highest Percentage of Mexican Population in Bayamon, PR?
Top 3 Zip Codes with the Highest Percentage of Mexican Population in Bayamon, PR are:
What zip code has the Highest Percentage of Mexican Population in Bayamon, PR?
00961 has the Highest Percentage of Mexican Population in Bayamon, PR with 0.42%.
What is the Percentage of Mexican Population in Puerto Rico?
Percentage of Mexican Population in Puerto Rico is 0.24%.
What is the Percentage of Mexican Population in the United States?
Percentage of Mexican Population in the United States is 11.22%.