Patillas, PR Map & Demographics
Patillas Map
Patillas Overview
$11,286
PER CAPITA INCOME
$21,206
AVG FAMILY INCOME
$14,219
AVG HOUSEHOLD INCOME
17.0%
WAGE / INCOME GAP [ % ]
83.0¢/ $1
WAGE / INCOME GAP [ $ ]
0.53
INEQUALITY / GINI INDEX
2,955
TOTAL POPULATION
1,356
MALE POPULATION
1,599
FEMALE POPULATION
84.80
MALES / 100 FEMALES
117.92
FEMALES / 100 MALES
52.3
MEDIAN AGE
3.1
AVG FAMILY SIZE
2.2
AVG HOUSEHOLD SIZE
826
LABOR FORCE [ PEOPLE ]
33.9%
PERCENT IN LABOR FORCE
10.3%
UNEMPLOYMENT RATE
Patillas Zip Codes
Income in Patillas
Income Overview in Patillas
Per Capita Income in Patillas is $11,286, while median incomes of families and households are $21,206 and $14,219 respectively.
| Characteristic | Number | Measure |
| Per Capita Income | 2,955 | $11,286 |
| Median Family Income | 729 | $21,206 |
| Mean Family Income | 729 | $30,169 |
| Median Household Income | 1,343 | $14,219 |
| Mean Household Income | 1,343 | $22,053 |
| Income Deficit | 729 | $0 |
| Wage / Income Gap (%) | 2,955 | 16.97% |
| Wage / Income Gap ($) | 2,955 | 83.03¢ per $1 |
| Gini / Inequality Index | 2,955 | 0.53 |
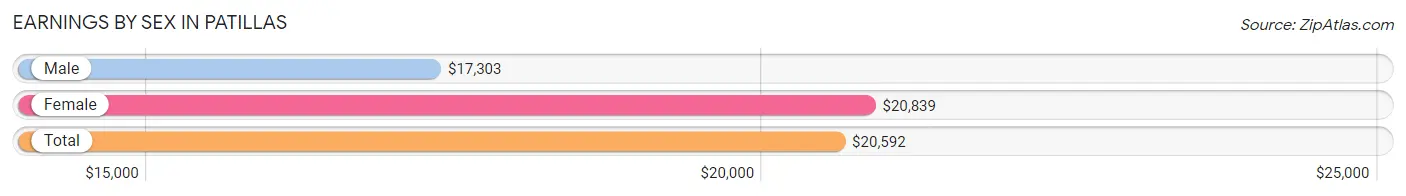
Earnings by Sex in Patillas
Average Earnings in Patillas are $20,592, $17,303 for men and $20,839 for women, a difference of 17.0%.
| Sex | Number | Average Earnings |
| Male | 405 (47.8%) | $17,303 |
| Female | 443 (52.2%) | $20,839 |
| Total | 848 (100.0%) | $20,592 |
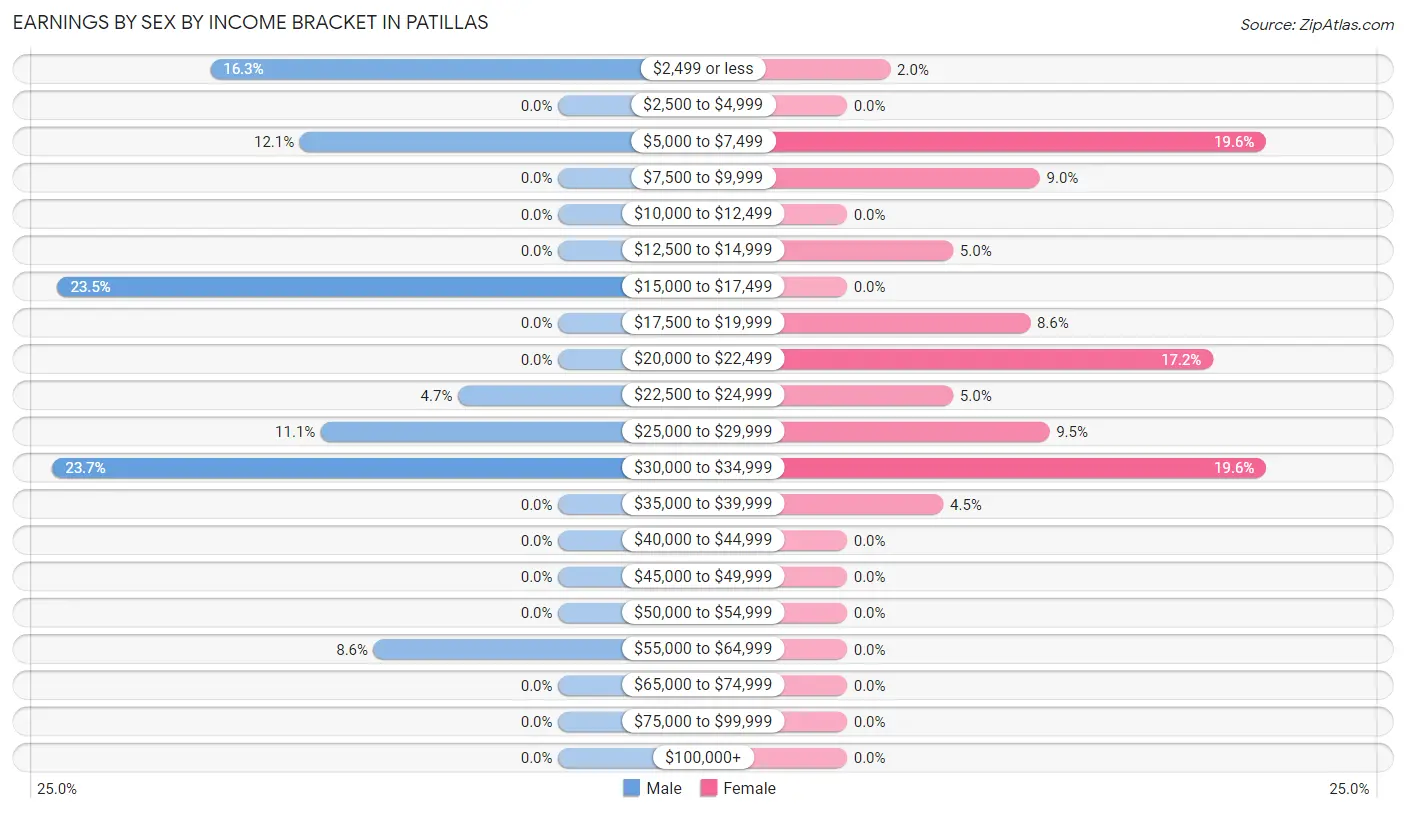
Earnings by Sex by Income Bracket in Patillas
The most common earnings brackets in Patillas are $30,000 to $34,999 for men (96 | 23.7%) and $5,000 to $7,499 for women (87 | 19.6%).
| Income | Male | Female |
| $2,499 or less | 66 (16.3%) | 9 (2.0%) |
| $2,500 to $4,999 | 0 (0.0%) | 0 (0.0%) |
| $5,000 to $7,499 | 49 (12.1%) | 87 (19.6%) |
| $7,500 to $9,999 | 0 (0.0%) | 40 (9.0%) |
| $10,000 to $12,499 | 0 (0.0%) | 0 (0.0%) |
| $12,500 to $14,999 | 0 (0.0%) | 22 (5.0%) |
| $15,000 to $17,499 | 95 (23.5%) | 0 (0.0%) |
| $17,500 to $19,999 | 0 (0.0%) | 38 (8.6%) |
| $20,000 to $22,499 | 0 (0.0%) | 76 (17.2%) |
| $22,500 to $24,999 | 19 (4.7%) | 22 (5.0%) |
| $25,000 to $29,999 | 45 (11.1%) | 42 (9.5%) |
| $30,000 to $34,999 | 96 (23.7%) | 87 (19.6%) |
| $35,000 to $39,999 | 0 (0.0%) | 20 (4.5%) |
| $40,000 to $44,999 | 0 (0.0%) | 0 (0.0%) |
| $45,000 to $49,999 | 0 (0.0%) | 0 (0.0%) |
| $50,000 to $54,999 | 0 (0.0%) | 0 (0.0%) |
| $55,000 to $64,999 | 35 (8.6%) | 0 (0.0%) |
| $65,000 to $74,999 | 0 (0.0%) | 0 (0.0%) |
| $75,000 to $99,999 | 0 (0.0%) | 0 (0.0%) |
| $100,000+ | 0 (0.0%) | 0 (0.0%) |
| Total | 405 (100.0%) | 443 (100.0%) |
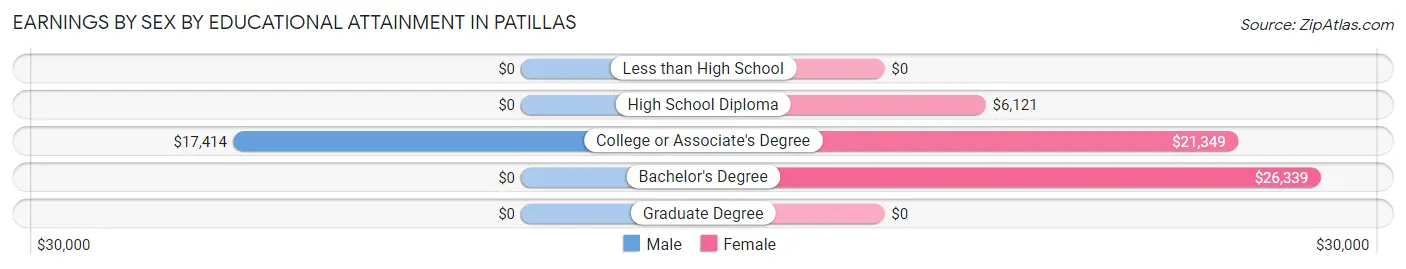
Earnings by Sex by Educational Attainment in Patillas
Average earnings in Patillas are $24,079 for men and $20,839 for women, a difference of 13.5%. Men with an educational attainment of college or associate's degree enjoy the highest average annual earnings of $17,414, while those with college or associate's degree education earn the least with $17,414. Women with an educational attainment of bachelor's degree earn the most with the average annual earnings of $26,339, while those with high school diploma education have the smallest earnings of $6,121.
| Educational Attainment | Male Income | Female Income |
| Less than High School | - | - |
| High School Diploma | - | - |
| College or Associate's Degree | $17,414 | $21,349 |
| Bachelor's Degree | - | - |
| Graduate Degree | - | - |
| Total | $24,079 | $20,839 |
Family Income in Patillas
Family Income Brackets in Patillas
According to the Patillas family income data, there are 204 families falling into the less than $10,000 income range, which is the most common income bracket and makes up 28.0% of all families.
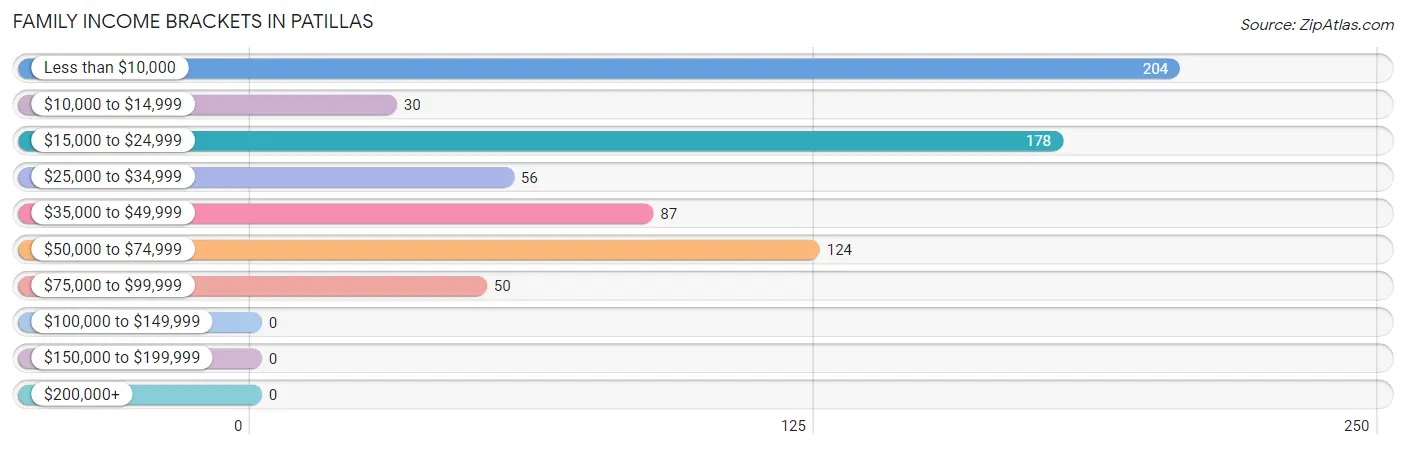
| Income Bracket | # Families | % Families |
| Less than $10,000 | 204 | 28.0% |
| $10,000 to $14,999 | 30 | 4.1% |
| $15,000 to $24,999 | 178 | 24.4% |
| $25,000 to $34,999 | 56 | 7.7% |
| $35,000 to $49,999 | 87 | 11.9% |
| $50,000 to $74,999 | 124 | 17.0% |
| $75,000 to $99,999 | 50 | 6.9% |
| $100,000 to $149,999 | 0 | 0.0% |
| $150,000 to $199,999 | 0 | 0.0% |
| $200,000+ | 0 | 0.0% |
Family Income by Famaliy Size in Patillas
3-person families (210 | 28.8%) account for the highest median family income in Patillas with $55,952 per family, while 3-person families (210 | 28.8%) have the highest median income of $18,651 per family member.
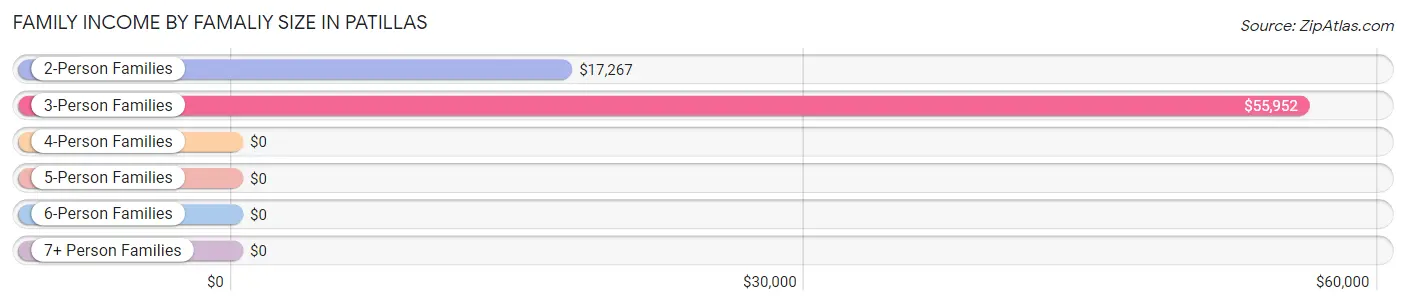
| Income Bracket | # Families | Median Income |
| 2-Person Families | 418 (57.3%) | $17,267 |
| 3-Person Families | 210 (28.8%) | $55,952 |
| 4-Person Families | 78 (10.7%) | $0 |
| 5-Person Families | 0 (0.0%) | $0 |
| 6-Person Families | 23 (3.2%) | $0 |
| 7+ Person Families | 0 (0.0%) | $0 |
| Total | 729 (100.0%) | $21,206 |
Family Income by Number of Earners in Patillas
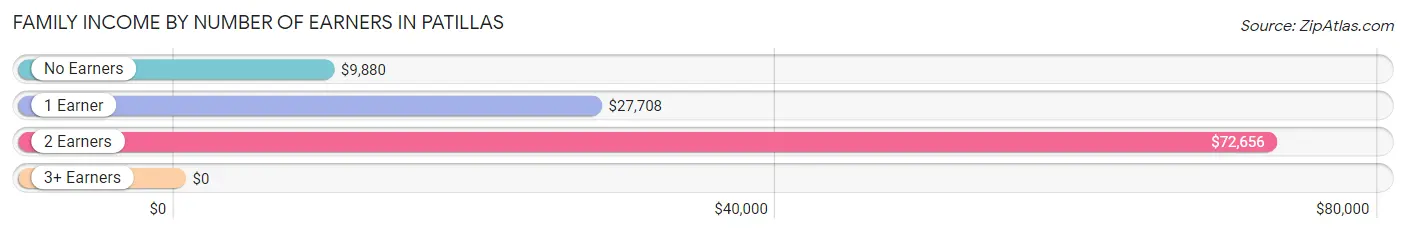
| Number of Earners | # Families | Median Income |
| No Earners | 351 (48.1%) | $9,880 |
| 1 Earner | 227 (31.1%) | $27,708 |
| 2 Earners | 130 (17.8%) | $72,656 |
| 3+ Earners | 21 (2.9%) | $0 |
| Total | 729 (100.0%) | $21,206 |
Household Income in Patillas
Household Income Brackets in Patillas
With 513 households falling in the category, the less than $10,000 income range is the most frequent in Patillas, accounting for 38.2% of all households.
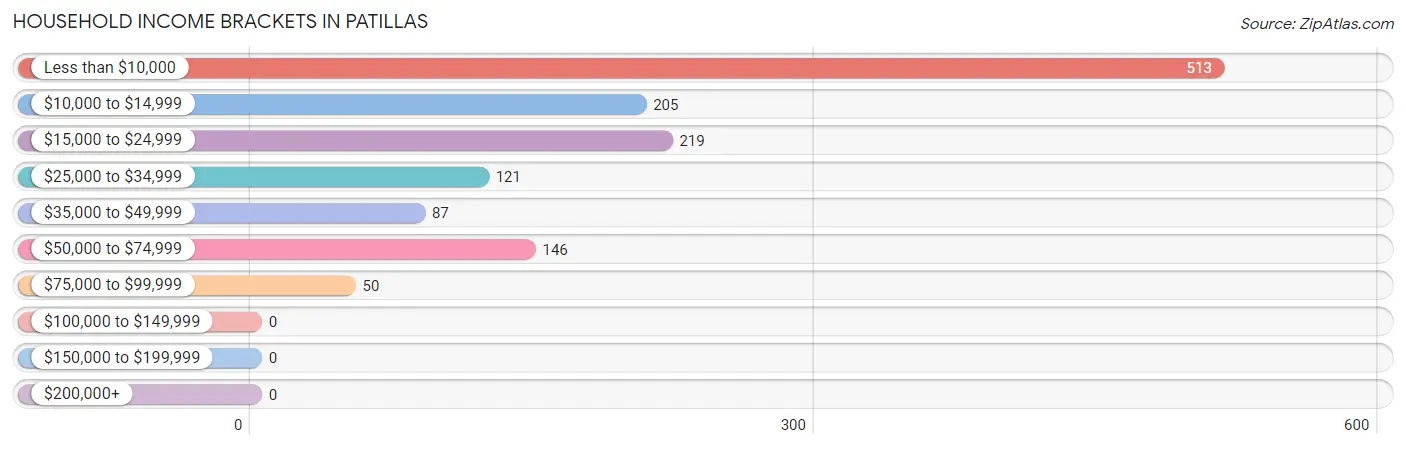
| Income Bracket | # Households | % Households |
| Less than $10,000 | 513 | 38.2% |
| $10,000 to $14,999 | 205 | 15.3% |
| $15,000 to $24,999 | 219 | 16.3% |
| $25,000 to $34,999 | 121 | 9.0% |
| $35,000 to $49,999 | 87 | 6.5% |
| $50,000 to $74,999 | 146 | 10.9% |
| $75,000 to $99,999 | 50 | 3.7% |
| $100,000 to $149,999 | 0 | 0.0% |
| $150,000 to $199,999 | 0 | 0.0% |
| $200,000+ | 0 | 0.0% |
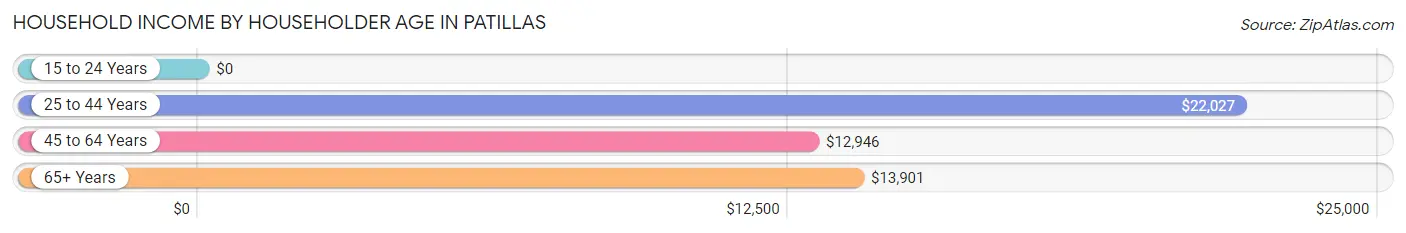
Household Income by Householder Age in Patillas
The median household income in Patillas is $14,219, with the highest median household income of $22,027 found in the 25 to 44 years age bracket for the primary householder. A total of 274 households (20.4%) fall into this category.
| Income Bracket | # Households | Median Income |
| 15 to 24 Years | 0 (0.0%) | $0 |
| 25 to 44 Years | 274 (20.4%) | $22,027 |
| 45 to 64 Years | 498 (37.1%) | $12,946 |
| 65+ Years | 571 (42.5%) | $13,901 |
| Total | 1,343 (100.0%) | $14,219 |
Poverty in Patillas
Income Below Poverty by Sex and Age in Patillas
With 58.5% poverty level for males and 53.2% for females among the residents of Patillas, under 5 year old males and under 5 year old females are the most vulnerable to poverty, with 129 males (100.0%) and 27 females (100.0%) in their respective age groups living below the poverty level.
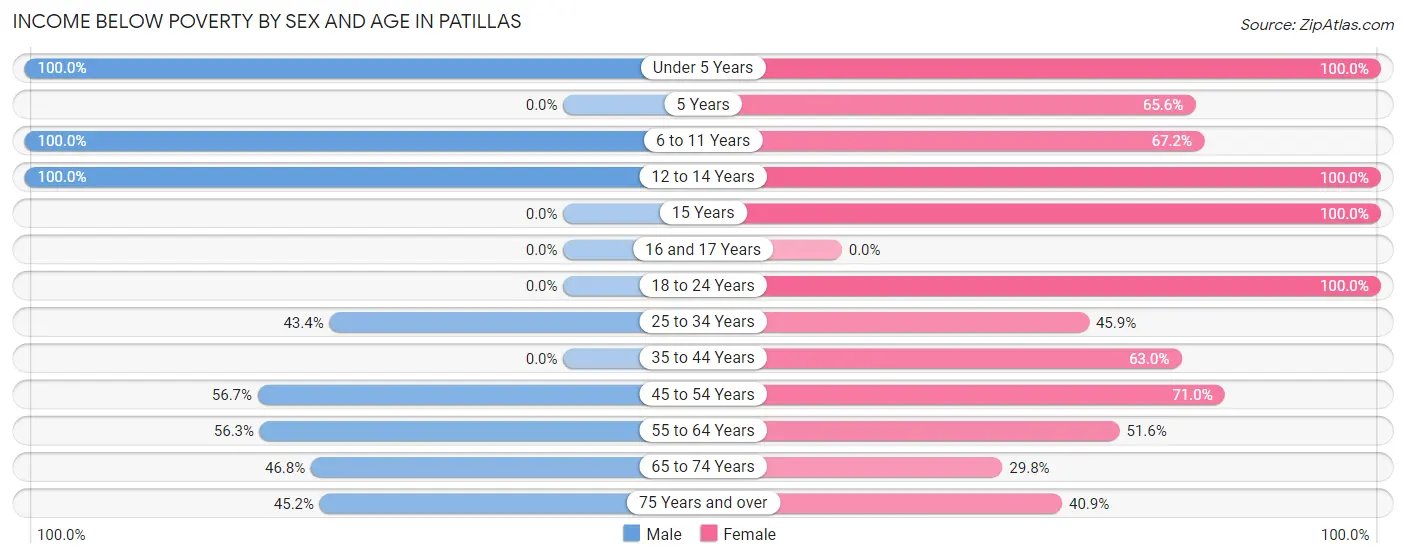
| Age Bracket | Male | Female |
| Under 5 Years | 129 (100.0%) | 27 (100.0%) |
| 5 Years | 0 (0.0%) | 40 (65.6%) |
| 6 to 11 Years | 134 (100.0%) | 43 (67.2%) |
| 12 to 14 Years | 22 (100.0%) | 22 (100.0%) |
| 15 Years | 0 (0.0%) | 59 (100.0%) |
| 16 and 17 Years | 0 (0.0%) | 0 (0.0%) |
| 18 to 24 Years | 0 (0.0%) | 18 (100.0%) |
| 25 to 34 Years | 79 (43.4%) | 128 (45.9%) |
| 35 to 44 Years | 0 (0.0%) | 63 (63.0%) |
| 45 to 54 Years | 148 (56.7%) | 103 (71.0%) |
| 55 to 64 Years | 138 (56.3%) | 165 (51.6%) |
| 65 to 74 Years | 96 (46.8%) | 62 (29.8%) |
| 75 Years and over | 47 (45.2%) | 121 (40.9%) |
| Total | 793 (58.5%) | 851 (53.2%) |
Income Above Poverty by Sex and Age in Patillas
According to the poverty statistics in Patillas, males aged 18 to 24 years and females aged 65 to 74 years are the age groups that are most secure financially, with 100.0% of males and 70.2% of females in these age groups living above the poverty line.
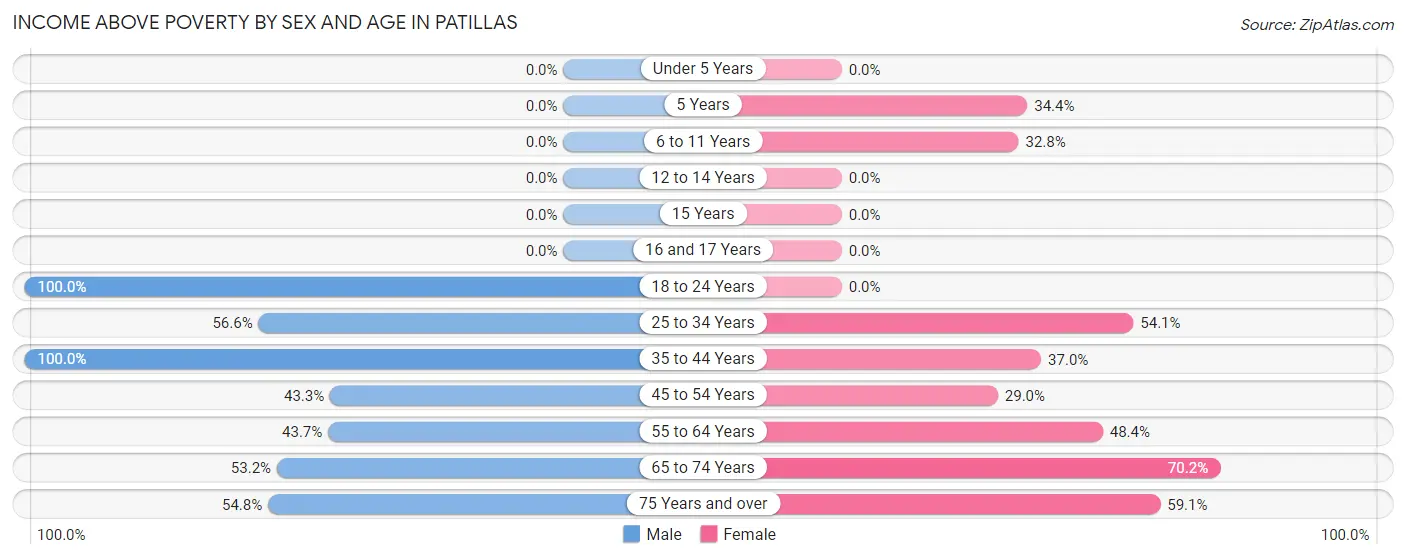
| Age Bracket | Male | Female |
| Under 5 Years | 0 (0.0%) | 0 (0.0%) |
| 5 Years | 0 (0.0%) | 21 (34.4%) |
| 6 to 11 Years | 0 (0.0%) | 21 (32.8%) |
| 12 to 14 Years | 0 (0.0%) | 0 (0.0%) |
| 15 Years | 0 (0.0%) | 0 (0.0%) |
| 16 and 17 Years | 0 (0.0%) | 0 (0.0%) |
| 18 to 24 Years | 39 (100.0%) | 0 (0.0%) |
| 25 to 34 Years | 103 (56.6%) | 151 (54.1%) |
| 35 to 44 Years | 35 (100.0%) | 37 (37.0%) |
| 45 to 54 Years | 113 (43.3%) | 42 (29.0%) |
| 55 to 64 Years | 107 (43.7%) | 155 (48.4%) |
| 65 to 74 Years | 109 (53.2%) | 146 (70.2%) |
| 75 Years and over | 57 (54.8%) | 175 (59.1%) |
| Total | 563 (41.5%) | 748 (46.8%) |
Income Below Poverty Among Married-Couple Families in Patillas
The poverty statistics for married-couple families in Patillas show that 41.2% or 141 of the total 342 families live below the poverty line. Families with 1 or 2 children have the highest poverty rate of 51.1%, comprising of 23 families. On the other hand, families with no children have the lowest poverty rate of 39.7%, which includes 118 families.
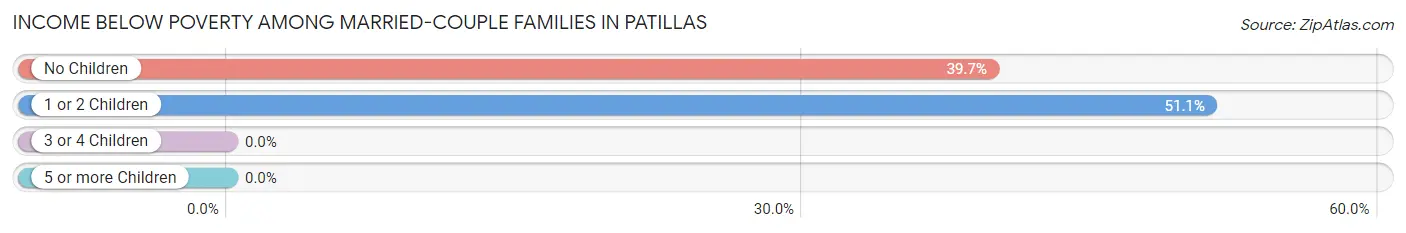
| Children | Above Poverty | Below Poverty |
| No Children | 179 (60.3%) | 118 (39.7%) |
| 1 or 2 Children | 22 (48.9%) | 23 (51.1%) |
| 3 or 4 Children | 0 (0.0%) | 0 (0.0%) |
| 5 or more Children | 0 (0.0%) | 0 (0.0%) |
| Total | 201 (58.8%) | 141 (41.2%) |
Income Below Poverty Among Single-Parent Households in Patillas
According to the poverty data in Patillas, 60.0% or 63 single-father households and 61.7% or 174 single-mother households are living below the poverty line. Among single-father households, those with 1 or 2 children have the highest poverty rate, with 26 households (100.0%) experiencing poverty. Likewise, among single-mother households, those with 3 or 4 children have the highest poverty rate, with 41 households (100.0%) falling below the poverty line.
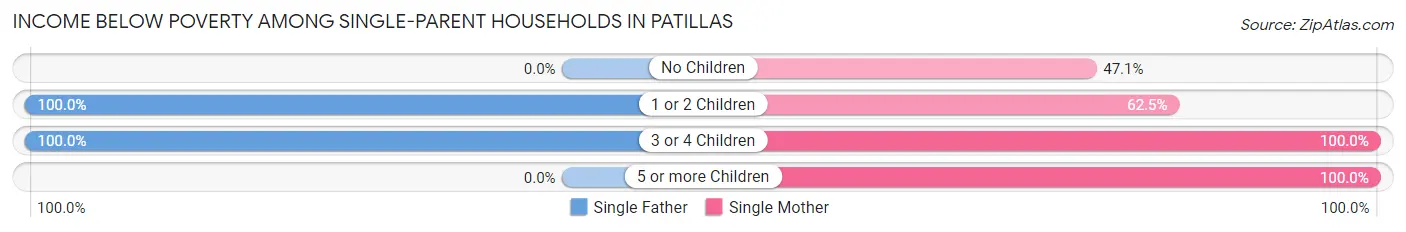
| Children | Single Father | Single Mother |
| No Children | 0 (0.0%) | 80 (47.1%) |
| 1 or 2 Children | 26 (100.0%) | 30 (62.5%) |
| 3 or 4 Children | 37 (100.0%) | 41 (100.0%) |
| 5 or more Children | 0 (0.0%) | 23 (100.0%) |
| Total | 63 (60.0%) | 174 (61.7%) |
Income Below Poverty Among Married-Couple vs Single-Parent Households in Patillas
The poverty data for Patillas shows that 141 of the married-couple family households (41.2%) and 237 of the single-parent households (61.2%) are living below the poverty level. Within the married-couple family households, those with 1 or 2 children have the highest poverty rate, with 23 households (51.1%) falling below the poverty line. Among the single-parent households, those with 3 or 4 children have the highest poverty rate, with 78 household (100.0%) living below poverty.
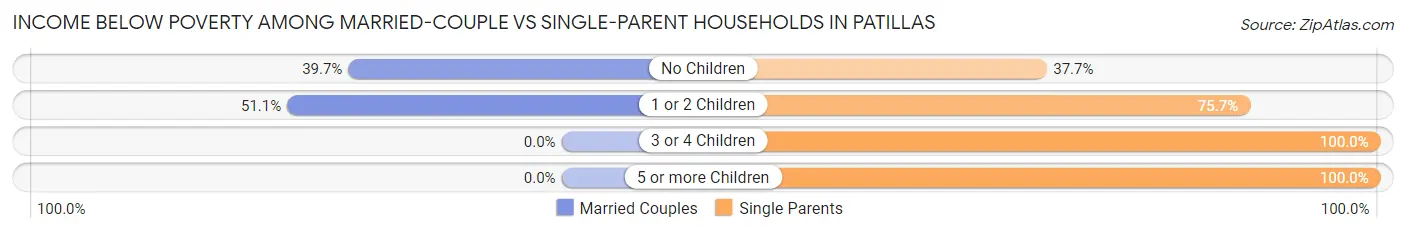
| Children | Married-Couple Families | Single-Parent Households |
| No Children | 118 (39.7%) | 80 (37.7%) |
| 1 or 2 Children | 23 (51.1%) | 56 (75.7%) |
| 3 or 4 Children | 0 (0.0%) | 78 (100.0%) |
| 5 or more Children | 0 (0.0%) | 23 (100.0%) |
| Total | 141 (41.2%) | 237 (61.2%) |
Race in Patillas
The most populous races in Patillas are Hispanic or Latino (2,955 | 100.0%), Some other Race (1,680 | 56.9%), and Black / African American (952 | 32.2%).
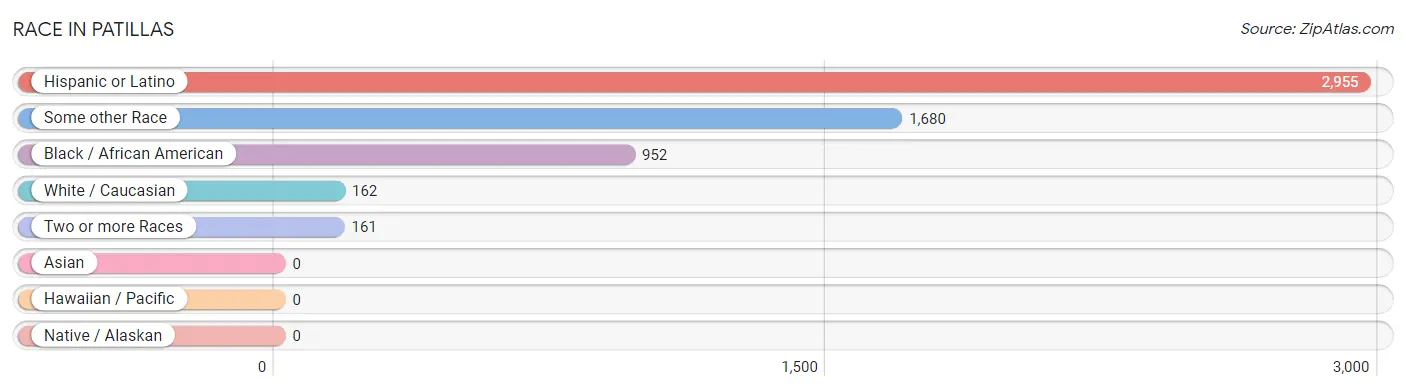
| Race | # Population | % Population |
| Asian | 0 | 0.0% |
| Black / African American | 952 | 32.2% |
| Hawaiian / Pacific | 0 | 0.0% |
| Hispanic or Latino | 2,955 | 100.0% |
| Native / Alaskan | 0 | 0.0% |
| White / Caucasian | 162 | 5.5% |
| Two or more Races | 161 | 5.4% |
| Some other Race | 1,680 | 56.9% |
| Total | 2,955 | 100.0% |
Ancestry in Patillas
The most populous ancestries reported in Patillas are Puerto Rican (2,897 | 98.0%), Cuban (35 | 1.2%), and Mexican (23 | 0.8%), together accounting for 100.0% of all Patillas residents.
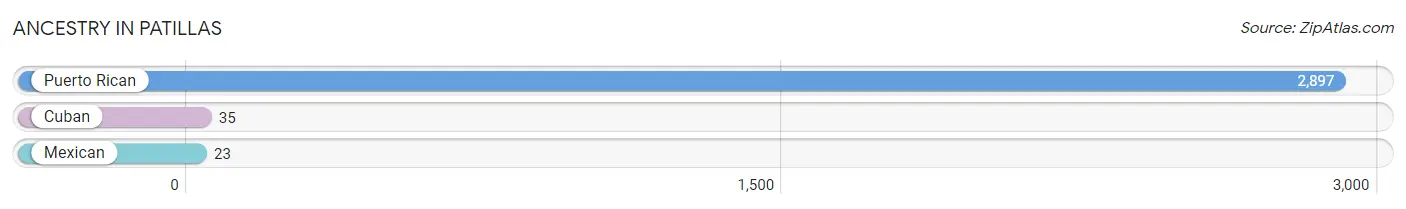
| Ancestry | # Population | % Population |
| Cuban | 35 | 1.2% |
| Mexican | 23 | 0.8% |
| Puerto Rican | 2,897 | 98.0% | View All 3 Rows |
Immigrants in Patillas

| Immigration Origin | # Population | % Population | View All 0 Rows |
Sex and Age in Patillas
Sex and Age in Patillas
The most populous age groups in Patillas are 45 to 49 Years (152 | 11.2%) for men and 60 to 64 Years (203 | 12.7%) for women.
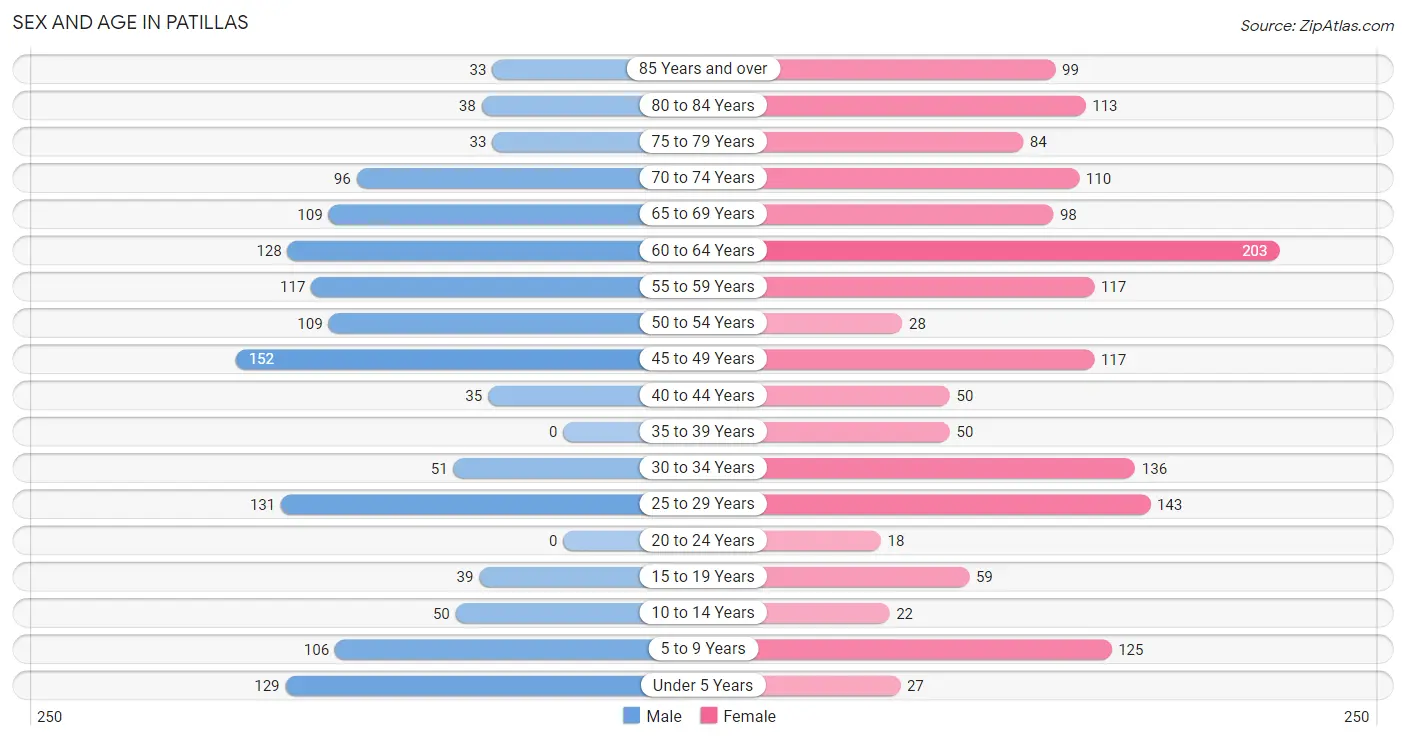
| Age Bracket | Male | Female |
| Under 5 Years | 129 (9.5%) | 27 (1.7%) |
| 5 to 9 Years | 106 (7.8%) | 125 (7.8%) |
| 10 to 14 Years | 50 (3.7%) | 22 (1.4%) |
| 15 to 19 Years | 39 (2.9%) | 59 (3.7%) |
| 20 to 24 Years | 0 (0.0%) | 18 (1.1%) |
| 25 to 29 Years | 131 (9.7%) | 143 (8.9%) |
| 30 to 34 Years | 51 (3.8%) | 136 (8.5%) |
| 35 to 39 Years | 0 (0.0%) | 50 (3.1%) |
| 40 to 44 Years | 35 (2.6%) | 50 (3.1%) |
| 45 to 49 Years | 152 (11.2%) | 117 (7.3%) |
| 50 to 54 Years | 109 (8.0%) | 28 (1.8%) |
| 55 to 59 Years | 117 (8.6%) | 117 (7.3%) |
| 60 to 64 Years | 128 (9.4%) | 203 (12.7%) |
| 65 to 69 Years | 109 (8.0%) | 98 (6.1%) |
| 70 to 74 Years | 96 (7.1%) | 110 (6.9%) |
| 75 to 79 Years | 33 (2.4%) | 84 (5.2%) |
| 80 to 84 Years | 38 (2.8%) | 113 (7.1%) |
| 85 Years and over | 33 (2.4%) | 99 (6.2%) |
| Total | 1,356 (100.0%) | 1,599 (100.0%) |
Families and Households in Patillas
Median Family Size in Patillas
The median family size in Patillas is 3.10 persons per family, with single male/father families (105 | 14.4%) accounting for the largest median family size of 3.63 persons per family. On the other hand, married-couple families (342 | 46.9%) represent the smallest median family size with 2.58 persons per family.
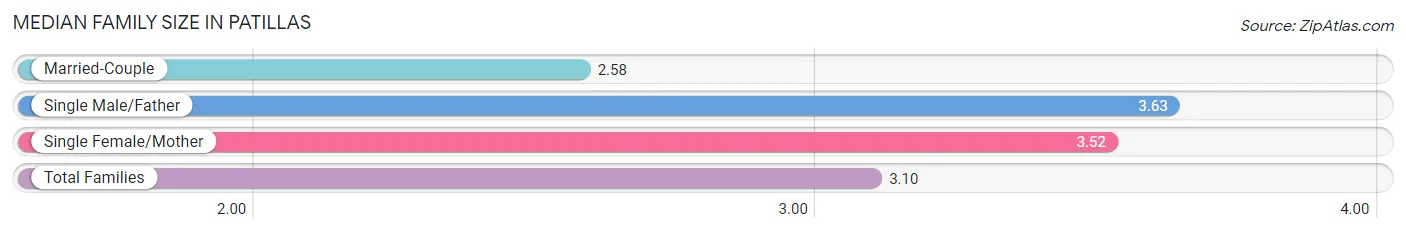
| Family Type | # Families | Family Size |
| Married-Couple | 342 (46.9%) | 2.58 |
| Single Male/Father | 105 (14.4%) | 3.63 |
| Single Female/Mother | 282 (38.7%) | 3.52 |
| Total Families | 729 (100.0%) | 3.10 |
Median Household Size in Patillas
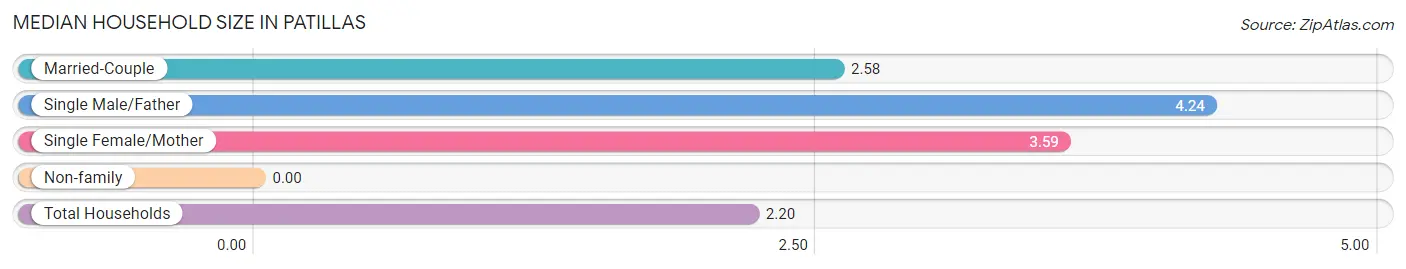
| Household Type | # Households | Household Size |
| Married-Couple | 342 (25.5%) | 2.58 |
| Single Male/Father | 105 (7.8%) | 4.24 |
| Single Female/Mother | 282 (21.0%) | 3.59 |
| Non-family | 614 (45.7%) | - |
| Total Households | 1,343 (100.0%) | 2.20 |
Household Size by Marriage Status in Patillas
Out of a total of 1,343 households in Patillas, 729 (54.3%) are family households, while 614 (45.7%) are nonfamily households. The most numerous type of family households are 2-person households, comprising 392, and the most common type of nonfamily households are 1-person households, comprising 614.
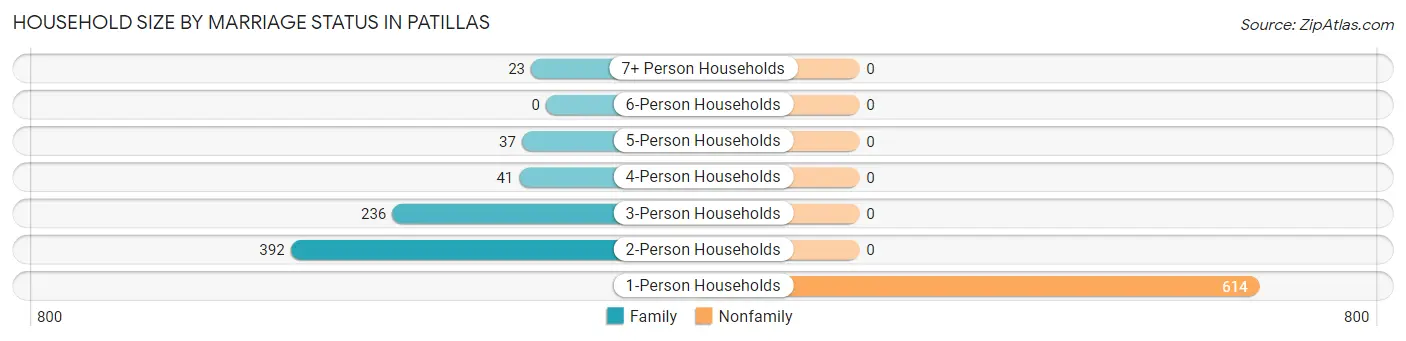
| Household Size | Family Households | Nonfamily Households |
| 1-Person Households | - | 614 (45.7%) |
| 2-Person Households | 392 (29.2%) | 0 (0.0%) |
| 3-Person Households | 236 (17.6%) | 0 (0.0%) |
| 4-Person Households | 41 (3.0%) | 0 (0.0%) |
| 5-Person Households | 37 (2.8%) | 0 (0.0%) |
| 6-Person Households | 0 (0.0%) | 0 (0.0%) |
| 7+ Person Households | 23 (1.7%) | 0 (0.0%) |
| Total | 729 (54.3%) | 614 (45.7%) |
Female Fertility in Patillas
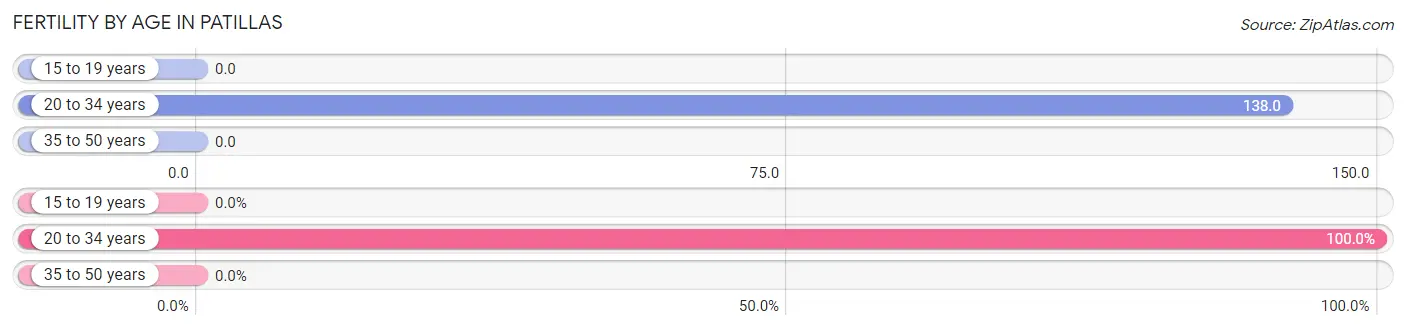
Fertility by Age in Patillas
Average fertility rate in Patillas is 72.0 births per 1,000 women. Women in the age bracket of 20 to 34 years have the highest fertility rate with 138.0 births per 1,000 women. Women in the age bracket of 20 to 34 years acount for 100.0% of all women with births.
| Age Bracket | Women with Births | Births / 1,000 Women |
| 15 to 19 years | 0 (0.0%) | 0.0 |
| 20 to 34 years | 41 (100.0%) | 138.0 |
| 35 to 50 years | 0 (0.0%) | 0.0 |
| Total | 41 (100.0%) | 72.0 |
Fertility by Age by Marriage Status in Patillas
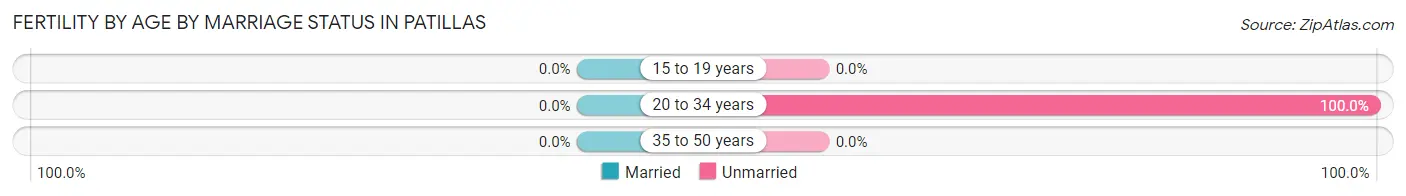
| Age Bracket | Married | Unmarried |
| 15 to 19 years | 0 (0.0%) | 0 (0.0%) |
| 20 to 34 years | 0 (0.0%) | 41 (100.0%) |
| 35 to 50 years | 0 (0.0%) | 0 (0.0%) |
| Total | 0 (0.0%) | 41 (100.0%) |
Fertility by Education in Patillas
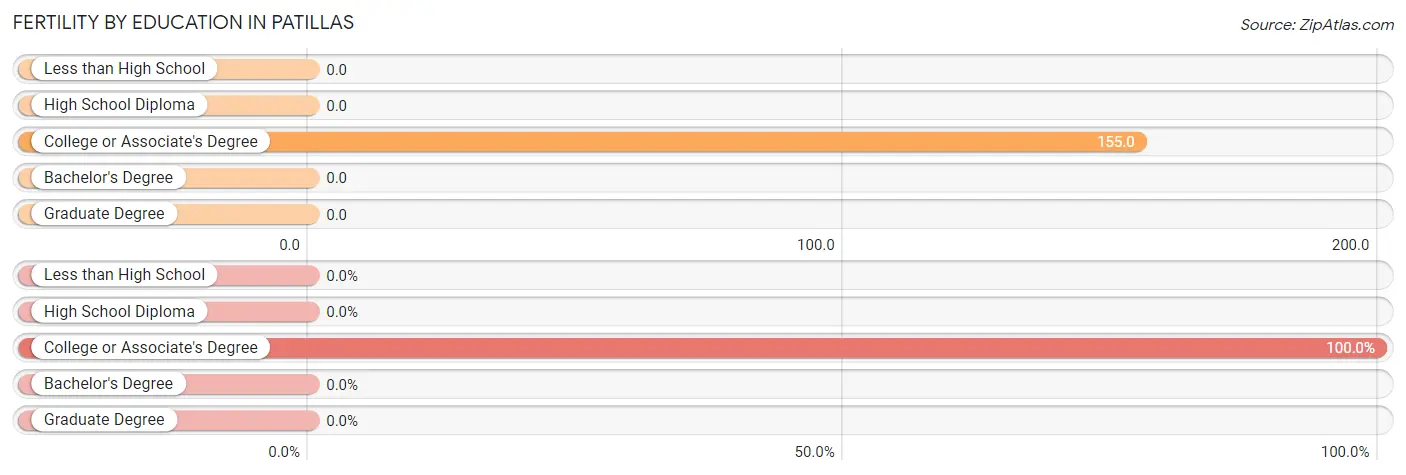
| Educational Attainment | Women with Births | Births / 1,000 Women |
| Less than High School | 0 (0.0%) | 0.0 |
| High School Diploma | 0 (0.0%) | 0.0 |
| College or Associate's Degree | 41 (100.0%) | 155.0 |
| Bachelor's Degree | 0 (0.0%) | 0.0 |
| Graduate Degree | 0 (0.0%) | 0.0 |
| Total | 41 (100.0%) | 72.0 |
Fertility by Education by Marriage Status in Patillas
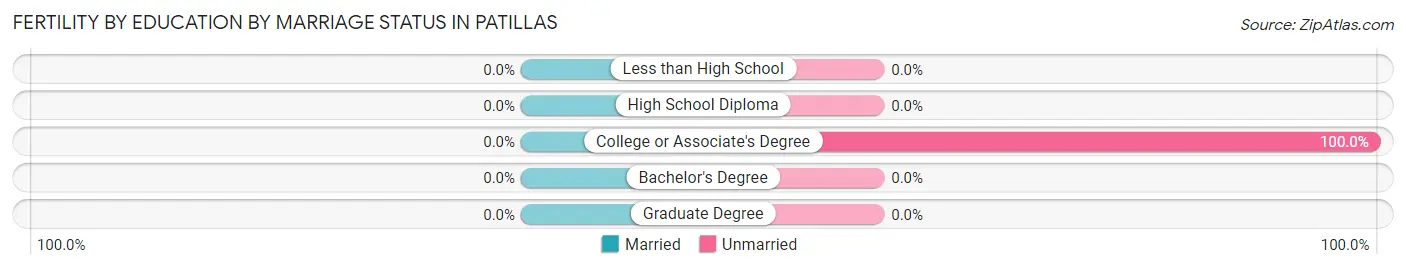
| Educational Attainment | Married | Unmarried |
| Less than High School | 0 (0.0%) | 0 (0.0%) |
| High School Diploma | 0 (0.0%) | 0 (0.0%) |
| College or Associate's Degree | 0 (0.0%) | 41 (100.0%) |
| Bachelor's Degree | 0 (0.0%) | 0 (0.0%) |
| Graduate Degree | 0 (0.0%) | 0 (0.0%) |
| Total | 0 (0.0%) | 41 (100.0%) |
Employment Characteristics in Patillas
Employment by Class of Employer in Patillas
Among the 599 employed individuals in Patillas, private company employees (402 | 67.1%), self-employed (not incorporated) (100 | 16.7%), and state government employees (45 | 7.5%) make up the most common classes of employment.
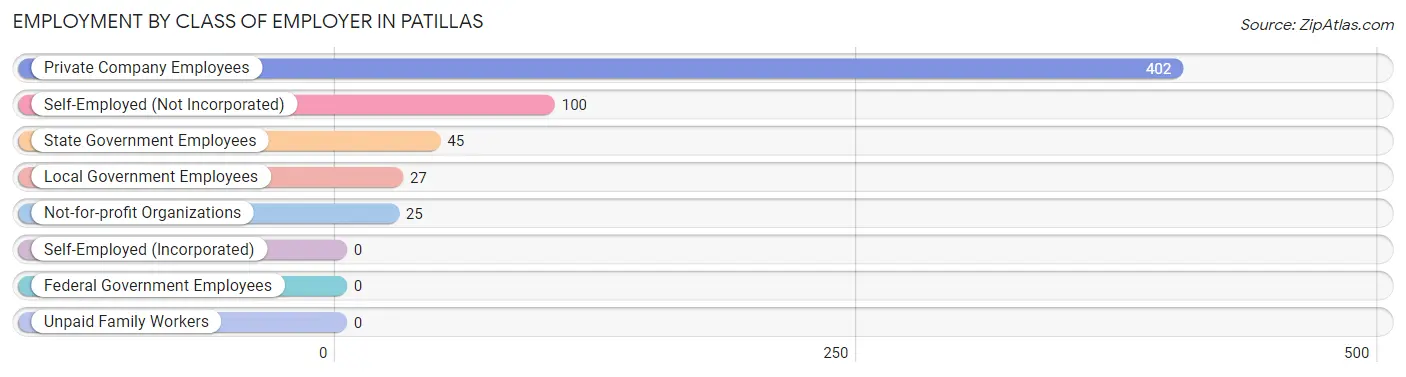
| Employer Class | # Employees | % Employees |
| Private Company Employees | 402 | 67.1% |
| Self-Employed (Incorporated) | 0 | 0.0% |
| Self-Employed (Not Incorporated) | 100 | 16.7% |
| Not-for-profit Organizations | 25 | 4.2% |
| Local Government Employees | 27 | 4.5% |
| State Government Employees | 45 | 7.5% |
| Federal Government Employees | 0 | 0.0% |
| Unpaid Family Workers | 0 | 0.0% |
| Total | 599 | 100.0% |
Employment Status by Age in Patillas
According to the labor force statistics for Patillas, out of the total population over 16 years of age (2,437), 33.9% or 826 individuals are in the labor force, with 10.3% or 85 of them unemployed. The age group with the highest labor force participation rate is 16 to 19 years, with 100.0% or 39 individuals in the labor force. Within the labor force, the 16 to 19 years age range has the highest percentage of unemployed individuals, with 100.0% or 39 of them being unemployed.
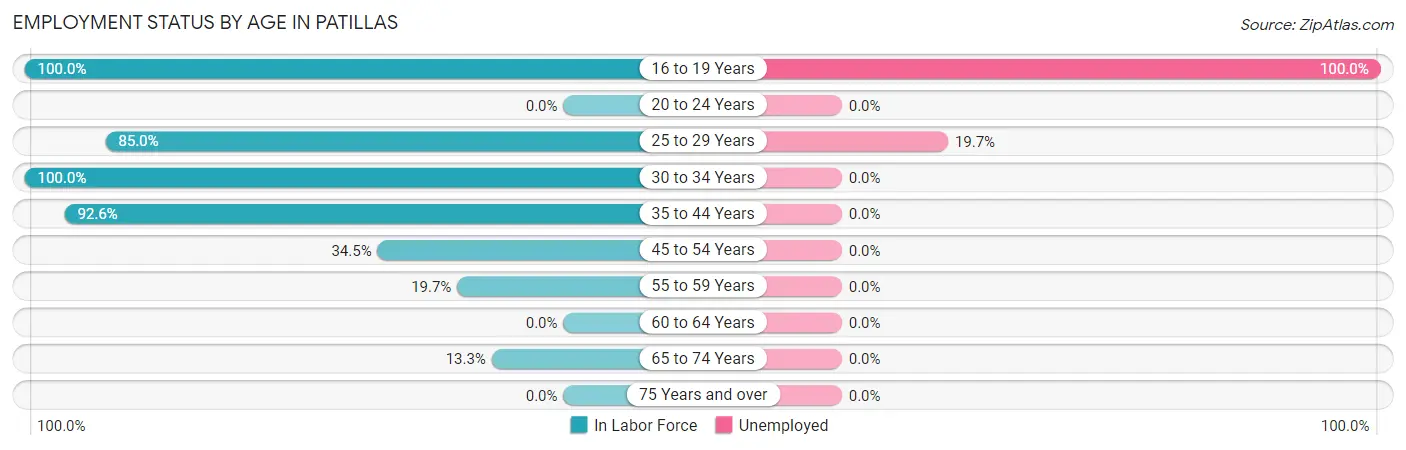
| Age Bracket | In Labor Force | Unemployed |
| 16 to 19 Years | 39 (100.0%) | 39 (100.0%) |
| 20 to 24 Years | 0 (0.0%) | 0 (0.0%) |
| 25 to 29 Years | 233 (85.0%) | 46 (19.7%) |
| 30 to 34 Years | 187 (100.0%) | 0 (0.0%) |
| 35 to 44 Years | 125 (92.6%) | 0 (0.0%) |
| 45 to 54 Years | 140 (34.5%) | 0 (0.0%) |
| 55 to 59 Years | 46 (19.7%) | 0 (0.0%) |
| 60 to 64 Years | 0 (0.0%) | 0 (0.0%) |
| 65 to 74 Years | 55 (13.3%) | 0 (0.0%) |
| 75 Years and over | 0 (0.0%) | 0 (0.0%) |
| Total | 826 (33.9%) | 85 (10.3%) |
Employment Status by Educational Attainment in Patillas
According to labor force statistics for Patillas, 46.6% of individuals (730) out of the total population between 25 and 64 years of age (1,567) are in the labor force, with 6.3% or 46 of them being unemployed. The group with the highest labor force participation rate are those with the educational attainment of bachelor's degree or higher, with 60.2% or 130 individuals in the labor force. Within the labor force, individuals with high school diploma education have the highest percentage of unemployment, with 21.4% or 46 of them being unemployed.
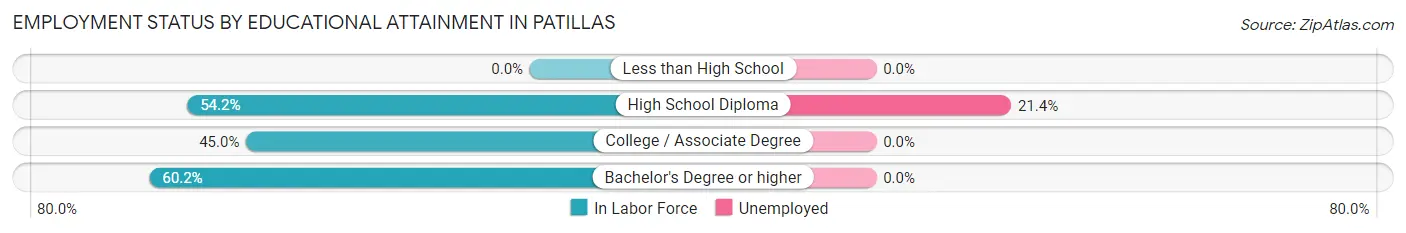
| Educational Attainment | In Labor Force | Unemployed |
| Less than High School | 0 (0.0%) | 0 (0.0%) |
| High School Diploma | 215 (54.2%) | 85 (21.4%) |
| College / Associate Degree | 386 (45.0%) | 0 (0.0%) |
| Bachelor's Degree or higher | 130 (60.2%) | 0 (0.0%) |
| Total | 730 (46.6%) | 99 (6.3%) |
Employment Occupations by Sex in Patillas
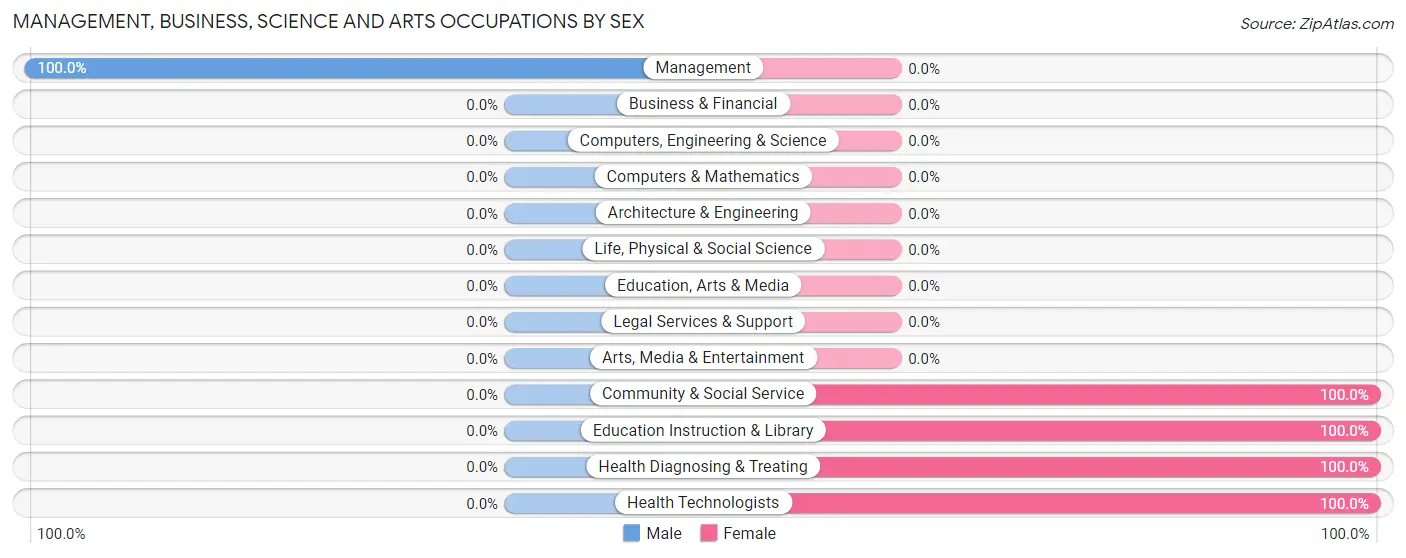
Management, Business, Science and Arts Occupations
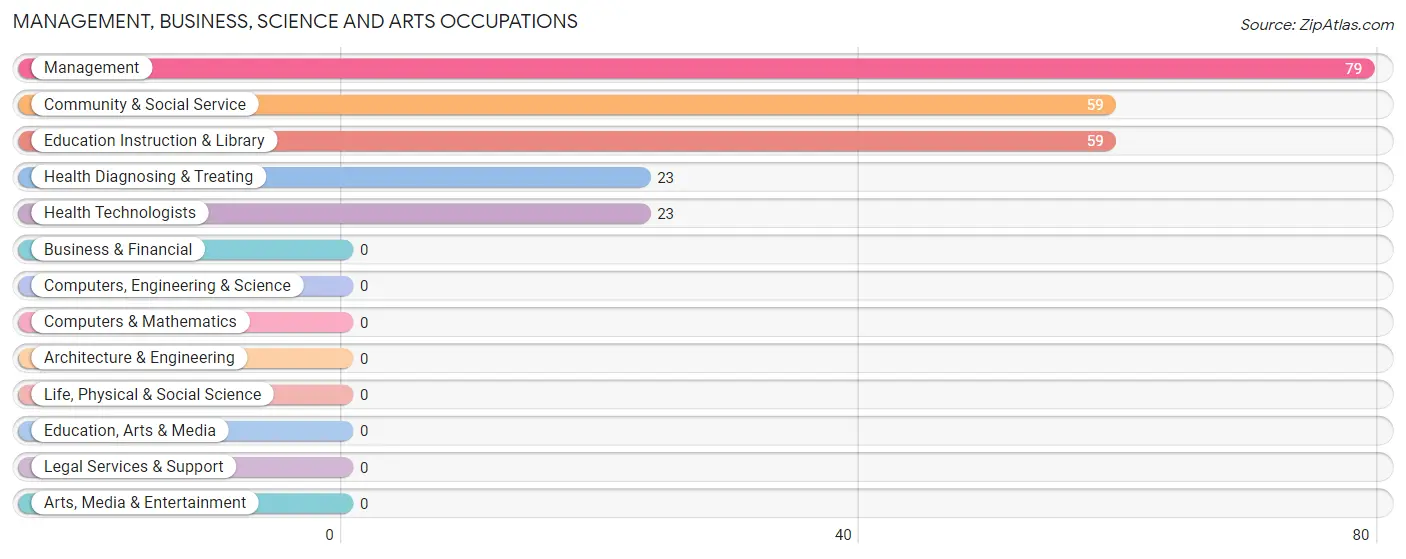
The most common Management, Business, Science and Arts occupations in Patillas are Management (79 | 10.7%), Community & Social Service (59 | 8.0%), Education Instruction & Library (59 | 8.0%), Health Diagnosing & Treating (23 | 3.1%), and Health Technologists (23 | 3.1%).
Management, Business, Science and Arts Occupations by Sex
| Occupation | Male | Female |
| Management | 79 (100.0%) | 0 (0.0%) |
| Business & Financial | 0 (0.0%) | 0 (0.0%) |
| Computers, Engineering & Science | 0 (0.0%) | 0 (0.0%) |
| Computers & Mathematics | 0 (0.0%) | 0 (0.0%) |
| Architecture & Engineering | 0 (0.0%) | 0 (0.0%) |
| Life, Physical & Social Science | 0 (0.0%) | 0 (0.0%) |
| Community & Social Service | 0 (0.0%) | 59 (100.0%) |
| Education, Arts & Media | 0 (0.0%) | 0 (0.0%) |
| Legal Services & Support | 0 (0.0%) | 0 (0.0%) |
| Education Instruction & Library | 0 (0.0%) | 59 (100.0%) |
| Arts, Media & Entertainment | 0 (0.0%) | 0 (0.0%) |
| Health Diagnosing & Treating | 0 (0.0%) | 23 (100.0%) |
| Health Technologists | 0 (0.0%) | 23 (100.0%) |
| Total (Category) | 79 (49.1%) | 82 (50.9%) |
| Total (Overall) | 343 (46.4%) | 397 (53.6%) |
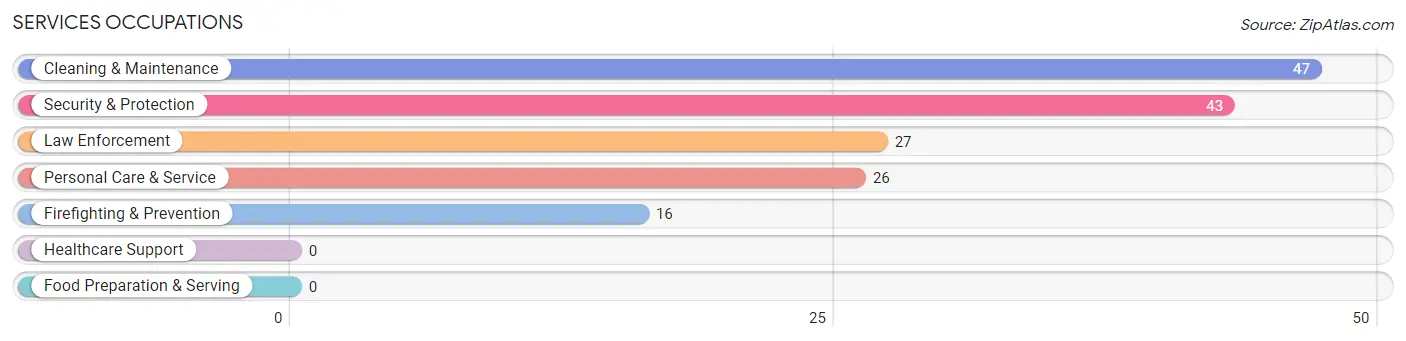
Services Occupations
The most common Services occupations in Patillas are Cleaning & Maintenance (47 | 6.4%), Security & Protection (43 | 5.8%), Law Enforcement (27 | 3.6%), Personal Care & Service (26 | 3.5%), and Firefighting & Prevention (16 | 2.2%).
Services Occupations by Sex
Within the Services occupations in Patillas, the most male-oriented occupations are Firefighting & Prevention (100.0%), Cleaning & Maintenance (100.0%), and Personal Care & Service (100.0%), while the most female-oriented occupations are Law Enforcement (100.0%), and Security & Protection (62.8%).
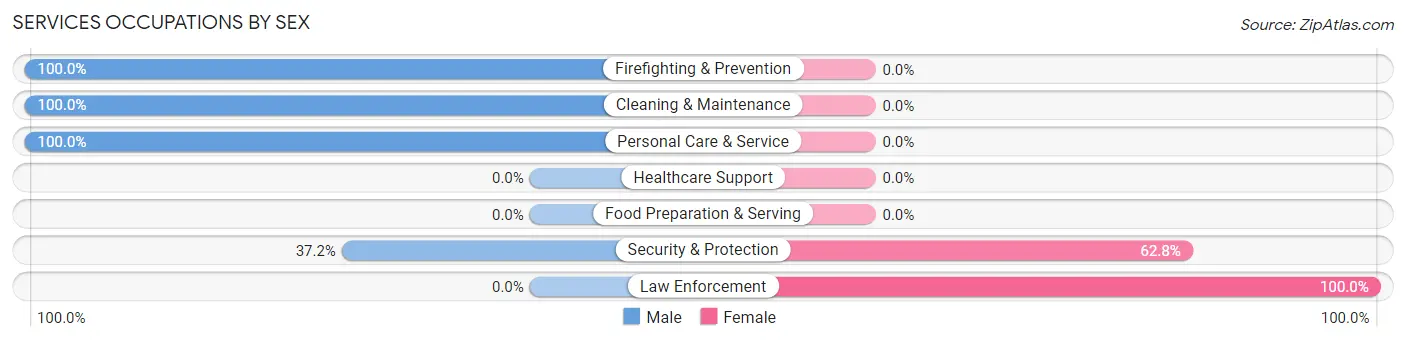
| Occupation | Male | Female |
| Healthcare Support | 0 (0.0%) | 0 (0.0%) |
| Security & Protection | 16 (37.2%) | 27 (62.8%) |
| Firefighting & Prevention | 16 (100.0%) | 0 (0.0%) |
| Law Enforcement | 0 (0.0%) | 27 (100.0%) |
| Food Preparation & Serving | 0 (0.0%) | 0 (0.0%) |
| Cleaning & Maintenance | 47 (100.0%) | 0 (0.0%) |
| Personal Care & Service | 26 (100.0%) | 0 (0.0%) |
| Total (Category) | 89 (76.7%) | 27 (23.3%) |
| Total (Overall) | 343 (46.4%) | 397 (53.6%) |
Sales and Office Occupations
The most common Sales and Office occupations in Patillas are Sales & Related (116 | 15.7%), and Office & Administration (71 | 9.6%).

Sales and Office Occupations by Sex

| Occupation | Male | Female |
| Sales & Related | 35 (30.2%) | 81 (69.8%) |
| Office & Administration | 0 (0.0%) | 71 (100.0%) |
| Total (Category) | 35 (18.7%) | 152 (81.3%) |
| Total (Overall) | 343 (46.4%) | 397 (53.6%) |
Natural Resources, Construction and Maintenance Occupations
The most common Natural Resources, Construction and Maintenance occupations in Patillas are , and Installation, Maintenance & Repair (96 | 13.0%).

Natural Resources, Construction and Maintenance Occupations by Sex

| Occupation | Male | Female |
| Farming, Fishing & Forestry | 0 (0.0%) | 0 (0.0%) |
| Construction & Extraction | 0 (0.0%) | 0 (0.0%) |
| Installation, Maintenance & Repair | 96 (100.0%) | 0 (0.0%) |
| Total (Category) | 96 (100.0%) | 0 (0.0%) |
| Total (Overall) | 343 (46.4%) | 397 (53.6%) |
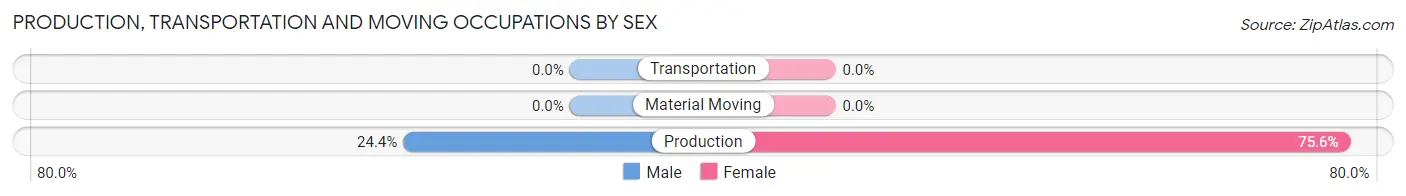
Production, Transportation and Moving Occupations
The most common Production, Transportation and Moving occupations in Patillas are , and Production (180 | 24.3%).
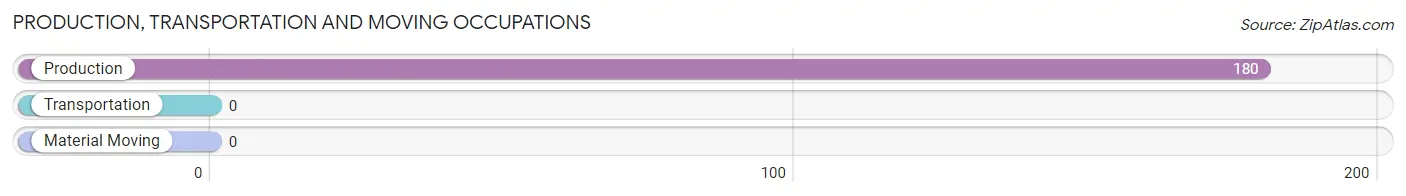
Production, Transportation and Moving Occupations by Sex
| Occupation | Male | Female |
| Production | 44 (24.4%) | 136 (75.6%) |
| Transportation | 0 (0.0%) | 0 (0.0%) |
| Material Moving | 0 (0.0%) | 0 (0.0%) |
| Total (Category) | 44 (24.4%) | 136 (75.6%) |
| Total (Overall) | 343 (46.4%) | 397 (53.6%) |
Employment Industries by Sex in Patillas
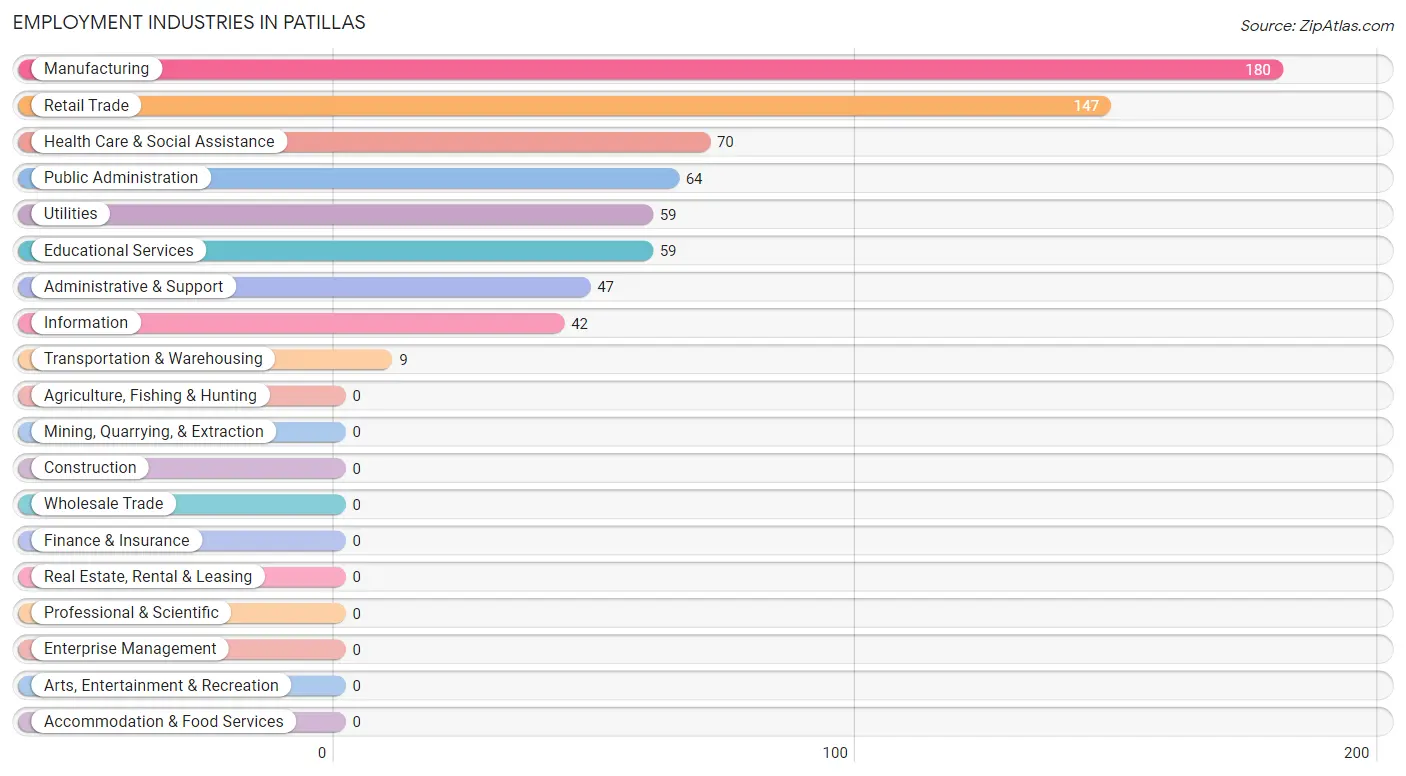
Employment Industries in Patillas
The major employment industries in Patillas include Manufacturing (180 | 24.3%), Retail Trade (147 | 19.9%), Health Care & Social Assistance (70 | 9.5%), Public Administration (64 | 8.6%), and Utilities (59 | 8.0%).
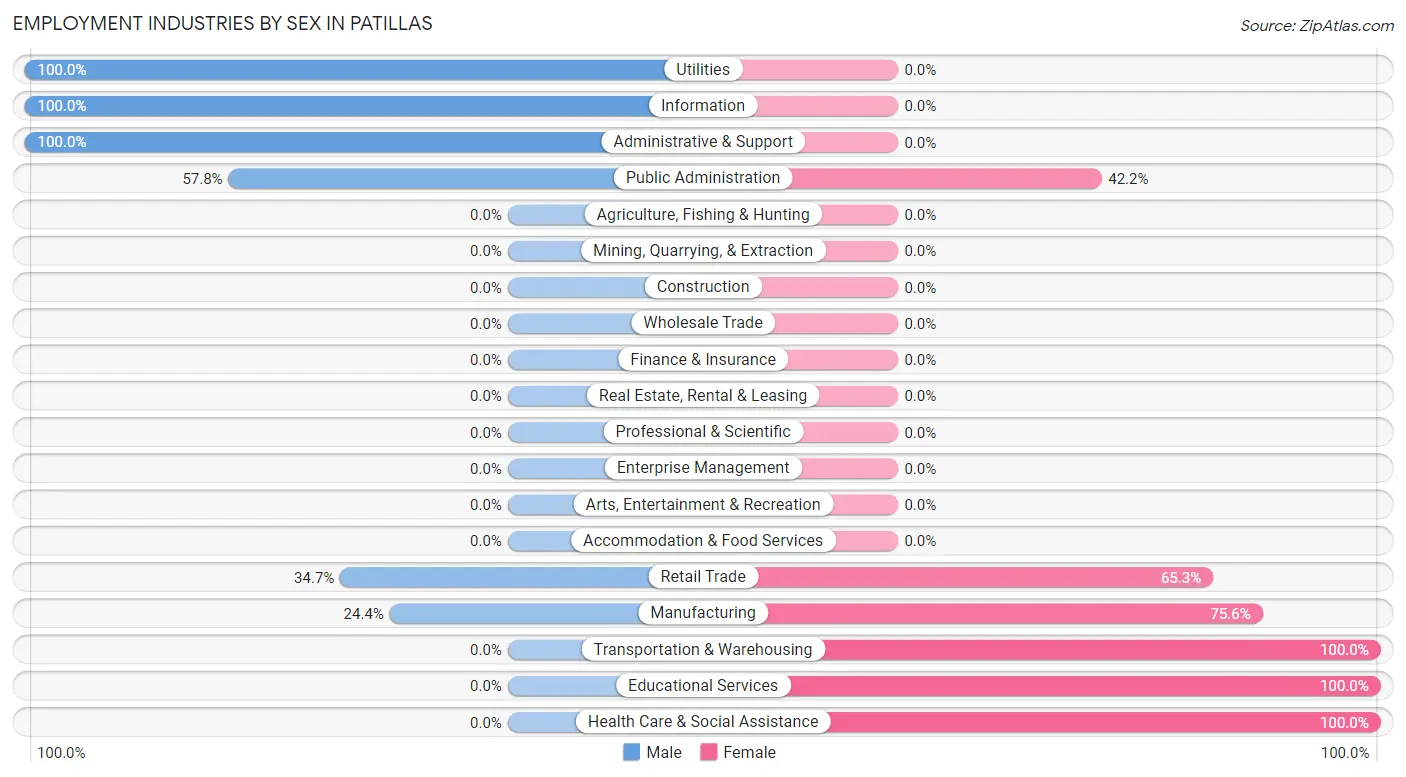
Employment Industries by Sex in Patillas
The Patillas industries that see more men than women are Utilities (100.0%), Information (100.0%), and Administrative & Support (100.0%), whereas the industries that tend to have a higher number of women are Transportation & Warehousing (100.0%), Educational Services (100.0%), and Health Care & Social Assistance (100.0%).
| Industry | Male | Female |
| Agriculture, Fishing & Hunting | 0 (0.0%) | 0 (0.0%) |
| Mining, Quarrying, & Extraction | 0 (0.0%) | 0 (0.0%) |
| Construction | 0 (0.0%) | 0 (0.0%) |
| Manufacturing | 44 (24.4%) | 136 (75.6%) |
| Wholesale Trade | 0 (0.0%) | 0 (0.0%) |
| Retail Trade | 51 (34.7%) | 96 (65.3%) |
| Transportation & Warehousing | 0 (0.0%) | 9 (100.0%) |
| Utilities | 59 (100.0%) | 0 (0.0%) |
| Information | 42 (100.0%) | 0 (0.0%) |
| Finance & Insurance | 0 (0.0%) | 0 (0.0%) |
| Real Estate, Rental & Leasing | 0 (0.0%) | 0 (0.0%) |
| Professional & Scientific | 0 (0.0%) | 0 (0.0%) |
| Enterprise Management | 0 (0.0%) | 0 (0.0%) |
| Administrative & Support | 47 (100.0%) | 0 (0.0%) |
| Educational Services | 0 (0.0%) | 59 (100.0%) |
| Health Care & Social Assistance | 0 (0.0%) | 70 (100.0%) |
| Arts, Entertainment & Recreation | 0 (0.0%) | 0 (0.0%) |
| Accommodation & Food Services | 0 (0.0%) | 0 (0.0%) |
| Public Administration | 37 (57.8%) | 27 (42.2%) |
| Total | 343 (46.4%) | 397 (53.6%) |
Education in Patillas
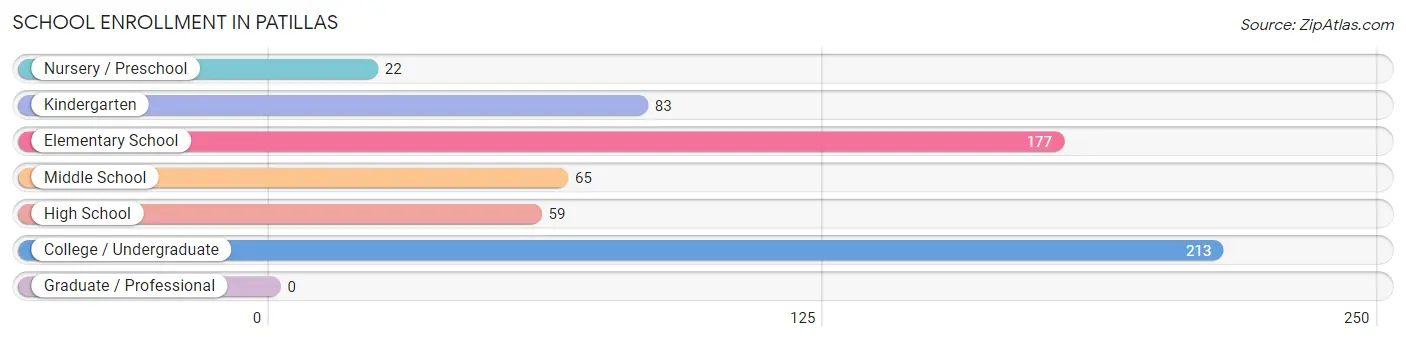
School Enrollment in Patillas
The most common levels of schooling among the 619 students in Patillas are college / undergraduate (213 | 34.4%), elementary school (177 | 28.6%), and kindergarten (83 | 13.4%).
| School Level | # Students | % Students |
| Nursery / Preschool | 22 | 3.5% |
| Kindergarten | 83 | 13.4% |
| Elementary School | 177 | 28.6% |
| Middle School | 65 | 10.5% |
| High School | 59 | 9.5% |
| College / Undergraduate | 213 | 34.4% |
| Graduate / Professional | 0 | 0.0% |
| Total | 619 | 100.0% |
School Enrollment by Age by Funding Source in Patillas
Out of a total of 619 students who are enrolled in schools in Patillas, 263 (42.5%) attend a private institution, while the remaining 356 (57.5%) are enrolled in public schools. The age group of 18 to 19 year olds has the highest likelihood of being enrolled in private schools, with 39 (100.0% in the age bracket) enrolled. Conversely, the age group of 3 to 4 year olds has the lowest likelihood of being enrolled in a private school, with 44 (100.0% in the age bracket) attending a public institution.
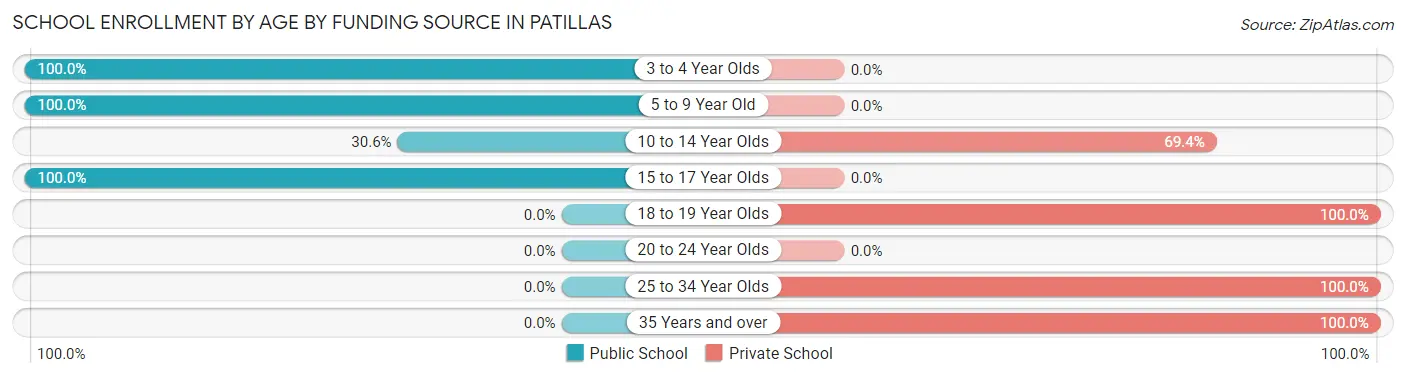
| Age Bracket | Public School | Private School |
| 3 to 4 Year Olds | 44 (100.0%) | 0 (0.0%) |
| 5 to 9 Year Old | 231 (100.0%) | 0 (0.0%) |
| 10 to 14 Year Olds | 22 (30.6%) | 50 (69.4%) |
| 15 to 17 Year Olds | 59 (100.0%) | 0 (0.0%) |
| 18 to 19 Year Olds | 0 (0.0%) | 39 (100.0%) |
| 20 to 24 Year Olds | 0 (0.0%) | 0 (0.0%) |
| 25 to 34 Year Olds | 0 (0.0%) | 74 (100.0%) |
| 35 Years and over | 0 (0.0%) | 100 (100.0%) |
| Total | 356 (57.5%) | 263 (42.5%) |
Educational Attainment by Field of Study in Patillas
Education (154 | 36.1%), arts & humanities (81 | 19.0%), business (55 | 12.9%), science & technology (47 | 11.0%), and communications (36 | 8.5%) are the most common fields of study among 426 individuals in Patillas who have obtained a bachelor's degree or higher.
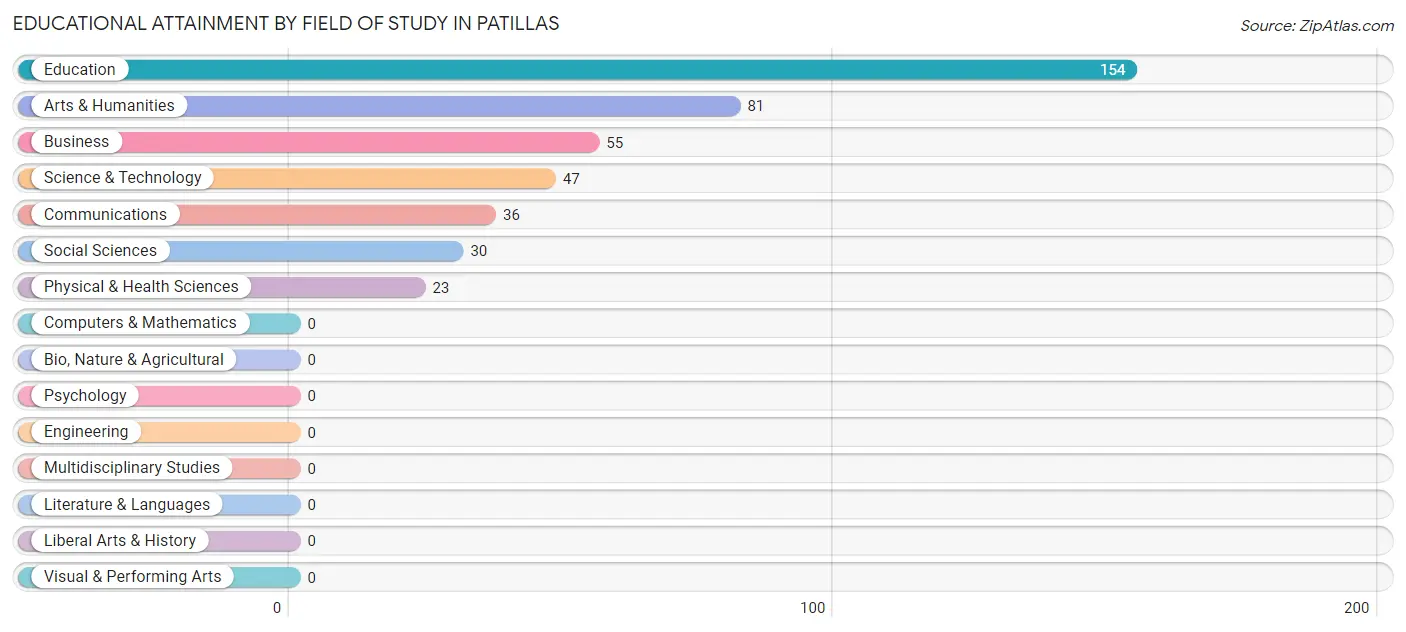
| Field of Study | # Graduates | % Graduates |
| Computers & Mathematics | 0 | 0.0% |
| Bio, Nature & Agricultural | 0 | 0.0% |
| Physical & Health Sciences | 23 | 5.4% |
| Psychology | 0 | 0.0% |
| Social Sciences | 30 | 7.0% |
| Engineering | 0 | 0.0% |
| Multidisciplinary Studies | 0 | 0.0% |
| Science & Technology | 47 | 11.0% |
| Business | 55 | 12.9% |
| Education | 154 | 36.1% |
| Literature & Languages | 0 | 0.0% |
| Liberal Arts & History | 0 | 0.0% |
| Visual & Performing Arts | 0 | 0.0% |
| Communications | 36 | 8.5% |
| Arts & Humanities | 81 | 19.0% |
| Total | 426 | 100.0% |
Transportation & Commute in Patillas
Vehicle Availability by Sex in Patillas
The most prevalent vehicle ownership categories in Patillas are males with 1 vehicle (80, accounting for 39.6%) and females with 1 vehicle (167, making up 20.2%).
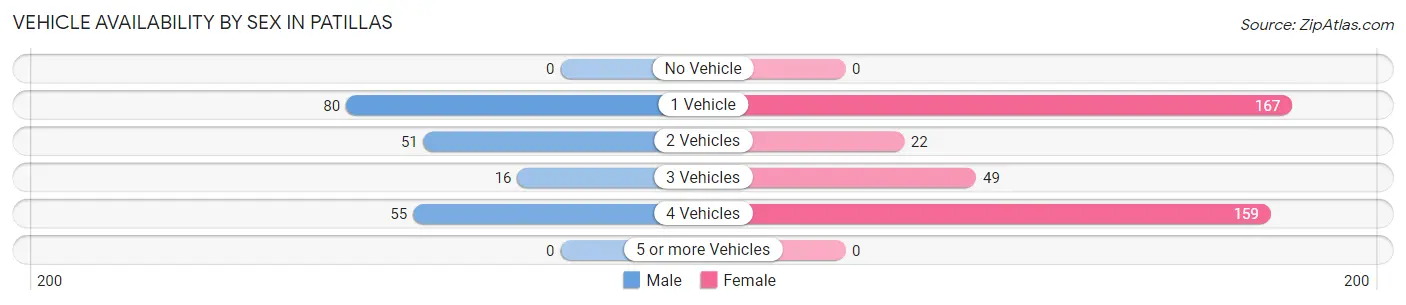
| Vehicles Available | Male | Female |
| No Vehicle | 0 (0.0%) | 0 (0.0%) |
| 1 Vehicle | 80 (39.6%) | 167 (42.1%) |
| 2 Vehicles | 51 (25.3%) | 22 (5.5%) |
| 3 Vehicles | 16 (7.9%) | 49 (12.3%) |
| 4 Vehicles | 55 (27.2%) | 159 (40.1%) |
| 5 or more Vehicles | 0 (0.0%) | 0 (0.0%) |
| Total | 202 (100.0%) | 397 (100.0%) |
Commute Time in Patillas
The most frequently occuring commute durations in Patillas are 30 to 34 minutes (103 commuters, 17.2%), 90 or more minutes (92 commuters, 15.4%), and 60 to 89 minutes (91 commuters, 15.2%).
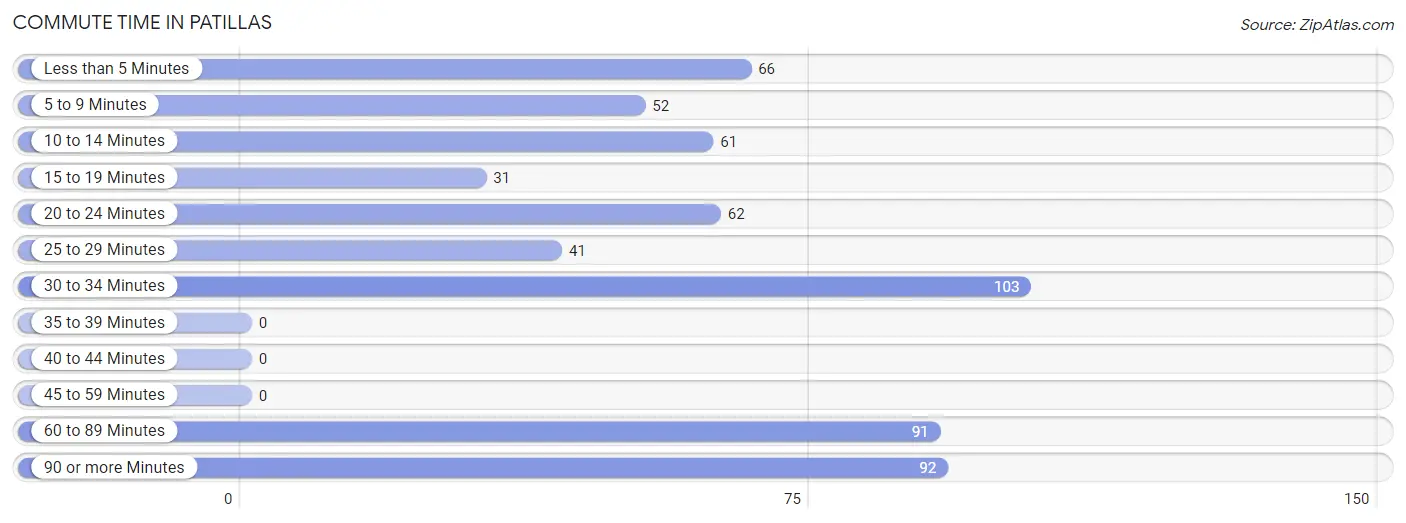
| Commute Time | # Commuters | % Commuters |
| Less than 5 Minutes | 66 | 11.0% |
| 5 to 9 Minutes | 52 | 8.7% |
| 10 to 14 Minutes | 61 | 10.2% |
| 15 to 19 Minutes | 31 | 5.2% |
| 20 to 24 Minutes | 62 | 10.3% |
| 25 to 29 Minutes | 41 | 6.8% |
| 30 to 34 Minutes | 103 | 17.2% |
| 35 to 39 Minutes | 0 | 0.0% |
| 40 to 44 Minutes | 0 | 0.0% |
| 45 to 59 Minutes | 0 | 0.0% |
| 60 to 89 Minutes | 91 | 15.2% |
| 90 or more Minutes | 92 | 15.4% |
Commute Time by Sex in Patillas
The most common commute times in Patillas are 90 or more minutes (92 commuters, 45.5%) for males and 60 to 89 minutes (91 commuters, 22.9%) for females.
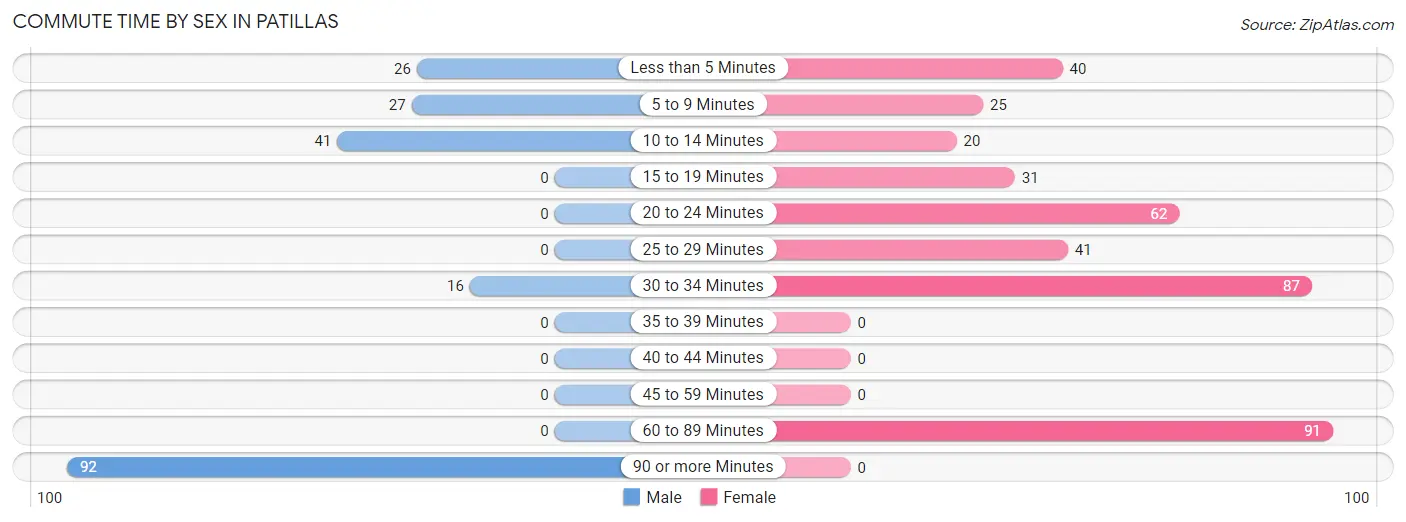
| Commute Time | Male | Female |
| Less than 5 Minutes | 26 (12.9%) | 40 (10.1%) |
| 5 to 9 Minutes | 27 (13.4%) | 25 (6.3%) |
| 10 to 14 Minutes | 41 (20.3%) | 20 (5.0%) |
| 15 to 19 Minutes | 0 (0.0%) | 31 (7.8%) |
| 20 to 24 Minutes | 0 (0.0%) | 62 (15.6%) |
| 25 to 29 Minutes | 0 (0.0%) | 41 (10.3%) |
| 30 to 34 Minutes | 16 (7.9%) | 87 (21.9%) |
| 35 to 39 Minutes | 0 (0.0%) | 0 (0.0%) |
| 40 to 44 Minutes | 0 (0.0%) | 0 (0.0%) |
| 45 to 59 Minutes | 0 (0.0%) | 0 (0.0%) |
| 60 to 89 Minutes | 0 (0.0%) | 91 (22.9%) |
| 90 or more Minutes | 92 (45.5%) | 0 (0.0%) |
Time of Departure to Work by Sex in Patillas
The most frequent times of departure to work in Patillas are 6:00 AM to 6:29 AM (51, 25.3%) for males and 12:00 PM to 3:59 PM (139, 35.0%) for females.
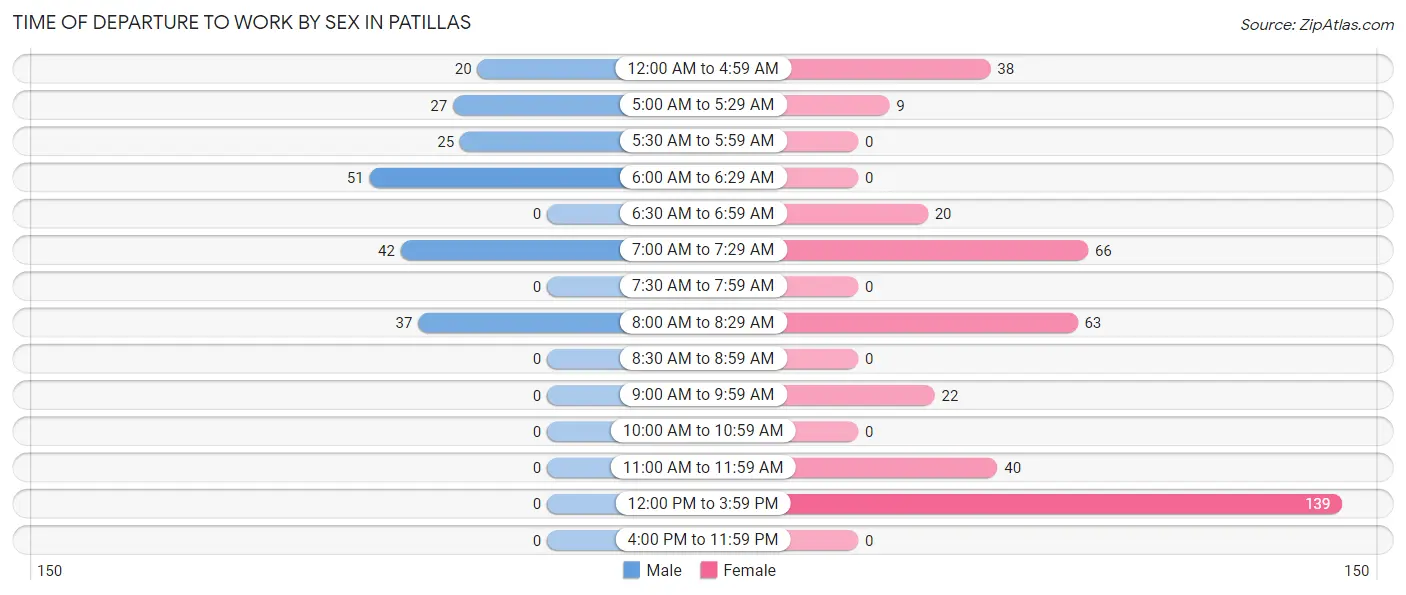
| Time of Departure | Male | Female |
| 12:00 AM to 4:59 AM | 20 (9.9%) | 38 (9.6%) |
| 5:00 AM to 5:29 AM | 27 (13.4%) | 9 (2.3%) |
| 5:30 AM to 5:59 AM | 25 (12.4%) | 0 (0.0%) |
| 6:00 AM to 6:29 AM | 51 (25.3%) | 0 (0.0%) |
| 6:30 AM to 6:59 AM | 0 (0.0%) | 20 (5.0%) |
| 7:00 AM to 7:29 AM | 42 (20.8%) | 66 (16.6%) |
| 7:30 AM to 7:59 AM | 0 (0.0%) | 0 (0.0%) |
| 8:00 AM to 8:29 AM | 37 (18.3%) | 63 (15.9%) |
| 8:30 AM to 8:59 AM | 0 (0.0%) | 0 (0.0%) |
| 9:00 AM to 9:59 AM | 0 (0.0%) | 22 (5.5%) |
| 10:00 AM to 10:59 AM | 0 (0.0%) | 0 (0.0%) |
| 11:00 AM to 11:59 AM | 0 (0.0%) | 40 (10.1%) |
| 12:00 PM to 3:59 PM | 0 (0.0%) | 139 (35.0%) |
| 4:00 PM to 11:59 PM | 0 (0.0%) | 0 (0.0%) |
| Total | 202 (100.0%) | 397 (100.0%) |
Housing Occupancy in Patillas
Occupancy by Ownership in Patillas
Of the total 1,343 dwellings in Patillas, owner-occupied units account for 744 (55.4%), while renter-occupied units make up 599 (44.6%).
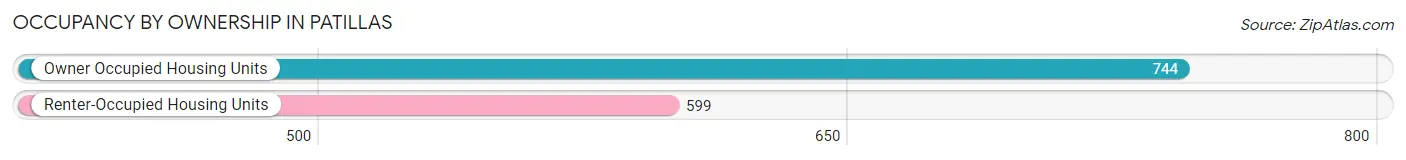
| Occupancy | # Housing Units | % Housing Units |
| Owner Occupied Housing Units | 744 | 55.4% |
| Renter-Occupied Housing Units | 599 | 44.6% |
| Total Occupied Housing Units | 1,343 | 100.0% |
Occupancy by Household Size in Patillas
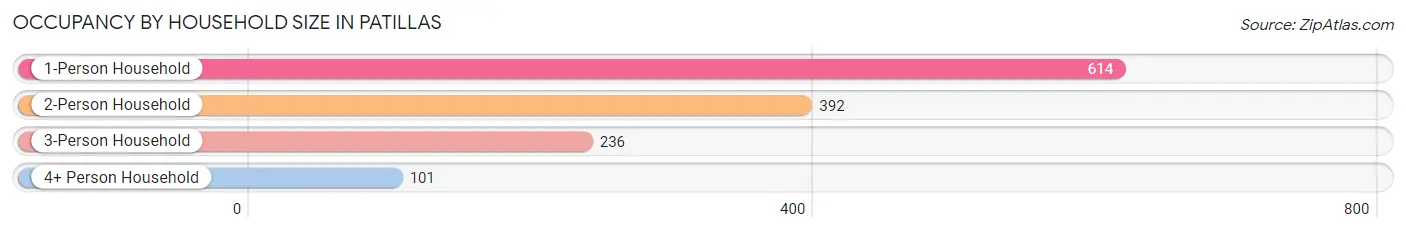
| Household Size | # Housing Units | % Housing Units |
| 1-Person Household | 614 | 45.7% |
| 2-Person Household | 392 | 29.2% |
| 3-Person Household | 236 | 17.6% |
| 4+ Person Household | 101 | 7.5% |
| Total Housing Units | 1,343 | 100.0% |
Occupancy by Ownership by Household Size in Patillas
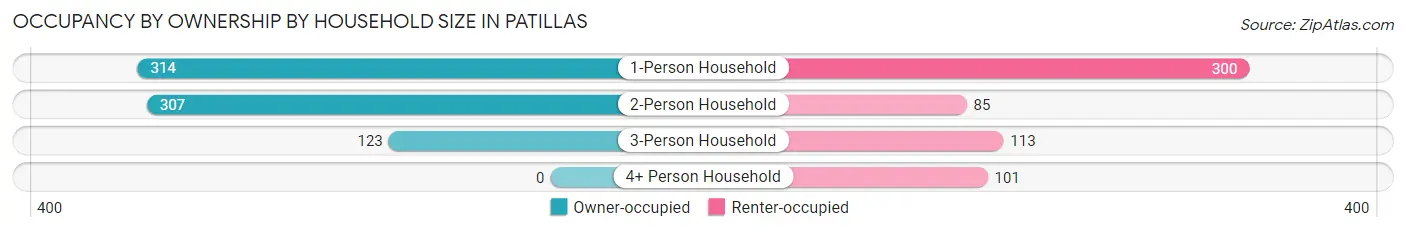
| Household Size | Owner-occupied | Renter-occupied |
| 1-Person Household | 314 (51.1%) | 300 (48.9%) |
| 2-Person Household | 307 (78.3%) | 85 (21.7%) |
| 3-Person Household | 123 (52.1%) | 113 (47.9%) |
| 4+ Person Household | 0 (0.0%) | 101 (100.0%) |
| Total Housing Units | 744 (55.4%) | 599 (44.6%) |
Occupancy by Educational Attainment in Patillas
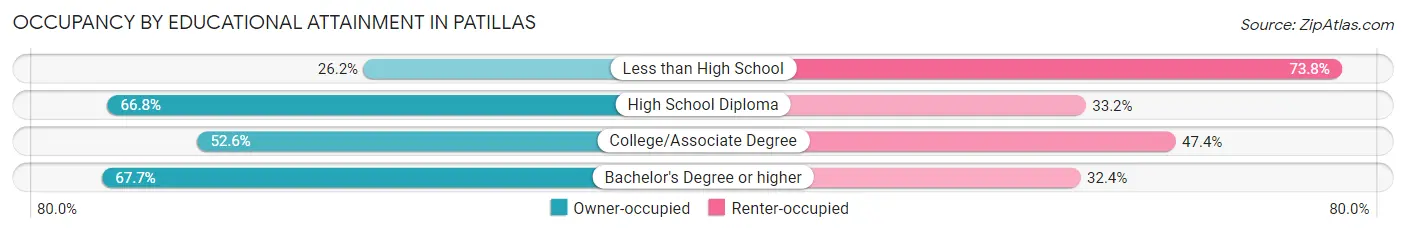
| Household Size | Owner-occupied | Renter-occupied |
| Less than High School | 61 (26.2%) | 172 (73.8%) |
| High School Diploma | 298 (66.8%) | 148 (33.2%) |
| College/Associate Degree | 224 (52.6%) | 202 (47.4%) |
| Bachelor's Degree or higher | 161 (67.6%) | 77 (32.4%) |
Occupancy by Age of Householder in Patillas
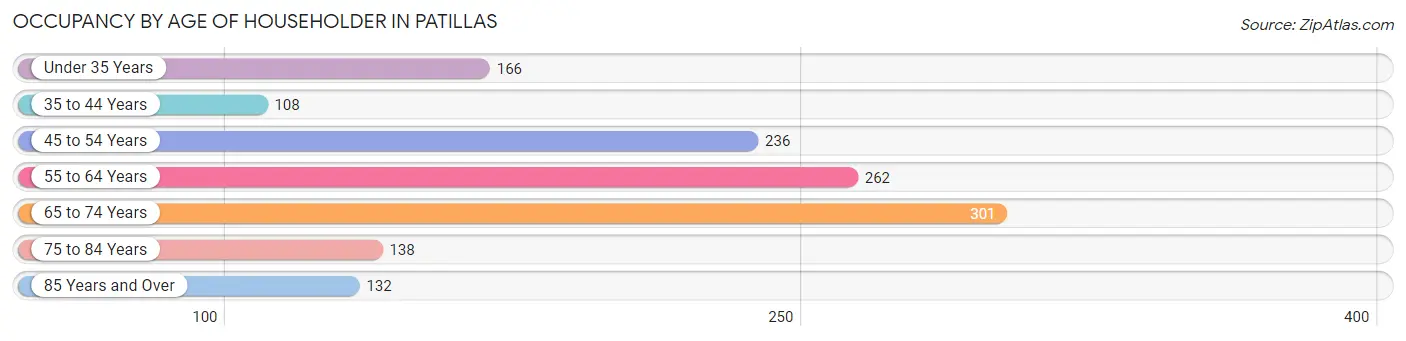
| Age Bracket | # Households | % Households |
| Under 35 Years | 166 | 12.4% |
| 35 to 44 Years | 108 | 8.0% |
| 45 to 54 Years | 236 | 17.6% |
| 55 to 64 Years | 262 | 19.5% |
| 65 to 74 Years | 301 | 22.4% |
| 75 to 84 Years | 138 | 10.3% |
| 85 Years and Over | 132 | 9.8% |
| Total | 1,343 | 100.0% |
Housing Finances in Patillas
Median Income by Occupancy in Patillas
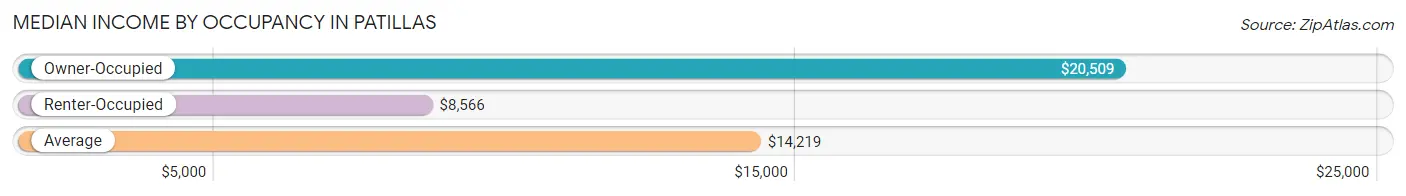
| Occupancy Type | # Households | Median Income |
| Owner-Occupied | 744 (55.4%) | $20,509 |
| Renter-Occupied | 599 (44.6%) | $8,566 |
| Average | 1,343 (100.0%) | $14,219 |
Occupancy by Householder Income Bracket in Patillas
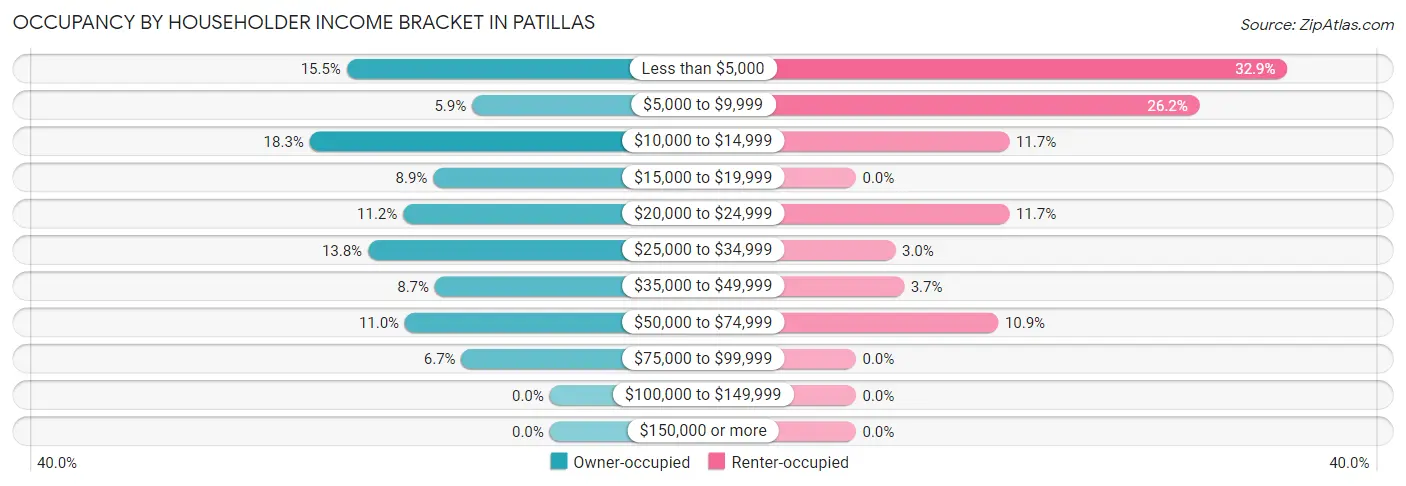
| Income Bracket | Owner-occupied | Renter-occupied |
| Less than $5,000 | 115 (15.5%) | 197 (32.9%) |
| $5,000 to $9,999 | 44 (5.9%) | 157 (26.2%) |
| $10,000 to $14,999 | 136 (18.3%) | 70 (11.7%) |
| $15,000 to $19,999 | 66 (8.9%) | 0 (0.0%) |
| $20,000 to $24,999 | 83 (11.2%) | 70 (11.7%) |
| $25,000 to $34,999 | 103 (13.8%) | 18 (3.0%) |
| $35,000 to $49,999 | 65 (8.7%) | 22 (3.7%) |
| $50,000 to $74,999 | 82 (11.0%) | 65 (10.8%) |
| $75,000 to $99,999 | 50 (6.7%) | 0 (0.0%) |
| $100,000 to $149,999 | 0 (0.0%) | 0 (0.0%) |
| $150,000 or more | 0 (0.0%) | 0 (0.0%) |
| Total | 744 (100.0%) | 599 (100.0%) |
Monthly Housing Cost Tiers in Patillas
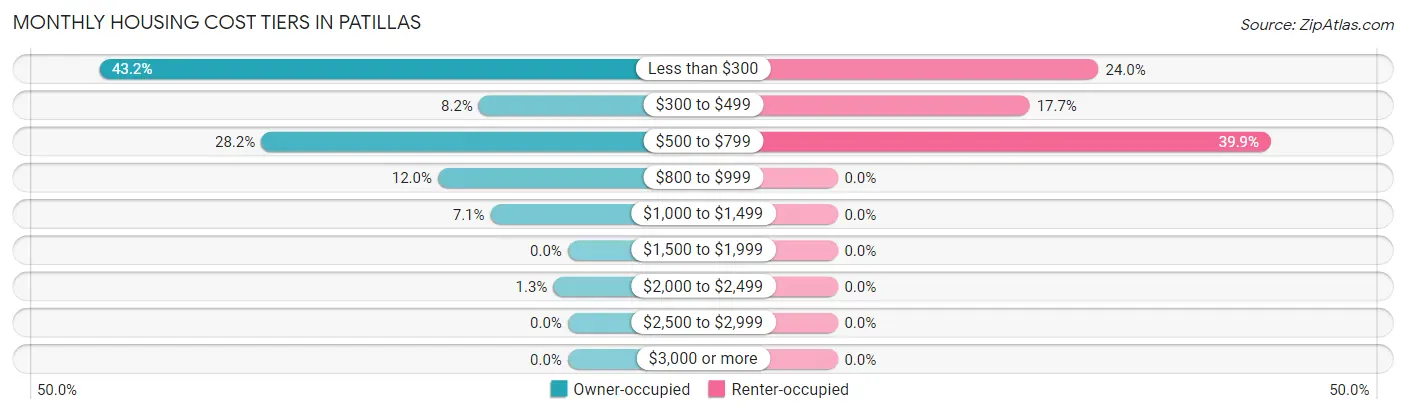
| Monthly Cost | Owner-occupied | Renter-occupied |
| Less than $300 | 321 (43.1%) | 144 (24.0%) |
| $300 to $499 | 61 (8.2%) | 106 (17.7%) |
| $500 to $799 | 210 (28.2%) | 239 (39.9%) |
| $800 to $999 | 89 (12.0%) | 0 (0.0%) |
| $1,000 to $1,499 | 53 (7.1%) | 0 (0.0%) |
| $1,500 to $1,999 | 0 (0.0%) | 0 (0.0%) |
| $2,000 to $2,499 | 10 (1.3%) | 0 (0.0%) |
| $2,500 to $2,999 | 0 (0.0%) | 0 (0.0%) |
| $3,000 or more | 0 (0.0%) | 0 (0.0%) |
| Total | 744 (100.0%) | 599 (100.0%) |
Physical Housing Characteristics in Patillas
Housing Structures in Patillas
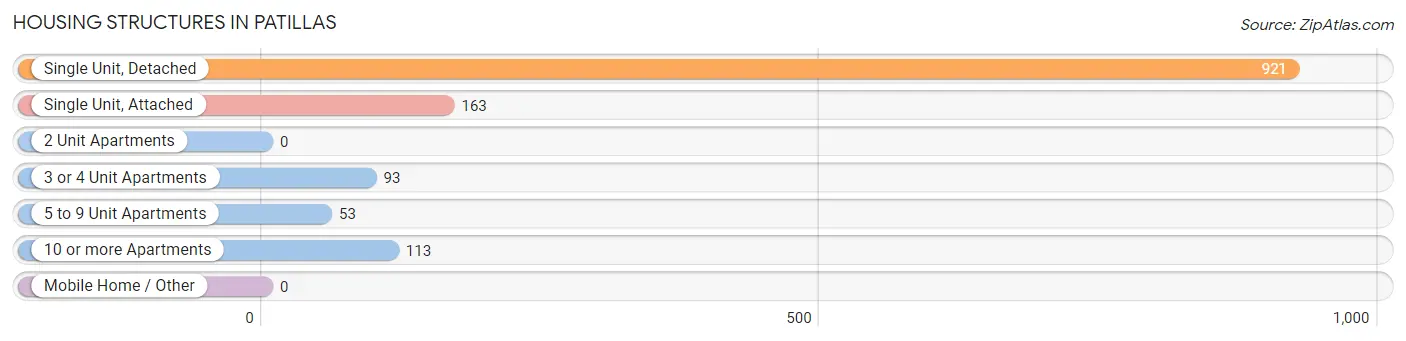
| Structure Type | # Housing Units | % Housing Units |
| Single Unit, Detached | 921 | 68.6% |
| Single Unit, Attached | 163 | 12.1% |
| 2 Unit Apartments | 0 | 0.0% |
| 3 or 4 Unit Apartments | 93 | 6.9% |
| 5 to 9 Unit Apartments | 53 | 4.0% |
| 10 or more Apartments | 113 | 8.4% |
| Mobile Home / Other | 0 | 0.0% |
| Total | 1,343 | 100.0% |
Housing Structures by Occupancy in Patillas
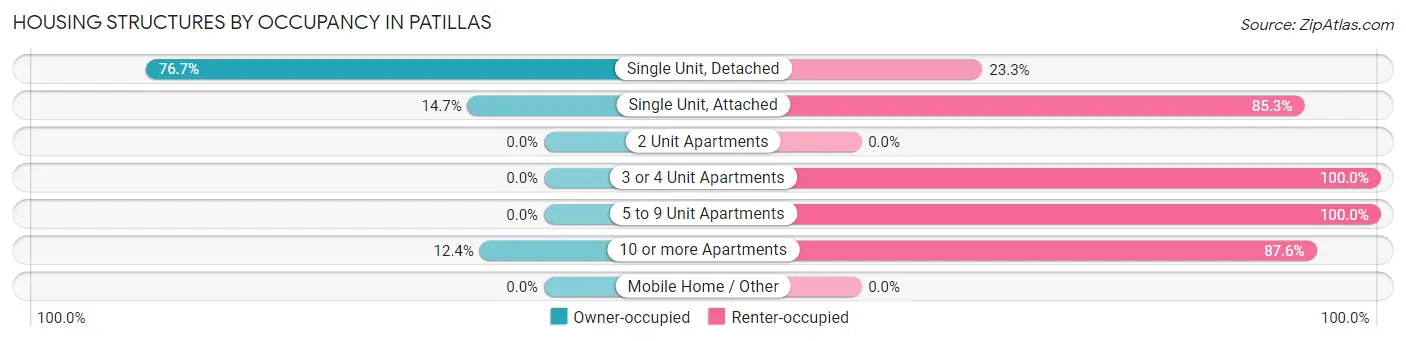
| Structure Type | Owner-occupied | Renter-occupied |
| Single Unit, Detached | 706 (76.7%) | 215 (23.3%) |
| Single Unit, Attached | 24 (14.7%) | 139 (85.3%) |
| 2 Unit Apartments | 0 (0.0%) | 0 (0.0%) |
| 3 or 4 Unit Apartments | 0 (0.0%) | 93 (100.0%) |
| 5 to 9 Unit Apartments | 0 (0.0%) | 53 (100.0%) |
| 10 or more Apartments | 14 (12.4%) | 99 (87.6%) |
| Mobile Home / Other | 0 (0.0%) | 0 (0.0%) |
| Total | 744 (55.4%) | 599 (44.6%) |
Housing Structures by Number of Rooms in Patillas
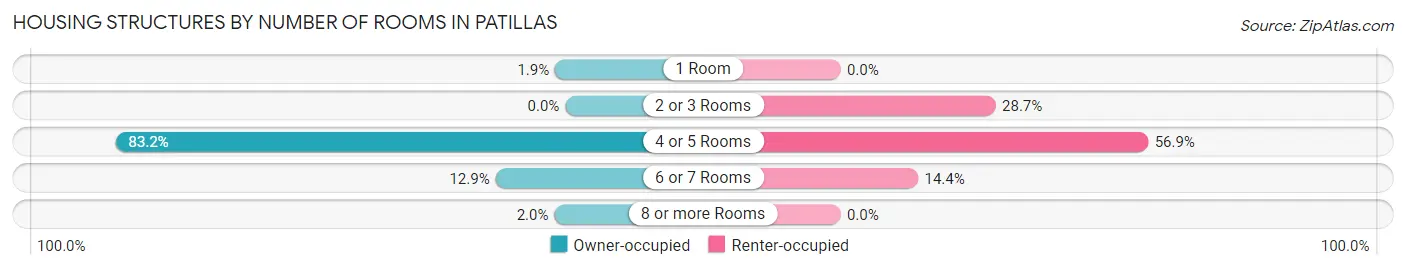
| Number of Rooms | Owner-occupied | Renter-occupied |
| 1 Room | 14 (1.9%) | 0 (0.0%) |
| 2 or 3 Rooms | 0 (0.0%) | 172 (28.7%) |
| 4 or 5 Rooms | 619 (83.2%) | 341 (56.9%) |
| 6 or 7 Rooms | 96 (12.9%) | 86 (14.4%) |
| 8 or more Rooms | 15 (2.0%) | 0 (0.0%) |
| Total | 744 (100.0%) | 599 (100.0%) |
Housing Structure by Heating Type in Patillas
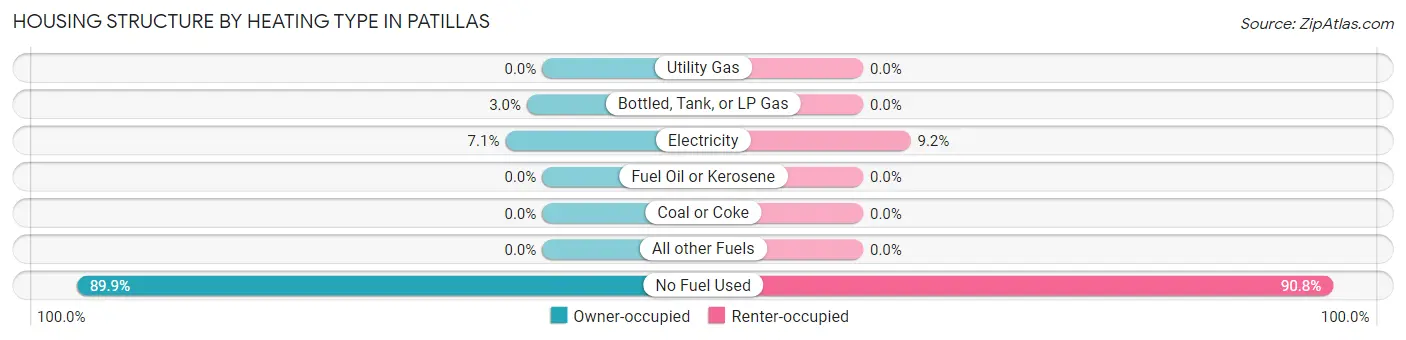
| Heating Type | Owner-occupied | Renter-occupied |
| Utility Gas | 0 (0.0%) | 0 (0.0%) |
| Bottled, Tank, or LP Gas | 22 (3.0%) | 0 (0.0%) |
| Electricity | 53 (7.1%) | 55 (9.2%) |
| Fuel Oil or Kerosene | 0 (0.0%) | 0 (0.0%) |
| Coal or Coke | 0 (0.0%) | 0 (0.0%) |
| All other Fuels | 0 (0.0%) | 0 (0.0%) |
| No Fuel Used | 669 (89.9%) | 544 (90.8%) |
| Total | 744 (100.0%) | 599 (100.0%) |
Household Vehicle Usage in Patillas
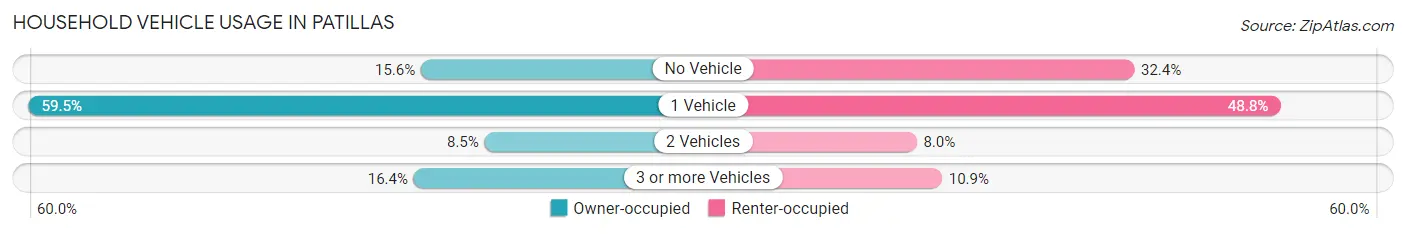
| Vehicles per Household | Owner-occupied | Renter-occupied |
| No Vehicle | 116 (15.6%) | 194 (32.4%) |
| 1 Vehicle | 443 (59.5%) | 292 (48.7%) |
| 2 Vehicles | 63 (8.5%) | 48 (8.0%) |
| 3 or more Vehicles | 122 (16.4%) | 65 (10.8%) |
| Total | 744 (100.0%) | 599 (100.0%) |
Real Estate & Mortgages in Patillas
Real Estate and Mortgage Overview in Patillas
| Characteristic | Without Mortgage | With Mortgage |
| Housing Units | 326 | 418 |
| Median Property Value | $76,700 | $88,600 |
| Median Household Income | $16,500 | $0 |
| Monthly Housing Costs | $146 | $0 |
| Real Estate Taxes | - | - |
Property Value by Mortgage Status in Patillas
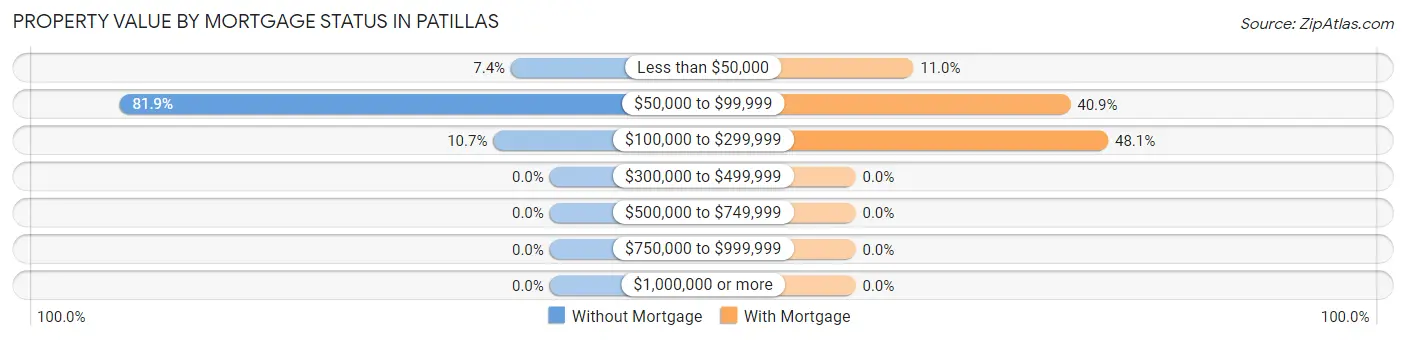
| Property Value | Without Mortgage | With Mortgage |
| Less than $50,000 | 24 (7.4%) | 46 (11.0%) |
| $50,000 to $99,999 | 267 (81.9%) | 171 (40.9%) |
| $100,000 to $299,999 | 35 (10.7%) | 201 (48.1%) |
| $300,000 to $499,999 | 0 (0.0%) | 0 (0.0%) |
| $500,000 to $749,999 | 0 (0.0%) | 0 (0.0%) |
| $750,000 to $999,999 | 0 (0.0%) | 0 (0.0%) |
| $1,000,000 or more | 0 (0.0%) | 0 (0.0%) |
| Total | 326 (100.0%) | 418 (100.0%) |
Household Income by Mortgage Status in Patillas
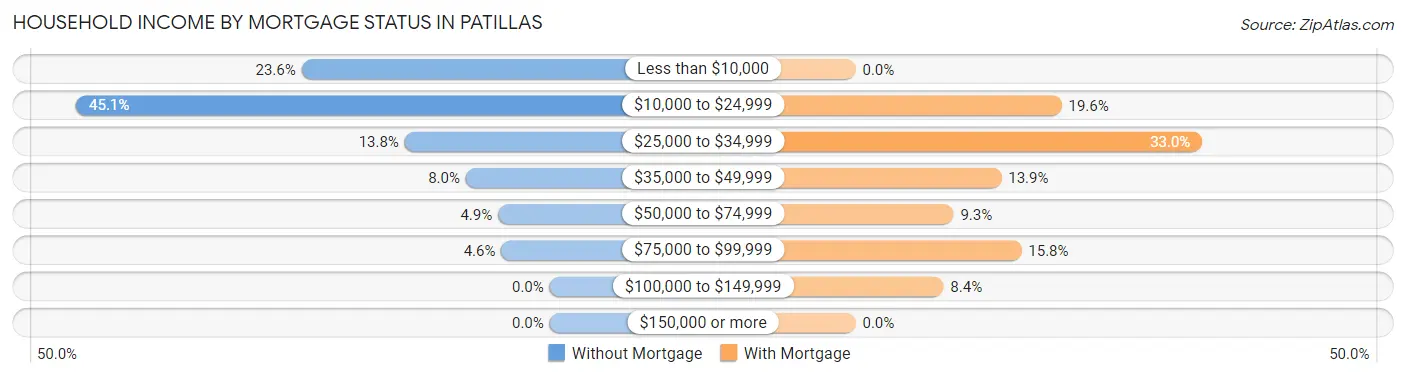
| Household Income | Without Mortgage | With Mortgage |
| Less than $10,000 | 77 (23.6%) | 0 (0.0%) |
| $10,000 to $24,999 | 147 (45.1%) | 82 (19.6%) |
| $25,000 to $34,999 | 45 (13.8%) | 138 (33.0%) |
| $35,000 to $49,999 | 26 (8.0%) | 58 (13.9%) |
| $50,000 to $74,999 | 16 (4.9%) | 39 (9.3%) |
| $75,000 to $99,999 | 15 (4.6%) | 66 (15.8%) |
| $100,000 to $149,999 | 0 (0.0%) | 35 (8.4%) |
| $150,000 or more | 0 (0.0%) | 0 (0.0%) |
| Total | 326 (100.0%) | 418 (100.0%) |
Property Value to Household Income Ratio in Patillas
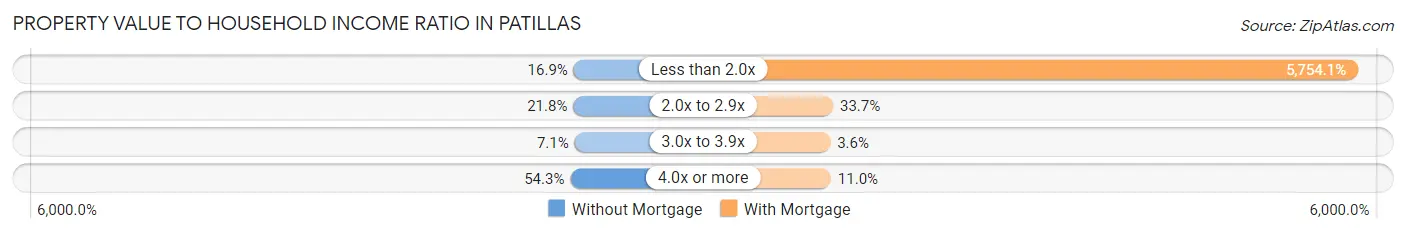
| Value-to-Income Ratio | Without Mortgage | With Mortgage |
| Less than 2.0x | 55 (16.9%) | 24,052 (5,754.1%) |
| 2.0x to 2.9x | 71 (21.8%) | 141 (33.7%) |
| 3.0x to 3.9x | 23 (7.1%) | 15 (3.6%) |
| 4.0x or more | 177 (54.3%) | 46 (11.0%) |
| Total | 326 (100.0%) | 418 (100.0%) |
Real Estate Taxes by Mortgage Status in Patillas
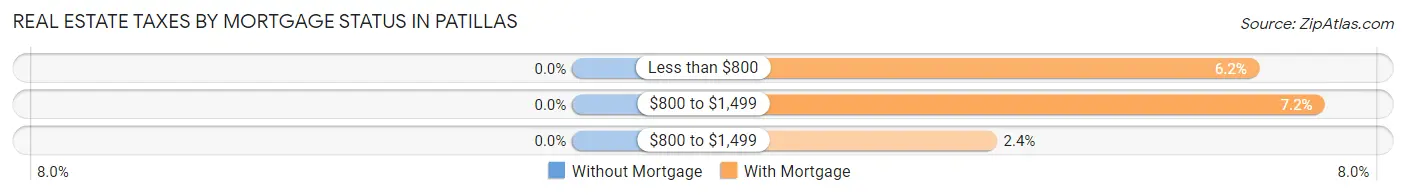
| Property Taxes | Without Mortgage | With Mortgage |
| Less than $800 | 0 (0.0%) | 26 (6.2%) |
| $800 to $1,499 | 0 (0.0%) | 30 (7.2%) |
| $800 to $1,499 | 0 (0.0%) | 10 (2.4%) |
| Total | 326 (100.0%) | 418 (100.0%) |
Health & Disability in Patillas
Health Insurance Coverage by Age in Patillas
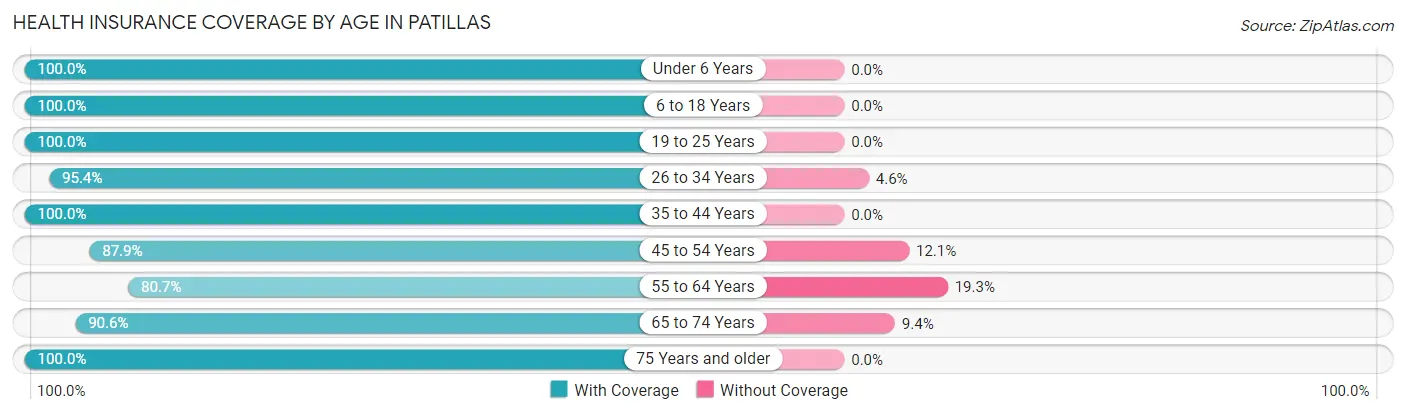
| Age Bracket | With Coverage | Without Coverage |
| Under 6 Years | 217 (100.0%) | 0 (0.0%) |
| 6 to 18 Years | 340 (100.0%) | 0 (0.0%) |
| 19 to 25 Years | 64 (100.0%) | 0 (0.0%) |
| 26 to 34 Years | 396 (95.4%) | 19 (4.6%) |
| 35 to 44 Years | 135 (100.0%) | 0 (0.0%) |
| 45 to 54 Years | 357 (87.9%) | 49 (12.1%) |
| 55 to 64 Years | 456 (80.7%) | 109 (19.3%) |
| 65 to 74 Years | 374 (90.6%) | 39 (9.4%) |
| 75 Years and older | 400 (100.0%) | 0 (0.0%) |
| Total | 2,739 (92.7%) | 216 (7.3%) |
Health Insurance Coverage by Citizenship Status in Patillas

| Citizenship Status | With Coverage | Without Coverage |
| Native Born | 217 (100.0%) | 0 (0.0%) |
| Foreign Born, Citizen | 340 (100.0%) | 0 (0.0%) |
| Foreign Born, not a Citizen | 64 (100.0%) | 0 (0.0%) |
Health Insurance Coverage by Household Income in Patillas
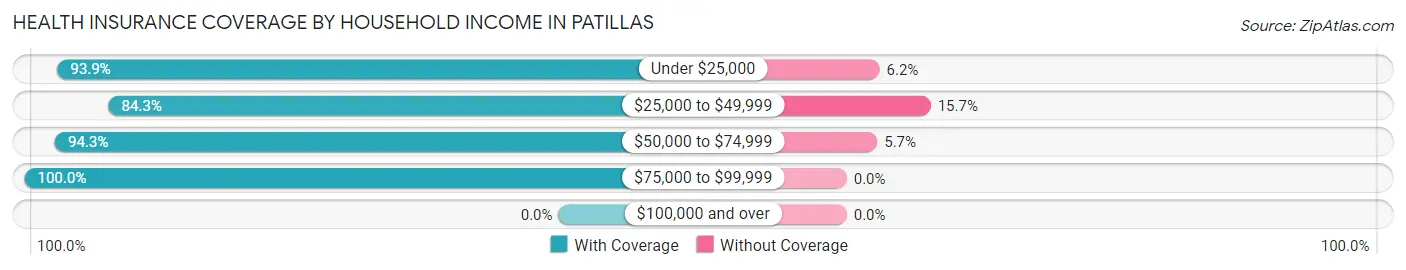
| Household Income | With Coverage | Without Coverage |
| Under $25,000 | 1,617 (93.9%) | 106 (6.1%) |
| $25,000 to $49,999 | 391 (84.3%) | 73 (15.7%) |
| $50,000 to $74,999 | 611 (94.3%) | 37 (5.7%) |
| $75,000 to $99,999 | 120 (100.0%) | 0 (0.0%) |
| $100,000 and over | 0 (0.0%) | 0 (0.0%) |
Public vs Private Health Insurance Coverage by Age in Patillas
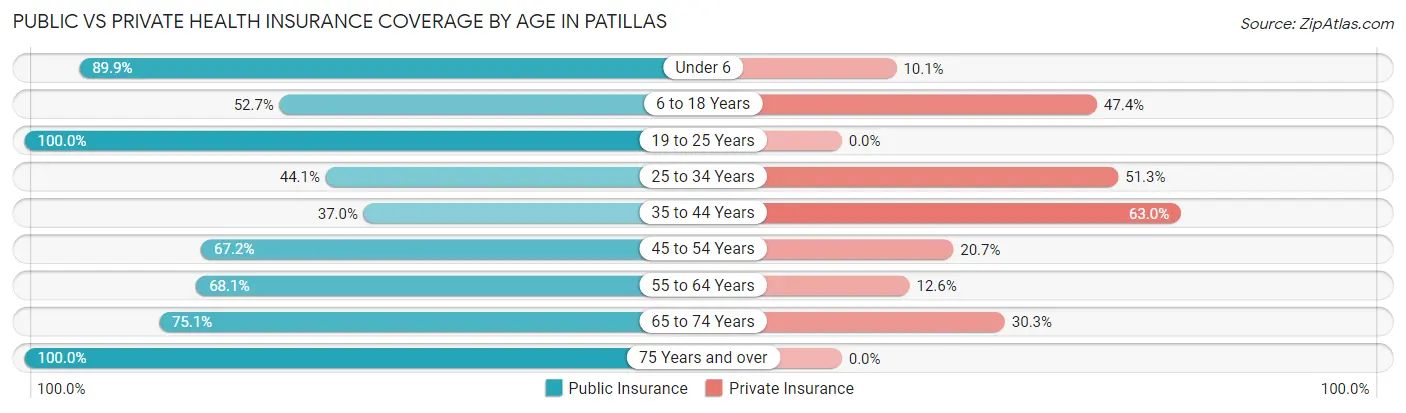
| Age Bracket | Public Insurance | Private Insurance |
| Under 6 | 195 (89.9%) | 22 (10.1%) |
| 6 to 18 Years | 179 (52.6%) | 161 (47.3%) |
| 19 to 25 Years | 64 (100.0%) | 0 (0.0%) |
| 25 to 34 Years | 183 (44.1%) | 213 (51.3%) |
| 35 to 44 Years | 50 (37.0%) | 85 (63.0%) |
| 45 to 54 Years | 273 (67.2%) | 84 (20.7%) |
| 55 to 64 Years | 385 (68.1%) | 71 (12.6%) |
| 65 to 74 Years | 310 (75.1%) | 125 (30.3%) |
| 75 Years and over | 400 (100.0%) | 0 (0.0%) |
| Total | 2,039 (69.0%) | 761 (25.8%) |
Disability Status by Sex by Age in Patillas
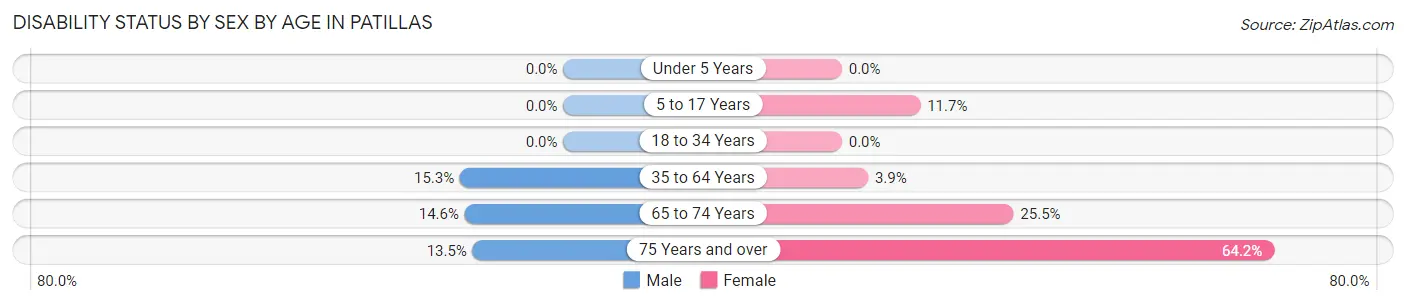
| Age Bracket | Male | Female |
| Under 5 Years | 0 (0.0%) | 0 (0.0%) |
| 5 to 17 Years | 0 (0.0%) | 24 (11.7%) |
| 18 to 34 Years | 0 (0.0%) | 0 (0.0%) |
| 35 to 64 Years | 83 (15.3%) | 22 (3.9%) |
| 65 to 74 Years | 30 (14.6%) | 53 (25.5%) |
| 75 Years and over | 14 (13.5%) | 190 (64.2%) |
Disability Class by Sex by Age in Patillas
Disability Class: Hearing Difficulty
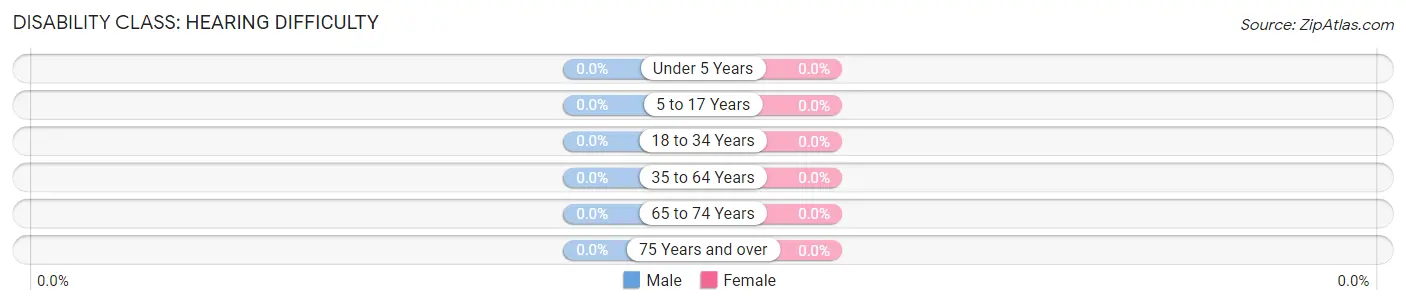
| Age Bracket | Male | Female |
| Under 5 Years | 0 (0.0%) | 0 (0.0%) |
| 5 to 17 Years | 0 (0.0%) | 0 (0.0%) |
| 18 to 34 Years | 0 (0.0%) | 0 (0.0%) |
| 35 to 64 Years | 0 (0.0%) | 0 (0.0%) |
| 65 to 74 Years | 0 (0.0%) | 0 (0.0%) |
| 75 Years and over | 0 (0.0%) | 0 (0.0%) |
Disability Class: Vision Difficulty
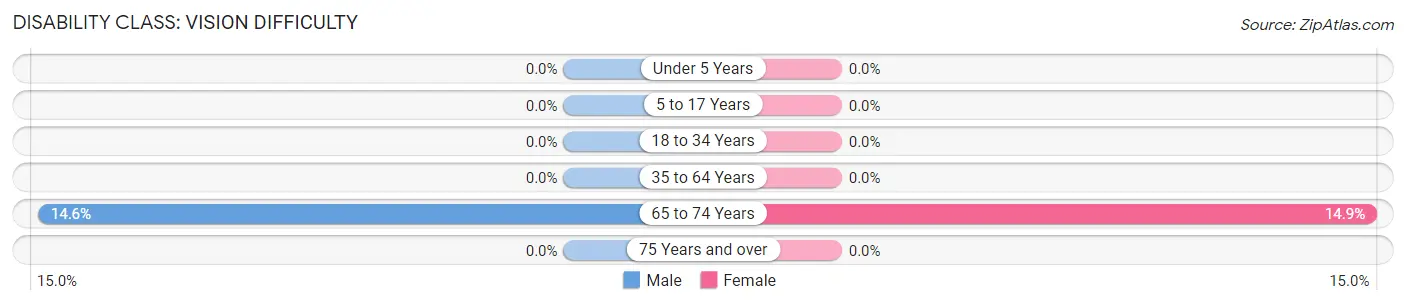
| Age Bracket | Male | Female |
| Under 5 Years | 0 (0.0%) | 0 (0.0%) |
| 5 to 17 Years | 0 (0.0%) | 0 (0.0%) |
| 18 to 34 Years | 0 (0.0%) | 0 (0.0%) |
| 35 to 64 Years | 0 (0.0%) | 0 (0.0%) |
| 65 to 74 Years | 30 (14.6%) | 31 (14.9%) |
| 75 Years and over | 0 (0.0%) | 0 (0.0%) |
Disability Class: Cognitive Difficulty
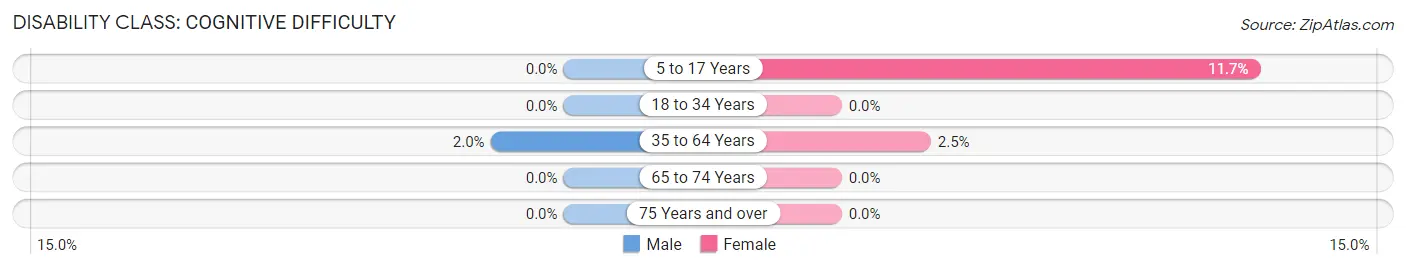
| Age Bracket | Male | Female |
| 5 to 17 Years | 0 (0.0%) | 24 (11.7%) |
| 18 to 34 Years | 0 (0.0%) | 0 (0.0%) |
| 35 to 64 Years | 11 (2.0%) | 14 (2.5%) |
| 65 to 74 Years | 0 (0.0%) | 0 (0.0%) |
| 75 Years and over | 0 (0.0%) | 0 (0.0%) |
Disability Class: Ambulatory Difficulty
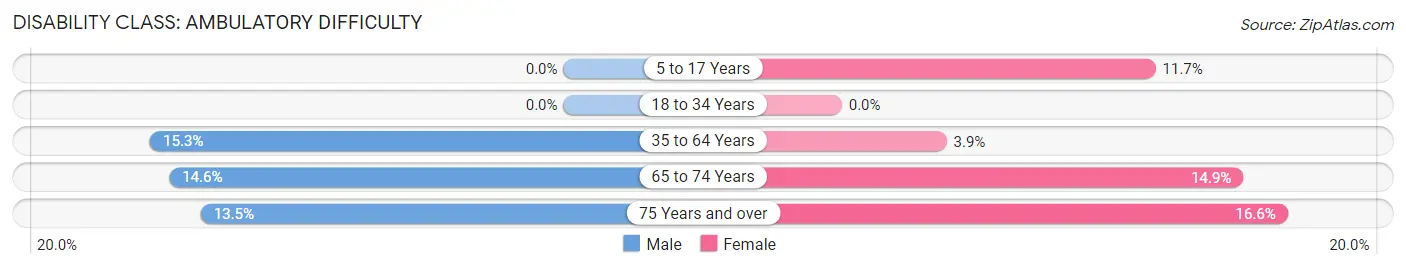
| Age Bracket | Male | Female |
| 5 to 17 Years | 0 (0.0%) | 24 (11.7%) |
| 18 to 34 Years | 0 (0.0%) | 0 (0.0%) |
| 35 to 64 Years | 83 (15.3%) | 22 (3.9%) |
| 65 to 74 Years | 30 (14.6%) | 31 (14.9%) |
| 75 Years and over | 14 (13.5%) | 49 (16.6%) |
Disability Class: Self-Care Difficulty
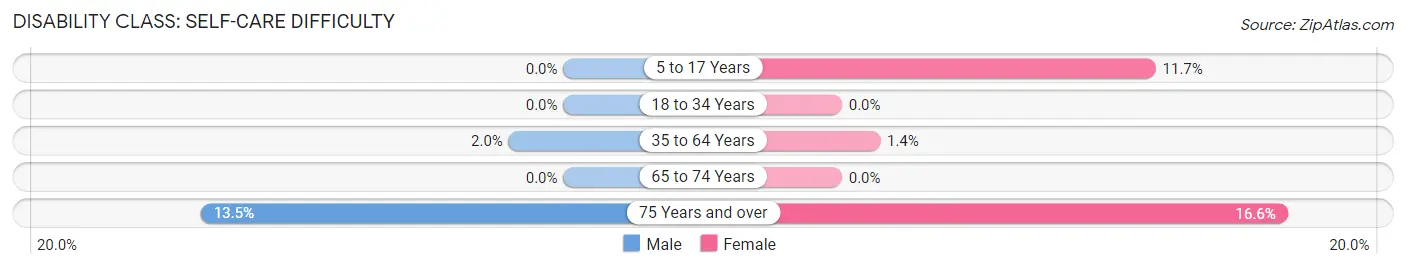
| Age Bracket | Male | Female |
| 5 to 17 Years | 0 (0.0%) | 24 (11.7%) |
| 18 to 34 Years | 0 (0.0%) | 0 (0.0%) |
| 35 to 64 Years | 11 (2.0%) | 8 (1.4%) |
| 65 to 74 Years | 0 (0.0%) | 0 (0.0%) |
| 75 Years and over | 14 (13.5%) | 49 (16.6%) |
Technology Access in Patillas
Computing Device Access in Patillas
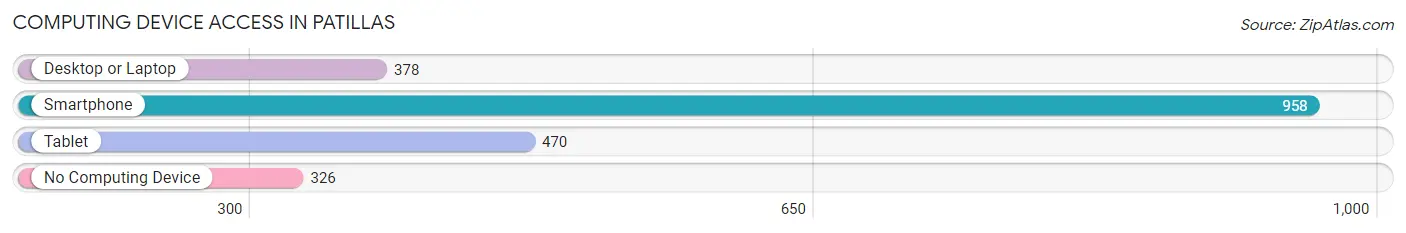
| Device Type | # Households | % Households |
| Desktop or Laptop | 378 | 28.1% |
| Smartphone | 958 | 71.3% |
| Tablet | 470 | 35.0% |
| No Computing Device | 326 | 24.3% |
| Total | 1,343 | 100.0% |
Internet Access in Patillas
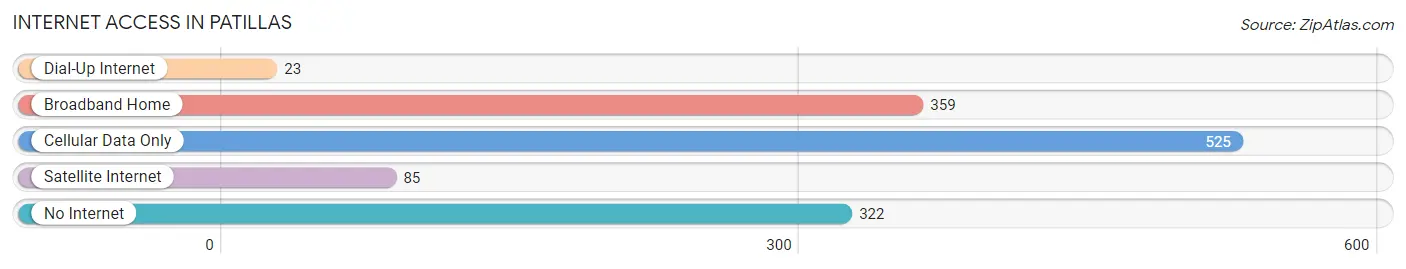
| Internet Type | # Households | % Households |
| Dial-Up Internet | 23 | 1.7% |
| Broadband Home | 359 | 26.7% |
| Cellular Data Only | 525 | 39.1% |
| Satellite Internet | 85 | 6.3% |
| No Internet | 322 | 24.0% |
| Total | 1,343 | 100.0% |
Patillas Summary
Patillas is a municipality located in the southeastern region of Puerto Rico. It is part of the Guayama Metropolitan Statistical Area and is bordered by the municipalities of Arroyo, Guayama, and Yabucoa. The municipality has a total area of 39.9 square miles and a population of approximately 24,000 people as of the 2010 census.
Geography
Patillas is located in the southeastern region of Puerto Rico, bordered by the municipalities of Arroyo, Guayama, and Yabucoa. The municipality has a total area of 39.9 square miles and is located at an elevation of approximately 200 feet above sea level. The terrain is mostly flat with some rolling hills. The climate is tropical with an average temperature of 79°F.
The municipality is home to several rivers, including the Patillas River, which is the longest river in the municipality. Other rivers include the Cibuco, Guayanes, and Yabucoa Rivers. The municipality also has several lagoons, including the Patillas Lagoon, which is the largest in the municipality.
History
The area that is now Patillas was originally inhabited by the Taíno people. The first Spanish settlers arrived in the area in the 16th century and established a settlement called San Antonio de la Tuna. The settlement was later renamed Patillas after the Patillas River.
In 1838, Patillas was officially declared a municipality. During the 19th century, the municipality experienced a period of economic growth due to the production of sugar cane and tobacco. In the 20th century, the economy shifted to focus on the production of coffee and other agricultural products.
Economy
The economy of Patillas is largely based on agriculture. The main crops grown in the municipality are coffee, plantains, bananas, and sugar cane. The municipality also has a thriving fishing industry, with the Patillas Lagoon being a major source of fish and shellfish.
In addition to agriculture and fishing, Patillas also has a growing tourism industry. The municipality is home to several beaches, including Playa de Patillas and Playa de Guayanes. The municipality also has several historical sites, including the ruins of the San Antonio de la Tuna settlement.
Demographics
As of the 2010 census, Patillas had a population of approximately 24,000 people. The population is largely of Puerto Rican descent, with a small percentage of African and European descent. The majority of the population is Roman Catholic, with a small percentage of other religious affiliations.
The median household income in Patillas is approximately $20,000, which is lower than the national average. The unemployment rate in the municipality is also higher than the national average, at approximately 15%.
Conclusion
Patillas is a municipality located in the southeastern region of Puerto Rico. It is bordered by the municipalities of Arroyo, Guayama, and Yabucoa and has a total area of 39.9 square miles. The population of Patillas is approximately 24,000 people, with a majority of Puerto Rican descent. The economy of Patillas is largely based on agriculture, fishing, and tourism. The median household income in Patillas is approximately $20,000, and the unemployment rate is approximately 15%.
Common Questions
What is Per Capita Income in Patillas?
Per Capita income in Patillas is $11,286.
What is the Median Family Income in Patillas?
Median Family Income in Patillas is $21,206.
What is the Median Household income in Patillas?
Median Household Income in Patillas is $14,219.
What is Income or Wage Gap in Patillas?
Income or Wage Gap in Patillas is 17.0%.
Women in Patillas earn 83.0 cents for every dollar earned by a man.
What is Inequality or Gini Index in Patillas?
Inequality or Gini Index in Patillas is 0.53.
What is the Total Population of Patillas?
Total Population of Patillas is 2,955.
What is the Total Male Population of Patillas?
Total Male Population of Patillas is 1,356.
What is the Total Female Population of Patillas?
Total Female Population of Patillas is 1,599.
What is the Ratio of Males per 100 Females in Patillas?
There are 84.80 Males per 100 Females in Patillas.
What is the Ratio of Females per 100 Males in Patillas?
There are 117.92 Females per 100 Males in Patillas.
What is the Median Population Age in Patillas?
Median Population Age in Patillas is 52.3 Years.
What is the Average Family Size in Patillas
Average Family Size in Patillas is 3.1 People.
What is the Average Household Size in Patillas
Average Household Size in Patillas is 2.2 People.
How Large is the Labor Force in Patillas?
There are 826 People in the Labor Forcein in Patillas.
What is the Percentage of People in the Labor Force in Patillas?
33.9% of People are in the Labor Force in Patillas.
What is the Unemployment Rate in Patillas?
Unemployment Rate in Patillas is 10.3%.