Zip Codes with the Highest Percentage of Population Employed in Sales & Related in Pittsburgh, PA

RELATED REPORTS & OPTIONS

Sales & Related
Population
Families and Households
Female Fertility
Female Fertility (Unmarried)
Race (Community Size)
Race (Percentage)
Ancestry (Community Size)
AfghanAfricanAlbanianAlsatianAmericanApacheArabArgentineanArmenianAustralianAustrianBahamianBarbadianBasqueBelgianBhutaneseBlackfeetBolivianBrazilianBritishBritish West IndianBulgarianBurmeseCajunCambodianCanadianCape VerdeanCarpatho RusynCelticCentral AmericanCentral American IndianCherokeeChickasawChileanChippewaChoctawColombianComancheCosta RicanCreekCroatianCubanCypriotCzechCzechoslovakianDanishDelawareDominicanDutchEastern EuropeanEcuadorianEgyptianEnglishEthiopianEuropeanFilipinoFinnishFrenchFrench American IndianFrench CanadianGermanGhanaianGreekGuamanian / ChamorroGuatemalanGuyaneseHaitianHonduranHungarianIndian (Asian)IndonesianIranianIraqiIrishIroquoisIsraeliItalianJamaicanJapaneseJordanianKenyanKoreanLaotianLatvianLebaneseLiberianLithuanianLumbeeLuxembourgerMacedonianMalaysianMalteseMexicanMexican American IndianMongolianMoroccanNative HawaiianNavajoNew ZealanderNicaraguanNigerianNorthern EuropeanNorwegianPakistaniPalestinianPanamanianParaguayanPennsylvania GermanPeruvianPolishPortuguesePuerto RicanRomanianRussianSalvadoranSamoanScandinavianScotch-IrishScottishSeminoleSerbianSiouxSlavicSlovakSloveneSouth AfricanSouth AmericanSouth American IndianSoviet UnionSpaniardSpanishSri LankanSubsaharan AfricanSudaneseSwedishSwissSyrianThaiTrinidadian and TobagonianTurkishU.S. Virgin IslanderUgandanUkrainianUruguayanVenezuelanVietnameseWelshWest IndianYugoslavian
Ancestry (Percentage)
AfghanAfricanAlbanianAlsatianAmericanApacheArabArgentineanArmenianAustralianAustrianBahamianBarbadianBasqueBelgianBhutaneseBlackfeetBolivianBrazilianBritishBritish West IndianBulgarianBurmeseCajunCambodianCanadianCape VerdeanCarpatho RusynCelticCentral AmericanCentral American IndianCherokeeChickasawChileanChippewaChoctawColombianComancheCosta RicanCreekCroatianCubanCypriotCzechCzechoslovakianDanishDelawareDominicanDutchEastern EuropeanEcuadorianEgyptianEnglishEthiopianEuropeanFilipinoFinnishFrenchFrench American IndianFrench CanadianGermanGhanaianGreekGuamanian / ChamorroGuatemalanGuyaneseHaitianHonduranHungarianIndian (Asian)IndonesianIranianIraqiIrishIroquoisIsraeliItalianJamaicanJapaneseJordanianKenyanKoreanLaotianLatvianLebaneseLiberianLithuanianLumbeeLuxembourgerMacedonianMalaysianMalteseMexicanMexican American IndianMongolianMoroccanNative HawaiianNavajoNew ZealanderNicaraguanNigerianNorthern EuropeanNorwegianPakistaniPalestinianPanamanianParaguayanPennsylvania GermanPeruvianPolishPortuguesePuerto RicanRomanianRussianSalvadoranSamoanScandinavianScotch-IrishScottishSeminoleSerbianSiouxSlavicSlovakSloveneSouth AfricanSouth AmericanSouth American IndianSoviet UnionSpaniardSpanishSri LankanSubsaharan AfricanSudaneseSwedishSwissSyrianThaiTrinidadian and TobagonianTurkishU.S. Virgin IslanderUgandanUkrainianUruguayanVenezuelanVietnameseWelshWest IndianYugoslavian
Immigrant Origin (Total)
AfghanistanAfricaAlbaniaArgentinaAsiaAustraliaAustriaBahamasBangladeshBelarusBelgiumBoliviaBosnia and HerzegovinaBrazilBulgariaBurma / MyanmarCambodiaCameroonCanadaCaribbeanCentral AmericaChileChinaColombiaCongoCosta RicaCroatiaCubaCzechoslovakiaDenmarkDominican RepublicEastern AfricaEastern AsiaEastern EuropeEcuadorEgyptEl SalvadorEnglandEritreaEthiopiaEuropeFranceGermanyGhanaGreeceGuatemalaGuyanaHaitiHondurasHong KongHungaryIndiaIndonesiaIranIraqIrelandIsraelItalyJamaicaJapanJordanKazakhstanKenyaKoreaKuwaitLatin AmericaLatviaLebanonLiberiaLithuaniaMalaysiaMexicoMiddle AfricaMoldovaMoroccoNepalNetherlandsNigeriaNorthern AfricaNorthern EuropeNorwayOceaniaPakistanPanamaPeruPhilippinesPolandPortugalRomaniaRussiaSaudi ArabiaScotlandSerbiaSingaporeSouth AfricaSouth AmericaSouth Central AsiaSouth Eastern AsiaSouthern EuropeSpainSri LankaSudanSwedenSwitzerlandSyriaTaiwanThailandTrinidad and TobagoTurkeyUgandaUkraineUzbekistanVenezuelaVietnamWestern AfricaWestern AsiaWestern EuropeZaire
Immigrant Origin (Percentage)
AfghanistanAfricaAlbaniaArgentinaAsiaAustraliaAustriaBahamasBangladeshBelarusBelgiumBoliviaBosnia and HerzegovinaBrazilBulgariaBurma / MyanmarCambodiaCameroonCanadaCaribbeanCentral AmericaChileChinaColombiaCongoCosta RicaCroatiaCubaCzechoslovakiaDenmarkDominican RepublicEastern AfricaEastern AsiaEastern EuropeEcuadorEgyptEl SalvadorEnglandEritreaEthiopiaEuropeFranceGermanyGhanaGreeceGuatemalaGuyanaHaitiHondurasHong KongHungaryIndiaIndonesiaIranIraqIrelandIsraelItalyJamaicaJapanJordanKazakhstanKenyaKoreaKuwaitLatin AmericaLatviaLebanonLiberiaLithuaniaMalaysiaMexicoMiddle AfricaMoldovaMoroccoNepalNetherlandsNigeriaNorthern AfricaNorthern EuropeNorwayOceaniaPakistanPanamaPeruPhilippinesPolandPortugalRomaniaRussiaSaudi ArabiaScotlandSerbiaSingaporeSouth AfricaSouth AmericaSouth Central AsiaSouth Eastern AsiaSouthern EuropeSpainSri LankaSudanSwedenSwitzerlandSyriaTaiwanThailandTrinidad and TobagoTurkeyUgandaUkraineUzbekistanVenezuelaVietnamWestern AfricaWestern AsiaWestern EuropeZaire
Income
Income (Families)
Income (Households)
Poverty
Poverty (Families)
Unemployment
Employment Occupations
Employment Industries
Employer Class
Commute Time
Commute Means
School Enrollment
Education by Degree Field
Occupancy
Finances
Physical Characteristics
Pittsburgh
Compare Zip Codes
Comparison Subject

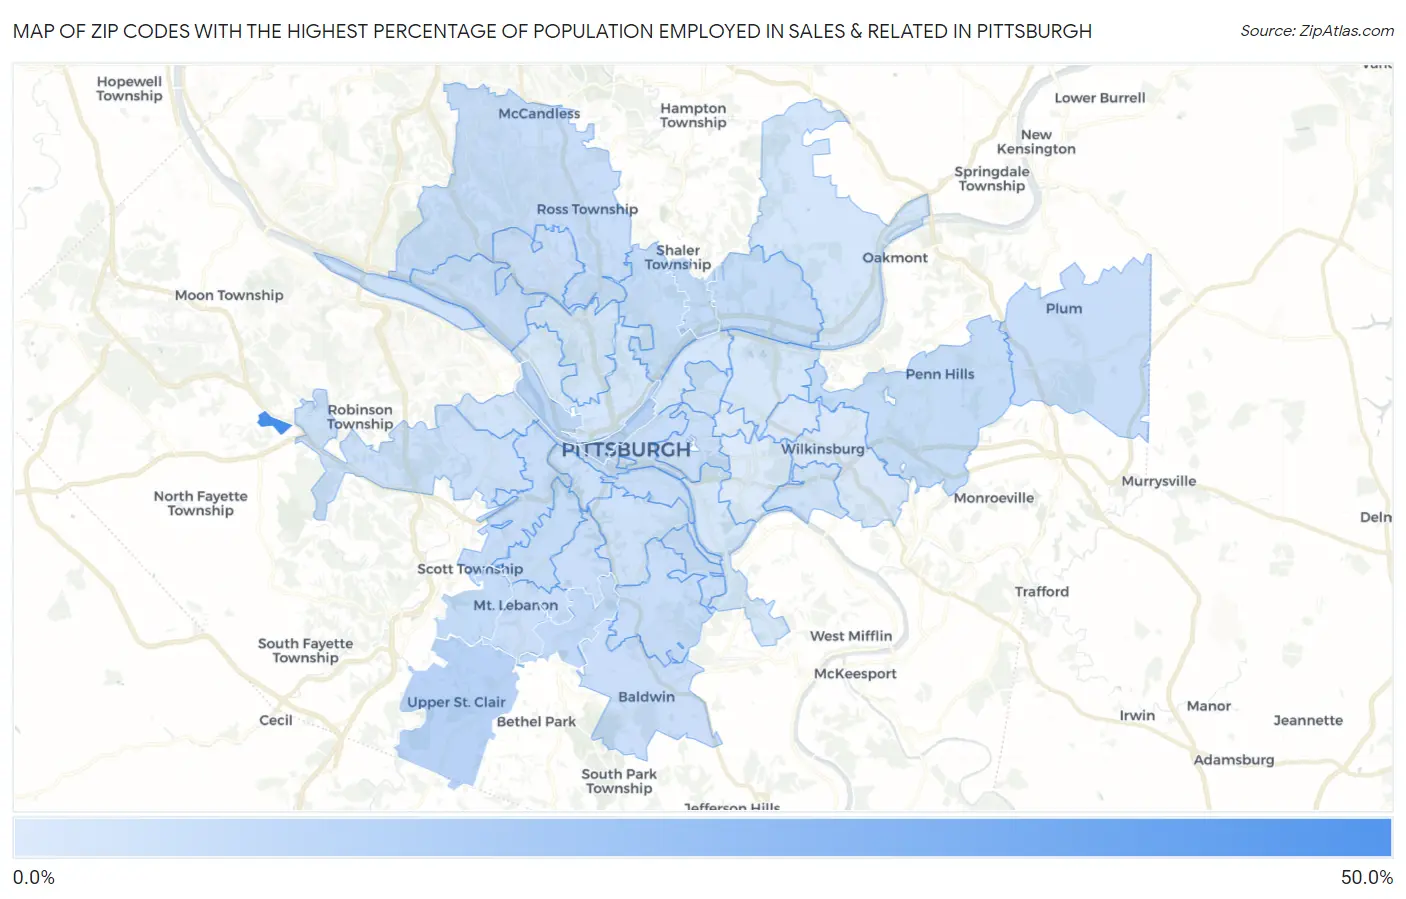
Map of Zip Codes with the Highest Percentage of Population Employed in Sales & Related in Pittsburgh

0.0%
50.0%
Zip Codes with the Highest Percentage of Population Employed in Sales & Related in Pittsburgh Map

Zip Codes with the Highest Percentage of Population Employed in Sales & Related in Pittsburgh, PA

Zip Code % Employed vs State vs National
1.1527550.0%9.1%(+40.9)#79.6%(+40.4)#124
2.1522214.6%9.1%(+5.41)#1589.6%(+4.96)#3,050
3.1524114.3%9.1%(+5.13)#1749.6%(+4.68)#3,284
4.1523312.8%9.1%(+3.66)#2219.6%(+3.21)#4,747
5.1523411.7%9.1%(+2.55)#3219.6%(+2.09)#6,623
6.1524311.4%9.1%(+2.28)#3419.6%(+1.83)#7,208
7.1522311.3%9.1%(+2.18)#3569.6%(+1.73)#7,422
8.1521610.7%9.1%(+1.59)#4199.6%(+1.14)#8,886
9.1520910.6%9.1%(+1.45)#4359.6%(+0.995)#9,299
10.1521510.6%9.1%(+1.41)#4399.6%(+0.960)#9,402
11.1523510.4%9.1%(+1.25)#4579.6%(+0.800)#9,827
12.1522010.2%9.1%(+1.07)#4839.6%(+0.617)#10,385
13.1523910.2%9.1%(+1.03)#4999.6%(+0.574)#10,520
14.1521910.1%9.1%(+0.980)#5059.6%(+0.525)#10,656
15.1520310.0%9.1%(+0.883)#5239.6%(+0.429)#10,933
16.152279.9%9.1%(+0.789)#5429.6%(+0.335)#11,234
17.152029.9%9.1%(+0.785)#5439.6%(+0.330)#11,244
18.152379.7%9.1%(+0.514)#5929.6%(+0.060)#12,196
19.152369.5%9.1%(+0.393)#6219.6%(-0.062)#12,638
20.152269.5%9.1%(+0.345)#6289.6%(-0.110)#12,787
21.152139.4%9.1%(+0.277)#6439.6%(-0.177)#13,022
22.152289.4%9.1%(+0.236)#6529.6%(-0.218)#13,154
23.152299.2%9.1%(+0.019)#6969.6%(-0.435)#13,945
24.152118.9%9.1%(-0.239)#7389.6%(-0.693)#14,890
25.152058.8%9.1%(-0.388)#7759.6%(-0.842)#15,430
26.152108.3%9.1%(-0.828)#8789.6%(-1.28)#17,026
27.152828.3%9.1%(-0.833)#8799.6%(-1.29)#17,038
28.152258.2%9.1%(-0.941)#8999.6%(-1.40)#17,407
29.152248.0%9.1%(-1.14)#9339.6%(-1.59)#18,034
30.152187.9%9.1%(-1.23)#9549.6%(-1.69)#18,327
31.152047.8%9.1%(-1.36)#9759.6%(-1.81)#18,717
32.152147.2%9.1%(-1.99)#1,0939.6%(-2.44)#20,770
33.152387.1%9.1%(-2.00)#1,0979.6%(-2.45)#20,785
34.152016.5%9.1%(-2.62)#1,1949.6%(-3.08)#22,403
35.152066.4%9.1%(-2.70)#1,2039.6%(-3.15)#22,581
36.152126.3%9.1%(-2.80)#1,2179.6%(-3.25)#22,852
37.152076.2%9.1%(-2.97)#1,2479.6%(-3.42)#23,262
38.152085.8%9.1%(-3.31)#1,2929.6%(-3.76)#24,003
39.152215.5%9.1%(-3.62)#1,3369.6%(-4.07)#24,630
40.152324.7%9.1%(-4.40)#1,4099.6%(-4.86)#26,009
41.152174.6%9.1%(-4.57)#1,4209.6%(-5.03)#26,250

Common Questions

What are the Top 10 Zip Codes with the Highest Percentage of Population Employed in Sales & Related in Pittsburgh, PA?
Top 10 Zip Codes with the Highest Percentage of Population Employed in Sales & Related in Pittsburgh, PA are:
#1
50.0%
#2
14.6%
#3
14.3%
#4
12.8%
#5
11.7%
#6
11.4%
#7
11.3%
#8
10.7%
#9
10.6%
#10
10.6%
What zip code has the Highest Percentage of Population Employed in Sales & Related in Pittsburgh, PA?
15275 has the Highest Percentage of Population Employed in Sales & Related in Pittsburgh, PA with 50.0%.
What is the Percentage of Population Employed in Sales & Related in Pittsburgh, PA?
Percentage of Population Employed in Sales & Related in Pittsburgh is 7.7%.
What is the Percentage of Population Employed in Sales & Related in Pennsylvania?
Percentage of Population Employed in Sales & Related in Pennsylvania is 9.1%.
What is the Percentage of Population Employed in Sales & Related in the United States?
Percentage of Population Employed in Sales & Related in the United States is 9.6%.