Zip Codes with the Highest Percentage of Private Company Employees in Genesee, PA
RELATED REPORTS & OPTIONS
Private Company Employees
Genesee
Compare Zip Codes
Map of Zip Codes with the Highest Percentage of Private Company Employees in Genesee
38.2%
54.8%
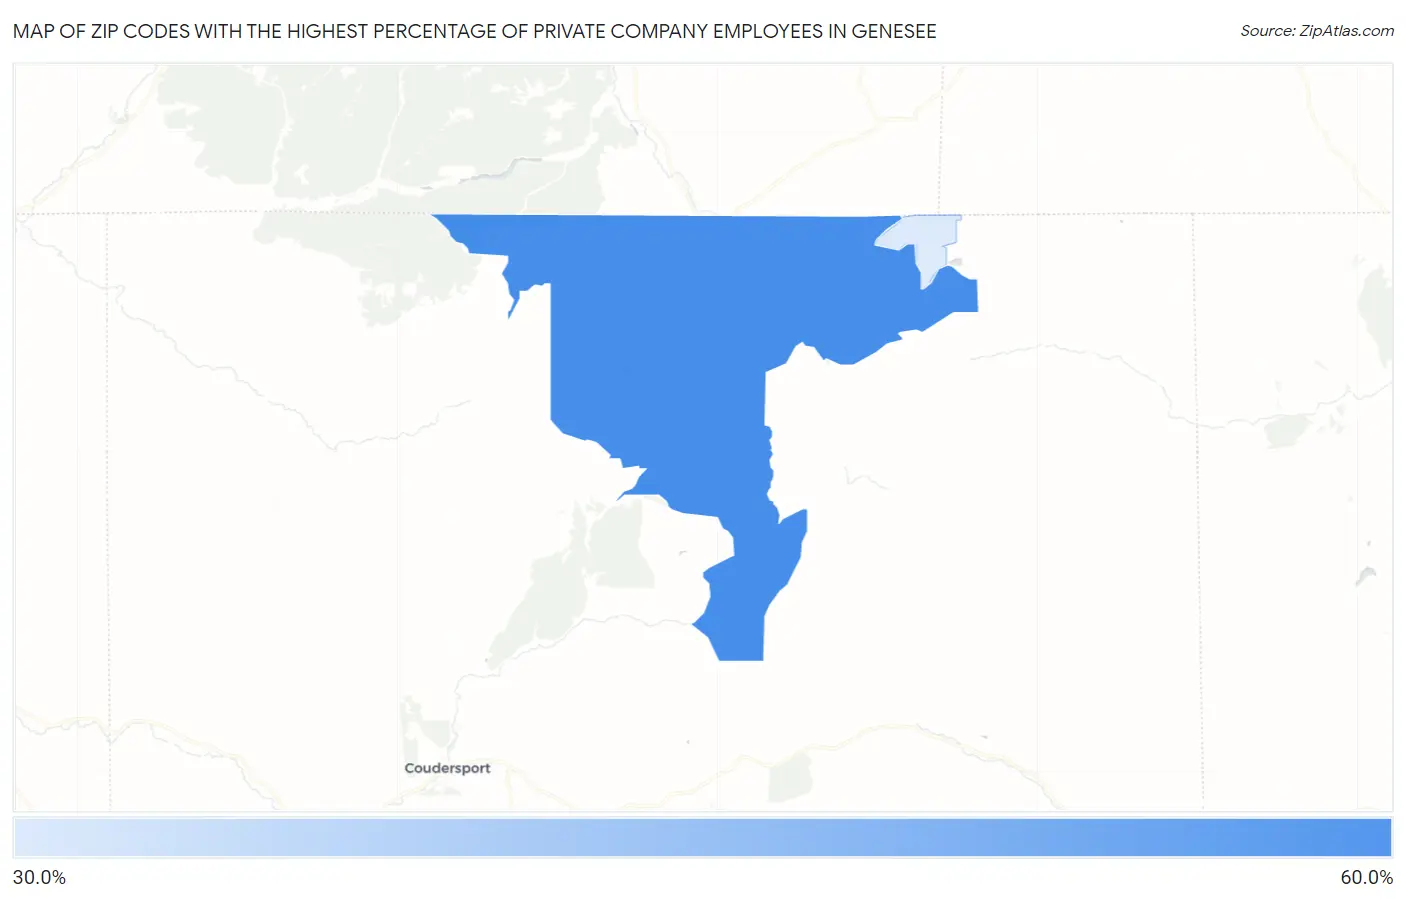
Zip Codes with the Highest Percentage of Private Company Employees in Genesee, PA
| Zip Code | % Private Company Employees | vs State | vs National | |
| 1. | 16923 | 54.8% | 68.2%(-13.4)#1,641 | 66.9%(-12.1)#26,255 |
| 2. | 16941 | 38.2% | 68.2%(-30.0)#1,759 | 66.9%(-28.7)#30,922 |
1
Common Questions
What are the Top Zip Codes with the Highest Percentage of Private Company Employees in Genesee, PA?
Top Zip Codes with the Highest Percentage of Private Company Employees in Genesee, PA are:
What zip code has the Highest Percentage of Private Company Employees in Genesee, PA?
16923 has the Highest Percentage of Private Company Employees in Genesee, PA with 54.8%.
What is the Percentage of Private Company Employees in Pennsylvania?
Percentage of Private Company Employees in Pennsylvania is 68.2%.
What is the Percentage of Private Company Employees in the United States?
Percentage of Private Company Employees in the United States is 66.9%.