West Elizabeth borough, PA Map & Demographics
West Elizabeth borough Overview
$26,883
PER CAPITA INCOME
$77,500
AVG FAMILY INCOME
$57,273
AVG HOUSEHOLD INCOME
46.3%
WAGE / INCOME GAP [ % ]
53.7¢/ $1
WAGE / INCOME GAP [ $ ]
0.37
INEQUALITY / GINI INDEX
456
TOTAL POPULATION
242
MALE POPULATION
214
FEMALE POPULATION
113.08
MALES / 100 FEMALES
88.43
FEMALES / 100 MALES
48.0
MEDIAN AGE
3.3
AVG FAMILY SIZE
2.8
AVG HOUSEHOLD SIZE
263
LABOR FORCE [ PEOPLE ]
67.8%
PERCENT IN LABOR FORCE
9.1%
UNEMPLOYMENT RATE
Income in West Elizabeth borough
Income Overview in West Elizabeth borough
Per Capita Income in West Elizabeth borough is $26,883, while median incomes of families and households are $77,500 and $57,273 respectively.
| Characteristic | Number | Measure |
| Per Capita Income | 456 | $26,883 |
| Median Family Income | 106 | $77,500 |
| Mean Family Income | 106 | $82,681 |
| Median Household Income | 166 | $57,273 |
| Mean Household Income | 166 | $69,500 |
| Income Deficit | 106 | $0 |
| Wage / Income Gap (%) | 456 | 46.31% |
| Wage / Income Gap ($) | 456 | 53.69¢ per $1 |
| Gini / Inequality Index | 456 | 0.37 |
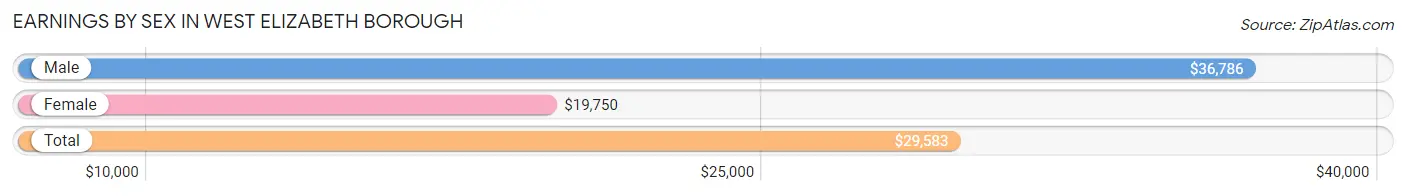
Earnings by Sex in West Elizabeth borough
Average Earnings in West Elizabeth borough are $29,583, $36,786 for men and $19,750 for women, a difference of 46.3%.
| Sex | Number | Average Earnings |
| Male | 128 (46.6%) | $36,786 |
| Female | 147 (53.4%) | $19,750 |
| Total | 275 (100.0%) | $29,583 |
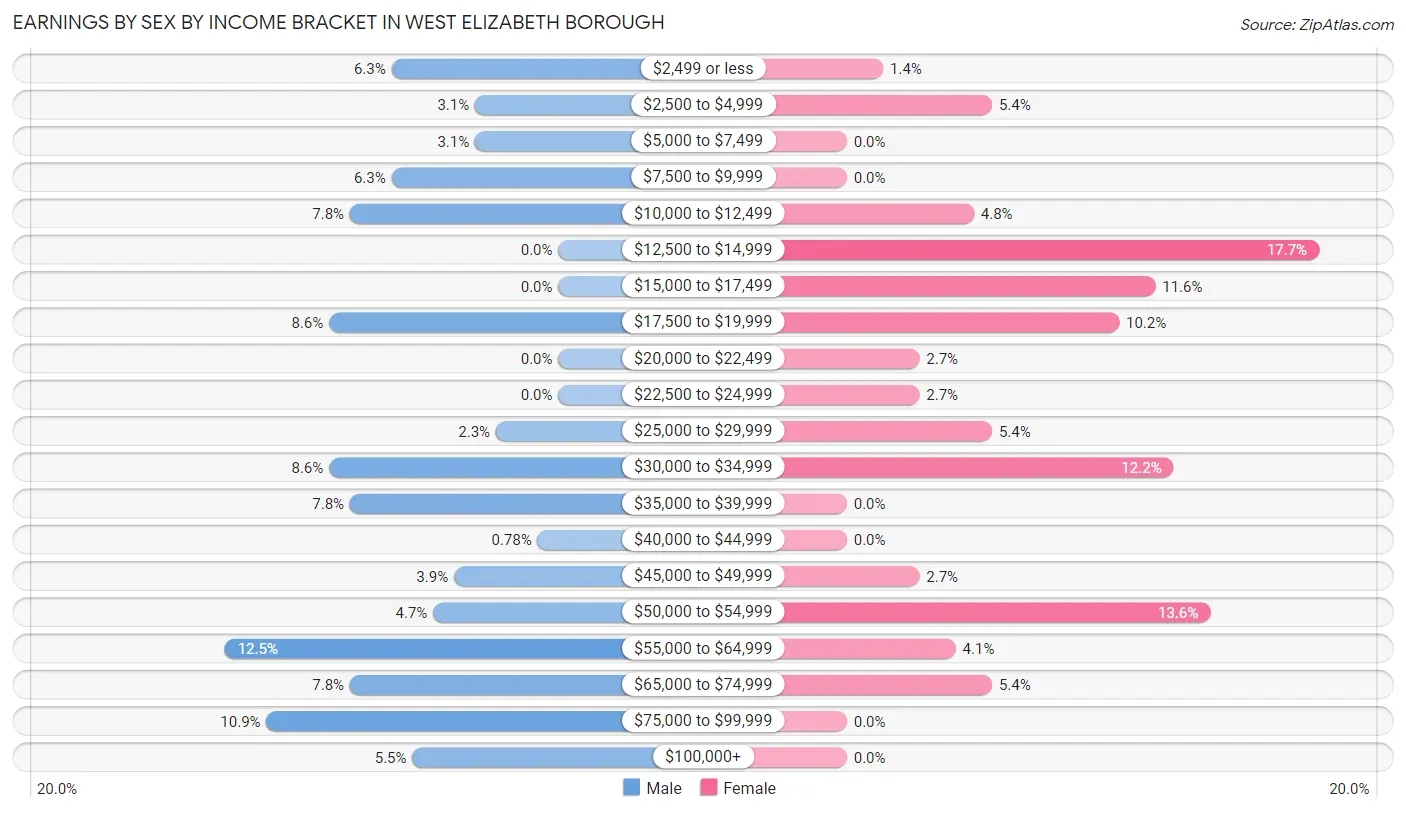
Earnings by Sex by Income Bracket in West Elizabeth borough
The most common earnings brackets in West Elizabeth borough are $55,000 to $64,999 for men (16 | 12.5%) and $12,500 to $14,999 for women (26 | 17.7%).
| Income | Male | Female |
| $2,499 or less | 8 (6.2%) | 2 (1.4%) |
| $2,500 to $4,999 | 4 (3.1%) | 8 (5.4%) |
| $5,000 to $7,499 | 4 (3.1%) | 0 (0.0%) |
| $7,500 to $9,999 | 8 (6.2%) | 0 (0.0%) |
| $10,000 to $12,499 | 10 (7.8%) | 7 (4.8%) |
| $12,500 to $14,999 | 0 (0.0%) | 26 (17.7%) |
| $15,000 to $17,499 | 0 (0.0%) | 17 (11.6%) |
| $17,500 to $19,999 | 11 (8.6%) | 15 (10.2%) |
| $20,000 to $22,499 | 0 (0.0%) | 4 (2.7%) |
| $22,500 to $24,999 | 0 (0.0%) | 4 (2.7%) |
| $25,000 to $29,999 | 3 (2.3%) | 8 (5.4%) |
| $30,000 to $34,999 | 11 (8.6%) | 18 (12.2%) |
| $35,000 to $39,999 | 10 (7.8%) | 0 (0.0%) |
| $40,000 to $44,999 | 1 (0.8%) | 0 (0.0%) |
| $45,000 to $49,999 | 5 (3.9%) | 4 (2.7%) |
| $50,000 to $54,999 | 6 (4.7%) | 20 (13.6%) |
| $55,000 to $64,999 | 16 (12.5%) | 6 (4.1%) |
| $65,000 to $74,999 | 10 (7.8%) | 8 (5.4%) |
| $75,000 to $99,999 | 14 (10.9%) | 0 (0.0%) |
| $100,000+ | 7 (5.5%) | 0 (0.0%) |
| Total | 128 (100.0%) | 147 (100.0%) |
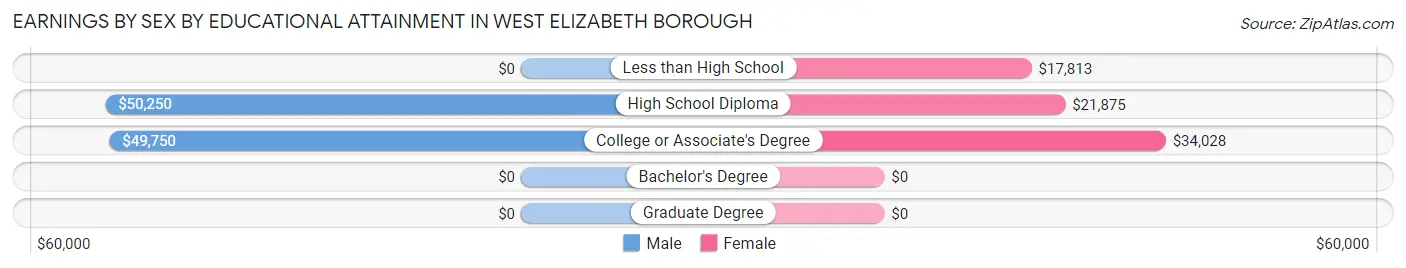
Earnings by Sex by Educational Attainment in West Elizabeth borough
Average earnings in West Elizabeth borough are $50,750 for men and $25,000 for women, a difference of 50.7%. Men with an educational attainment of high school diploma enjoy the highest average annual earnings of $50,250, while those with college or associate's degree education earn the least with $49,750. Women with an educational attainment of college or associate's degree earn the most with the average annual earnings of $34,028, while those with less than high school education have the smallest earnings of $17,813.
| Educational Attainment | Male Income | Female Income |
| Less than High School | - | - |
| High School Diploma | $50,250 | $21,875 |
| College or Associate's Degree | $49,750 | $34,028 |
| Bachelor's Degree | - | - |
| Graduate Degree | - | - |
| Total | $50,750 | $25,000 |
Family Income in West Elizabeth borough
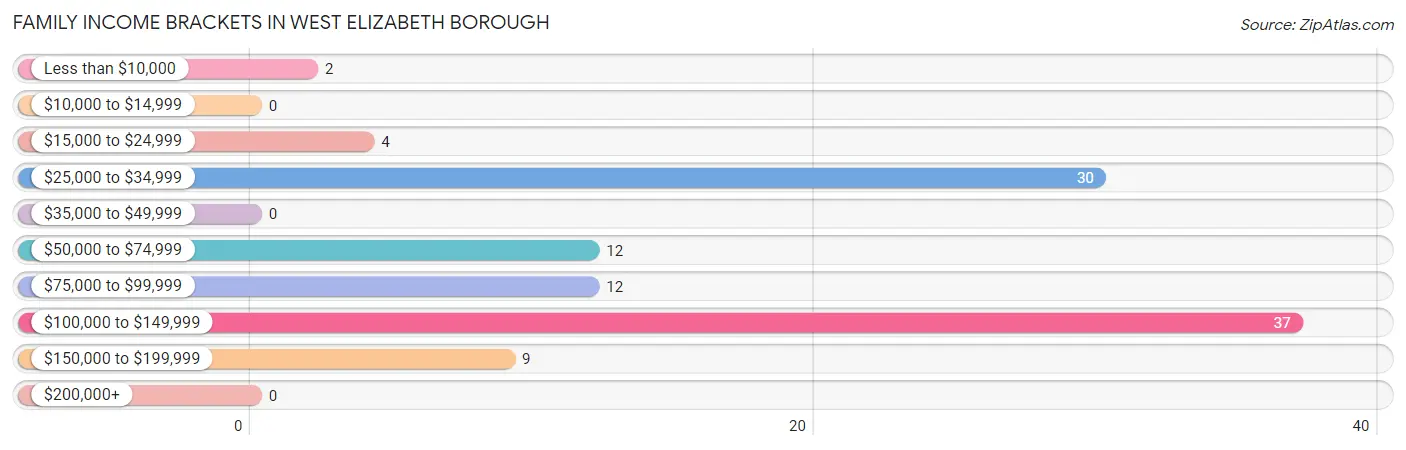
Family Income Brackets in West Elizabeth borough
According to the West Elizabeth borough family income data, there are 37 families falling into the $100,000 to $149,999 income range, which is the most common income bracket and makes up 34.9% of all families.
| Income Bracket | # Families | % Families |
| Less than $10,000 | 2 | 1.9% |
| $10,000 to $14,999 | 0 | 0.0% |
| $15,000 to $24,999 | 4 | 3.8% |
| $25,000 to $34,999 | 30 | 28.3% |
| $35,000 to $49,999 | 0 | 0.0% |
| $50,000 to $74,999 | 12 | 11.3% |
| $75,000 to $99,999 | 12 | 11.3% |
| $100,000 to $149,999 | 37 | 34.9% |
| $150,000 to $199,999 | 9 | 8.5% |
| $200,000+ | 0 | 0.0% |
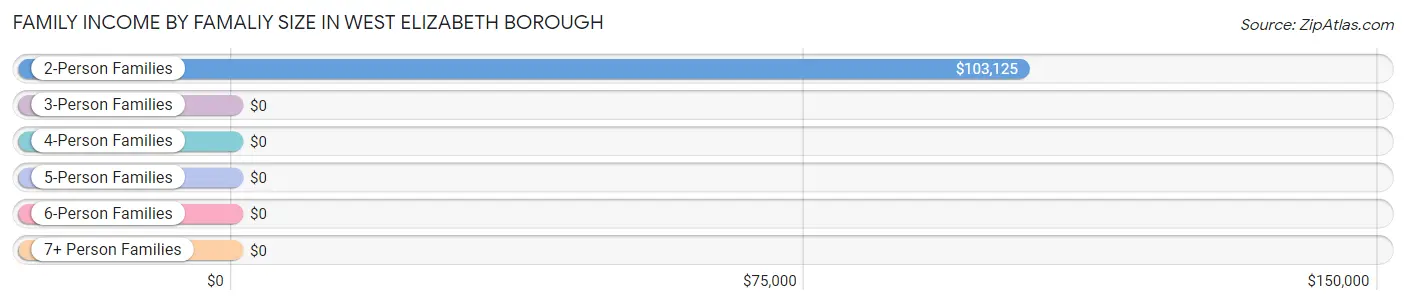
Family Income by Famaliy Size in West Elizabeth borough
2-person families (37 | 34.9%) account for the highest median family income in West Elizabeth borough with $103,125 per family, while 2-person families (37 | 34.9%) have the highest median income of $51,562 per family member.
| Income Bracket | # Families | Median Income |
| 2-Person Families | 37 (34.9%) | $103,125 |
| 3-Person Families | 38 (35.8%) | $0 |
| 4-Person Families | 19 (17.9%) | $0 |
| 5-Person Families | 8 (7.5%) | $0 |
| 6-Person Families | 4 (3.8%) | $0 |
| 7+ Person Families | 0 (0.0%) | $0 |
| Total | 106 (100.0%) | $77,500 |
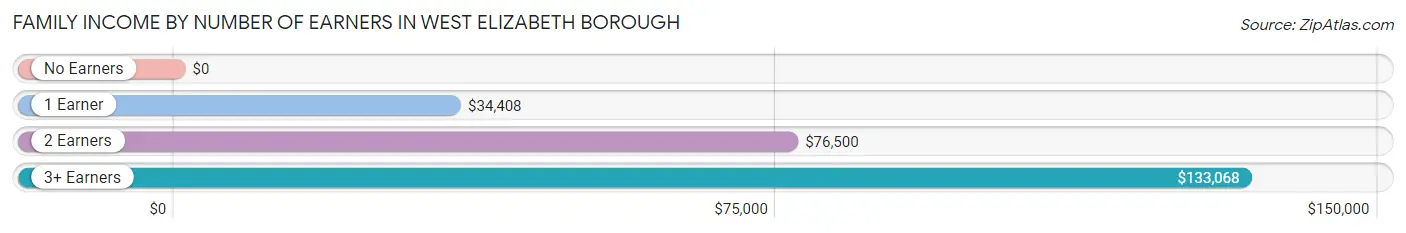
Family Income by Number of Earners in West Elizabeth borough
| Number of Earners | # Families | Median Income |
| No Earners | 6 (5.7%) | $0 |
| 1 Earner | 33 (31.1%) | $34,408 |
| 2 Earners | 40 (37.7%) | $76,500 |
| 3+ Earners | 27 (25.5%) | $133,068 |
| Total | 106 (100.0%) | $77,500 |
Household Income in West Elizabeth borough
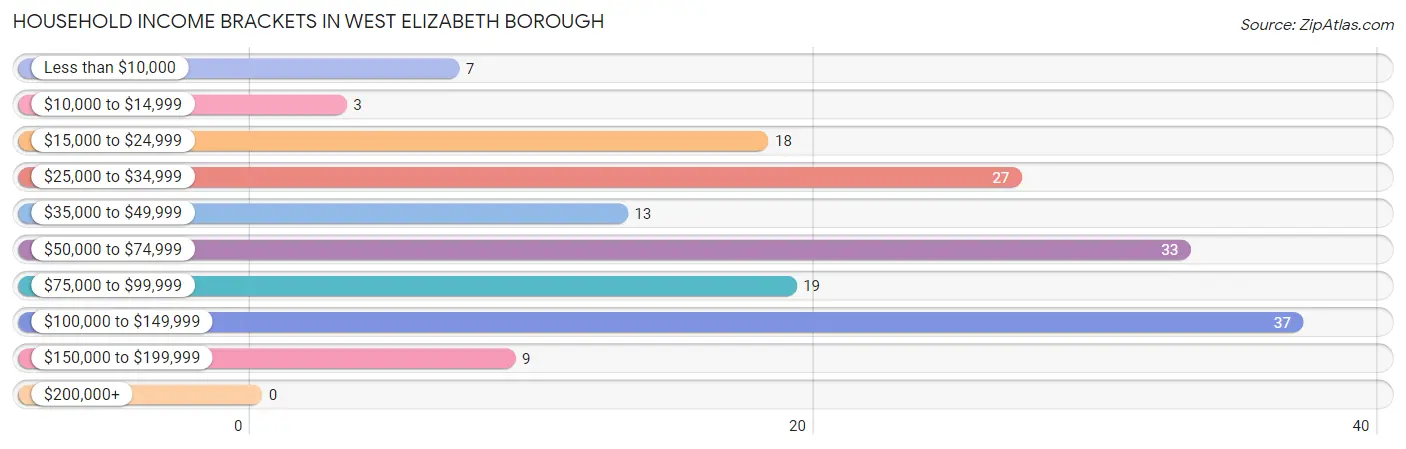
Household Income Brackets in West Elizabeth borough
With 37 households falling in the category, the $100,000 to $149,999 income range is the most frequent in West Elizabeth borough, accounting for 22.3% of all households.
| Income Bracket | # Households | % Households |
| Less than $10,000 | 7 | 4.2% |
| $10,000 to $14,999 | 3 | 1.8% |
| $15,000 to $24,999 | 18 | 10.8% |
| $25,000 to $34,999 | 27 | 16.3% |
| $35,000 to $49,999 | 13 | 7.8% |
| $50,000 to $74,999 | 33 | 19.9% |
| $75,000 to $99,999 | 19 | 11.4% |
| $100,000 to $149,999 | 37 | 22.3% |
| $150,000 to $199,999 | 9 | 5.4% |
| $200,000+ | 0 | 0.0% |
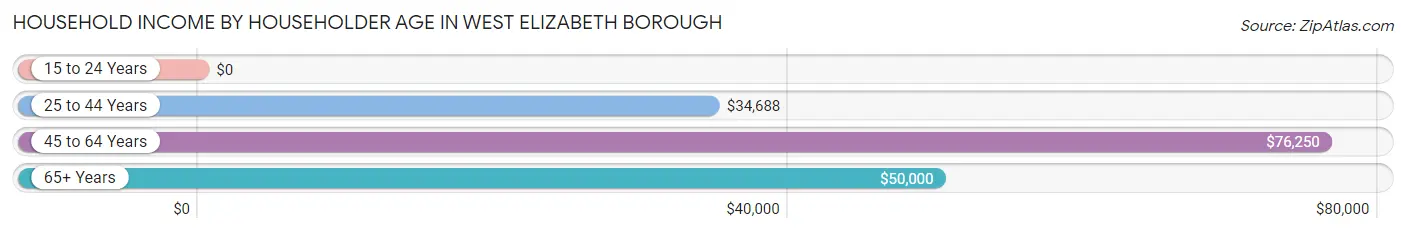
Household Income by Householder Age in West Elizabeth borough
The median household income in West Elizabeth borough is $57,273, with the highest median household income of $76,250 found in the 45 to 64 years age bracket for the primary householder. A total of 99 households (59.6%) fall into this category.
| Income Bracket | # Households | Median Income |
| 15 to 24 Years | 0 (0.0%) | $0 |
| 25 to 44 Years | 33 (19.9%) | $34,688 |
| 45 to 64 Years | 99 (59.6%) | $76,250 |
| 65+ Years | 34 (20.5%) | $50,000 |
| Total | 166 (100.0%) | $57,273 |
Poverty in West Elizabeth borough
Income Below Poverty by Sex and Age in West Elizabeth borough
With 7.6% poverty level for males and 25.0% for females among the residents of West Elizabeth borough, 12 to 14 year old males and 6 to 11 year old females are the most vulnerable to poverty, with 3 males (37.5%) and 3 females (100.0%) in their respective age groups living below the poverty level.
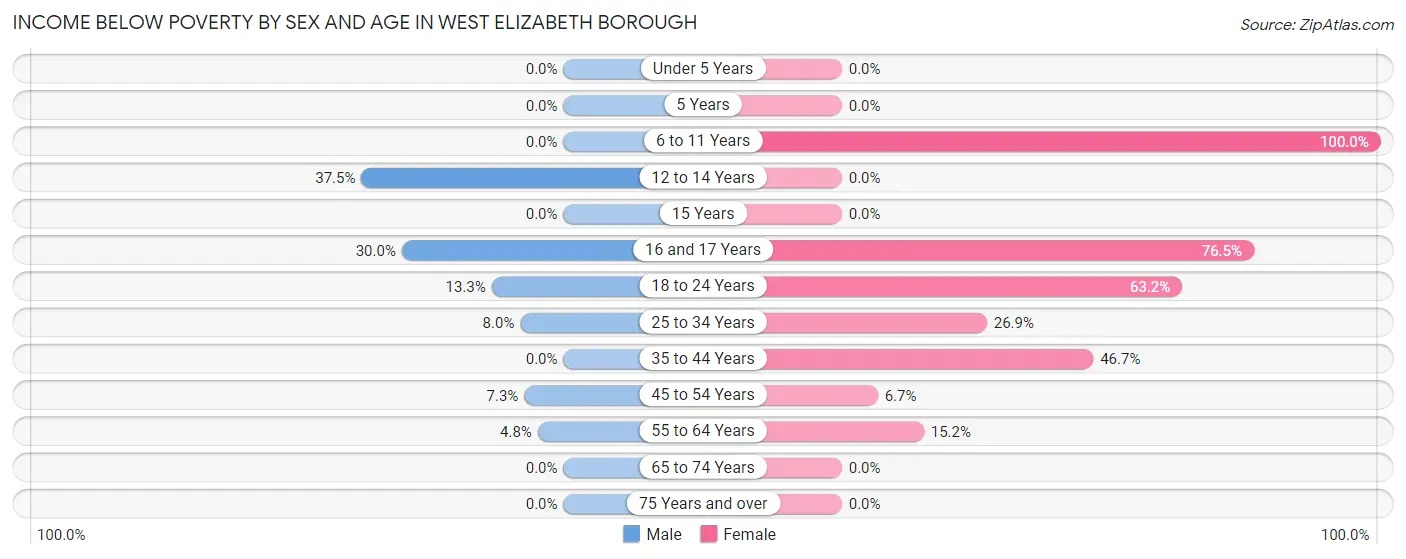
| Age Bracket | Male | Female |
| Under 5 Years | 0 (0.0%) | 0 (0.0%) |
| 5 Years | 0 (0.0%) | 0 (0.0%) |
| 6 to 11 Years | 0 (0.0%) | 3 (100.0%) |
| 12 to 14 Years | 3 (37.5%) | 0 (0.0%) |
| 15 Years | 0 (0.0%) | 0 (0.0%) |
| 16 and 17 Years | 3 (30.0%) | 13 (76.5%) |
| 18 to 24 Years | 4 (13.3%) | 12 (63.2%) |
| 25 to 34 Years | 2 (8.0%) | 7 (26.9%) |
| 35 to 44 Years | 0 (0.0%) | 7 (46.7%) |
| 45 to 54 Years | 4 (7.3%) | 3 (6.7%) |
| 55 to 64 Years | 2 (4.8%) | 7 (15.2%) |
| 65 to 74 Years | 0 (0.0%) | 0 (0.0%) |
| 75 Years and over | 0 (0.0%) | 0 (0.0%) |
| Total | 18 (7.6%) | 52 (25.0%) |
Income Above Poverty by Sex and Age in West Elizabeth borough
According to the poverty statistics in West Elizabeth borough, males aged under 5 years and females aged under 5 years are the age groups that are most secure financially, with 100.0% of males and 100.0% of females in these age groups living above the poverty line.
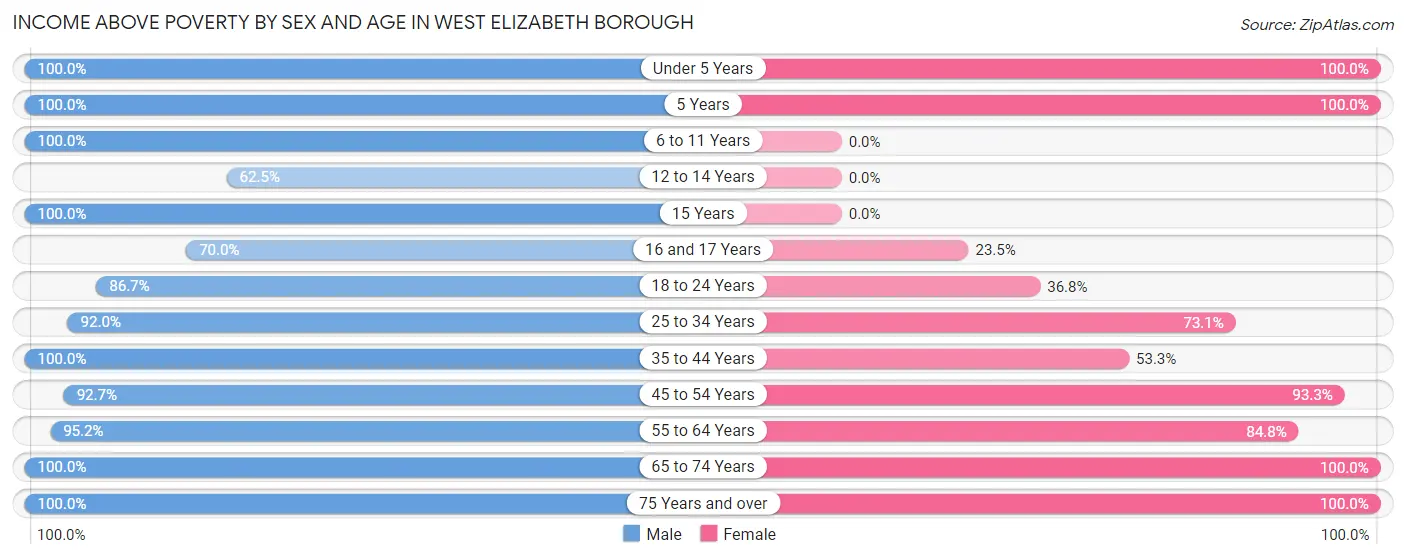
| Age Bracket | Male | Female |
| Under 5 Years | 18 (100.0%) | 6 (100.0%) |
| 5 Years | 7 (100.0%) | 4 (100.0%) |
| 6 to 11 Years | 6 (100.0%) | 0 (0.0%) |
| 12 to 14 Years | 5 (62.5%) | 0 (0.0%) |
| 15 Years | 4 (100.0%) | 0 (0.0%) |
| 16 and 17 Years | 7 (70.0%) | 4 (23.5%) |
| 18 to 24 Years | 26 (86.7%) | 7 (36.8%) |
| 25 to 34 Years | 23 (92.0%) | 19 (73.1%) |
| 35 to 44 Years | 3 (100.0%) | 8 (53.3%) |
| 45 to 54 Years | 51 (92.7%) | 42 (93.3%) |
| 55 to 64 Years | 40 (95.2%) | 39 (84.8%) |
| 65 to 74 Years | 21 (100.0%) | 17 (100.0%) |
| 75 Years and over | 7 (100.0%) | 10 (100.0%) |
| Total | 218 (92.4%) | 156 (75.0%) |
Income Below Poverty Among Married-Couple Families in West Elizabeth borough
The poverty statistics for married-couple families in West Elizabeth borough show that 3.8% or 3 of the total 78 families live below the poverty line. Families with 1 or 2 children have the highest poverty rate of 20.0%, comprising of 3 families. On the other hand, families with no children have the lowest poverty rate of 0.0%, which includes 0 families.
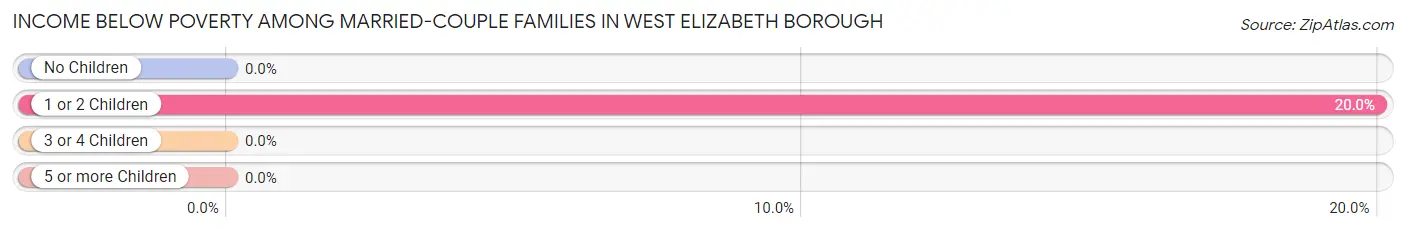
| Children | Above Poverty | Below Poverty |
| No Children | 59 (100.0%) | 0 (0.0%) |
| 1 or 2 Children | 12 (80.0%) | 3 (20.0%) |
| 3 or 4 Children | 4 (100.0%) | 0 (0.0%) |
| 5 or more Children | 0 (0.0%) | 0 (0.0%) |
| Total | 75 (96.2%) | 3 (3.8%) |
Income Below Poverty Among Single-Parent Households in West Elizabeth borough
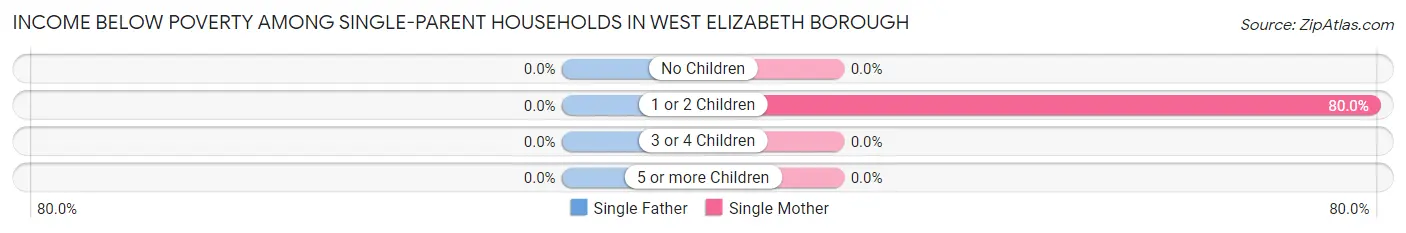
| Children | Single Father | Single Mother |
| No Children | 0 (0.0%) | 0 (0.0%) |
| 1 or 2 Children | 0 (0.0%) | 8 (80.0%) |
| 3 or 4 Children | 0 (0.0%) | 0 (0.0%) |
| 5 or more Children | 0 (0.0%) | 0 (0.0%) |
| Total | 0 (0.0%) | 8 (42.1%) |
Income Below Poverty Among Married-Couple vs Single-Parent Households in West Elizabeth borough
The poverty data for West Elizabeth borough shows that 3 of the married-couple family households (3.8%) and 8 of the single-parent households (28.6%) are living below the poverty level. Within the married-couple family households, those with 1 or 2 children have the highest poverty rate, with 3 households (20.0%) falling below the poverty line. Among the single-parent households, those with 1 or 2 children have the highest poverty rate, with 8 household (47.1%) living below poverty.
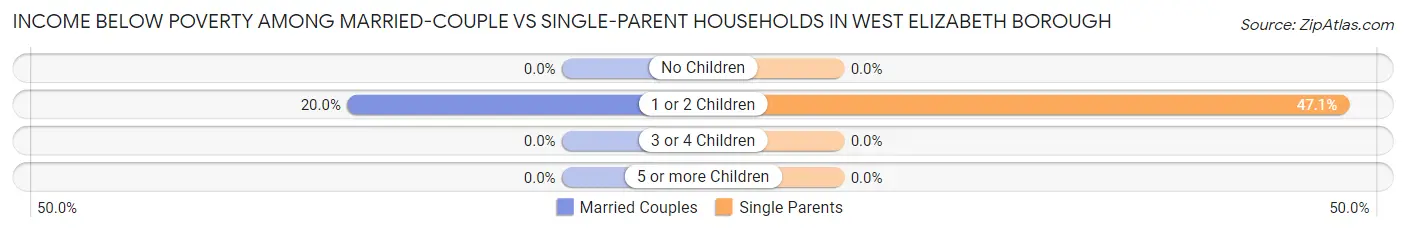
| Children | Married-Couple Families | Single-Parent Households |
| No Children | 0 (0.0%) | 0 (0.0%) |
| 1 or 2 Children | 3 (20.0%) | 8 (47.1%) |
| 3 or 4 Children | 0 (0.0%) | 0 (0.0%) |
| 5 or more Children | 0 (0.0%) | 0 (0.0%) |
| Total | 3 (3.8%) | 8 (28.6%) |
Race in West Elizabeth borough
The most populous races in West Elizabeth borough are White / Caucasian (416 | 91.2%), Black / African American (28 | 6.1%), and Hispanic or Latino (28 | 6.1%).
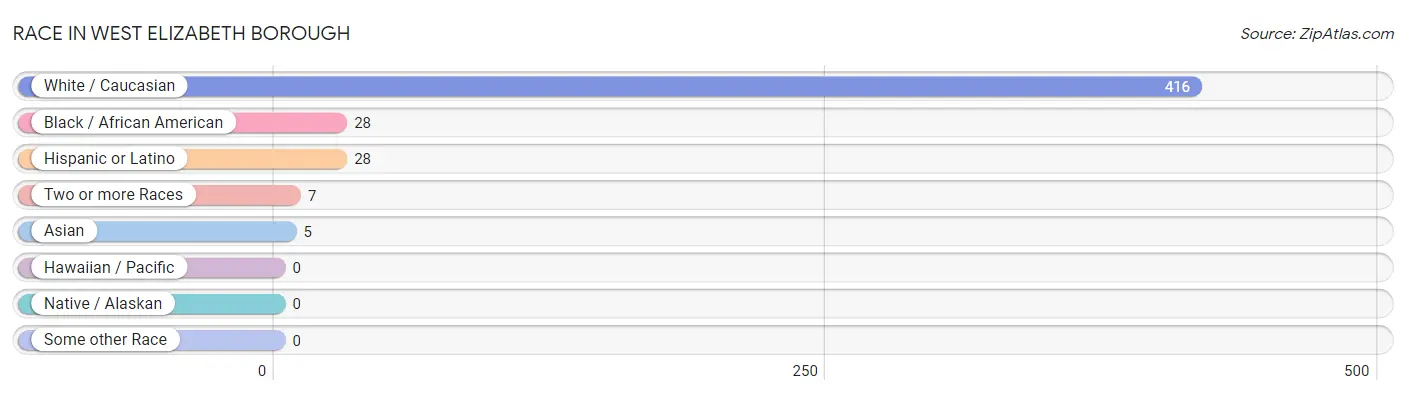
| Race | # Population | % Population |
| Asian | 5 | 1.1% |
| Black / African American | 28 | 6.1% |
| Hawaiian / Pacific | 0 | 0.0% |
| Hispanic or Latino | 28 | 6.1% |
| Native / Alaskan | 0 | 0.0% |
| White / Caucasian | 416 | 91.2% |
| Two or more Races | 7 | 1.5% |
| Some other Race | 0 | 0.0% |
| Total | 456 | 100.0% |
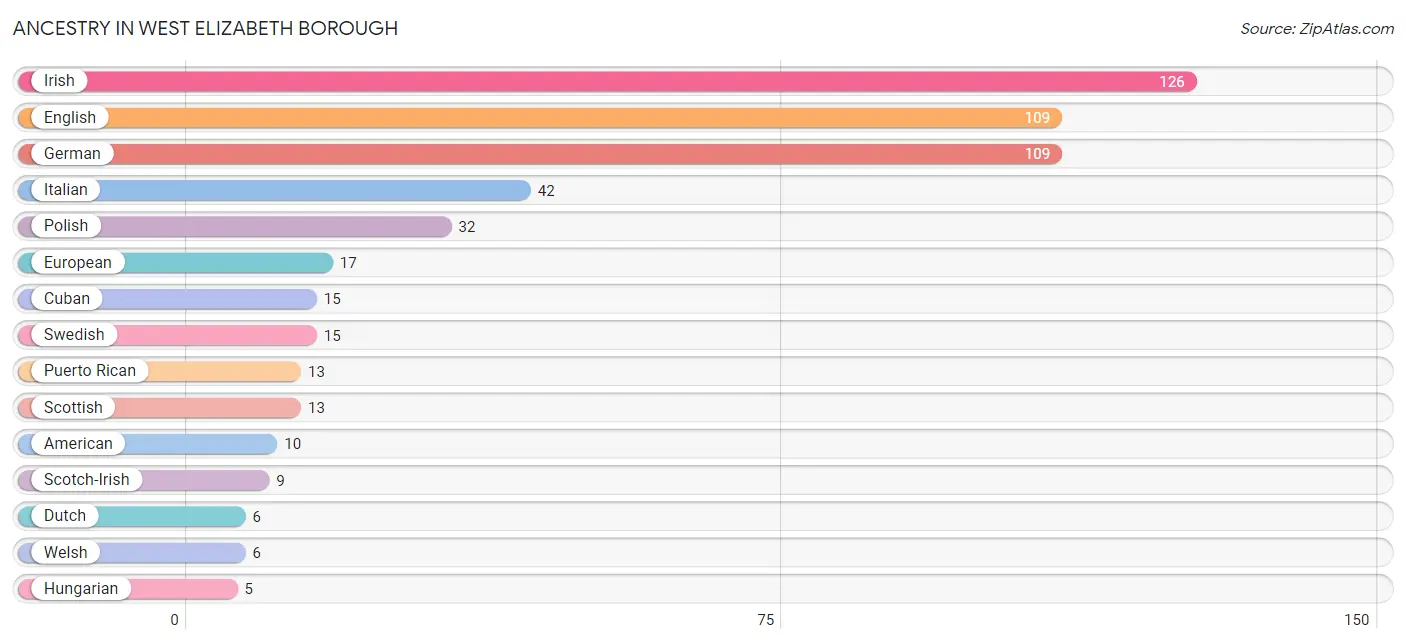
Ancestry in West Elizabeth borough
The most populous ancestries reported in West Elizabeth borough are Irish (126 | 27.6%), English (109 | 23.9%), German (109 | 23.9%), Italian (42 | 9.2%), and Polish (32 | 7.0%), together accounting for 91.7% of all West Elizabeth borough residents.
| Ancestry | # Population | % Population |
| American | 10 | 2.2% |
| British | 2 | 0.4% |
| Bulgarian | 4 | 0.9% |
| Cherokee | 3 | 0.7% |
| Cuban | 15 | 3.3% |
| Dutch | 6 | 1.3% |
| English | 109 | 23.9% |
| European | 17 | 3.7% |
| French | 4 | 0.9% |
| German | 109 | 23.9% |
| Hungarian | 5 | 1.1% |
| Irish | 126 | 27.6% |
| Italian | 42 | 9.2% |
| Lithuanian | 3 | 0.7% |
| Polish | 32 | 7.0% |
| Puerto Rican | 13 | 2.9% |
| Scotch-Irish | 9 | 2.0% |
| Scottish | 13 | 2.9% |
| Sioux | 3 | 0.7% |
| Swedish | 15 | 3.3% |
| Thai | 5 | 1.1% |
| Welsh | 6 | 1.3% | View All 22 Rows |
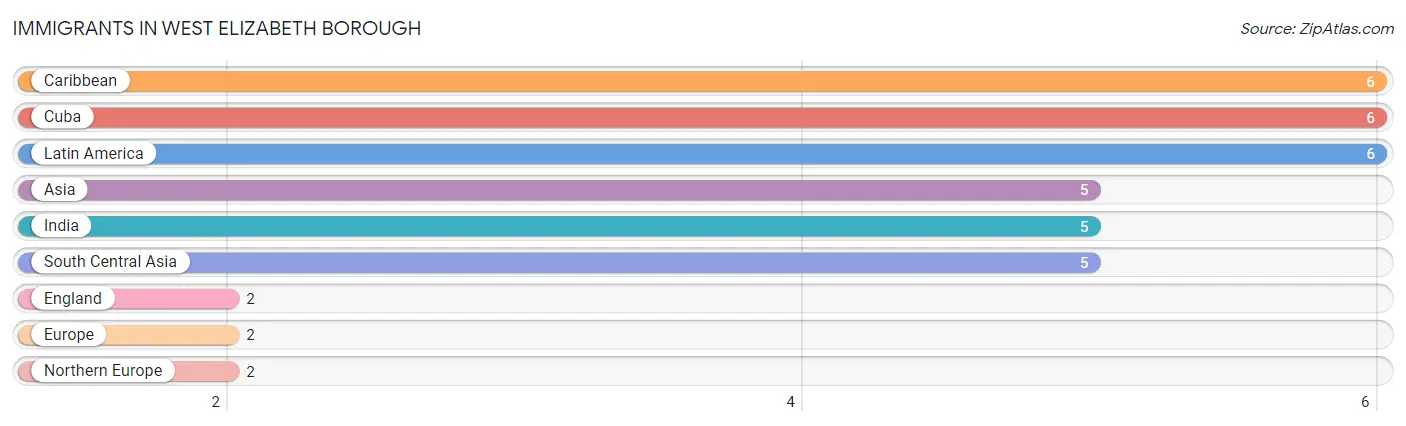
Immigrants in West Elizabeth borough
The most numerous immigrant groups reported in West Elizabeth borough came from Caribbean (6 | 1.3%), Cuba (6 | 1.3%), Latin America (6 | 1.3%), Asia (5 | 1.1%), and India (5 | 1.1%), together accounting for 6.2% of all West Elizabeth borough residents.
| Immigration Origin | # Population | % Population |
| Asia | 5 | 1.1% |
| Caribbean | 6 | 1.3% |
| Cuba | 6 | 1.3% |
| England | 2 | 0.4% |
| Europe | 2 | 0.4% |
| India | 5 | 1.1% |
| Latin America | 6 | 1.3% |
| Northern Europe | 2 | 0.4% |
| South Central Asia | 5 | 1.1% | View All 9 Rows |
Sex and Age in West Elizabeth borough
Sex and Age in West Elizabeth borough
The most populous age groups in West Elizabeth borough are 50 to 54 Years (32 | 13.2%) for men and 50 to 54 Years (33 | 15.4%) for women.
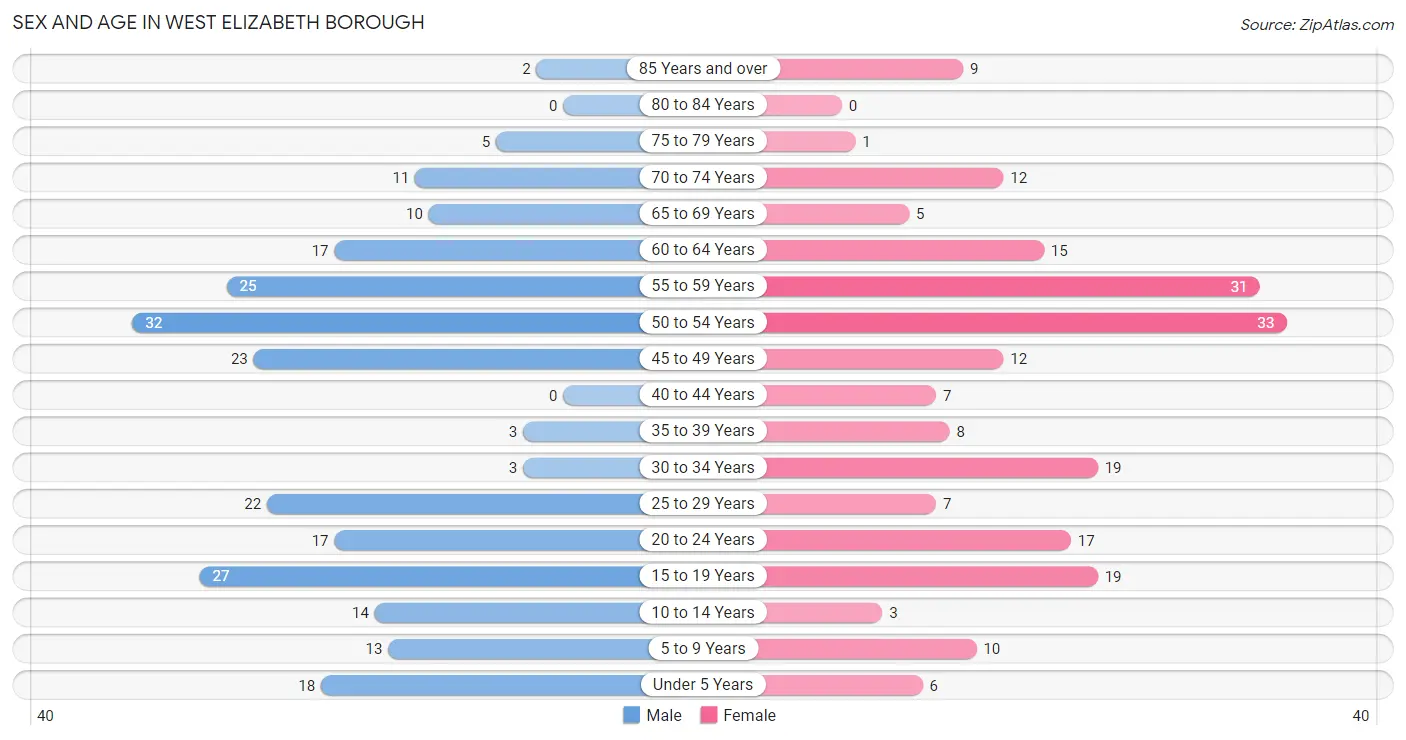
| Age Bracket | Male | Female |
| Under 5 Years | 18 (7.4%) | 6 (2.8%) |
| 5 to 9 Years | 13 (5.4%) | 10 (4.7%) |
| 10 to 14 Years | 14 (5.8%) | 3 (1.4%) |
| 15 to 19 Years | 27 (11.2%) | 19 (8.9%) |
| 20 to 24 Years | 17 (7.0%) | 17 (7.9%) |
| 25 to 29 Years | 22 (9.1%) | 7 (3.3%) |
| 30 to 34 Years | 3 (1.2%) | 19 (8.9%) |
| 35 to 39 Years | 3 (1.2%) | 8 (3.7%) |
| 40 to 44 Years | 0 (0.0%) | 7 (3.3%) |
| 45 to 49 Years | 23 (9.5%) | 12 (5.6%) |
| 50 to 54 Years | 32 (13.2%) | 33 (15.4%) |
| 55 to 59 Years | 25 (10.3%) | 31 (14.5%) |
| 60 to 64 Years | 17 (7.0%) | 15 (7.0%) |
| 65 to 69 Years | 10 (4.1%) | 5 (2.3%) |
| 70 to 74 Years | 11 (4.5%) | 12 (5.6%) |
| 75 to 79 Years | 5 (2.1%) | 1 (0.5%) |
| 80 to 84 Years | 0 (0.0%) | 0 (0.0%) |
| 85 Years and over | 2 (0.8%) | 9 (4.2%) |
| Total | 242 (100.0%) | 214 (100.0%) |
Families and Households in West Elizabeth borough
Median Family Size in West Elizabeth borough
The median family size in West Elizabeth borough is 3.28 persons per family, with single female/mother families (19 | 17.9%) accounting for the largest median family size of 3.47 persons per family. On the other hand, single male/father families (9 | 8.5%) represent the smallest median family size with 2.67 persons per family.
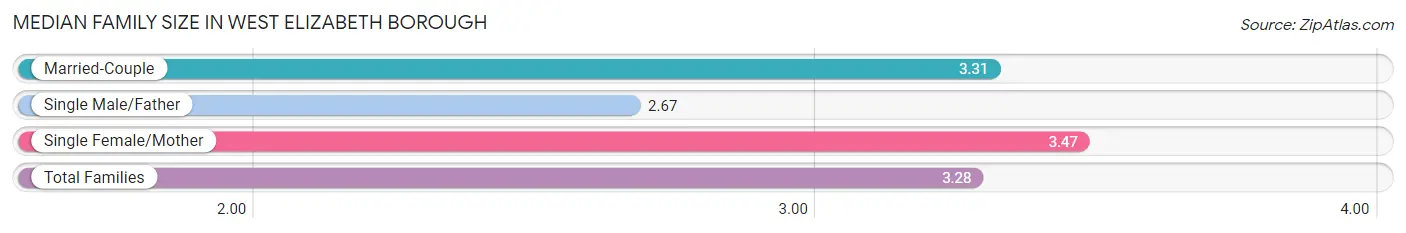
| Family Type | # Families | Family Size |
| Married-Couple | 78 (73.6%) | 3.31 |
| Single Male/Father | 9 (8.5%) | 2.67 |
| Single Female/Mother | 19 (17.9%) | 3.47 |
| Total Families | 106 (100.0%) | 3.28 |
Median Household Size in West Elizabeth borough
The median household size in West Elizabeth borough is 2.75 persons per household, with single male/father households (9 | 5.4%) accounting for the largest median household size of 4.89 persons per household. non-family households (60 | 36.1%) represent the smallest median household size with 1.23 persons per household.
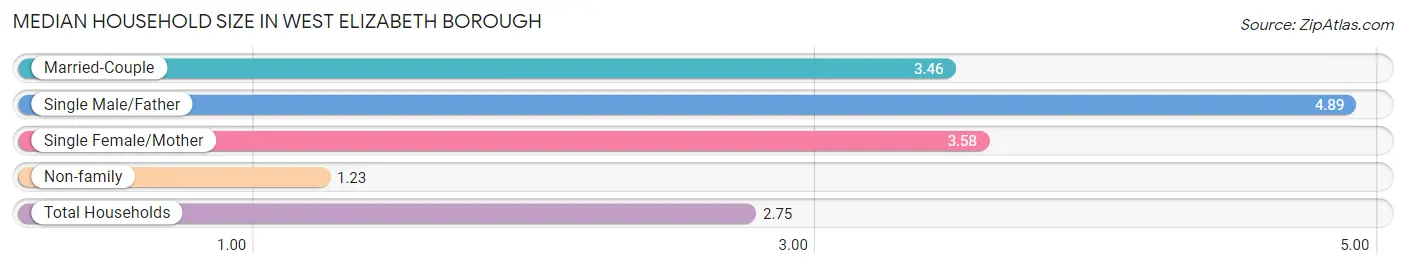
| Household Type | # Households | Household Size |
| Married-Couple | 78 (47.0%) | 3.46 |
| Single Male/Father | 9 (5.4%) | 4.89 |
| Single Female/Mother | 19 (11.5%) | 3.58 |
| Non-family | 60 (36.1%) | 1.23 |
| Total Households | 166 (100.0%) | 2.75 |
Household Size by Marriage Status in West Elizabeth borough
Out of a total of 166 households in West Elizabeth borough, 106 (63.9%) are family households, while 60 (36.1%) are nonfamily households. The most numerous type of family households are 2-person households, comprising 35, and the most common type of nonfamily households are 1-person households, comprising 49.
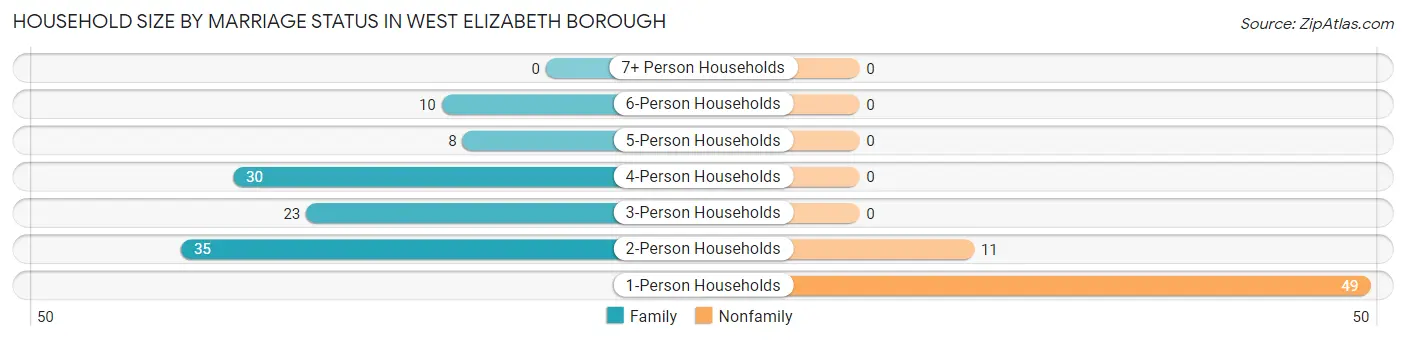
| Household Size | Family Households | Nonfamily Households |
| 1-Person Households | - | 49 (29.5%) |
| 2-Person Households | 35 (21.1%) | 11 (6.6%) |
| 3-Person Households | 23 (13.9%) | 0 (0.0%) |
| 4-Person Households | 30 (18.1%) | 0 (0.0%) |
| 5-Person Households | 8 (4.8%) | 0 (0.0%) |
| 6-Person Households | 10 (6.0%) | 0 (0.0%) |
| 7+ Person Households | 0 (0.0%) | 0 (0.0%) |
| Total | 106 (63.9%) | 60 (36.1%) |
Female Fertility in West Elizabeth borough
Fertility by Age in West Elizabeth borough
| Age Bracket | Women with Births | Births / 1,000 Women |
| 15 to 19 years | 0 (0.0%) | 0.0 |
| 20 to 34 years | 0 (0.0%) | 0.0 |
| 35 to 50 years | 0 (0.0%) | 0.0 |
| Total | 0 (0.0%) | 0.0 |
Fertility by Age by Marriage Status in West Elizabeth borough
| Age Bracket | Married | Unmarried |
| 15 to 19 years | 0 (0.0%) | 0 (0.0%) |
| 20 to 34 years | 0 (0.0%) | 0 (0.0%) |
| 35 to 50 years | 0 (0.0%) | 0 (0.0%) |
| Total | 0 (0.0%) | 0 (0.0%) |
Fertility by Education in West Elizabeth borough
| Educational Attainment | Women with Births | Births / 1,000 Women |
| Less than High School | 0 (0.0%) | 0.0 |
| High School Diploma | 0 (0.0%) | 0.0 |
| College or Associate's Degree | 0 (0.0%) | 0.0 |
| Bachelor's Degree | 0 (0.0%) | 0.0 |
| Graduate Degree | 0 (0.0%) | 0.0 |
| Total | 0 (0.0%) | 0.0 |
Fertility by Education by Marriage Status in West Elizabeth borough
| Educational Attainment | Married | Unmarried |
| Less than High School | 0 (0.0%) | 0 (0.0%) |
| High School Diploma | 0 (0.0%) | 0 (0.0%) |
| College or Associate's Degree | 0 (0.0%) | 0 (0.0%) |
| Bachelor's Degree | 0 (0.0%) | 0 (0.0%) |
| Graduate Degree | 0 (0.0%) | 0 (0.0%) |
| Total | 0 (0.0%) | 0 (0.0%) |
Employment Characteristics in West Elizabeth borough
Employment by Class of Employer in West Elizabeth borough
Among the 231 employed individuals in West Elizabeth borough, private company employees (170 | 73.6%), not-for-profit organizations (30 | 13.0%), and local government employees (13 | 5.6%) make up the most common classes of employment.
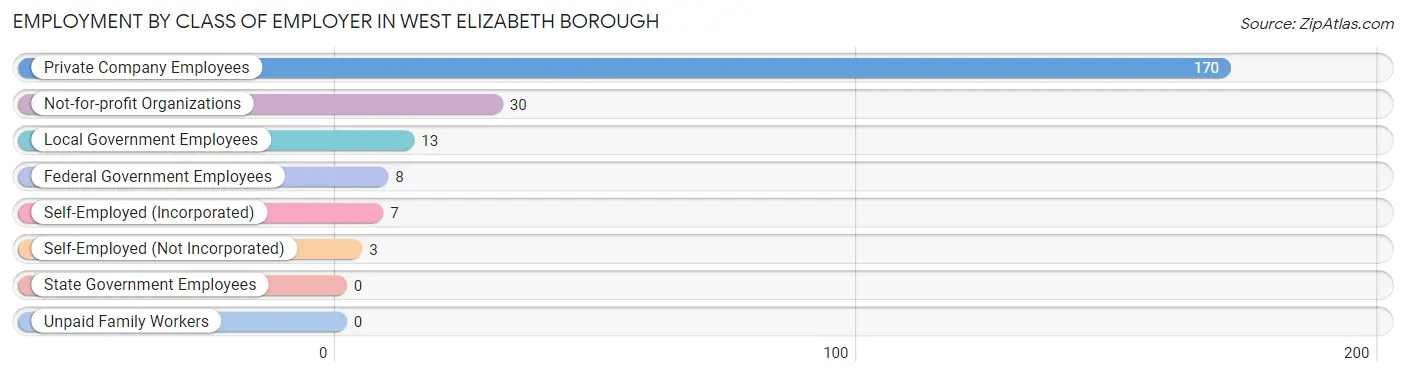
| Employer Class | # Employees | % Employees |
| Private Company Employees | 170 | 73.6% |
| Self-Employed (Incorporated) | 7 | 3.0% |
| Self-Employed (Not Incorporated) | 3 | 1.3% |
| Not-for-profit Organizations | 30 | 13.0% |
| Local Government Employees | 13 | 5.6% |
| State Government Employees | 0 | 0.0% |
| Federal Government Employees | 8 | 3.5% |
| Unpaid Family Workers | 0 | 0.0% |
| Total | 231 | 100.0% |
Employment Status by Age in West Elizabeth borough
According to the labor force statistics for West Elizabeth borough, out of the total population over 16 years of age (388), 67.8% or 263 individuals are in the labor force, with 9.1% or 24 of them unemployed. The age group with the highest labor force participation rate is 30 to 34 years, with 100.0% or 22 individuals in the labor force. Within the labor force, the 20 to 24 years age range has the highest percentage of unemployed individuals, with 26.7% or 8 of them being unemployed.
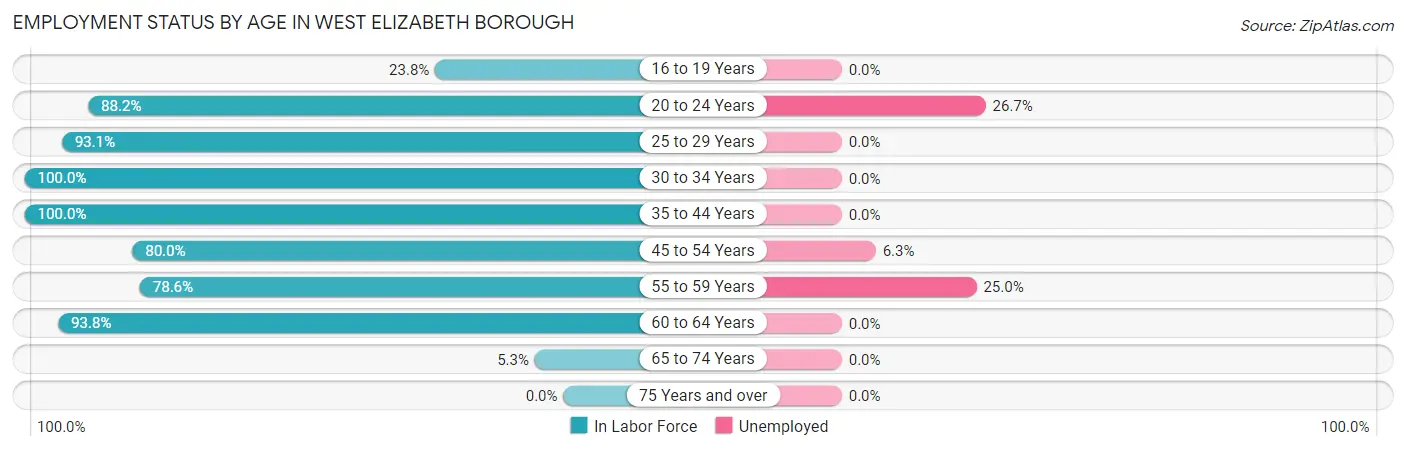
| Age Bracket | In Labor Force | Unemployed |
| 16 to 19 Years | 10 (23.8%) | 0 (0.0%) |
| 20 to 24 Years | 30 (88.2%) | 8 (26.7%) |
| 25 to 29 Years | 27 (93.1%) | 0 (0.0%) |
| 30 to 34 Years | 22 (100.0%) | 0 (0.0%) |
| 35 to 44 Years | 18 (100.0%) | 0 (0.0%) |
| 45 to 54 Years | 80 (80.0%) | 5 (6.3%) |
| 55 to 59 Years | 44 (78.6%) | 11 (25.0%) |
| 60 to 64 Years | 30 (93.8%) | 0 (0.0%) |
| 65 to 74 Years | 2 (5.3%) | 0 (0.0%) |
| 75 Years and over | 0 (0.0%) | 0 (0.0%) |
| Total | 263 (67.8%) | 24 (9.1%) |
Employment Status by Educational Attainment in West Elizabeth borough
According to labor force statistics for West Elizabeth borough, 86.0% of individuals (221) out of the total population between 25 and 64 years of age (257) are in the labor force, with 7.2% or 16 of them being unemployed. The group with the highest labor force participation rate are those with the educational attainment of college / associate degree, with 98.2% or 112 individuals in the labor force. Within the labor force, individuals with college / associate degree education have the highest percentage of unemployment, with 12.5% or 14 of them being unemployed.
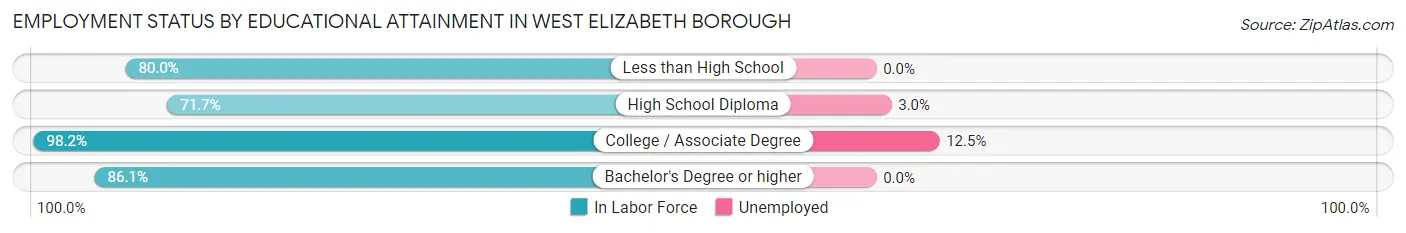
| Educational Attainment | In Labor Force | Unemployed |
| Less than High School | 12 (80.0%) | 0 (0.0%) |
| High School Diploma | 66 (71.7%) | 3 (3.0%) |
| College / Associate Degree | 112 (98.2%) | 14 (12.5%) |
| Bachelor's Degree or higher | 31 (86.1%) | 0 (0.0%) |
| Total | 221 (86.0%) | 19 (7.2%) |
Employment Occupations by Sex in West Elizabeth borough
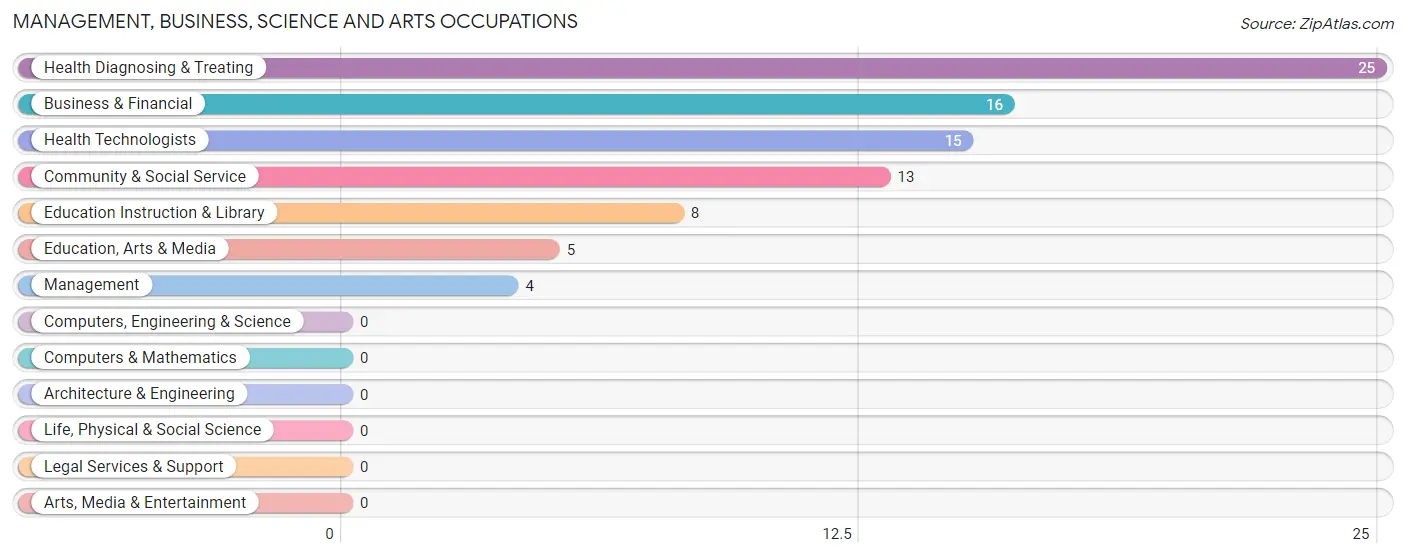
Management, Business, Science and Arts Occupations
The most common Management, Business, Science and Arts occupations in West Elizabeth borough are Health Diagnosing & Treating (25 | 10.5%), Business & Financial (16 | 6.7%), Health Technologists (15 | 6.3%), Community & Social Service (13 | 5.4%), and Education Instruction & Library (8 | 3.4%).
Management, Business, Science and Arts Occupations by Sex
Within the Management, Business, Science and Arts occupations in West Elizabeth borough, the most male-oriented occupations are Business & Financial (25.0%), Health Technologists (13.3%), and Health Diagnosing & Treating (8.0%), while the most female-oriented occupations are Management (100.0%), Community & Social Service (100.0%), and Education, Arts & Media (100.0%).
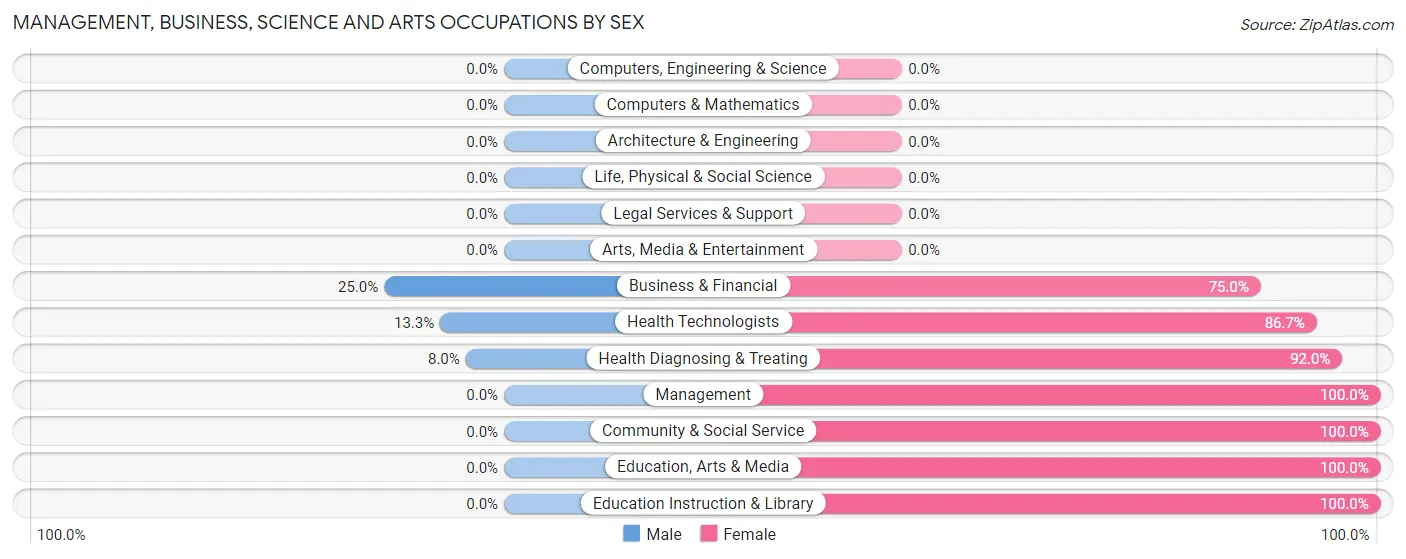
| Occupation | Male | Female |
| Management | 0 (0.0%) | 4 (100.0%) |
| Business & Financial | 4 (25.0%) | 12 (75.0%) |
| Computers, Engineering & Science | 0 (0.0%) | 0 (0.0%) |
| Computers & Mathematics | 0 (0.0%) | 0 (0.0%) |
| Architecture & Engineering | 0 (0.0%) | 0 (0.0%) |
| Life, Physical & Social Science | 0 (0.0%) | 0 (0.0%) |
| Community & Social Service | 0 (0.0%) | 13 (100.0%) |
| Education, Arts & Media | 0 (0.0%) | 5 (100.0%) |
| Legal Services & Support | 0 (0.0%) | 0 (0.0%) |
| Education Instruction & Library | 0 (0.0%) | 8 (100.0%) |
| Arts, Media & Entertainment | 0 (0.0%) | 0 (0.0%) |
| Health Diagnosing & Treating | 2 (8.0%) | 23 (92.0%) |
| Health Technologists | 2 (13.3%) | 13 (86.7%) |
| Total (Category) | 6 (10.3%) | 52 (89.7%) |
| Total (Overall) | 103 (43.1%) | 136 (56.9%) |
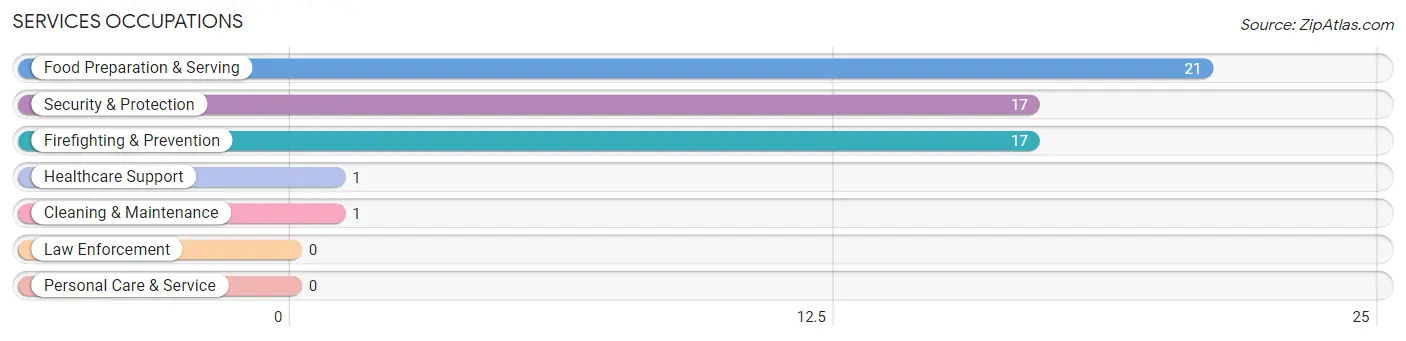
Services Occupations
The most common Services occupations in West Elizabeth borough are Food Preparation & Serving (21 | 8.8%), Security & Protection (17 | 7.1%), Firefighting & Prevention (17 | 7.1%), Healthcare Support (1 | 0.4%), and Cleaning & Maintenance (1 | 0.4%).
Services Occupations by Sex
Within the Services occupations in West Elizabeth borough, the most male-oriented occupations are Security & Protection (29.4%), Firefighting & Prevention (29.4%), and Food Preparation & Serving (23.8%), while the most female-oriented occupations are Healthcare Support (100.0%), Cleaning & Maintenance (100.0%), and Food Preparation & Serving (76.2%).
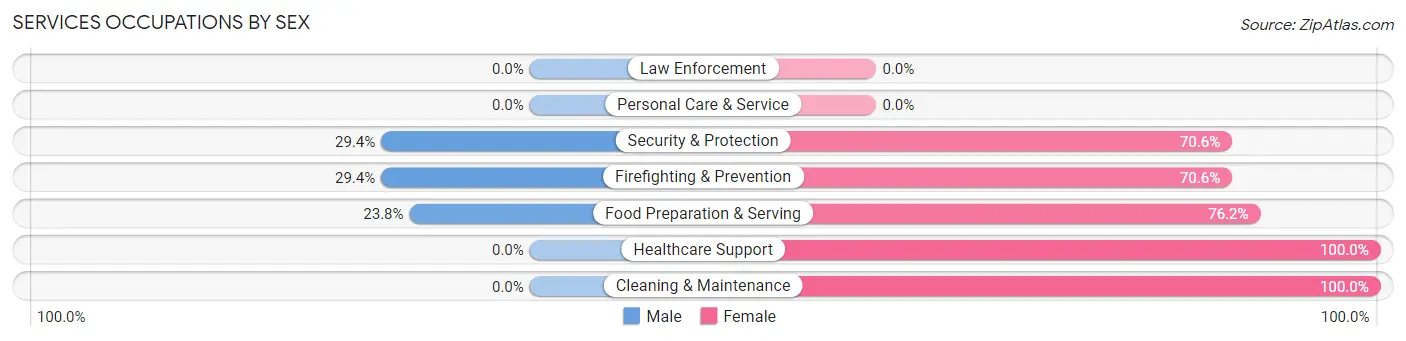
| Occupation | Male | Female |
| Healthcare Support | 0 (0.0%) | 1 (100.0%) |
| Security & Protection | 5 (29.4%) | 12 (70.6%) |
| Firefighting & Prevention | 5 (29.4%) | 12 (70.6%) |
| Law Enforcement | 0 (0.0%) | 0 (0.0%) |
| Food Preparation & Serving | 5 (23.8%) | 16 (76.2%) |
| Cleaning & Maintenance | 0 (0.0%) | 1 (100.0%) |
| Personal Care & Service | 0 (0.0%) | 0 (0.0%) |
| Total (Category) | 10 (25.0%) | 30 (75.0%) |
| Total (Overall) | 103 (43.1%) | 136 (56.9%) |
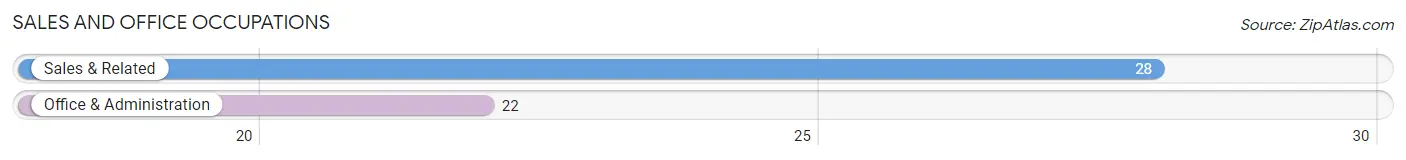
Sales and Office Occupations
The most common Sales and Office occupations in West Elizabeth borough are Sales & Related (28 | 11.7%), and Office & Administration (22 | 9.2%).
Sales and Office Occupations by Sex
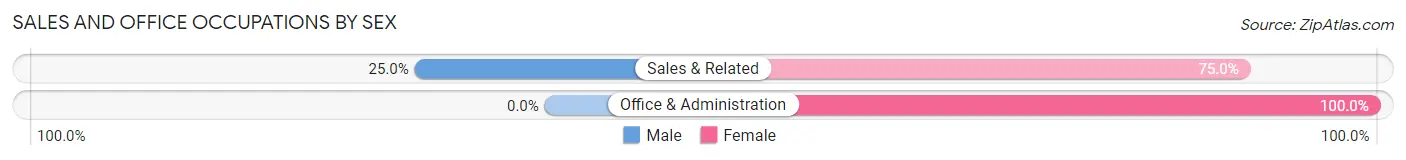
| Occupation | Male | Female |
| Sales & Related | 7 (25.0%) | 21 (75.0%) |
| Office & Administration | 0 (0.0%) | 22 (100.0%) |
| Total (Category) | 7 (14.0%) | 43 (86.0%) |
| Total (Overall) | 103 (43.1%) | 136 (56.9%) |
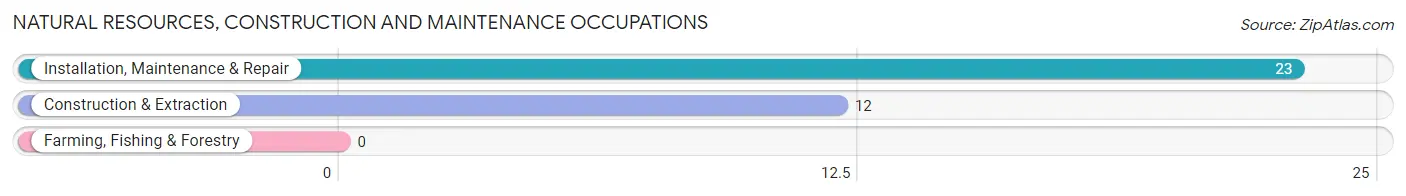
Natural Resources, Construction and Maintenance Occupations
The most common Natural Resources, Construction and Maintenance occupations in West Elizabeth borough are Installation, Maintenance & Repair (23 | 9.6%), and Construction & Extraction (12 | 5.0%).
Natural Resources, Construction and Maintenance Occupations by Sex
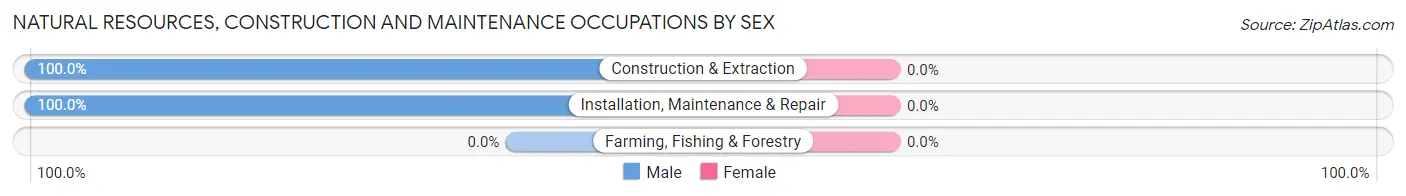
| Occupation | Male | Female |
| Farming, Fishing & Forestry | 0 (0.0%) | 0 (0.0%) |
| Construction & Extraction | 12 (100.0%) | 0 (0.0%) |
| Installation, Maintenance & Repair | 23 (100.0%) | 0 (0.0%) |
| Total (Category) | 35 (100.0%) | 0 (0.0%) |
| Total (Overall) | 103 (43.1%) | 136 (56.9%) |
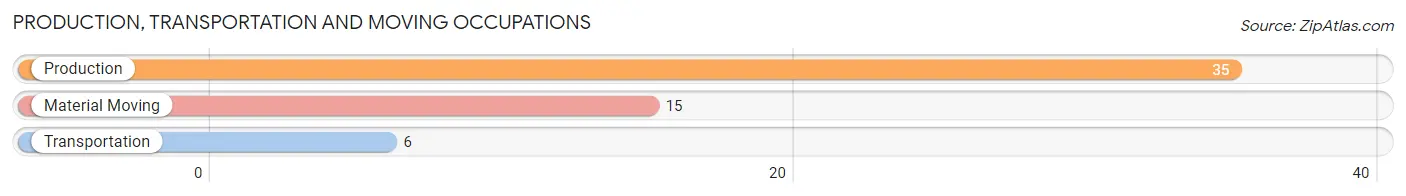
Production, Transportation and Moving Occupations
The most common Production, Transportation and Moving occupations in West Elizabeth borough are Production (35 | 14.6%), Material Moving (15 | 6.3%), and Transportation (6 | 2.5%).
Production, Transportation and Moving Occupations by Sex
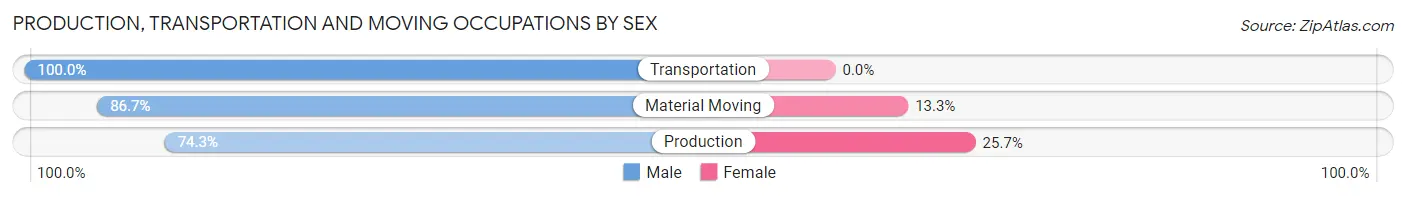
| Occupation | Male | Female |
| Production | 26 (74.3%) | 9 (25.7%) |
| Transportation | 6 (100.0%) | 0 (0.0%) |
| Material Moving | 13 (86.7%) | 2 (13.3%) |
| Total (Category) | 45 (80.4%) | 11 (19.6%) |
| Total (Overall) | 103 (43.1%) | 136 (56.9%) |
Employment Industries by Sex in West Elizabeth borough
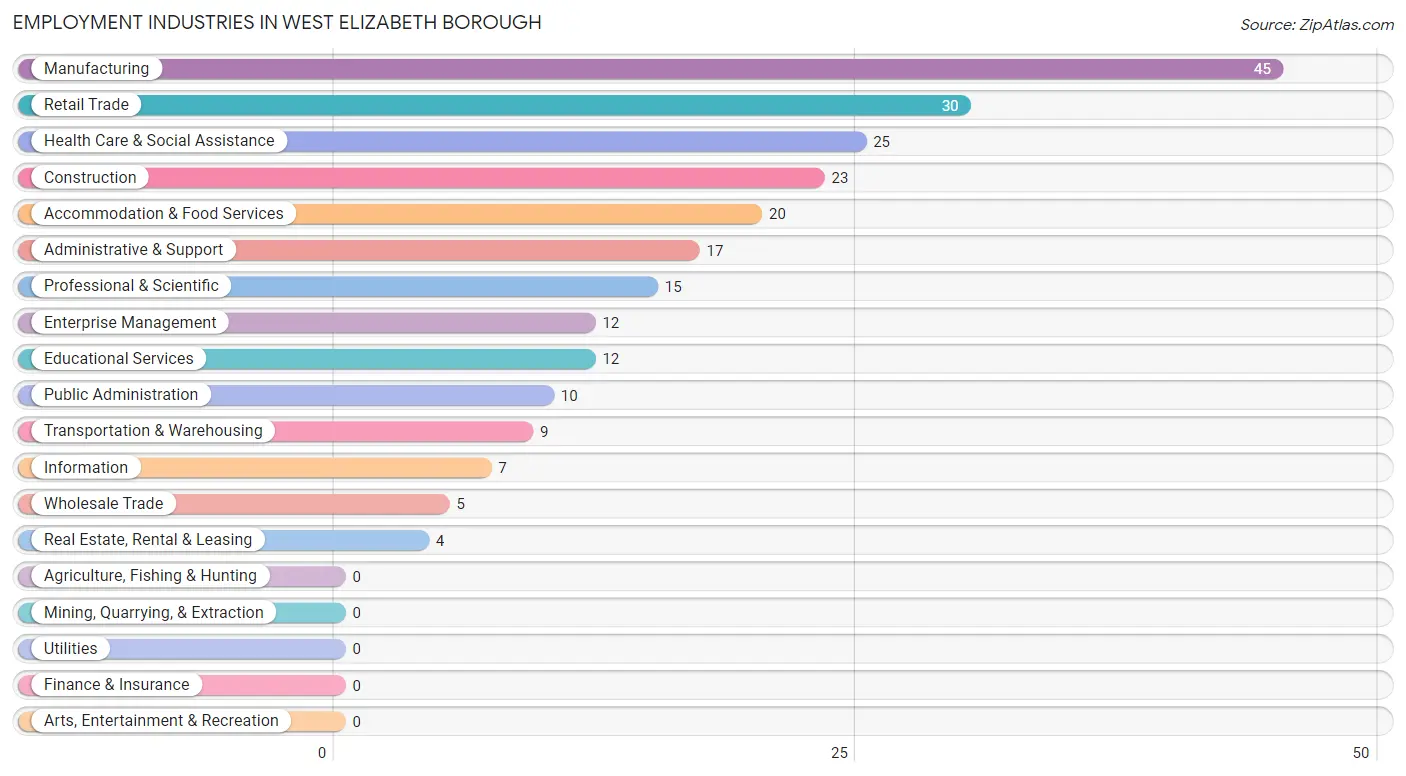
Employment Industries in West Elizabeth borough
The major employment industries in West Elizabeth borough include Manufacturing (45 | 18.8%), Retail Trade (30 | 12.6%), Health Care & Social Assistance (25 | 10.5%), Construction (23 | 9.6%), and Accommodation & Food Services (20 | 8.4%).
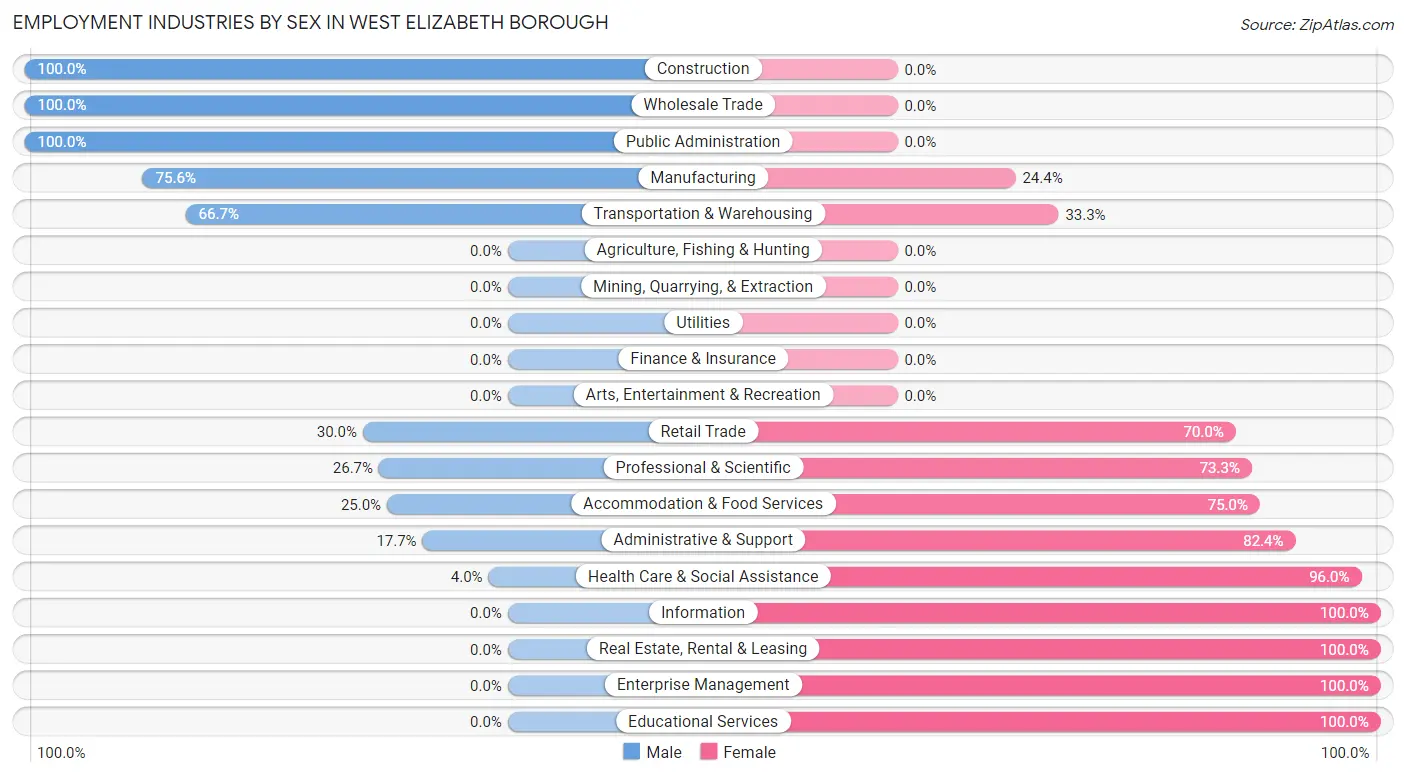
Employment Industries by Sex in West Elizabeth borough
The West Elizabeth borough industries that see more men than women are Construction (100.0%), Wholesale Trade (100.0%), and Public Administration (100.0%), whereas the industries that tend to have a higher number of women are Information (100.0%), Real Estate, Rental & Leasing (100.0%), and Enterprise Management (100.0%).
| Industry | Male | Female |
| Agriculture, Fishing & Hunting | 0 (0.0%) | 0 (0.0%) |
| Mining, Quarrying, & Extraction | 0 (0.0%) | 0 (0.0%) |
| Construction | 23 (100.0%) | 0 (0.0%) |
| Manufacturing | 34 (75.6%) | 11 (24.4%) |
| Wholesale Trade | 5 (100.0%) | 0 (0.0%) |
| Retail Trade | 9 (30.0%) | 21 (70.0%) |
| Transportation & Warehousing | 6 (66.7%) | 3 (33.3%) |
| Utilities | 0 (0.0%) | 0 (0.0%) |
| Information | 0 (0.0%) | 7 (100.0%) |
| Finance & Insurance | 0 (0.0%) | 0 (0.0%) |
| Real Estate, Rental & Leasing | 0 (0.0%) | 4 (100.0%) |
| Professional & Scientific | 4 (26.7%) | 11 (73.3%) |
| Enterprise Management | 0 (0.0%) | 12 (100.0%) |
| Administrative & Support | 3 (17.6%) | 14 (82.4%) |
| Educational Services | 0 (0.0%) | 12 (100.0%) |
| Health Care & Social Assistance | 1 (4.0%) | 24 (96.0%) |
| Arts, Entertainment & Recreation | 0 (0.0%) | 0 (0.0%) |
| Accommodation & Food Services | 5 (25.0%) | 15 (75.0%) |
| Public Administration | 10 (100.0%) | 0 (0.0%) |
| Total | 103 (43.1%) | 136 (56.9%) |
Education in West Elizabeth borough
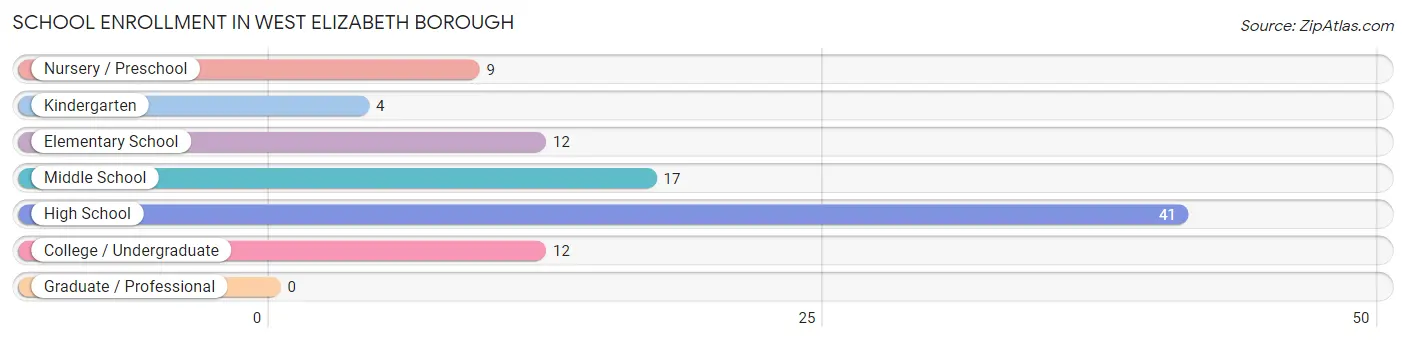
School Enrollment in West Elizabeth borough
The most common levels of schooling among the 95 students in West Elizabeth borough are high school (41 | 43.2%), middle school (17 | 17.9%), and elementary school (12 | 12.6%).
| School Level | # Students | % Students |
| Nursery / Preschool | 9 | 9.5% |
| Kindergarten | 4 | 4.2% |
| Elementary School | 12 | 12.6% |
| Middle School | 17 | 17.9% |
| High School | 41 | 43.2% |
| College / Undergraduate | 12 | 12.6% |
| Graduate / Professional | 0 | 0.0% |
| Total | 95 | 100.0% |
School Enrollment by Age by Funding Source in West Elizabeth borough
Out of a total of 95 students who are enrolled in schools in West Elizabeth borough, 8 (8.4%) attend a private institution, while the remaining 87 (91.6%) are enrolled in public schools. The age group of 35 years and over has the highest likelihood of being enrolled in private schools, with 2 (100.0% in the age bracket) enrolled. Conversely, the age group of 3 to 4 year olds has the lowest likelihood of being enrolled in a private school, with 6 (100.0% in the age bracket) attending a public institution.
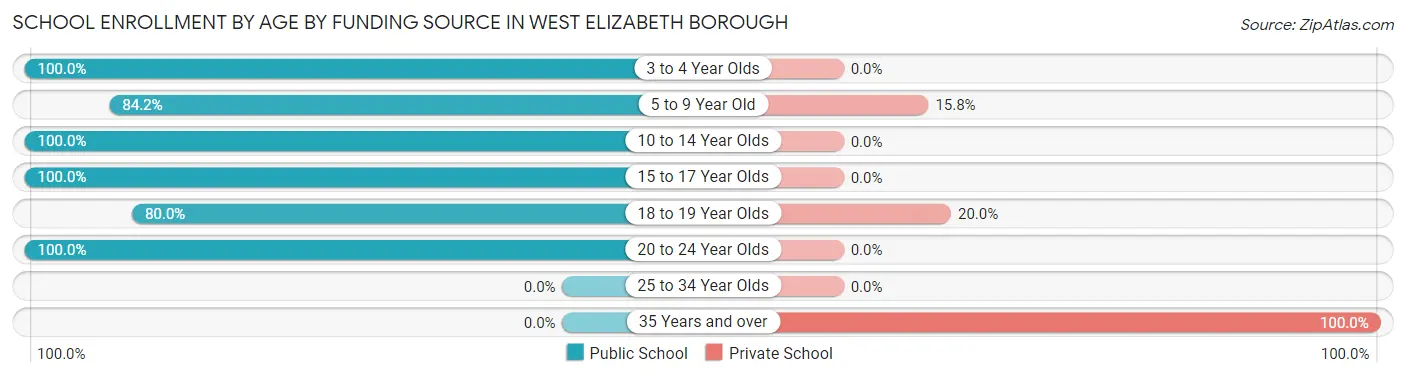
| Age Bracket | Public School | Private School |
| 3 to 4 Year Olds | 6 (100.0%) | 0 (0.0%) |
| 5 to 9 Year Old | 16 (84.2%) | 3 (15.8%) |
| 10 to 14 Year Olds | 17 (100.0%) | 0 (0.0%) |
| 15 to 17 Year Olds | 31 (100.0%) | 0 (0.0%) |
| 18 to 19 Year Olds | 12 (80.0%) | 3 (20.0%) |
| 20 to 24 Year Olds | 5 (100.0%) | 0 (0.0%) |
| 25 to 34 Year Olds | 0 (0.0%) | 0 (0.0%) |
| 35 Years and over | 0 (0.0%) | 2 (100.0%) |
| Total | 87 (91.6%) | 8 (8.4%) |
Educational Attainment by Field of Study in West Elizabeth borough
Science & technology (10 | 21.7%), engineering (9 | 19.6%), physical & health sciences (6 | 13.0%), visual & performing arts (6 | 13.0%), and multidisciplinary studies (5 | 10.9%) are the most common fields of study among 46 individuals in West Elizabeth borough who have obtained a bachelor's degree or higher.
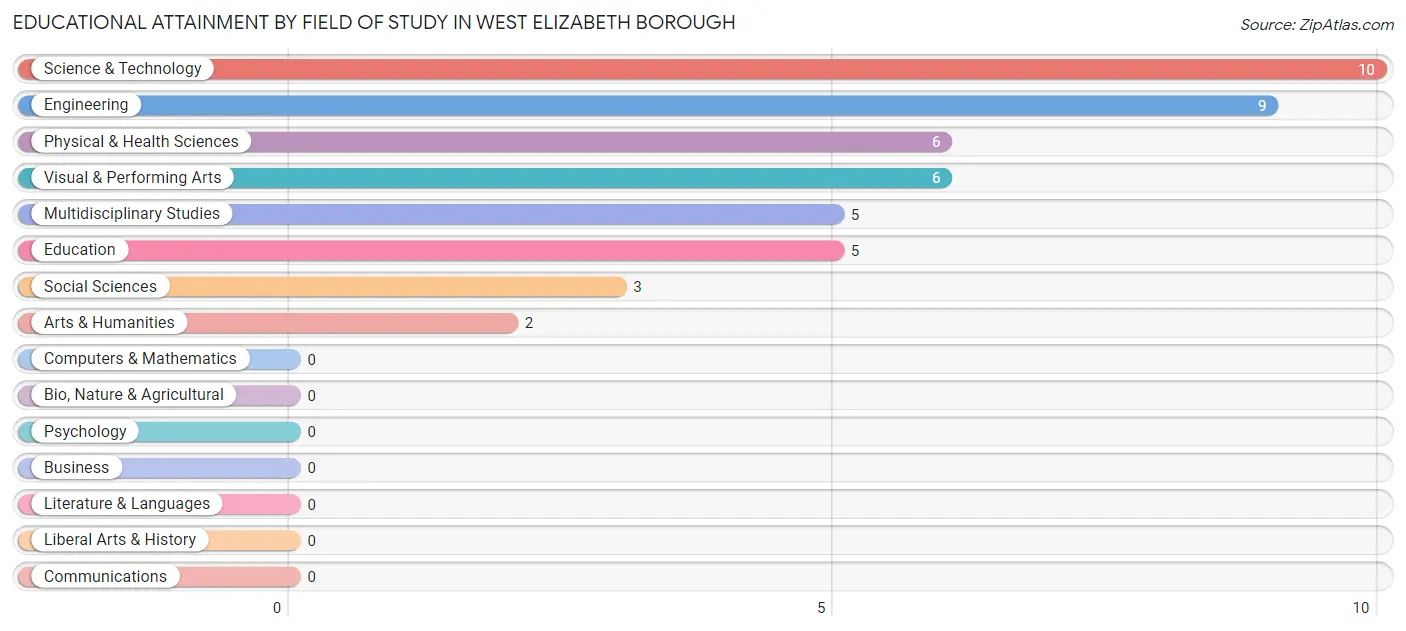
| Field of Study | # Graduates | % Graduates |
| Computers & Mathematics | 0 | 0.0% |
| Bio, Nature & Agricultural | 0 | 0.0% |
| Physical & Health Sciences | 6 | 13.0% |
| Psychology | 0 | 0.0% |
| Social Sciences | 3 | 6.5% |
| Engineering | 9 | 19.6% |
| Multidisciplinary Studies | 5 | 10.9% |
| Science & Technology | 10 | 21.7% |
| Business | 0 | 0.0% |
| Education | 5 | 10.9% |
| Literature & Languages | 0 | 0.0% |
| Liberal Arts & History | 0 | 0.0% |
| Visual & Performing Arts | 6 | 13.0% |
| Communications | 0 | 0.0% |
| Arts & Humanities | 2 | 4.3% |
| Total | 46 | 100.0% |
Transportation & Commute in West Elizabeth borough
Vehicle Availability by Sex in West Elizabeth borough
The most prevalent vehicle ownership categories in West Elizabeth borough are males with 2 vehicles (29, accounting for 29.6%) and females with 2 vehicles (28, making up 21.8%).
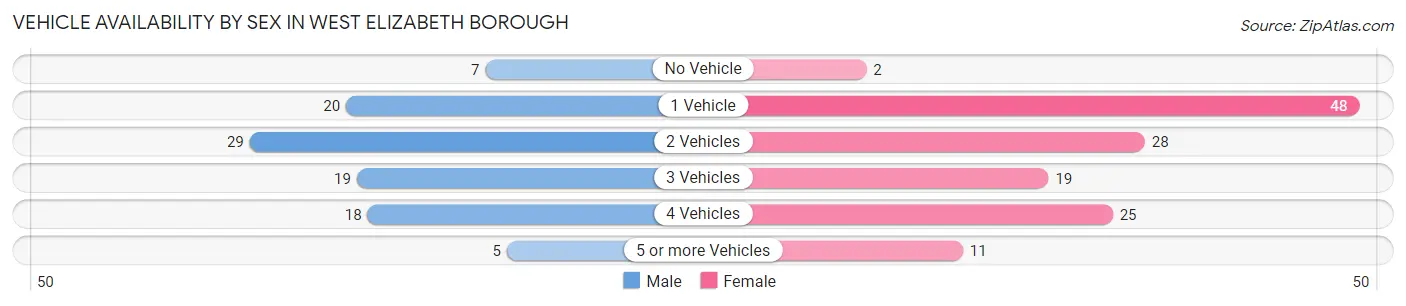
| Vehicles Available | Male | Female |
| No Vehicle | 7 (7.1%) | 2 (1.5%) |
| 1 Vehicle | 20 (20.4%) | 48 (36.1%) |
| 2 Vehicles | 29 (29.6%) | 28 (21.0%) |
| 3 Vehicles | 19 (19.4%) | 19 (14.3%) |
| 4 Vehicles | 18 (18.4%) | 25 (18.8%) |
| 5 or more Vehicles | 5 (5.1%) | 11 (8.3%) |
| Total | 98 (100.0%) | 133 (100.0%) |
Commute Time in West Elizabeth borough
The most frequently occuring commute durations in West Elizabeth borough are 40 to 44 minutes (42 commuters, 19.3%), 15 to 19 minutes (38 commuters, 17.4%), and 30 to 34 minutes (23 commuters, 10.5%).
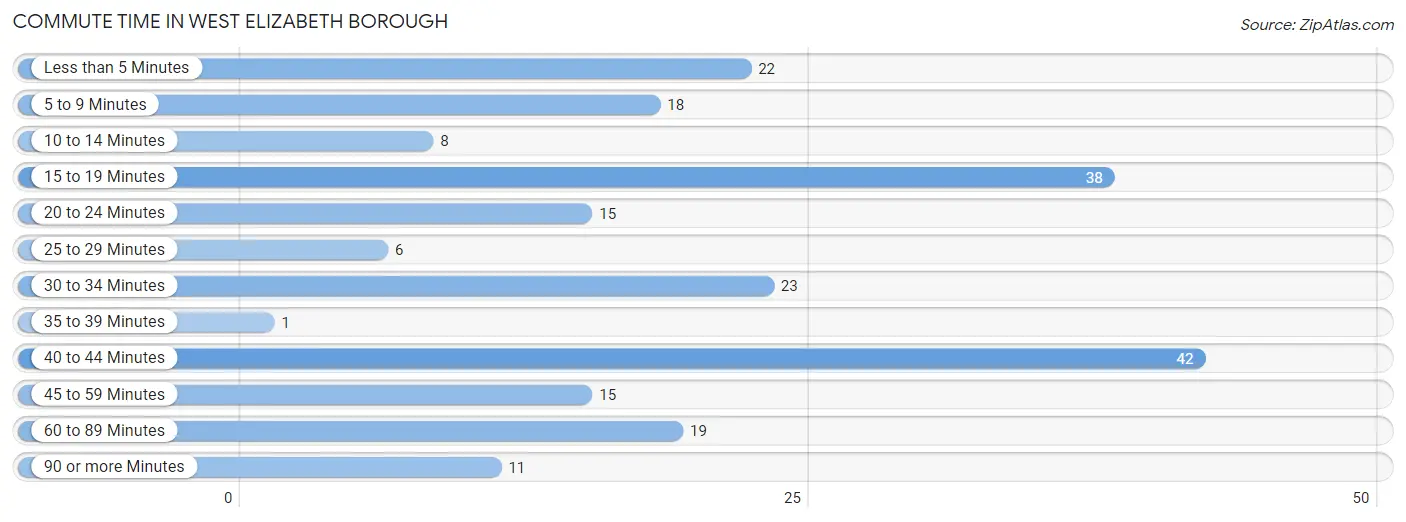
| Commute Time | # Commuters | % Commuters |
| Less than 5 Minutes | 22 | 10.1% |
| 5 to 9 Minutes | 18 | 8.3% |
| 10 to 14 Minutes | 8 | 3.7% |
| 15 to 19 Minutes | 38 | 17.4% |
| 20 to 24 Minutes | 15 | 6.9% |
| 25 to 29 Minutes | 6 | 2.8% |
| 30 to 34 Minutes | 23 | 10.5% |
| 35 to 39 Minutes | 1 | 0.5% |
| 40 to 44 Minutes | 42 | 19.3% |
| 45 to 59 Minutes | 15 | 6.9% |
| 60 to 89 Minutes | 19 | 8.7% |
| 90 or more Minutes | 11 | 5.1% |
Commute Time by Sex in West Elizabeth borough
The most common commute times in West Elizabeth borough are 40 to 44 minutes (30 commuters, 32.3%) for males and 15 to 19 minutes (25 commuters, 20.0%) for females.
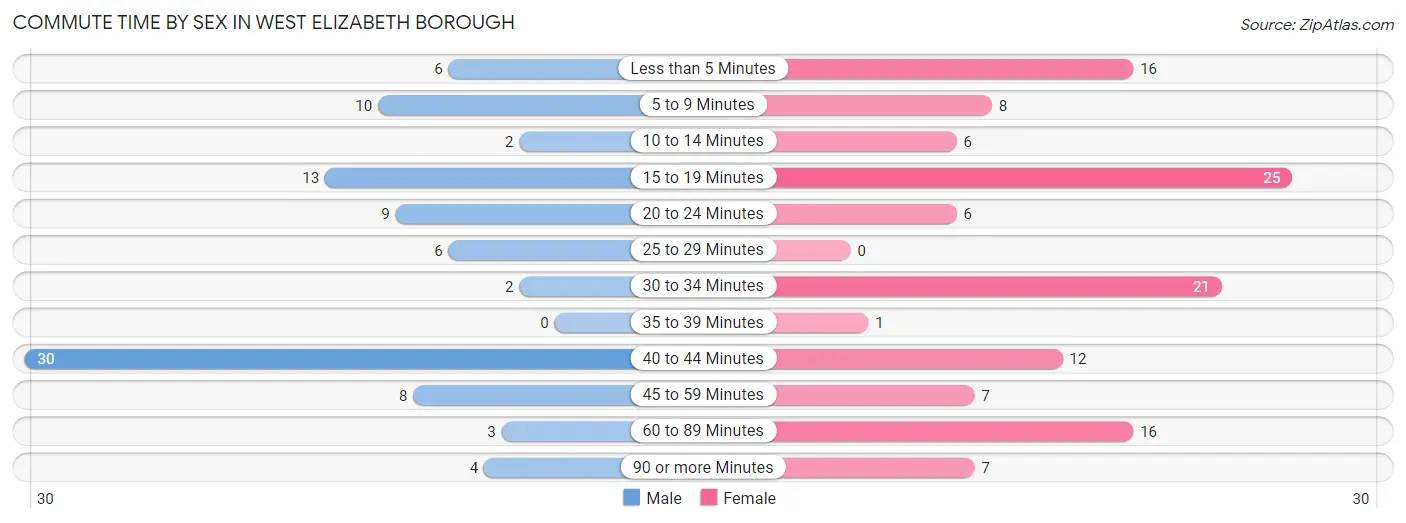
| Commute Time | Male | Female |
| Less than 5 Minutes | 6 (6.5%) | 16 (12.8%) |
| 5 to 9 Minutes | 10 (10.7%) | 8 (6.4%) |
| 10 to 14 Minutes | 2 (2.1%) | 6 (4.8%) |
| 15 to 19 Minutes | 13 (14.0%) | 25 (20.0%) |
| 20 to 24 Minutes | 9 (9.7%) | 6 (4.8%) |
| 25 to 29 Minutes | 6 (6.5%) | 0 (0.0%) |
| 30 to 34 Minutes | 2 (2.1%) | 21 (16.8%) |
| 35 to 39 Minutes | 0 (0.0%) | 1 (0.8%) |
| 40 to 44 Minutes | 30 (32.3%) | 12 (9.6%) |
| 45 to 59 Minutes | 8 (8.6%) | 7 (5.6%) |
| 60 to 89 Minutes | 3 (3.2%) | 16 (12.8%) |
| 90 or more Minutes | 4 (4.3%) | 7 (5.6%) |
Time of Departure to Work by Sex in West Elizabeth borough
The most frequent times of departure to work in West Elizabeth borough are 5:30 AM to 5:59 AM (23, 24.7%) for males and 7:00 AM to 7:29 AM (29, 23.2%) for females.
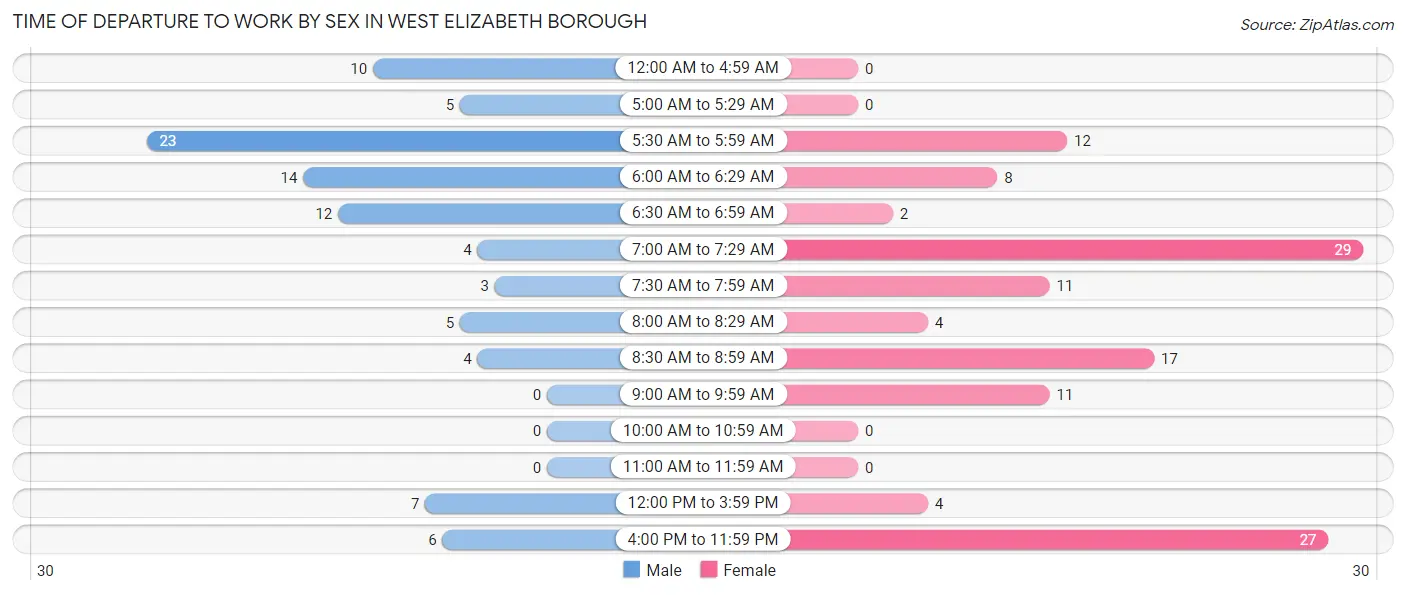
| Time of Departure | Male | Female |
| 12:00 AM to 4:59 AM | 10 (10.7%) | 0 (0.0%) |
| 5:00 AM to 5:29 AM | 5 (5.4%) | 0 (0.0%) |
| 5:30 AM to 5:59 AM | 23 (24.7%) | 12 (9.6%) |
| 6:00 AM to 6:29 AM | 14 (15.0%) | 8 (6.4%) |
| 6:30 AM to 6:59 AM | 12 (12.9%) | 2 (1.6%) |
| 7:00 AM to 7:29 AM | 4 (4.3%) | 29 (23.2%) |
| 7:30 AM to 7:59 AM | 3 (3.2%) | 11 (8.8%) |
| 8:00 AM to 8:29 AM | 5 (5.4%) | 4 (3.2%) |
| 8:30 AM to 8:59 AM | 4 (4.3%) | 17 (13.6%) |
| 9:00 AM to 9:59 AM | 0 (0.0%) | 11 (8.8%) |
| 10:00 AM to 10:59 AM | 0 (0.0%) | 0 (0.0%) |
| 11:00 AM to 11:59 AM | 0 (0.0%) | 0 (0.0%) |
| 12:00 PM to 3:59 PM | 7 (7.5%) | 4 (3.2%) |
| 4:00 PM to 11:59 PM | 6 (6.5%) | 27 (21.6%) |
| Total | 93 (100.0%) | 125 (100.0%) |
Housing Occupancy in West Elizabeth borough
Occupancy by Ownership in West Elizabeth borough
Of the total 166 dwellings in West Elizabeth borough, owner-occupied units account for 129 (77.7%), while renter-occupied units make up 37 (22.3%).
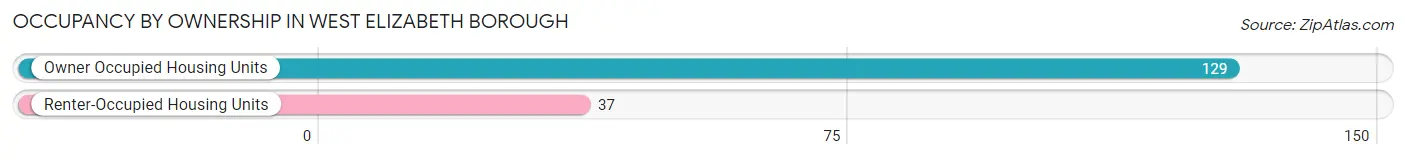
| Occupancy | # Housing Units | % Housing Units |
| Owner Occupied Housing Units | 129 | 77.7% |
| Renter-Occupied Housing Units | 37 | 22.3% |
| Total Occupied Housing Units | 166 | 100.0% |
Occupancy by Household Size in West Elizabeth borough
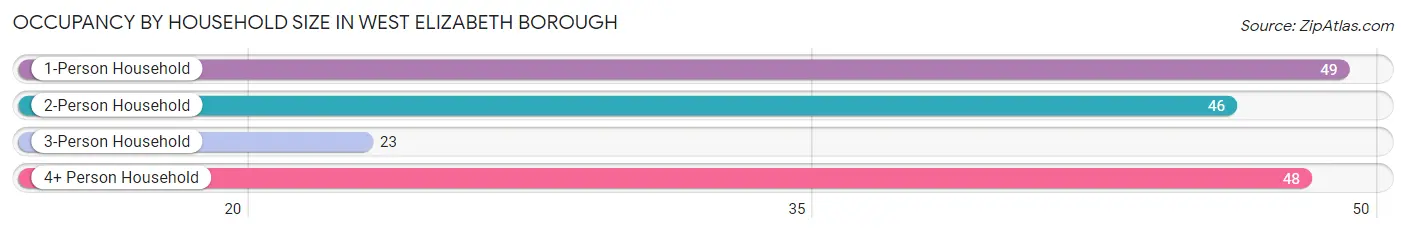
| Household Size | # Housing Units | % Housing Units |
| 1-Person Household | 49 | 29.5% |
| 2-Person Household | 46 | 27.7% |
| 3-Person Household | 23 | 13.9% |
| 4+ Person Household | 48 | 28.9% |
| Total Housing Units | 166 | 100.0% |
Occupancy by Ownership by Household Size in West Elizabeth borough
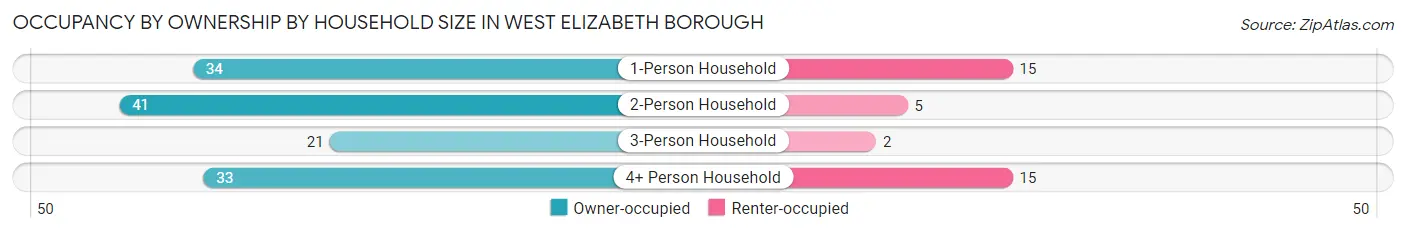
| Household Size | Owner-occupied | Renter-occupied |
| 1-Person Household | 34 (69.4%) | 15 (30.6%) |
| 2-Person Household | 41 (89.1%) | 5 (10.9%) |
| 3-Person Household | 21 (91.3%) | 2 (8.7%) |
| 4+ Person Household | 33 (68.8%) | 15 (31.2%) |
| Total Housing Units | 129 (77.7%) | 37 (22.3%) |
Occupancy by Educational Attainment in West Elizabeth borough
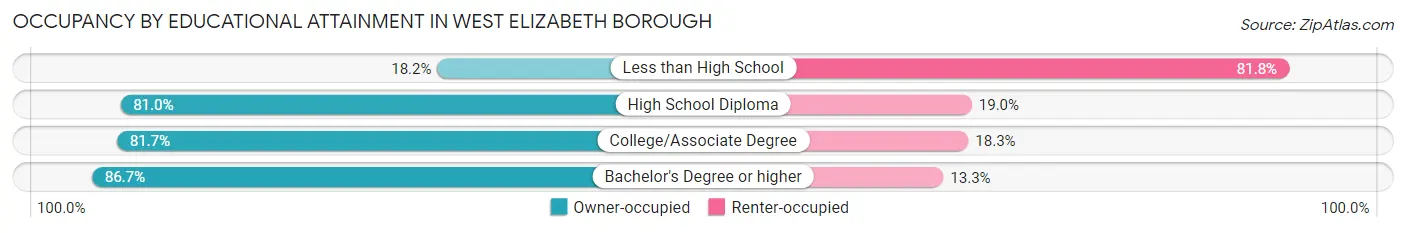
| Household Size | Owner-occupied | Renter-occupied |
| Less than High School | 2 (18.2%) | 9 (81.8%) |
| High School Diploma | 47 (81.0%) | 11 (19.0%) |
| College/Associate Degree | 67 (81.7%) | 15 (18.3%) |
| Bachelor's Degree or higher | 13 (86.7%) | 2 (13.3%) |
Occupancy by Age of Householder in West Elizabeth borough
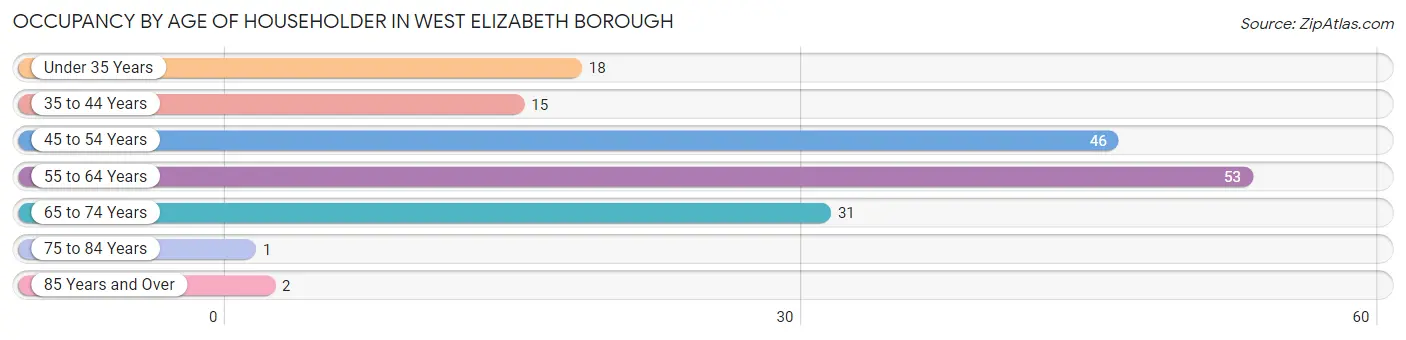
| Age Bracket | # Households | % Households |
| Under 35 Years | 18 | 10.8% |
| 35 to 44 Years | 15 | 9.0% |
| 45 to 54 Years | 46 | 27.7% |
| 55 to 64 Years | 53 | 31.9% |
| 65 to 74 Years | 31 | 18.7% |
| 75 to 84 Years | 1 | 0.6% |
| 85 Years and Over | 2 | 1.2% |
| Total | 166 | 100.0% |
Housing Finances in West Elizabeth borough
Median Income by Occupancy in West Elizabeth borough
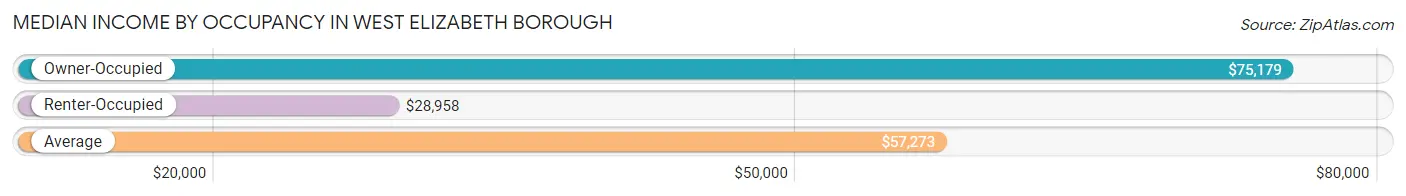
| Occupancy Type | # Households | Median Income |
| Owner-Occupied | 129 (77.7%) | $75,179 |
| Renter-Occupied | 37 (22.3%) | $28,958 |
| Average | 166 (100.0%) | $57,273 |
Occupancy by Householder Income Bracket in West Elizabeth borough
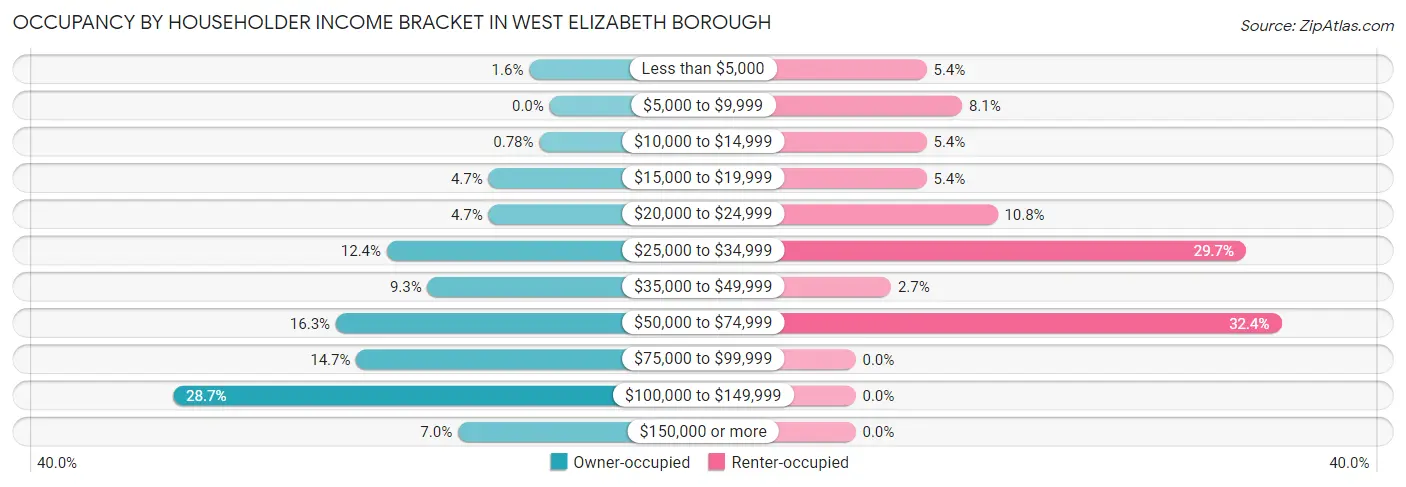
| Income Bracket | Owner-occupied | Renter-occupied |
| Less than $5,000 | 2 (1.5%) | 2 (5.4%) |
| $5,000 to $9,999 | 0 (0.0%) | 3 (8.1%) |
| $10,000 to $14,999 | 1 (0.8%) | 2 (5.4%) |
| $15,000 to $19,999 | 6 (4.6%) | 2 (5.4%) |
| $20,000 to $24,999 | 6 (4.6%) | 4 (10.8%) |
| $25,000 to $34,999 | 16 (12.4%) | 11 (29.7%) |
| $35,000 to $49,999 | 12 (9.3%) | 1 (2.7%) |
| $50,000 to $74,999 | 21 (16.3%) | 12 (32.4%) |
| $75,000 to $99,999 | 19 (14.7%) | 0 (0.0%) |
| $100,000 to $149,999 | 37 (28.7%) | 0 (0.0%) |
| $150,000 or more | 9 (7.0%) | 0 (0.0%) |
| Total | 129 (100.0%) | 37 (100.0%) |
Monthly Housing Cost Tiers in West Elizabeth borough
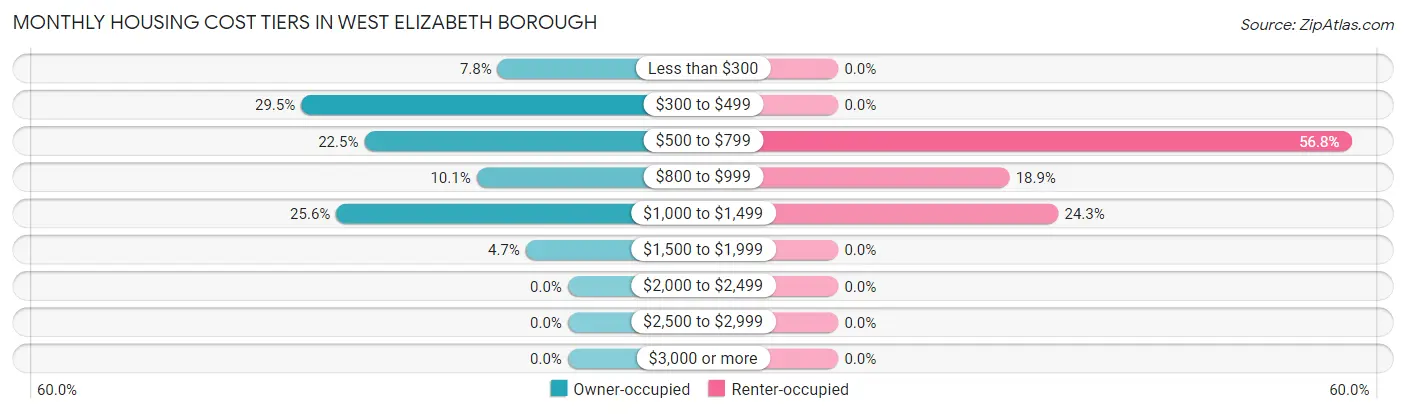
| Monthly Cost | Owner-occupied | Renter-occupied |
| Less than $300 | 10 (7.7%) | 0 (0.0%) |
| $300 to $499 | 38 (29.5%) | 0 (0.0%) |
| $500 to $799 | 29 (22.5%) | 21 (56.8%) |
| $800 to $999 | 13 (10.1%) | 7 (18.9%) |
| $1,000 to $1,499 | 33 (25.6%) | 9 (24.3%) |
| $1,500 to $1,999 | 6 (4.6%) | 0 (0.0%) |
| $2,000 to $2,499 | 0 (0.0%) | 0 (0.0%) |
| $2,500 to $2,999 | 0 (0.0%) | 0 (0.0%) |
| $3,000 or more | 0 (0.0%) | 0 (0.0%) |
| Total | 129 (100.0%) | 37 (100.0%) |
Physical Housing Characteristics in West Elizabeth borough
Housing Structures in West Elizabeth borough
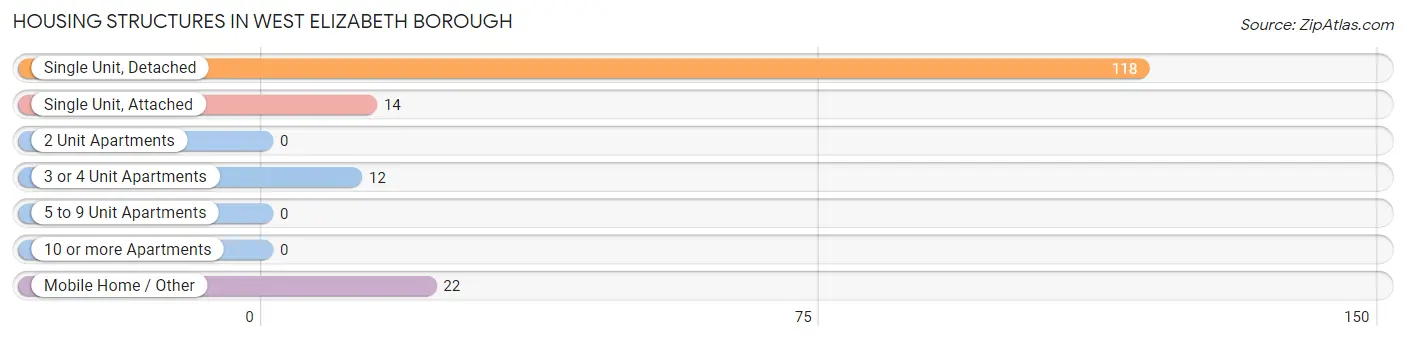
| Structure Type | # Housing Units | % Housing Units |
| Single Unit, Detached | 118 | 71.1% |
| Single Unit, Attached | 14 | 8.4% |
| 2 Unit Apartments | 0 | 0.0% |
| 3 or 4 Unit Apartments | 12 | 7.2% |
| 5 to 9 Unit Apartments | 0 | 0.0% |
| 10 or more Apartments | 0 | 0.0% |
| Mobile Home / Other | 22 | 13.3% |
| Total | 166 | 100.0% |
Housing Structures by Occupancy in West Elizabeth borough
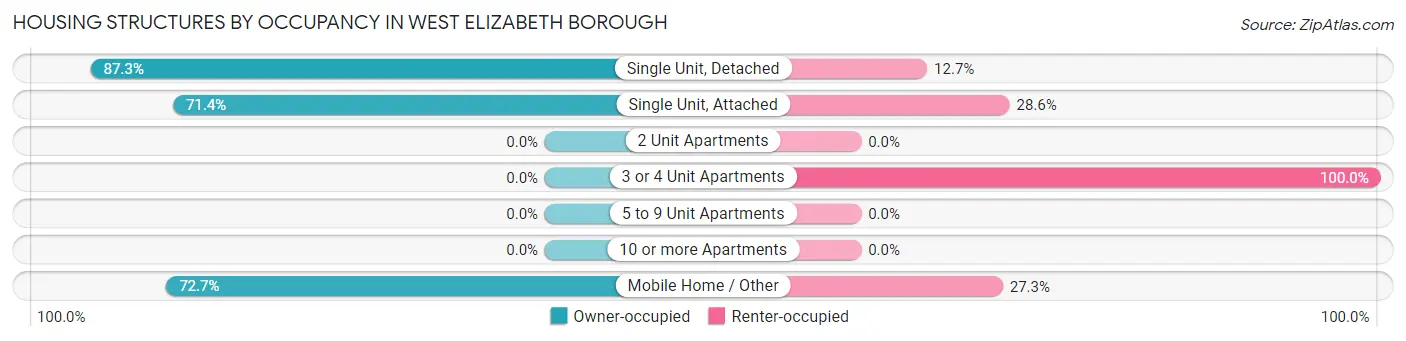
| Structure Type | Owner-occupied | Renter-occupied |
| Single Unit, Detached | 103 (87.3%) | 15 (12.7%) |
| Single Unit, Attached | 10 (71.4%) | 4 (28.6%) |
| 2 Unit Apartments | 0 (0.0%) | 0 (0.0%) |
| 3 or 4 Unit Apartments | 0 (0.0%) | 12 (100.0%) |
| 5 to 9 Unit Apartments | 0 (0.0%) | 0 (0.0%) |
| 10 or more Apartments | 0 (0.0%) | 0 (0.0%) |
| Mobile Home / Other | 16 (72.7%) | 6 (27.3%) |
| Total | 129 (77.7%) | 37 (22.3%) |
Housing Structures by Number of Rooms in West Elizabeth borough
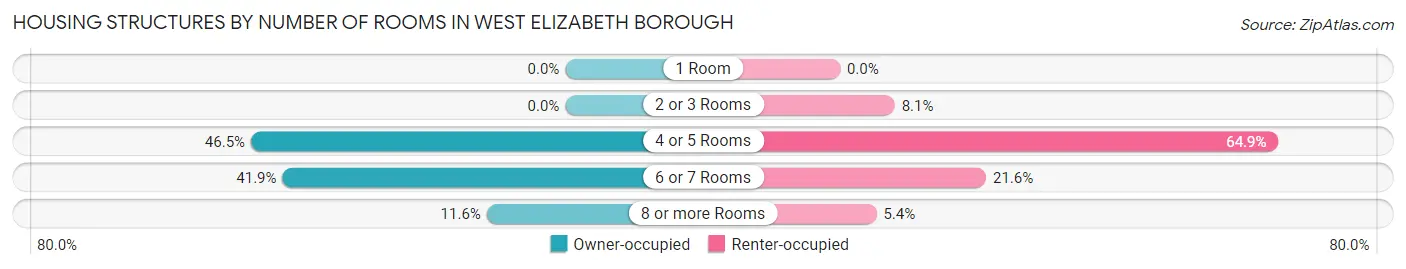
| Number of Rooms | Owner-occupied | Renter-occupied |
| 1 Room | 0 (0.0%) | 0 (0.0%) |
| 2 or 3 Rooms | 0 (0.0%) | 3 (8.1%) |
| 4 or 5 Rooms | 60 (46.5%) | 24 (64.9%) |
| 6 or 7 Rooms | 54 (41.9%) | 8 (21.6%) |
| 8 or more Rooms | 15 (11.6%) | 2 (5.4%) |
| Total | 129 (100.0%) | 37 (100.0%) |
Housing Structure by Heating Type in West Elizabeth borough
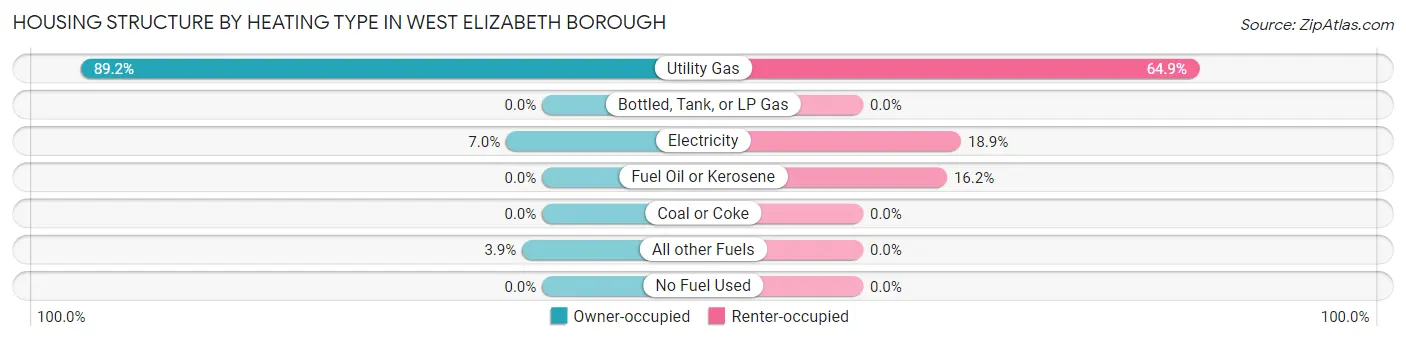
| Heating Type | Owner-occupied | Renter-occupied |
| Utility Gas | 115 (89.1%) | 24 (64.9%) |
| Bottled, Tank, or LP Gas | 0 (0.0%) | 0 (0.0%) |
| Electricity | 9 (7.0%) | 7 (18.9%) |
| Fuel Oil or Kerosene | 0 (0.0%) | 6 (16.2%) |
| Coal or Coke | 0 (0.0%) | 0 (0.0%) |
| All other Fuels | 5 (3.9%) | 0 (0.0%) |
| No Fuel Used | 0 (0.0%) | 0 (0.0%) |
| Total | 129 (100.0%) | 37 (100.0%) |
Household Vehicle Usage in West Elizabeth borough
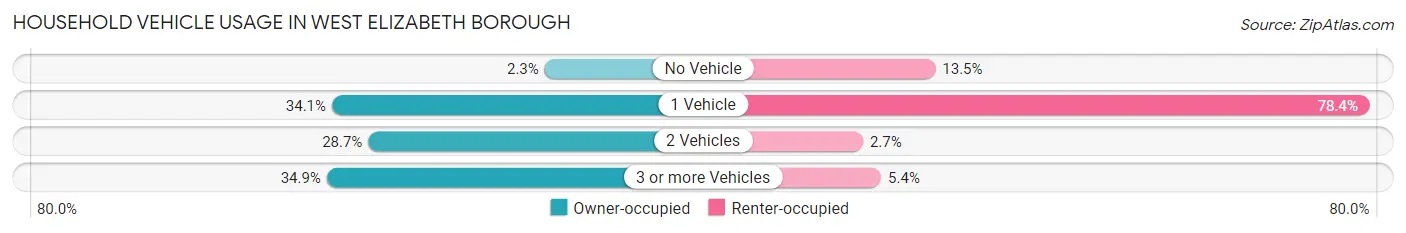
| Vehicles per Household | Owner-occupied | Renter-occupied |
| No Vehicle | 3 (2.3%) | 5 (13.5%) |
| 1 Vehicle | 44 (34.1%) | 29 (78.4%) |
| 2 Vehicles | 37 (28.7%) | 1 (2.7%) |
| 3 or more Vehicles | 45 (34.9%) | 2 (5.4%) |
| Total | 129 (100.0%) | 37 (100.0%) |
Real Estate & Mortgages in West Elizabeth borough
Real Estate and Mortgage Overview in West Elizabeth borough
| Characteristic | Without Mortgage | With Mortgage |
| Housing Units | 71 | 58 |
| Median Property Value | $66,300 | $78,200 |
| Median Household Income | $58,750 | $0 |
| Monthly Housing Costs | $454 | $0 |
| Real Estate Taxes | $1,250 | $0 |
Property Value by Mortgage Status in West Elizabeth borough
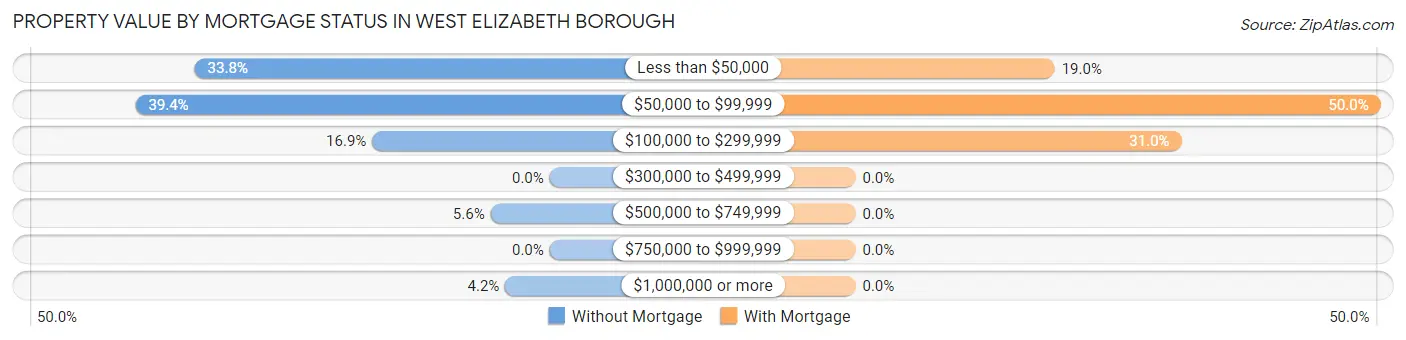
| Property Value | Without Mortgage | With Mortgage |
| Less than $50,000 | 24 (33.8%) | 11 (19.0%) |
| $50,000 to $99,999 | 28 (39.4%) | 29 (50.0%) |
| $100,000 to $299,999 | 12 (16.9%) | 18 (31.0%) |
| $300,000 to $499,999 | 0 (0.0%) | 0 (0.0%) |
| $500,000 to $749,999 | 4 (5.6%) | 0 (0.0%) |
| $750,000 to $999,999 | 0 (0.0%) | 0 (0.0%) |
| $1,000,000 or more | 3 (4.2%) | 0 (0.0%) |
| Total | 71 (100.0%) | 58 (100.0%) |
Household Income by Mortgage Status in West Elizabeth borough
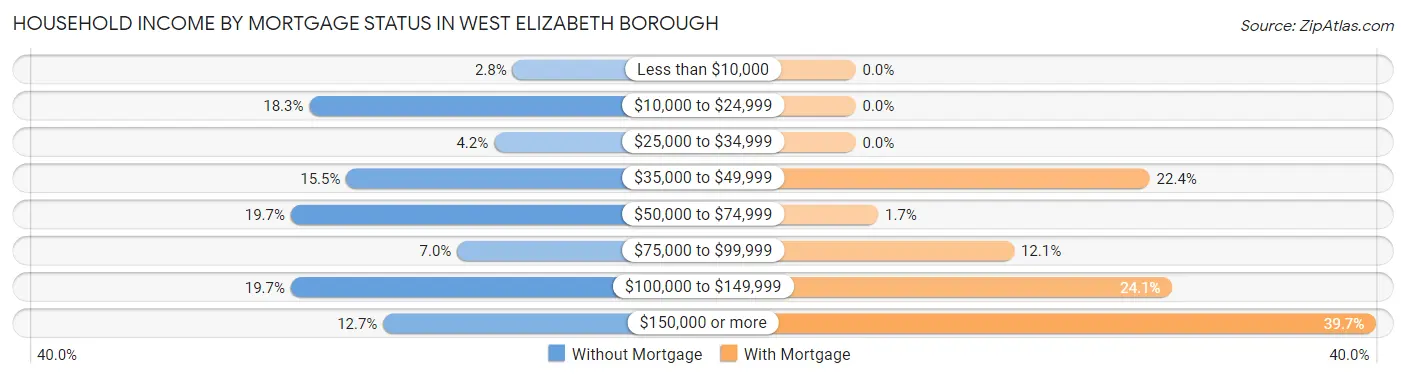
| Household Income | Without Mortgage | With Mortgage |
| Less than $10,000 | 2 (2.8%) | 0 (0.0%) |
| $10,000 to $24,999 | 13 (18.3%) | 0 (0.0%) |
| $25,000 to $34,999 | 3 (4.2%) | 0 (0.0%) |
| $35,000 to $49,999 | 11 (15.5%) | 13 (22.4%) |
| $50,000 to $74,999 | 14 (19.7%) | 1 (1.7%) |
| $75,000 to $99,999 | 5 (7.0%) | 7 (12.1%) |
| $100,000 to $149,999 | 14 (19.7%) | 14 (24.1%) |
| $150,000 or more | 9 (12.7%) | 23 (39.7%) |
| Total | 71 (100.0%) | 58 (100.0%) |
Property Value to Household Income Ratio in West Elizabeth borough
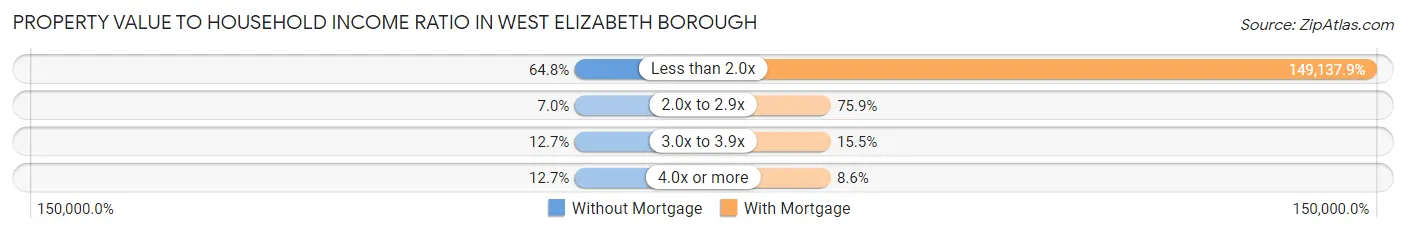
| Value-to-Income Ratio | Without Mortgage | With Mortgage |
| Less than 2.0x | 46 (64.8%) | 86,500 (149,137.9%) |
| 2.0x to 2.9x | 5 (7.0%) | 44 (75.9%) |
| 3.0x to 3.9x | 9 (12.7%) | 9 (15.5%) |
| 4.0x or more | 9 (12.7%) | 5 (8.6%) |
| Total | 71 (100.0%) | 58 (100.0%) |
Real Estate Taxes by Mortgage Status in West Elizabeth borough
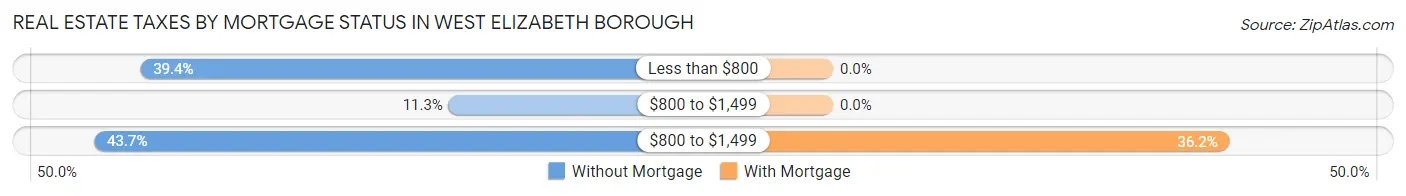
| Property Taxes | Without Mortgage | With Mortgage |
| Less than $800 | 28 (39.4%) | 0 (0.0%) |
| $800 to $1,499 | 8 (11.3%) | 0 (0.0%) |
| $800 to $1,499 | 31 (43.7%) | 21 (36.2%) |
| Total | 71 (100.0%) | 58 (100.0%) |
Health & Disability in West Elizabeth borough
Health Insurance Coverage by Age in West Elizabeth borough
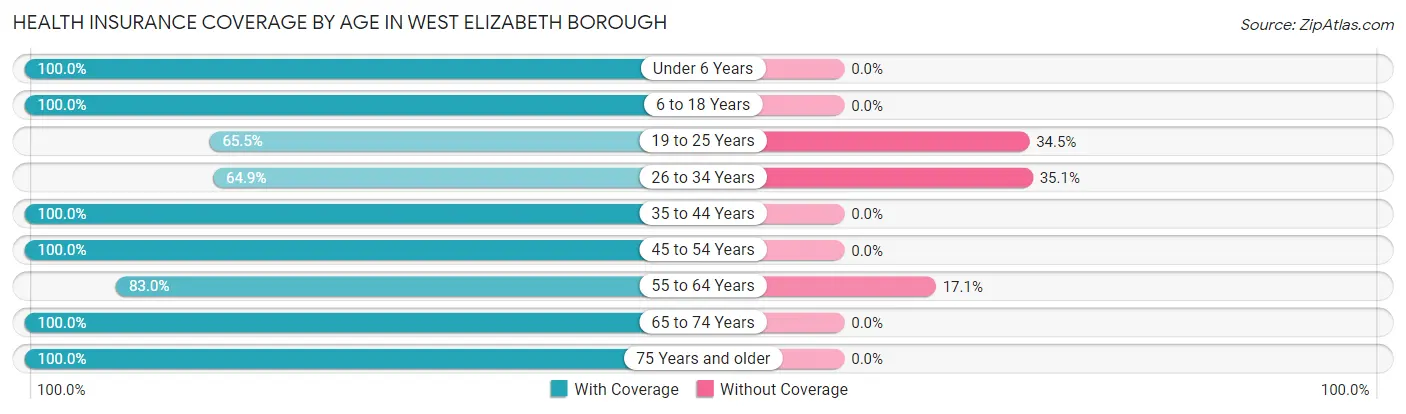
| Age Bracket | With Coverage | Without Coverage |
| Under 6 Years | 35 (100.0%) | 0 (0.0%) |
| 6 to 18 Years | 65 (100.0%) | 0 (0.0%) |
| 19 to 25 Years | 38 (65.5%) | 20 (34.5%) |
| 26 to 34 Years | 24 (64.9%) | 13 (35.1%) |
| 35 to 44 Years | 18 (100.0%) | 0 (0.0%) |
| 45 to 54 Years | 100 (100.0%) | 0 (0.0%) |
| 55 to 64 Years | 73 (83.0%) | 15 (17.1%) |
| 65 to 74 Years | 38 (100.0%) | 0 (0.0%) |
| 75 Years and older | 17 (100.0%) | 0 (0.0%) |
| Total | 408 (89.5%) | 48 (10.5%) |
Health Insurance Coverage by Citizenship Status in West Elizabeth borough
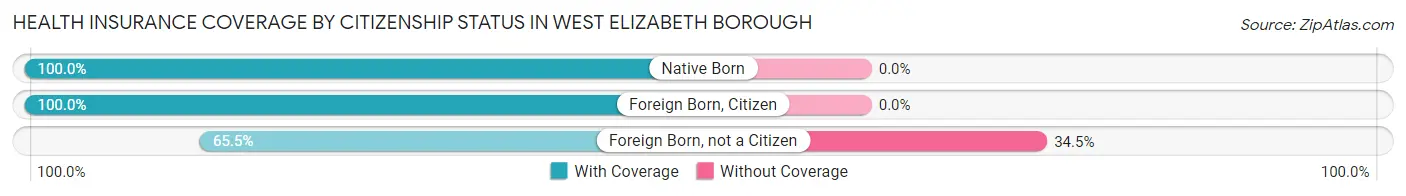
| Citizenship Status | With Coverage | Without Coverage |
| Native Born | 35 (100.0%) | 0 (0.0%) |
| Foreign Born, Citizen | 65 (100.0%) | 0 (0.0%) |
| Foreign Born, not a Citizen | 38 (65.5%) | 20 (34.5%) |
Health Insurance Coverage by Household Income in West Elizabeth borough
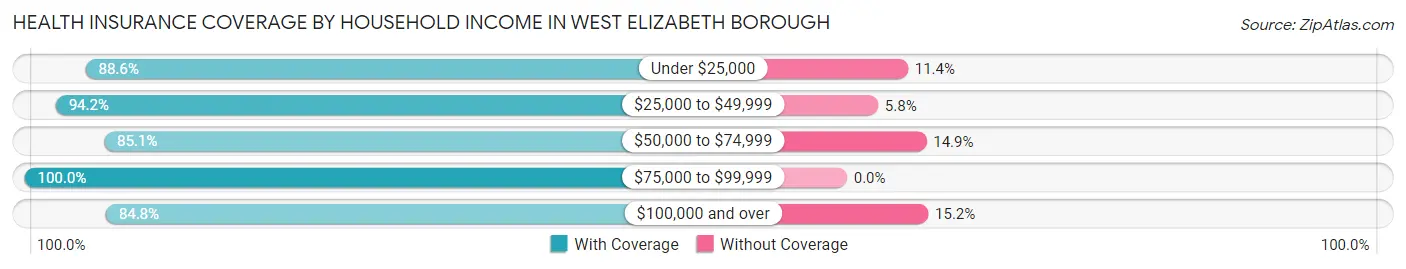
| Household Income | With Coverage | Without Coverage |
| Under $25,000 | 31 (88.6%) | 4 (11.4%) |
| $25,000 to $49,999 | 113 (94.2%) | 7 (5.8%) |
| $50,000 to $74,999 | 80 (85.1%) | 14 (14.9%) |
| $75,000 to $99,999 | 56 (100.0%) | 0 (0.0%) |
| $100,000 and over | 128 (84.8%) | 23 (15.2%) |
Public vs Private Health Insurance Coverage by Age in West Elizabeth borough
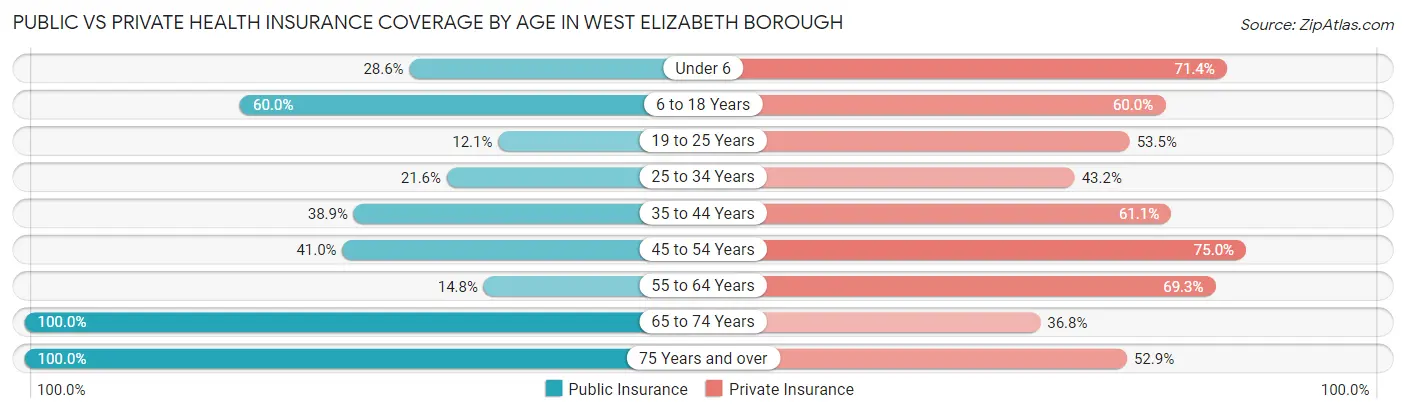
| Age Bracket | Public Insurance | Private Insurance |
| Under 6 | 10 (28.6%) | 25 (71.4%) |
| 6 to 18 Years | 39 (60.0%) | 39 (60.0%) |
| 19 to 25 Years | 7 (12.1%) | 31 (53.4%) |
| 25 to 34 Years | 8 (21.6%) | 16 (43.2%) |
| 35 to 44 Years | 7 (38.9%) | 11 (61.1%) |
| 45 to 54 Years | 41 (41.0%) | 75 (75.0%) |
| 55 to 64 Years | 13 (14.8%) | 61 (69.3%) |
| 65 to 74 Years | 38 (100.0%) | 14 (36.8%) |
| 75 Years and over | 17 (100.0%) | 9 (52.9%) |
| Total | 180 (39.5%) | 281 (61.6%) |
Disability Status by Sex by Age in West Elizabeth borough
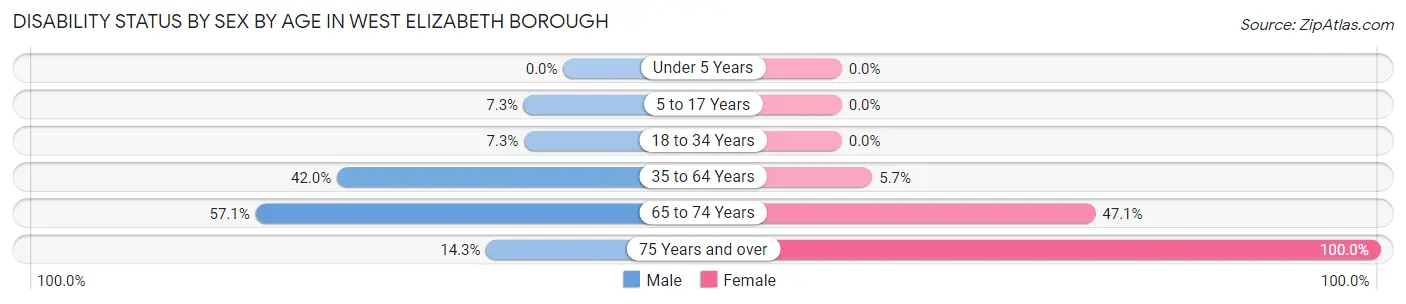
| Age Bracket | Male | Female |
| Under 5 Years | 0 (0.0%) | 0 (0.0%) |
| 5 to 17 Years | 3 (7.3%) | 0 (0.0%) |
| 18 to 34 Years | 4 (7.3%) | 0 (0.0%) |
| 35 to 64 Years | 42 (42.0%) | 6 (5.7%) |
| 65 to 74 Years | 12 (57.1%) | 8 (47.1%) |
| 75 Years and over | 1 (14.3%) | 10 (100.0%) |
Disability Class by Sex by Age in West Elizabeth borough
Disability Class: Hearing Difficulty
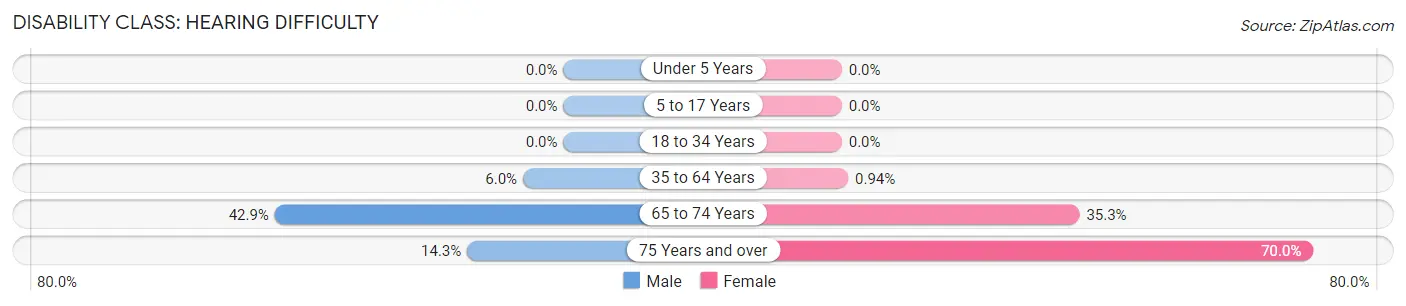
| Age Bracket | Male | Female |
| Under 5 Years | 0 (0.0%) | 0 (0.0%) |
| 5 to 17 Years | 0 (0.0%) | 0 (0.0%) |
| 18 to 34 Years | 0 (0.0%) | 0 (0.0%) |
| 35 to 64 Years | 6 (6.0%) | 1 (0.9%) |
| 65 to 74 Years | 9 (42.9%) | 6 (35.3%) |
| 75 Years and over | 1 (14.3%) | 7 (70.0%) |
Disability Class: Vision Difficulty
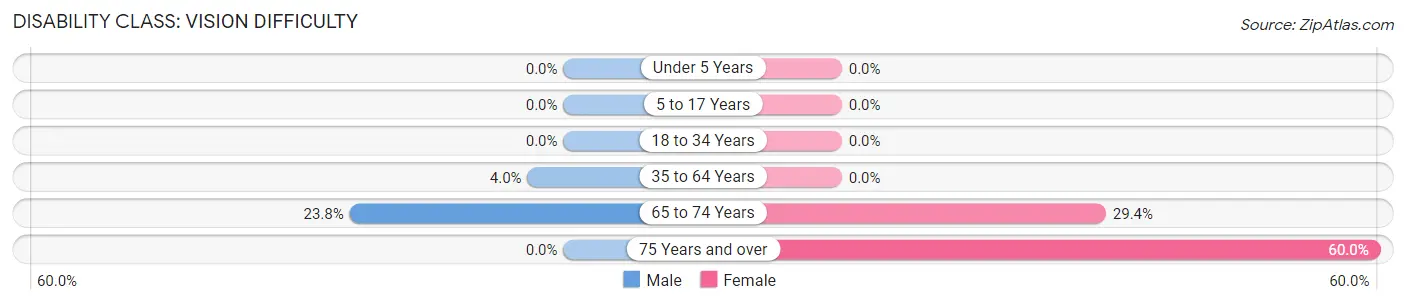
| Age Bracket | Male | Female |
| Under 5 Years | 0 (0.0%) | 0 (0.0%) |
| 5 to 17 Years | 0 (0.0%) | 0 (0.0%) |
| 18 to 34 Years | 0 (0.0%) | 0 (0.0%) |
| 35 to 64 Years | 4 (4.0%) | 0 (0.0%) |
| 65 to 74 Years | 5 (23.8%) | 5 (29.4%) |
| 75 Years and over | 0 (0.0%) | 6 (60.0%) |
Disability Class: Cognitive Difficulty
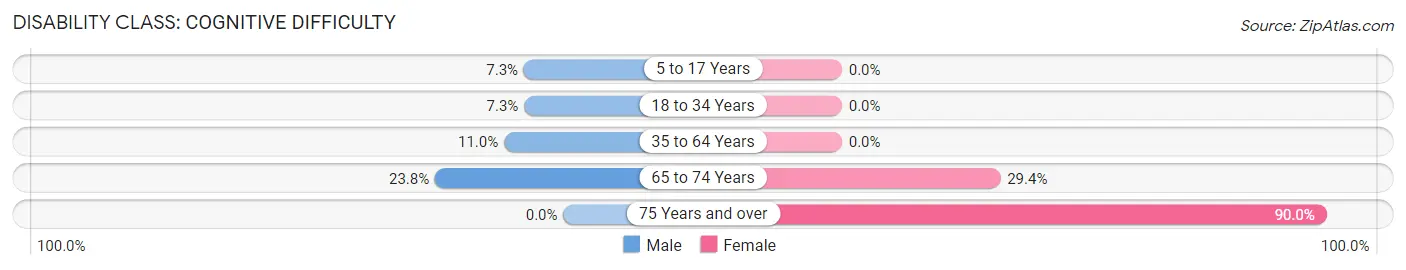
| Age Bracket | Male | Female |
| 5 to 17 Years | 3 (7.3%) | 0 (0.0%) |
| 18 to 34 Years | 4 (7.3%) | 0 (0.0%) |
| 35 to 64 Years | 11 (11.0%) | 0 (0.0%) |
| 65 to 74 Years | 5 (23.8%) | 5 (29.4%) |
| 75 Years and over | 0 (0.0%) | 9 (90.0%) |
Disability Class: Ambulatory Difficulty
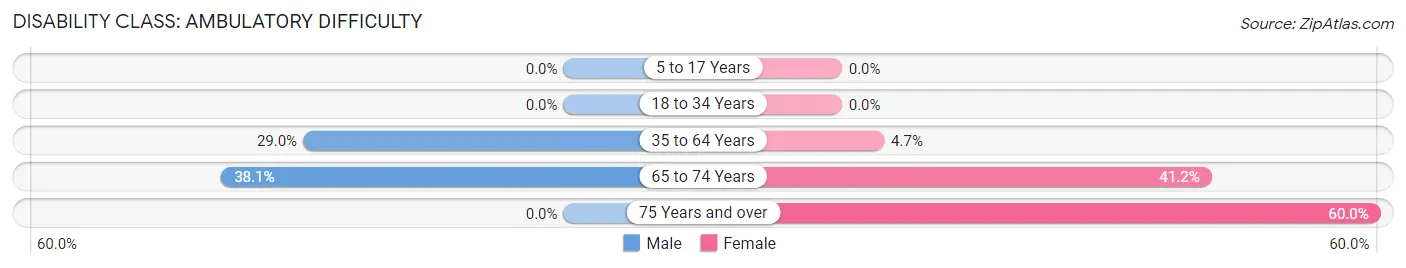
| Age Bracket | Male | Female |
| 5 to 17 Years | 0 (0.0%) | 0 (0.0%) |
| 18 to 34 Years | 0 (0.0%) | 0 (0.0%) |
| 35 to 64 Years | 29 (29.0%) | 5 (4.7%) |
| 65 to 74 Years | 8 (38.1%) | 7 (41.2%) |
| 75 Years and over | 0 (0.0%) | 6 (60.0%) |
Disability Class: Self-Care Difficulty
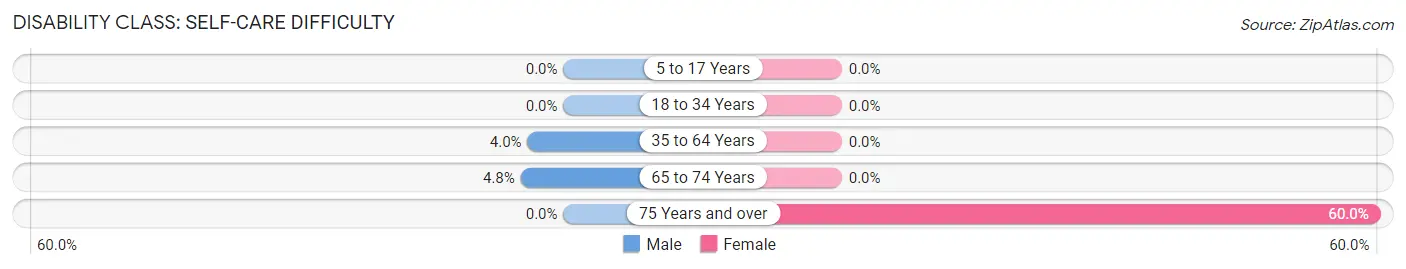
| Age Bracket | Male | Female |
| 5 to 17 Years | 0 (0.0%) | 0 (0.0%) |
| 18 to 34 Years | 0 (0.0%) | 0 (0.0%) |
| 35 to 64 Years | 4 (4.0%) | 0 (0.0%) |
| 65 to 74 Years | 1 (4.8%) | 0 (0.0%) |
| 75 Years and over | 0 (0.0%) | 6 (60.0%) |
Technology Access in West Elizabeth borough
Computing Device Access in West Elizabeth borough
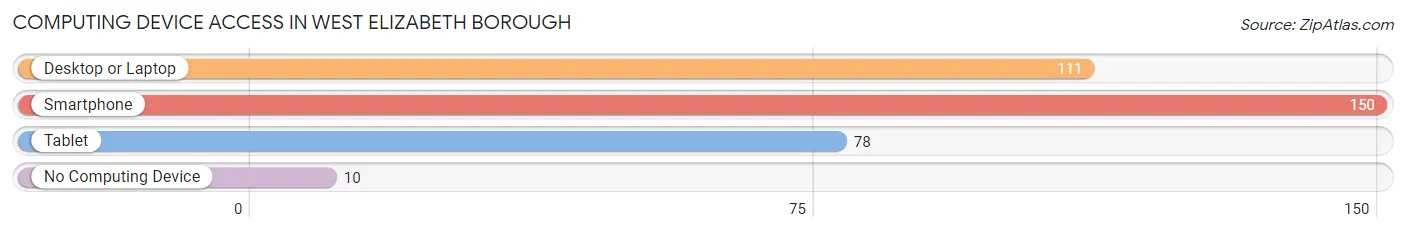
| Device Type | # Households | % Households |
| Desktop or Laptop | 111 | 66.9% |
| Smartphone | 150 | 90.4% |
| Tablet | 78 | 47.0% |
| No Computing Device | 10 | 6.0% |
| Total | 166 | 100.0% |
Internet Access in West Elizabeth borough
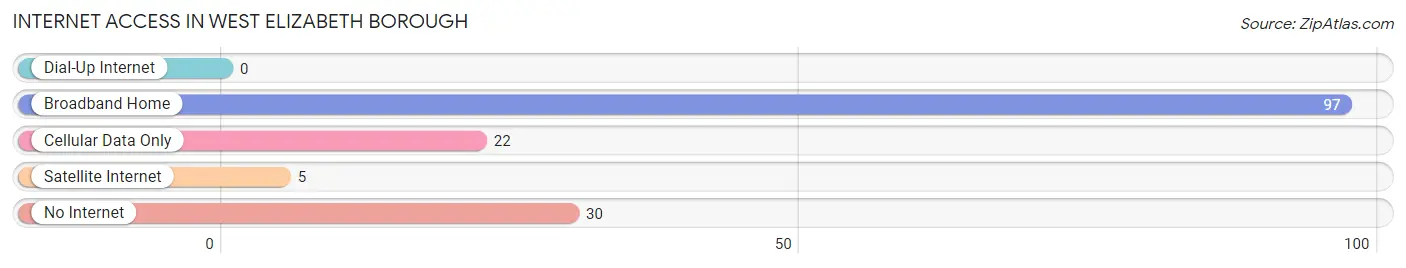
| Internet Type | # Households | % Households |
| Dial-Up Internet | 0 | 0.0% |
| Broadband Home | 97 | 58.4% |
| Cellular Data Only | 22 | 13.3% |
| Satellite Internet | 5 | 3.0% |
| No Internet | 30 | 18.1% |
| Total | 166 | 100.0% |
West Elizabeth borough Summary
West Elizabeth Borough is a small borough located in Allegheny County, Pennsylvania. It is situated along the Monongahela River, approximately 15 miles south of Pittsburgh. The borough was incorporated in 1891 and has a population of approximately 1,400 people.
History
West Elizabeth Borough was originally part of Elizabeth Township, which was established in 1788. The area was first settled in the late 1700s by German and Scots-Irish immigrants. The town was named after Elizabeth, the wife of William Penn, the founder of Pennsylvania. The town was officially incorporated in 1891 and was named West Elizabeth Borough.
The borough was an important industrial center in the late 19th and early 20th centuries. The Monongahela River provided a convenient transportation route for the coal, steel, and other goods produced in the area. The borough was also home to several glass factories, which produced bottles and other glass products.
Geography
West Elizabeth Borough is located in Allegheny County, Pennsylvania. It is situated along the Monongahela River, approximately 15 miles south of Pittsburgh. The borough is bordered by Elizabeth Township to the north, Forward Township to the east, and Jefferson Hills Borough to the south. The borough covers an area of 1.2 square miles and has a population of approximately 1,400 people.
The borough is located in the Allegheny Plateau region of Pennsylvania. The terrain is mostly flat, with some rolling hills. The borough is located in a humid continental climate zone, with hot summers and cold winters.
Economy
West Elizabeth Borough is a small, rural community with a limited economy. The borough is home to several small businesses, including a few restaurants, a grocery store, and a few retail stores. The borough is also home to a few manufacturing companies, which produce a variety of products, including steel, glass, and plastic.
The borough is also home to a few small farms, which produce a variety of crops, including corn, soybeans, and hay. The borough is also home to a few coal mines, which produce coal for local power plants.
Demographics
West Elizabeth Borough has a population of approximately 1,400 people. The population is predominantly white, with a small minority population. The median household income is $41,000, and the median home value is $90,000. The borough has a high rate of poverty, with approximately 20% of the population living below the poverty line.
The borough is served by the Elizabeth-Forward School District. The district has two elementary schools, one middle school, and one high school. The borough is also home to a few private schools, including a Catholic school and a Christian school.
Conclusion
West Elizabeth Borough is a small borough located in Allegheny County, Pennsylvania. It is situated along the Monongahela River, approximately 15 miles south of Pittsburgh. The borough was incorporated in 1891 and has a population of approximately 1,400 people. The borough is a small, rural community with a limited economy. The population is predominantly white, with a small minority population. The borough is served by the Elizabeth-Forward School District and is home to a few small businesses, farms, and manufacturing companies.
Common Questions
What is Per Capita Income in West Elizabeth borough?
Per Capita income in West Elizabeth borough is $26,883.
What is the Median Family Income in West Elizabeth borough?
Median Family Income in West Elizabeth borough is $77,500.
What is the Median Household income in West Elizabeth borough?
Median Household Income in West Elizabeth borough is $57,273.
What is Income or Wage Gap in West Elizabeth borough?
Income or Wage Gap in West Elizabeth borough is 46.3%.
Women in West Elizabeth borough earn 53.7 cents for every dollar earned by a man.
What is Inequality or Gini Index in West Elizabeth borough?
Inequality or Gini Index in West Elizabeth borough is 0.37.
What is the Total Population of West Elizabeth borough?
Total Population of West Elizabeth borough is 456.
What is the Total Male Population of West Elizabeth borough?
Total Male Population of West Elizabeth borough is 242.
What is the Total Female Population of West Elizabeth borough?
Total Female Population of West Elizabeth borough is 214.
What is the Ratio of Males per 100 Females in West Elizabeth borough?
There are 113.08 Males per 100 Females in West Elizabeth borough.
What is the Ratio of Females per 100 Males in West Elizabeth borough?
There are 88.43 Females per 100 Males in West Elizabeth borough.
What is the Median Population Age in West Elizabeth borough?
Median Population Age in West Elizabeth borough is 48.0 Years.
What is the Average Family Size in West Elizabeth borough
Average Family Size in West Elizabeth borough is 3.3 People.
What is the Average Household Size in West Elizabeth borough
Average Household Size in West Elizabeth borough is 2.8 People.
How Large is the Labor Force in West Elizabeth borough?
There are 263 People in the Labor Forcein in West Elizabeth borough.
What is the Percentage of People in the Labor Force in West Elizabeth borough?
67.8% of People are in the Labor Force in West Elizabeth borough.
What is the Unemployment Rate in West Elizabeth borough?
Unemployment Rate in West Elizabeth borough is 9.1%.