McDonald borough, PA Map & Demographics
McDonald borough Overview
$29,557
PER CAPITA INCOME
$61,674
AVG FAMILY INCOME
$52,768
AVG HOUSEHOLD INCOME
35.3%
WAGE / INCOME GAP [ % ]
64.7¢/ $1
WAGE / INCOME GAP [ $ ]
0.39
INEQUALITY / GINI INDEX
2,263
TOTAL POPULATION
1,143
MALE POPULATION
1,120
FEMALE POPULATION
102.05
MALES / 100 FEMALES
97.99
FEMALES / 100 MALES
39.7
MEDIAN AGE
3.1
AVG FAMILY SIZE
2.2
AVG HOUSEHOLD SIZE
1,102
LABOR FORCE [ PEOPLE ]
60.1%
PERCENT IN LABOR FORCE
5.3%
UNEMPLOYMENT RATE
Income in McDonald borough
Income Overview in McDonald borough
Per Capita Income in McDonald borough is $29,557, while median incomes of families and households are $61,674 and $52,768 respectively.
| Characteristic | Number | Measure |
| Per Capita Income | 2,263 | $29,557 |
| Median Family Income | 517 | $61,674 |
| Mean Family Income | 517 | $77,487 |
| Median Household Income | 1,021 | $52,768 |
| Mean Household Income | 1,021 | $62,809 |
| Income Deficit | 517 | $0 |
| Wage / Income Gap (%) | 2,263 | 35.32% |
| Wage / Income Gap ($) | 2,263 | 64.68¢ per $1 |
| Gini / Inequality Index | 2,263 | 0.39 |
Earnings by Sex in McDonald borough
Average Earnings in McDonald borough are $36,193, $47,000 for men and $30,398 for women, a difference of 35.3%.
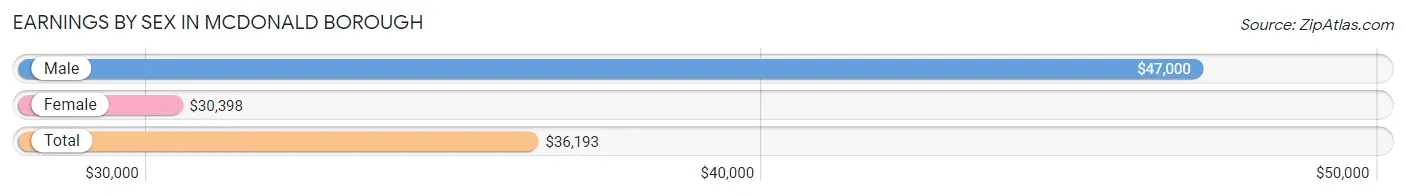
| Sex | Number | Average Earnings |
| Male | 618 (54.0%) | $47,000 |
| Female | 526 (46.0%) | $30,398 |
| Total | 1,144 (100.0%) | $36,193 |
Earnings by Sex by Income Bracket in McDonald borough
The most common earnings brackets in McDonald borough are $55,000 to $64,999 for men (77 | 12.5%) and $22,500 to $24,999 for women (99 | 18.8%).
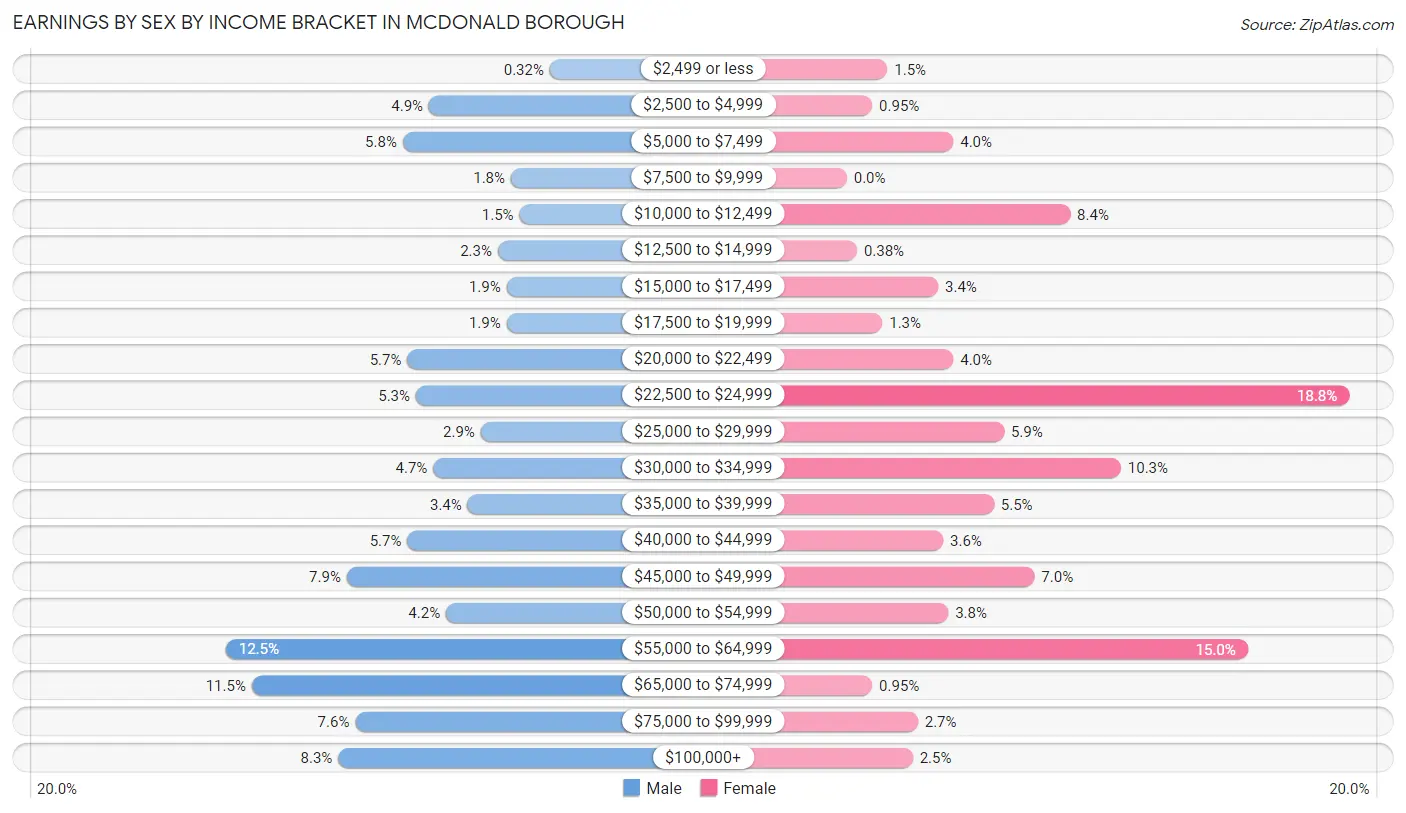
| Income | Male | Female |
| $2,499 or less | 2 (0.3%) | 8 (1.5%) |
| $2,500 to $4,999 | 30 (4.9%) | 5 (0.9%) |
| $5,000 to $7,499 | 36 (5.8%) | 21 (4.0%) |
| $7,500 to $9,999 | 11 (1.8%) | 0 (0.0%) |
| $10,000 to $12,499 | 9 (1.5%) | 44 (8.4%) |
| $12,500 to $14,999 | 14 (2.3%) | 2 (0.4%) |
| $15,000 to $17,499 | 12 (1.9%) | 18 (3.4%) |
| $17,500 to $19,999 | 12 (1.9%) | 7 (1.3%) |
| $20,000 to $22,499 | 35 (5.7%) | 21 (4.0%) |
| $22,500 to $24,999 | 33 (5.3%) | 99 (18.8%) |
| $25,000 to $29,999 | 18 (2.9%) | 31 (5.9%) |
| $30,000 to $34,999 | 29 (4.7%) | 54 (10.3%) |
| $35,000 to $39,999 | 21 (3.4%) | 29 (5.5%) |
| $40,000 to $44,999 | 35 (5.7%) | 19 (3.6%) |
| $45,000 to $49,999 | 49 (7.9%) | 37 (7.0%) |
| $50,000 to $54,999 | 26 (4.2%) | 20 (3.8%) |
| $55,000 to $64,999 | 77 (12.5%) | 79 (15.0%) |
| $65,000 to $74,999 | 71 (11.5%) | 5 (0.9%) |
| $75,000 to $99,999 | 47 (7.6%) | 14 (2.7%) |
| $100,000+ | 51 (8.3%) | 13 (2.5%) |
| Total | 618 (100.0%) | 526 (100.0%) |
Earnings by Sex by Educational Attainment in McDonald borough
Average earnings in McDonald borough are $51,484 for men and $30,795 for women, a difference of 40.2%. Men with an educational attainment of bachelor's degree enjoy the highest average annual earnings of $79,688, while those with high school diploma education earn the least with $35,000. Women with an educational attainment of college or associate's degree earn the most with the average annual earnings of $47,917, while those with high school diploma education have the smallest earnings of $24,492.
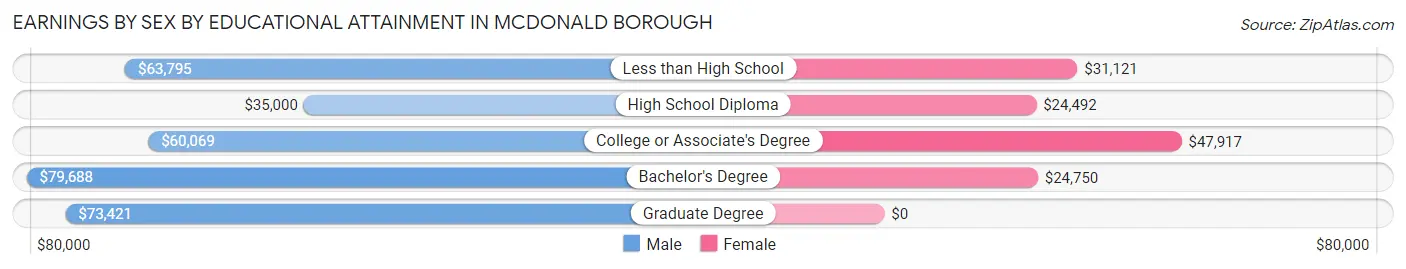
| Educational Attainment | Male Income | Female Income |
| Less than High School | $63,795 | $31,121 |
| High School Diploma | $35,000 | $24,492 |
| College or Associate's Degree | $60,069 | $47,917 |
| Bachelor's Degree | $79,688 | $24,750 |
| Graduate Degree | $73,421 | $0 |
| Total | $51,484 | $30,795 |
Family Income in McDonald borough
Family Income Brackets in McDonald borough
According to the McDonald borough family income data, there are 143 families falling into the $50,000 to $74,999 income range, which is the most common income bracket and makes up 27.7% of all families.
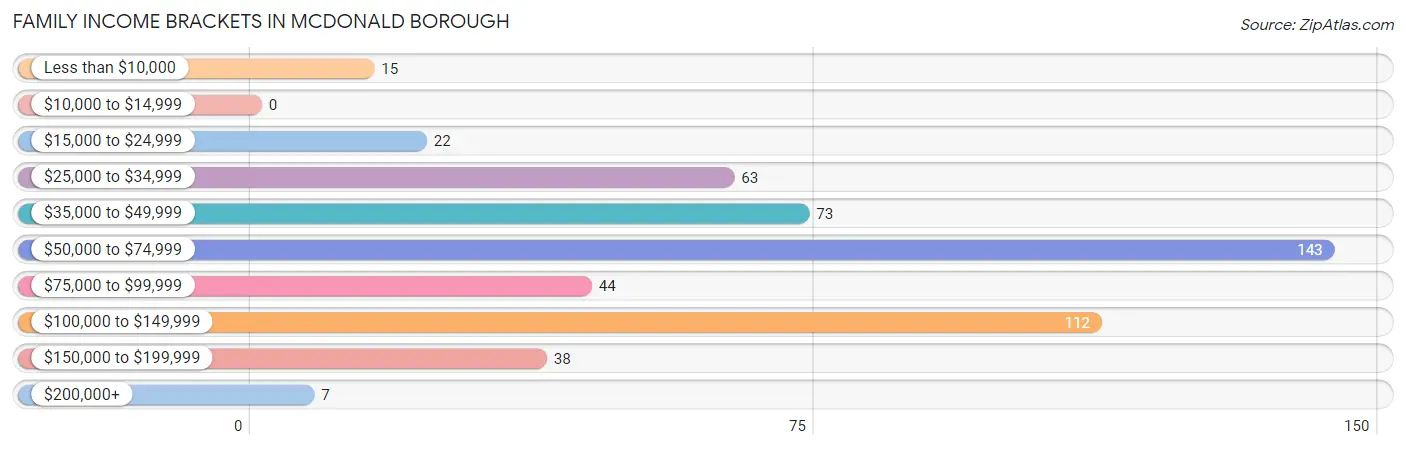
| Income Bracket | # Families | % Families |
| Less than $10,000 | 15 | 2.9% |
| $10,000 to $14,999 | 0 | 0.0% |
| $15,000 to $24,999 | 22 | 4.3% |
| $25,000 to $34,999 | 63 | 12.2% |
| $35,000 to $49,999 | 73 | 14.1% |
| $50,000 to $74,999 | 143 | 27.7% |
| $75,000 to $99,999 | 44 | 8.5% |
| $100,000 to $149,999 | 112 | 21.7% |
| $150,000 to $199,999 | 38 | 7.4% |
| $200,000+ | 7 | 1.4% |
Family Income by Famaliy Size in McDonald borough
5-person families (28 | 5.4%) account for the highest median family income in McDonald borough with $141,250 per family, while 2-person families (257 | 49.7%) have the highest median income of $30,586 per family member.
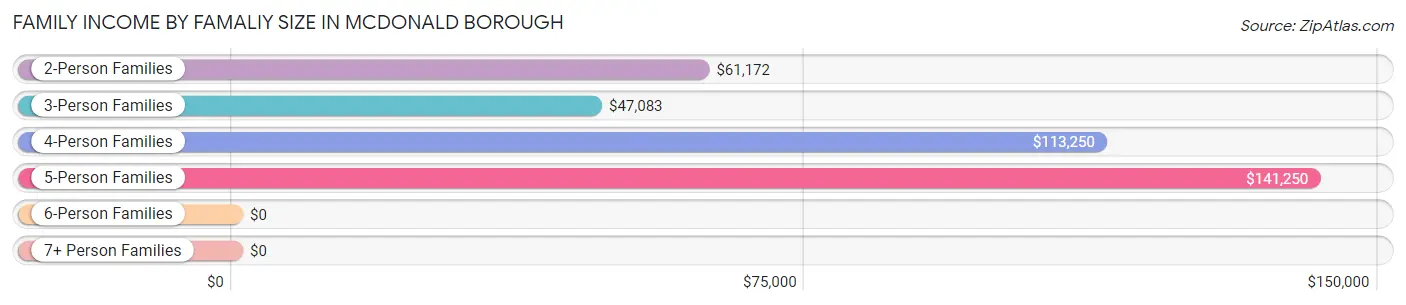
| Income Bracket | # Families | Median Income |
| 2-Person Families | 257 (49.7%) | $61,172 |
| 3-Person Families | 144 (27.9%) | $47,083 |
| 4-Person Families | 76 (14.7%) | $113,250 |
| 5-Person Families | 28 (5.4%) | $141,250 |
| 6-Person Families | 0 (0.0%) | $0 |
| 7+ Person Families | 12 (2.3%) | $0 |
| Total | 517 (100.0%) | $61,674 |
Family Income by Number of Earners in McDonald borough
The median family income in McDonald borough is $61,674, with families comprising 3+ earners (46) having the highest median family income of $141,429, while families with no earners (88) have the lowest median family income of $44,286, accounting for 8.9% and 17.0% of families, respectively.
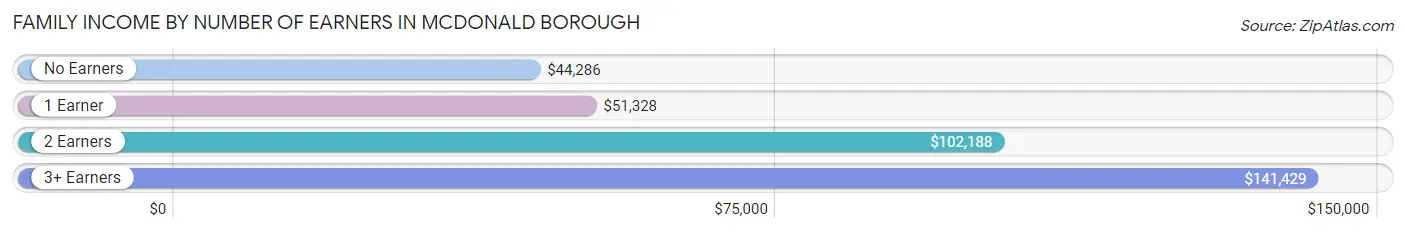
| Number of Earners | # Families | Median Income |
| No Earners | 88 (17.0%) | $44,286 |
| 1 Earner | 199 (38.5%) | $51,328 |
| 2 Earners | 184 (35.6%) | $102,188 |
| 3+ Earners | 46 (8.9%) | $141,429 |
| Total | 517 (100.0%) | $61,674 |
Household Income in McDonald borough
Household Income Brackets in McDonald borough
With 239 households falling in the category, the $50,000 to $74,999 income range is the most frequent in McDonald borough, accounting for 23.4% of all households. In contrast, only 7 households (0.7%) fall into the $200,000+ income bracket, making it the least populous group.
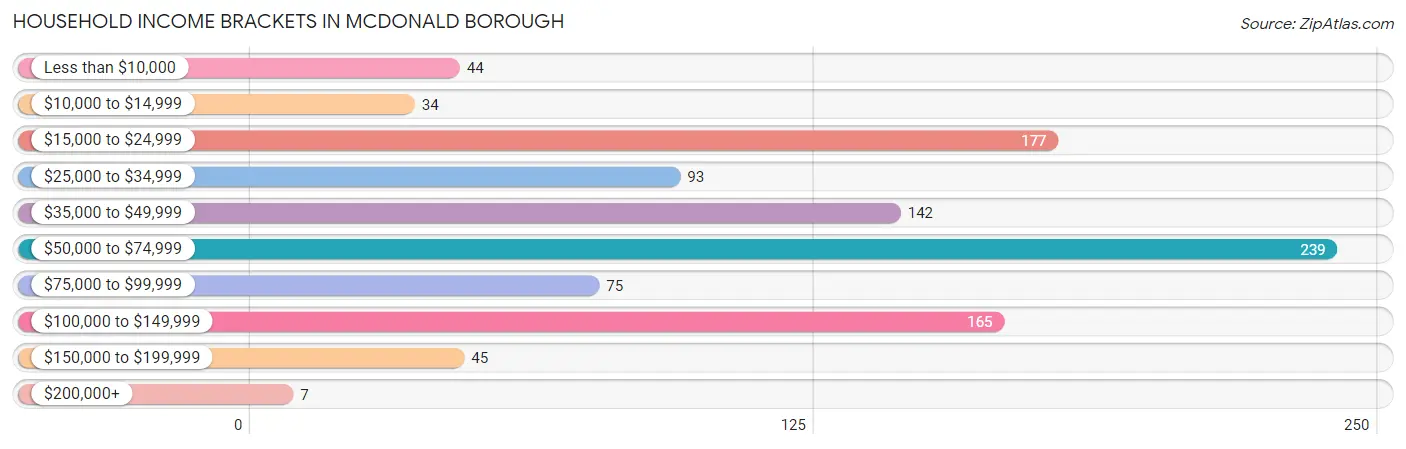
| Income Bracket | # Households | % Households |
| Less than $10,000 | 44 | 4.3% |
| $10,000 to $14,999 | 34 | 3.3% |
| $15,000 to $24,999 | 177 | 17.3% |
| $25,000 to $34,999 | 93 | 9.1% |
| $35,000 to $49,999 | 142 | 13.9% |
| $50,000 to $74,999 | 239 | 23.4% |
| $75,000 to $99,999 | 75 | 7.3% |
| $100,000 to $149,999 | 165 | 16.2% |
| $150,000 to $199,999 | 45 | 4.4% |
| $200,000+ | 7 | 0.7% |
Household Income by Householder Age in McDonald borough
The median household income in McDonald borough is $52,768, with the highest median household income of $62,438 found in the 25 to 44 years age bracket for the primary householder. A total of 316 households (30.9%) fall into this category. Meanwhile, the 15 to 24 years age bracket for the primary householder has the lowest median household income of $0, with 65 households (6.4%) in this group.
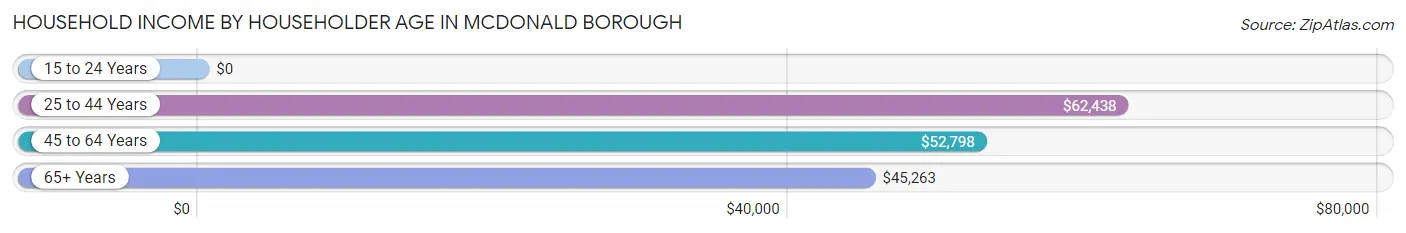
| Income Bracket | # Households | Median Income |
| 15 to 24 Years | 65 (6.4%) | $0 |
| 25 to 44 Years | 316 (30.9%) | $62,438 |
| 45 to 64 Years | 308 (30.2%) | $52,798 |
| 65+ Years | 332 (32.5%) | $45,263 |
| Total | 1,021 (100.0%) | $52,768 |
Poverty in McDonald borough
Income Below Poverty by Sex and Age in McDonald borough
With 7.4% poverty level for males and 10.8% for females among the residents of McDonald borough, 12 to 14 year old males and 18 to 24 year old females are the most vulnerable to poverty, with 14 males (41.2%) and 12 females (22.2%) in their respective age groups living below the poverty level.
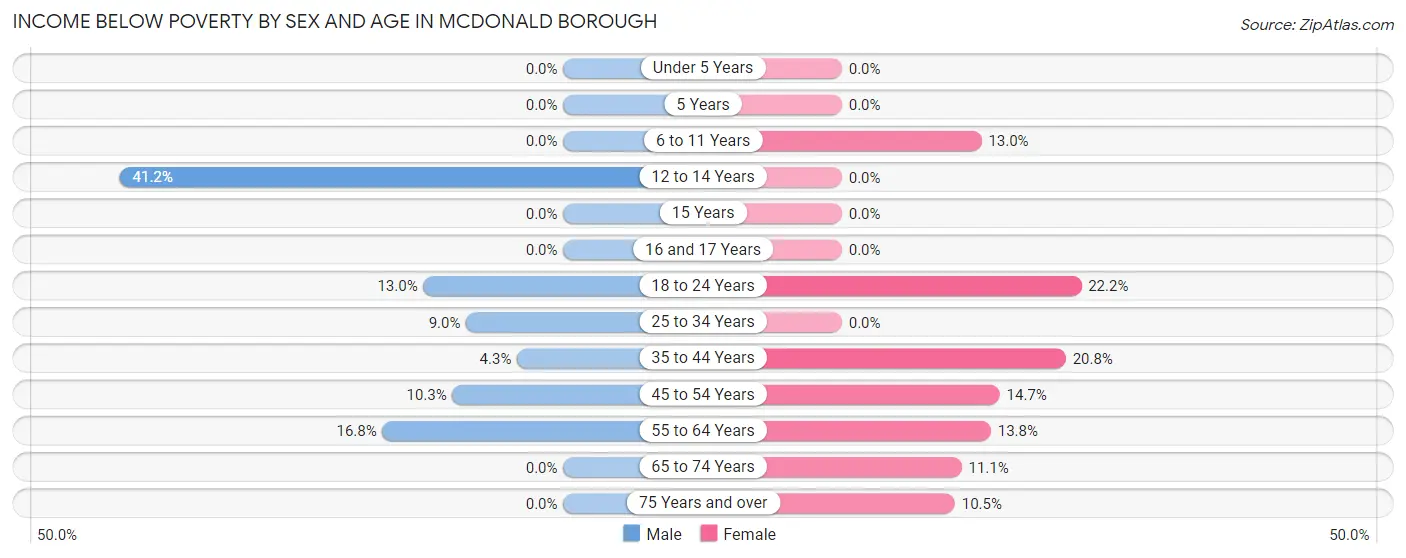
| Age Bracket | Male | Female |
| Under 5 Years | 0 (0.0%) | 0 (0.0%) |
| 5 Years | 0 (0.0%) | 0 (0.0%) |
| 6 to 11 Years | 0 (0.0%) | 14 (13.0%) |
| 12 to 14 Years | 14 (41.2%) | 0 (0.0%) |
| 15 Years | 0 (0.0%) | 0 (0.0%) |
| 16 and 17 Years | 0 (0.0%) | 0 (0.0%) |
| 18 to 24 Years | 17 (13.0%) | 12 (22.2%) |
| 25 to 34 Years | 10 (9.0%) | 0 (0.0%) |
| 35 to 44 Years | 8 (4.3%) | 32 (20.8%) |
| 45 to 54 Years | 11 (10.3%) | 23 (14.6%) |
| 55 to 64 Years | 24 (16.8%) | 13 (13.8%) |
| 65 to 74 Years | 0 (0.0%) | 10 (11.1%) |
| 75 Years and over | 0 (0.0%) | 17 (10.5%) |
| Total | 84 (7.4%) | 121 (10.8%) |
Income Above Poverty by Sex and Age in McDonald borough
According to the poverty statistics in McDonald borough, males aged under 5 years and females aged under 5 years are the age groups that are most secure financially, with 100.0% of males and 100.0% of females in these age groups living above the poverty line.
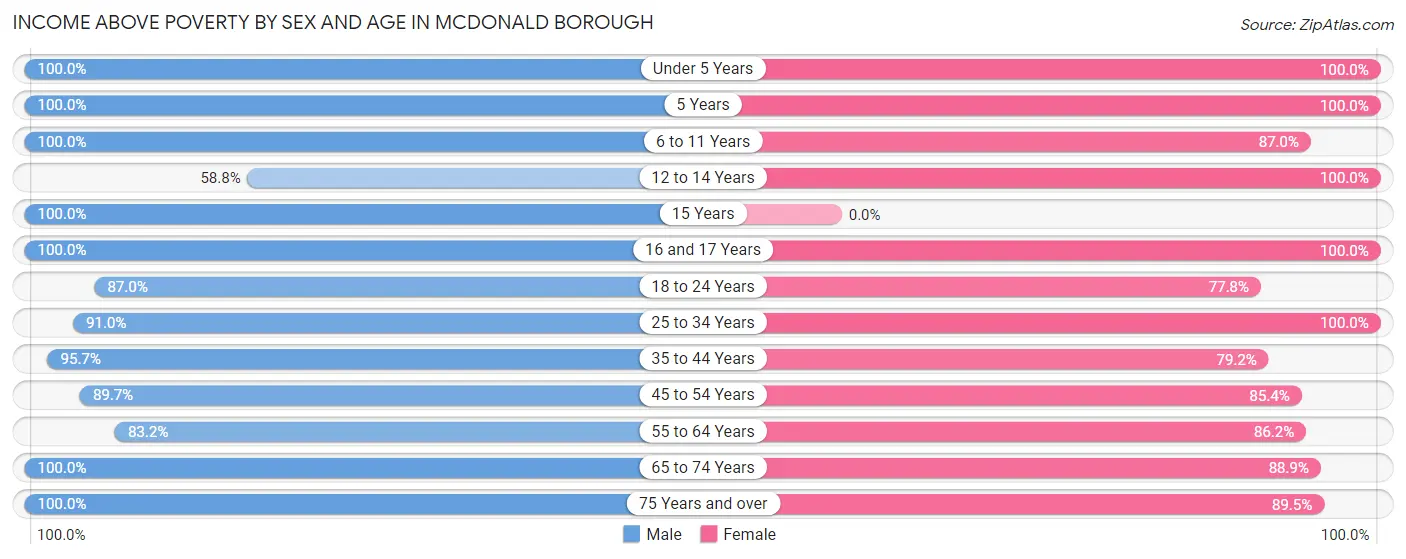
| Age Bracket | Male | Female |
| Under 5 Years | 38 (100.0%) | 69 (100.0%) |
| 5 Years | 9 (100.0%) | 3 (100.0%) |
| 6 to 11 Years | 84 (100.0%) | 94 (87.0%) |
| 12 to 14 Years | 20 (58.8%) | 45 (100.0%) |
| 15 Years | 37 (100.0%) | 0 (0.0%) |
| 16 and 17 Years | 47 (100.0%) | 24 (100.0%) |
| 18 to 24 Years | 114 (87.0%) | 42 (77.8%) |
| 25 to 34 Years | 101 (91.0%) | 160 (100.0%) |
| 35 to 44 Years | 179 (95.7%) | 122 (79.2%) |
| 45 to 54 Years | 96 (89.7%) | 134 (85.4%) |
| 55 to 64 Years | 119 (83.2%) | 81 (86.2%) |
| 65 to 74 Years | 135 (100.0%) | 80 (88.9%) |
| 75 Years and over | 77 (100.0%) | 145 (89.5%) |
| Total | 1,056 (92.6%) | 999 (89.2%) |
Income Below Poverty Among Married-Couple Families in McDonald borough
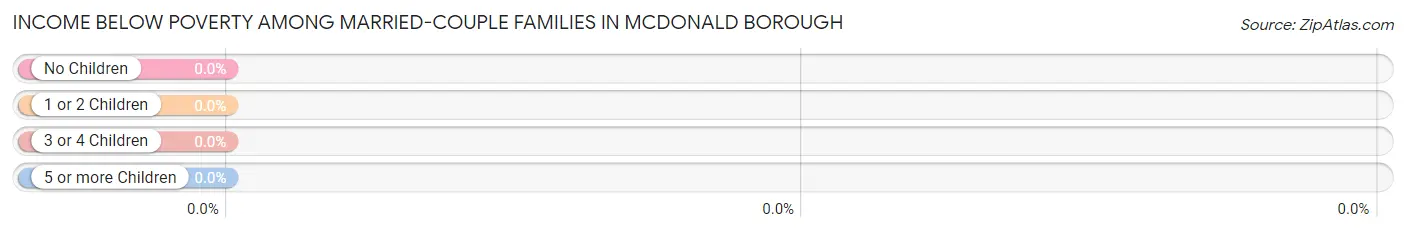
| Children | Above Poverty | Below Poverty |
| No Children | 168 (100.0%) | 0 (0.0%) |
| 1 or 2 Children | 110 (100.0%) | 0 (0.0%) |
| 3 or 4 Children | 25 (100.0%) | 0 (0.0%) |
| 5 or more Children | 0 (0.0%) | 0 (0.0%) |
| Total | 303 (100.0%) | 0 (0.0%) |
Income Below Poverty Among Single-Parent Households in McDonald borough
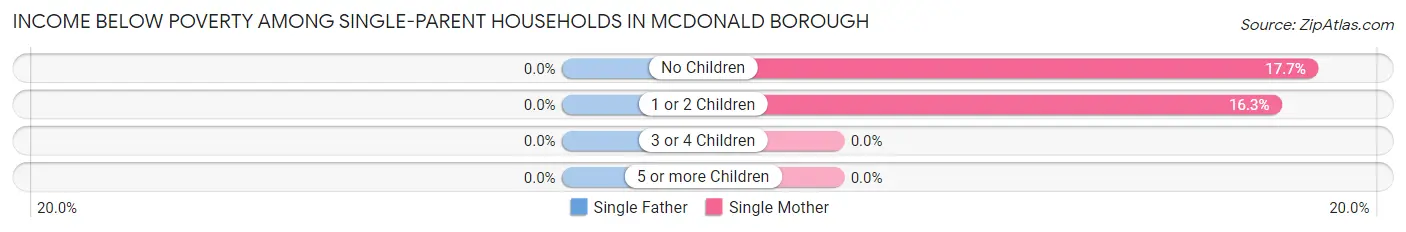
| Children | Single Father | Single Mother |
| No Children | 0 (0.0%) | 6 (17.6%) |
| 1 or 2 Children | 0 (0.0%) | 15 (16.3%) |
| 3 or 4 Children | 0 (0.0%) | 0 (0.0%) |
| 5 or more Children | 0 (0.0%) | 0 (0.0%) |
| Total | 0 (0.0%) | 21 (15.9%) |
Income Below Poverty Among Married-Couple vs Single-Parent Households in McDonald borough
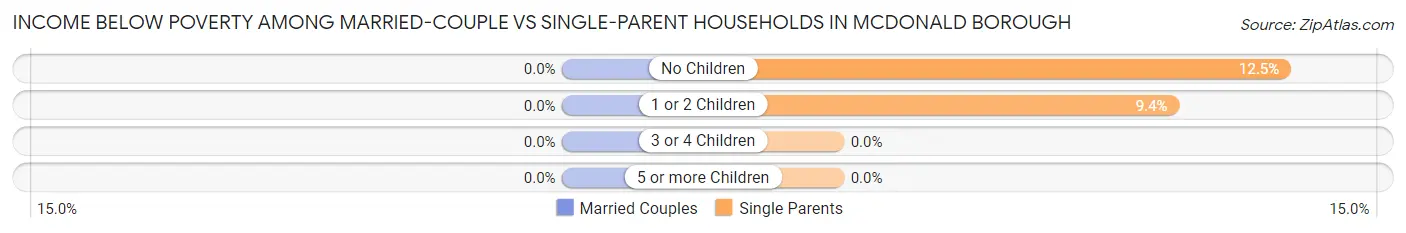
| Children | Married-Couple Families | Single-Parent Households |
| No Children | 0 (0.0%) | 6 (12.5%) |
| 1 or 2 Children | 0 (0.0%) | 15 (9.4%) |
| 3 or 4 Children | 0 (0.0%) | 0 (0.0%) |
| 5 or more Children | 0 (0.0%) | 0 (0.0%) |
| Total | 0 (0.0%) | 21 (9.8%) |
Race in McDonald borough
The most populous races in McDonald borough are White / Caucasian (2,118 | 93.6%), Two or more Races (89 | 3.9%), and Hispanic or Latino (56 | 2.5%).
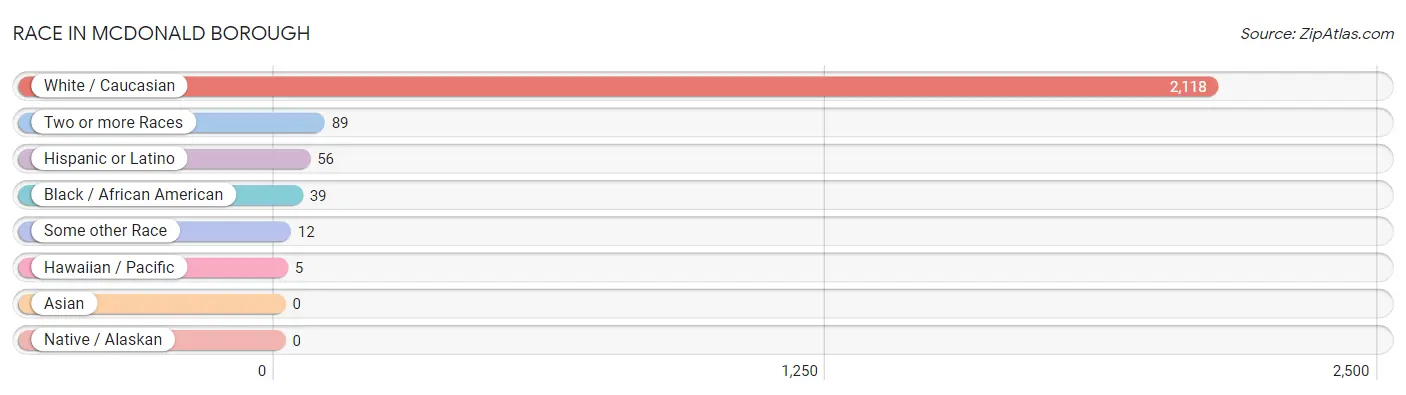
| Race | # Population | % Population |
| Asian | 0 | 0.0% |
| Black / African American | 39 | 1.7% |
| Hawaiian / Pacific | 5 | 0.2% |
| Hispanic or Latino | 56 | 2.5% |
| Native / Alaskan | 0 | 0.0% |
| White / Caucasian | 2,118 | 93.6% |
| Two or more Races | 89 | 3.9% |
| Some other Race | 12 | 0.5% |
| Total | 2,263 | 100.0% |
Ancestry in McDonald borough
The most populous ancestries reported in McDonald borough are German (745 | 32.9%), Irish (401 | 17.7%), English (259 | 11.4%), Italian (255 | 11.3%), and Belgian (137 | 6.0%), together accounting for 79.4% of all McDonald borough residents.
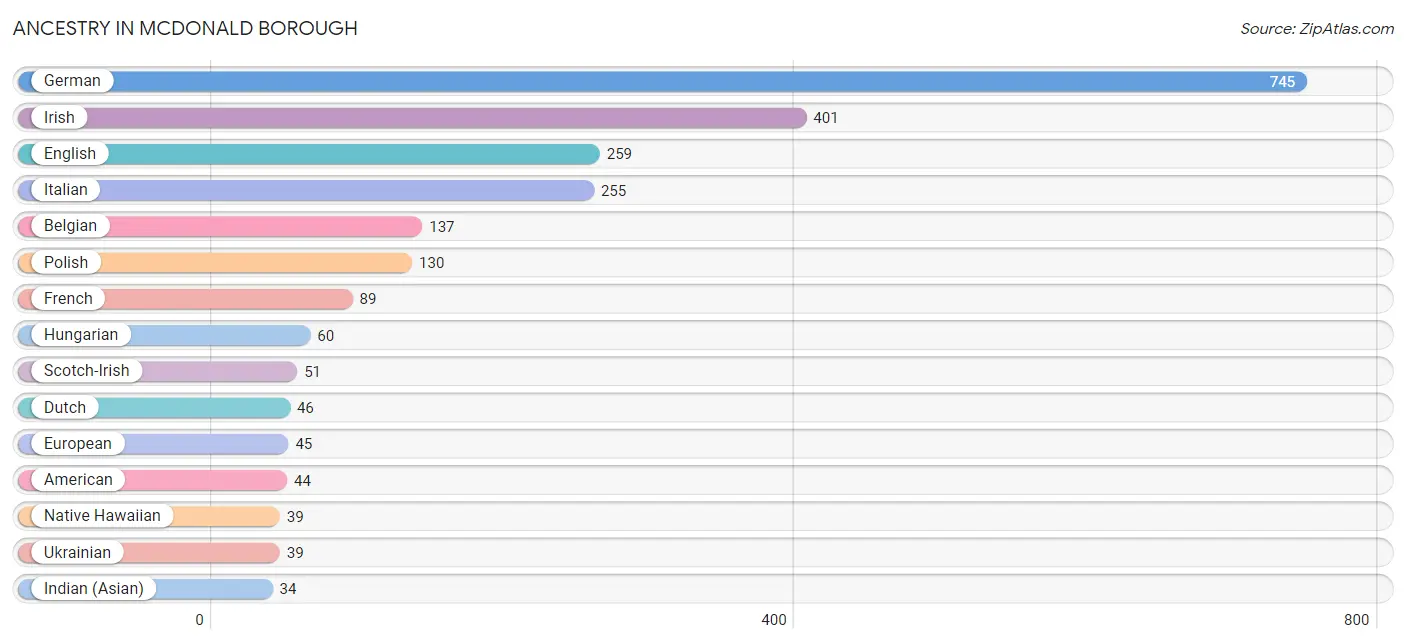
| Ancestry | # Population | % Population |
| American | 44 | 1.9% |
| Arab | 25 | 1.1% |
| Belgian | 137 | 6.0% |
| British | 13 | 0.6% |
| Croatian | 15 | 0.7% |
| Czech | 3 | 0.1% |
| Dutch | 46 | 2.0% |
| English | 259 | 11.4% |
| European | 45 | 2.0% |
| French | 89 | 3.9% |
| German | 745 | 32.9% |
| Hungarian | 60 | 2.6% |
| Indian (Asian) | 34 | 1.5% |
| Irish | 401 | 17.7% |
| Italian | 255 | 11.3% |
| Korean | 34 | 1.5% |
| Lithuanian | 13 | 0.6% |
| Mexican | 25 | 1.1% |
| Native Hawaiian | 39 | 1.7% |
| Polish | 130 | 5.7% |
| Puerto Rican | 31 | 1.4% |
| Romanian | 7 | 0.3% |
| Russian | 19 | 0.8% |
| Scotch-Irish | 51 | 2.2% |
| Scottish | 17 | 0.7% |
| Serbian | 12 | 0.5% |
| Slovak | 13 | 0.6% |
| Swedish | 33 | 1.5% |
| Swiss | 6 | 0.3% |
| Thai | 3 | 0.1% |
| Ukrainian | 39 | 1.7% | View All 31 Rows |
Immigrants in McDonald borough
The most numerous immigrant groups reported in McDonald borough came from Central America (25 | 1.1%), Latin America (25 | 1.1%), Mexico (25 | 1.1%), Eastern Europe (8 | 0.4%), and Europe (8 | 0.4%), together accounting for 4.0% of all McDonald borough residents.
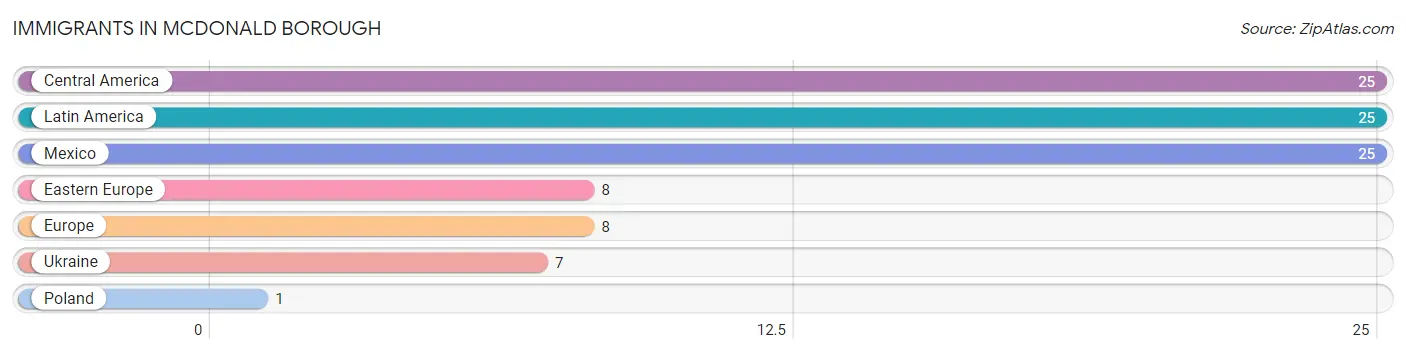
| Immigration Origin | # Population | % Population |
| Central America | 25 | 1.1% |
| Eastern Europe | 8 | 0.4% |
| Europe | 8 | 0.4% |
| Latin America | 25 | 1.1% |
| Mexico | 25 | 1.1% |
| Poland | 1 | 0.0% |
| Ukraine | 7 | 0.3% | View All 7 Rows |
Sex and Age in McDonald borough
Sex and Age in McDonald borough
The most populous age groups in McDonald borough are 20 to 24 Years (109 | 9.5%) for men and 30 to 34 Years (104 | 9.3%) for women.
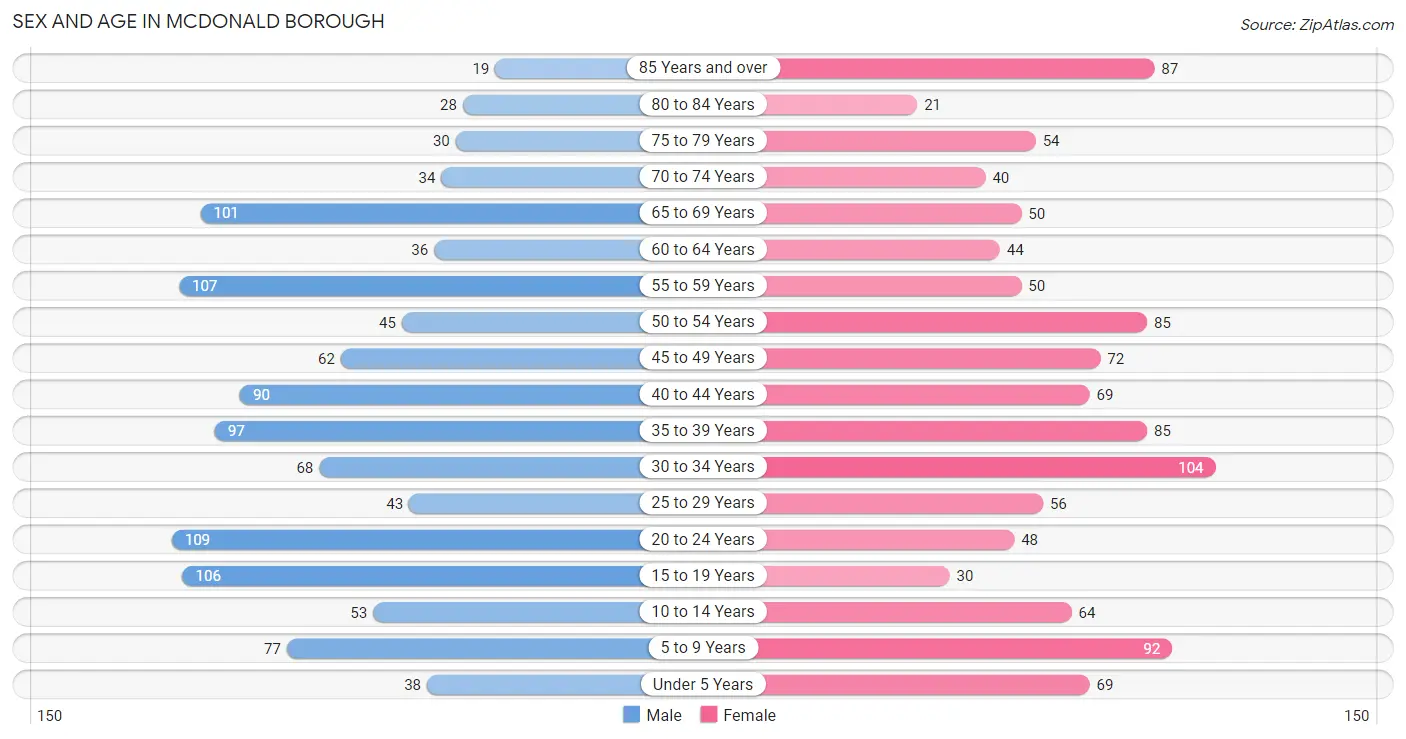
| Age Bracket | Male | Female |
| Under 5 Years | 38 (3.3%) | 69 (6.2%) |
| 5 to 9 Years | 77 (6.7%) | 92 (8.2%) |
| 10 to 14 Years | 53 (4.6%) | 64 (5.7%) |
| 15 to 19 Years | 106 (9.3%) | 30 (2.7%) |
| 20 to 24 Years | 109 (9.5%) | 48 (4.3%) |
| 25 to 29 Years | 43 (3.8%) | 56 (5.0%) |
| 30 to 34 Years | 68 (5.9%) | 104 (9.3%) |
| 35 to 39 Years | 97 (8.5%) | 85 (7.6%) |
| 40 to 44 Years | 90 (7.9%) | 69 (6.2%) |
| 45 to 49 Years | 62 (5.4%) | 72 (6.4%) |
| 50 to 54 Years | 45 (3.9%) | 85 (7.6%) |
| 55 to 59 Years | 107 (9.4%) | 50 (4.5%) |
| 60 to 64 Years | 36 (3.2%) | 44 (3.9%) |
| 65 to 69 Years | 101 (8.8%) | 50 (4.5%) |
| 70 to 74 Years | 34 (3.0%) | 40 (3.6%) |
| 75 to 79 Years | 30 (2.6%) | 54 (4.8%) |
| 80 to 84 Years | 28 (2.5%) | 21 (1.9%) |
| 85 Years and over | 19 (1.7%) | 87 (7.8%) |
| Total | 1,143 (100.0%) | 1,120 (100.0%) |
Families and Households in McDonald borough
Median Family Size in McDonald borough
The median family size in McDonald borough is 3.09 persons per family, with single male/father families (82 | 15.9%) accounting for the largest median family size of 3.44 persons per family. On the other hand, single female/mother families (132 | 25.5%) represent the smallest median family size with 2.55 persons per family.
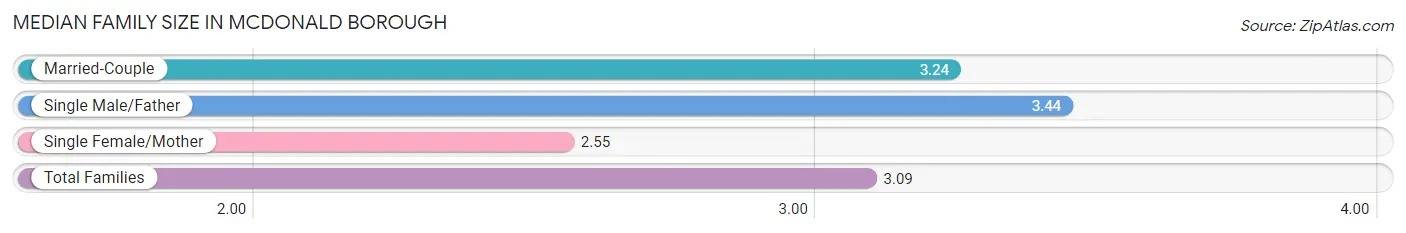
| Family Type | # Families | Family Size |
| Married-Couple | 303 (58.6%) | 3.24 |
| Single Male/Father | 82 (15.9%) | 3.44 |
| Single Female/Mother | 132 (25.5%) | 2.55 |
| Total Families | 517 (100.0%) | 3.09 |
Median Household Size in McDonald borough
The median household size in McDonald borough is 2.20 persons per household, with single male/father households (82 | 8.0%) accounting for the largest median household size of 3.6 persons per household. non-family households (504 | 49.4%) represent the smallest median household size with 1.21 persons per household.
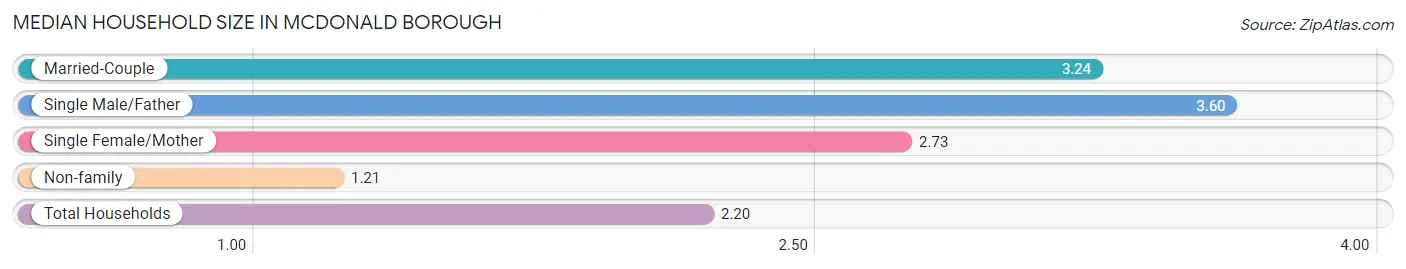
| Household Type | # Households | Household Size |
| Married-Couple | 303 (29.7%) | 3.24 |
| Single Male/Father | 82 (8.0%) | 3.60 |
| Single Female/Mother | 132 (12.9%) | 2.73 |
| Non-family | 504 (49.4%) | 1.21 |
| Total Households | 1,021 (100.0%) | 2.20 |
Household Size by Marriage Status in McDonald borough
Out of a total of 1,021 households in McDonald borough, 517 (50.6%) are family households, while 504 (49.4%) are nonfamily households. The most numerous type of family households are 2-person households, comprising 253, and the most common type of nonfamily households are 1-person households, comprising 406.
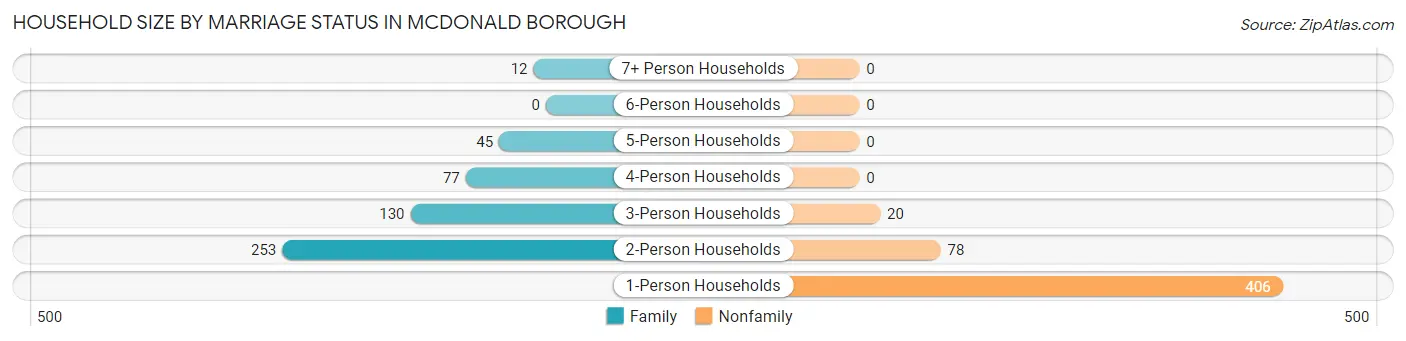
| Household Size | Family Households | Nonfamily Households |
| 1-Person Households | - | 406 (39.8%) |
| 2-Person Households | 253 (24.8%) | 78 (7.6%) |
| 3-Person Households | 130 (12.7%) | 20 (2.0%) |
| 4-Person Households | 77 (7.5%) | 0 (0.0%) |
| 5-Person Households | 45 (4.4%) | 0 (0.0%) |
| 6-Person Households | 0 (0.0%) | 0 (0.0%) |
| 7+ Person Households | 12 (1.2%) | 0 (0.0%) |
| Total | 517 (50.6%) | 504 (49.4%) |
Female Fertility in McDonald borough
Fertility by Age in McDonald borough
Average fertility rate in McDonald borough is 53.0 births per 1,000 women. Women in the age bracket of 20 to 34 years have the highest fertility rate with 101.0 births per 1,000 women. Women in the age bracket of 20 to 34 years acount for 80.8% of all women with births.
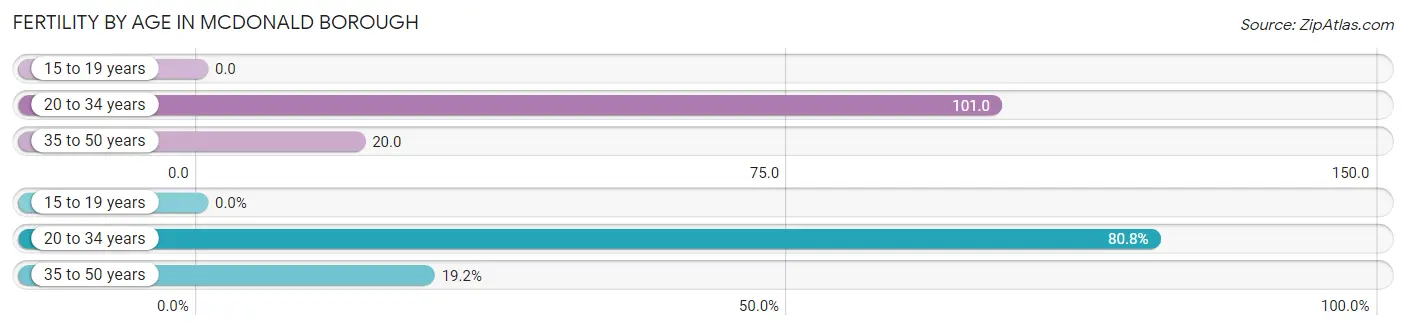
| Age Bracket | Women with Births | Births / 1,000 Women |
| 15 to 19 years | 0 (0.0%) | 0.0 |
| 20 to 34 years | 21 (80.8%) | 101.0 |
| 35 to 50 years | 5 (19.2%) | 20.0 |
| Total | 26 (100.0%) | 53.0 |
Fertility by Age by Marriage Status in McDonald borough
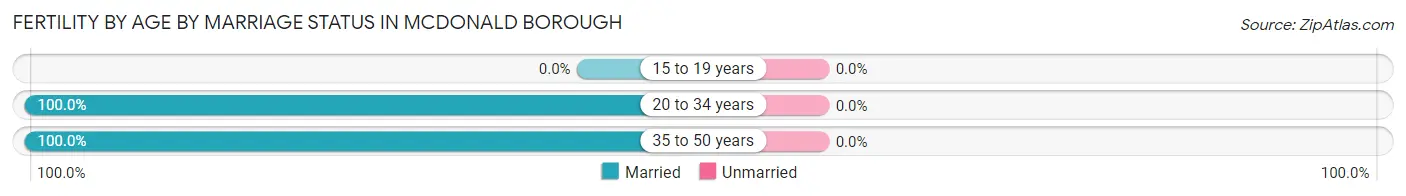
| Age Bracket | Married | Unmarried |
| 15 to 19 years | 0 (0.0%) | 0 (0.0%) |
| 20 to 34 years | 21 (100.0%) | 0 (0.0%) |
| 35 to 50 years | 5 (100.0%) | 0 (0.0%) |
| Total | 26 (100.0%) | 0 (0.0%) |
Fertility by Education in McDonald borough
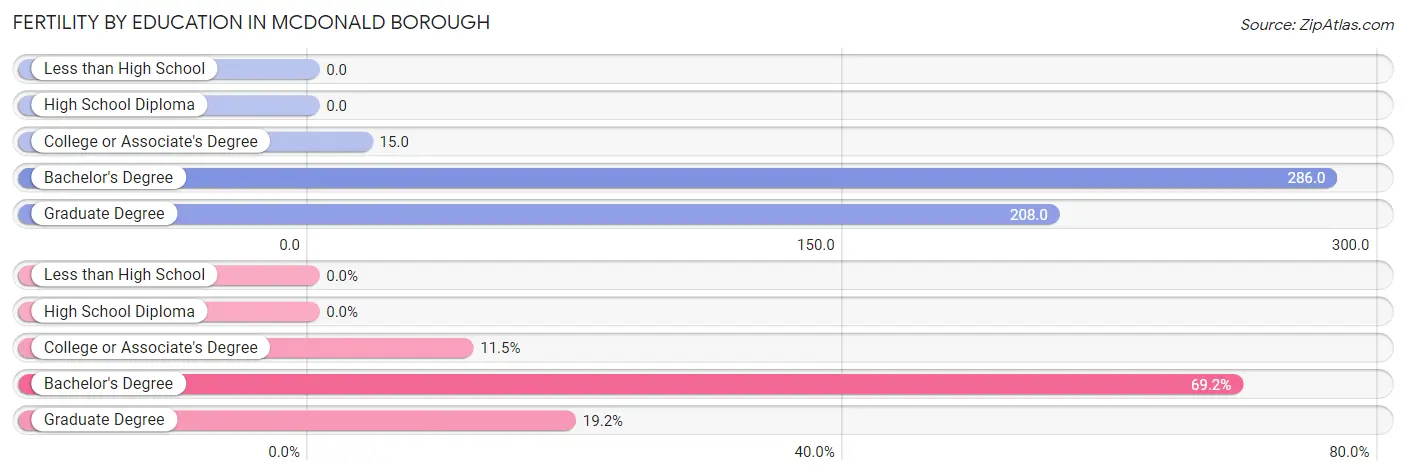
| Educational Attainment | Women with Births | Births / 1,000 Women |
| Less than High School | 0 (0.0%) | 0.0 |
| High School Diploma | 0 (0.0%) | 0.0 |
| College or Associate's Degree | 3 (11.5%) | 15.0 |
| Bachelor's Degree | 18 (69.2%) | 286.0 |
| Graduate Degree | 5 (19.2%) | 208.0 |
| Total | 26 (100.0%) | 53.0 |
Fertility by Education by Marriage Status in McDonald borough
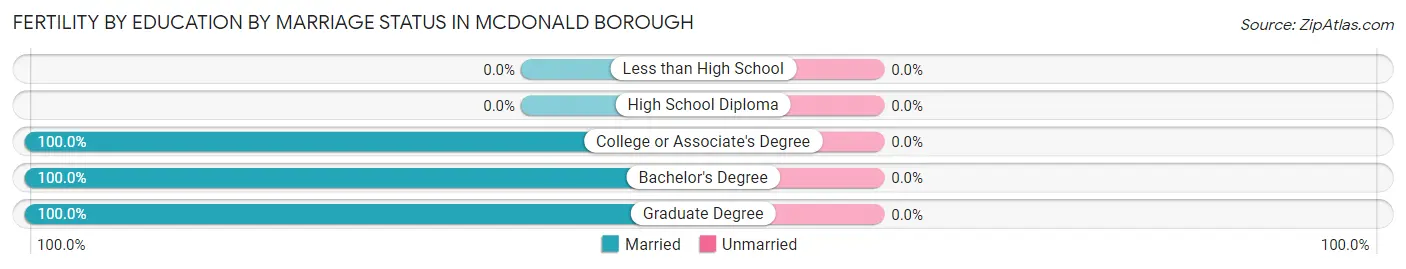
| Educational Attainment | Married | Unmarried |
| Less than High School | 0 (0.0%) | 0 (0.0%) |
| High School Diploma | 0 (0.0%) | 0 (0.0%) |
| College or Associate's Degree | 3 (100.0%) | 0 (0.0%) |
| Bachelor's Degree | 18 (100.0%) | 0 (0.0%) |
| Graduate Degree | 5 (100.0%) | 0 (0.0%) |
| Total | 26 (100.0%) | 0 (0.0%) |
Employment Characteristics in McDonald borough
Employment by Class of Employer in McDonald borough
Among the 1,041 employed individuals in McDonald borough, private company employees (799 | 76.7%), not-for-profit organizations (94 | 9.0%), and local government employees (87 | 8.4%) make up the most common classes of employment.
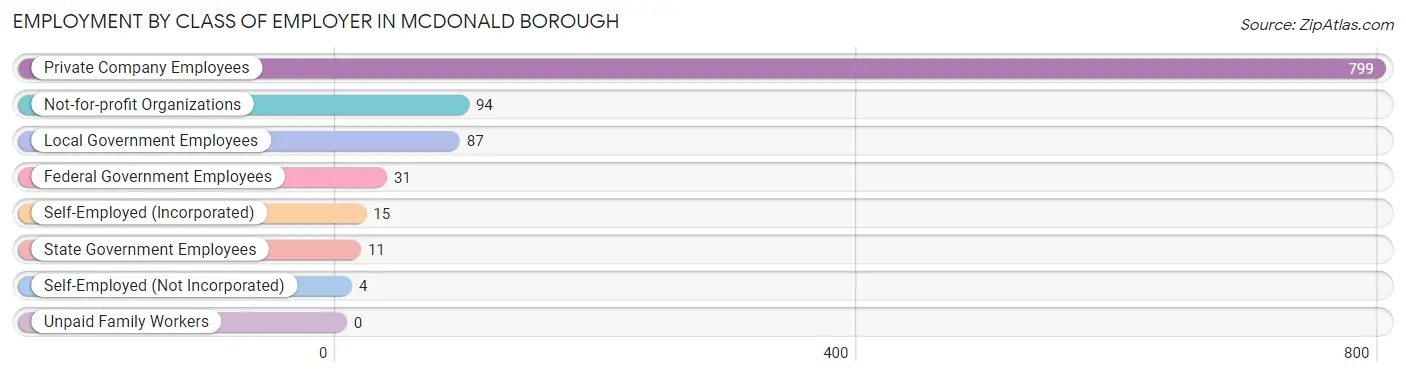
| Employer Class | # Employees | % Employees |
| Private Company Employees | 799 | 76.7% |
| Self-Employed (Incorporated) | 15 | 1.4% |
| Self-Employed (Not Incorporated) | 4 | 0.4% |
| Not-for-profit Organizations | 94 | 9.0% |
| Local Government Employees | 87 | 8.4% |
| State Government Employees | 11 | 1.1% |
| Federal Government Employees | 31 | 3.0% |
| Unpaid Family Workers | 0 | 0.0% |
| Total | 1,041 | 100.0% |
Employment Status by Age in McDonald borough
According to the labor force statistics for McDonald borough, out of the total population over 16 years of age (1,833), 60.1% or 1,102 individuals are in the labor force, with 5.3% or 58 of them unemployed. The age group with the highest labor force participation rate is 20 to 24 years, with 98.7% or 155 individuals in the labor force. Within the labor force, the 16 to 19 years age range has the highest percentage of unemployed individuals, with 36.4% or 4 of them being unemployed.
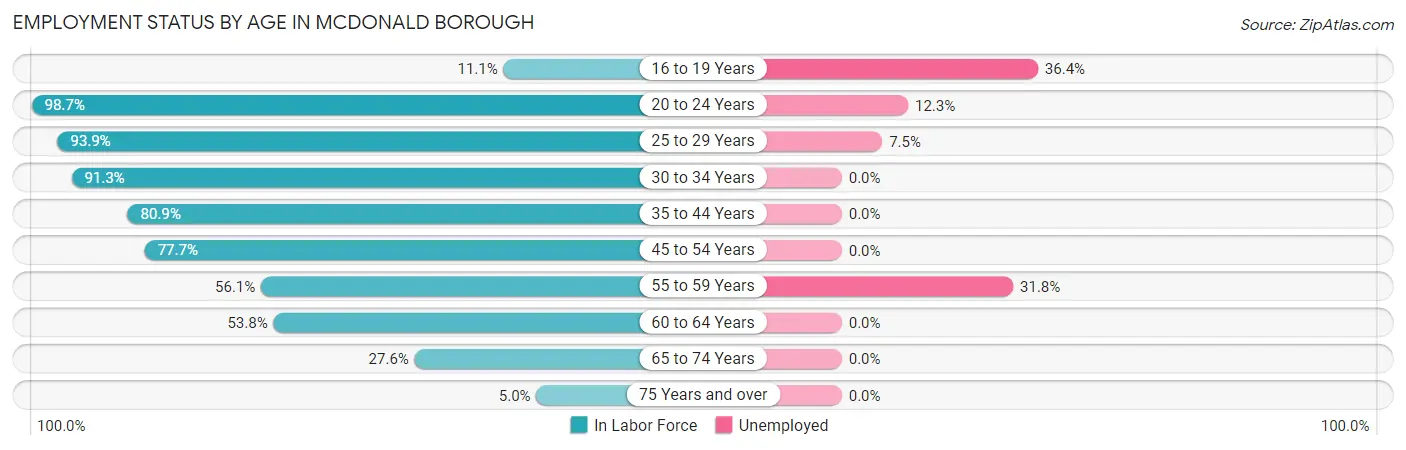
| Age Bracket | In Labor Force | Unemployed |
| 16 to 19 Years | 11 (11.1%) | 4 (36.4%) |
| 20 to 24 Years | 155 (98.7%) | 19 (12.3%) |
| 25 to 29 Years | 93 (93.9%) | 7 (7.5%) |
| 30 to 34 Years | 157 (91.3%) | 0 (0.0%) |
| 35 to 44 Years | 276 (80.9%) | 0 (0.0%) |
| 45 to 54 Years | 205 (77.7%) | 0 (0.0%) |
| 55 to 59 Years | 88 (56.1%) | 28 (31.8%) |
| 60 to 64 Years | 43 (53.8%) | 0 (0.0%) |
| 65 to 74 Years | 62 (27.6%) | 0 (0.0%) |
| 75 Years and over | 12 (5.0%) | 0 (0.0%) |
| Total | 1,102 (60.1%) | 58 (5.3%) |
Employment Status by Educational Attainment in McDonald borough
According to labor force statistics for McDonald borough, 77.4% of individuals (861) out of the total population between 25 and 64 years of age (1,113) are in the labor force, with 4.1% or 35 of them being unemployed. The group with the highest labor force participation rate are those with the educational attainment of bachelor's degree or higher, with 95.1% or 214 individuals in the labor force. Within the labor force, individuals with high school diploma education have the highest percentage of unemployment, with 11.8% or 35 of them being unemployed.
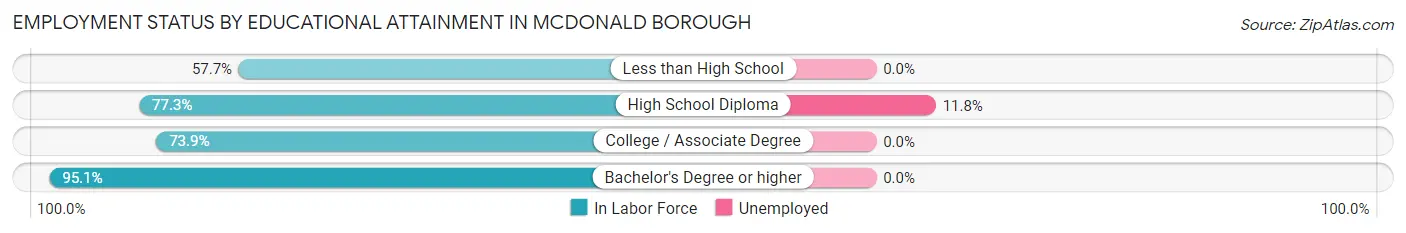
| Educational Attainment | In Labor Force | Unemployed |
| Less than High School | 75 (57.7%) | 0 (0.0%) |
| High School Diploma | 296 (77.3%) | 45 (11.8%) |
| College / Associate Degree | 277 (73.9%) | 0 (0.0%) |
| Bachelor's Degree or higher | 214 (95.1%) | 0 (0.0%) |
| Total | 861 (77.4%) | 46 (4.1%) |
Employment Occupations by Sex in McDonald borough
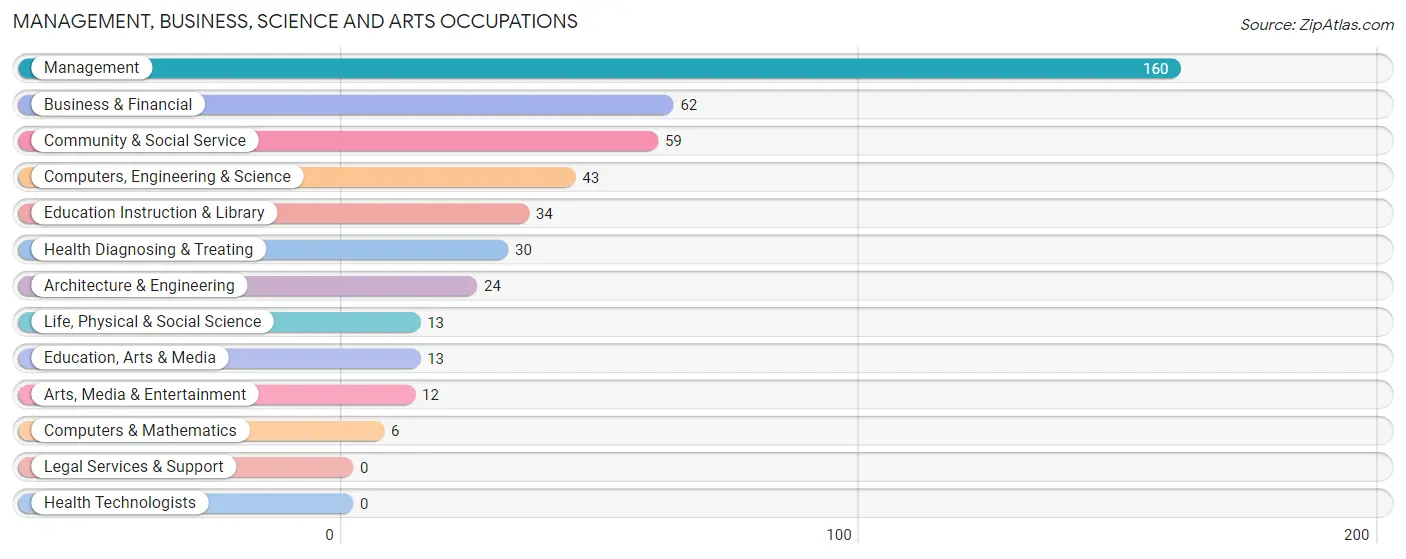
Management, Business, Science and Arts Occupations
The most common Management, Business, Science and Arts occupations in McDonald borough are Management (160 | 15.3%), Business & Financial (62 | 5.9%), Community & Social Service (59 | 5.7%), Computers, Engineering & Science (43 | 4.1%), and Education Instruction & Library (34 | 3.3%).
Management, Business, Science and Arts Occupations by Sex
Within the Management, Business, Science and Arts occupations in McDonald borough, the most male-oriented occupations are Computers & Mathematics (100.0%), Life, Physical & Social Science (100.0%), and Arts, Media & Entertainment (100.0%), while the most female-oriented occupations are Health Diagnosing & Treating (100.0%), Education Instruction & Library (64.7%), and Management (48.7%).
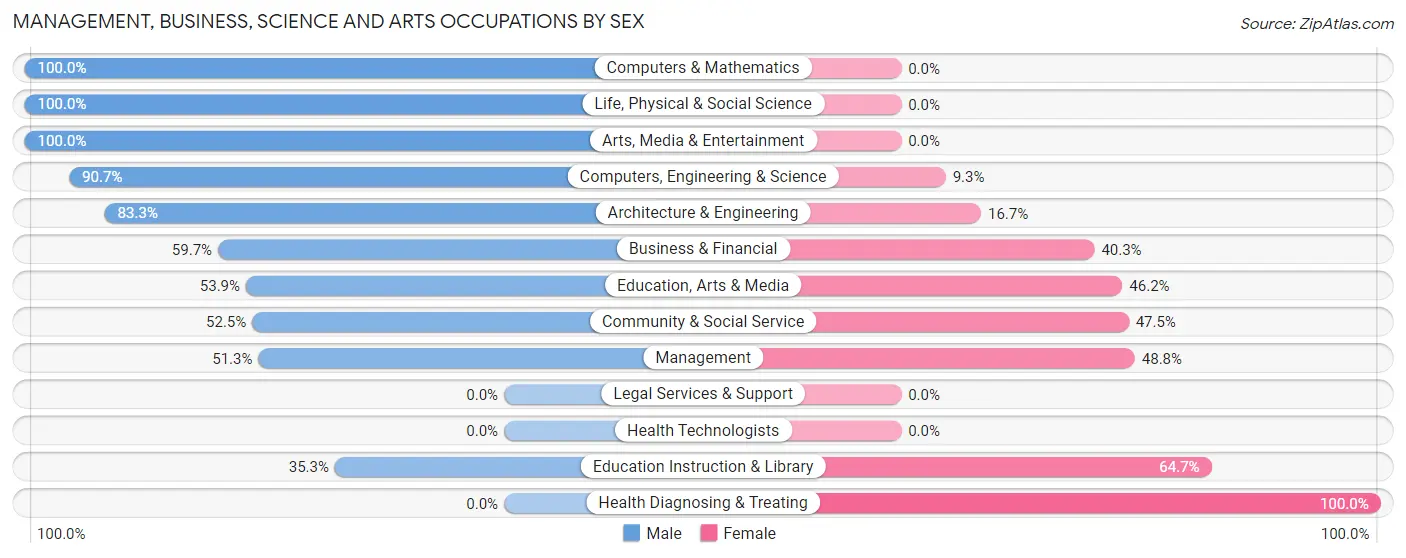
| Occupation | Male | Female |
| Management | 82 (51.2%) | 78 (48.7%) |
| Business & Financial | 37 (59.7%) | 25 (40.3%) |
| Computers, Engineering & Science | 39 (90.7%) | 4 (9.3%) |
| Computers & Mathematics | 6 (100.0%) | 0 (0.0%) |
| Architecture & Engineering | 20 (83.3%) | 4 (16.7%) |
| Life, Physical & Social Science | 13 (100.0%) | 0 (0.0%) |
| Community & Social Service | 31 (52.5%) | 28 (47.5%) |
| Education, Arts & Media | 7 (53.8%) | 6 (46.2%) |
| Legal Services & Support | 0 (0.0%) | 0 (0.0%) |
| Education Instruction & Library | 12 (35.3%) | 22 (64.7%) |
| Arts, Media & Entertainment | 12 (100.0%) | 0 (0.0%) |
| Health Diagnosing & Treating | 0 (0.0%) | 30 (100.0%) |
| Health Technologists | 0 (0.0%) | 0 (0.0%) |
| Total (Category) | 189 (53.4%) | 165 (46.6%) |
| Total (Overall) | 544 (52.1%) | 500 (47.9%) |
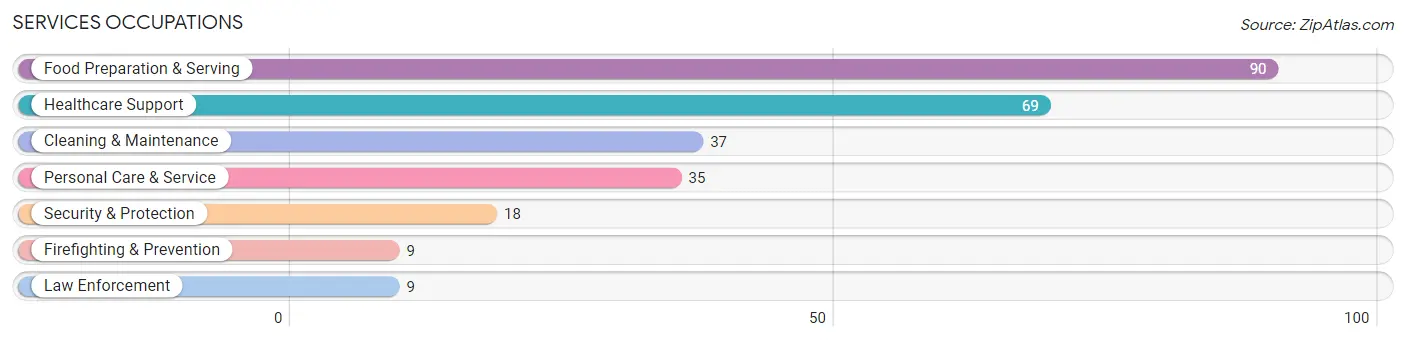
Services Occupations
The most common Services occupations in McDonald borough are Food Preparation & Serving (90 | 8.6%), Healthcare Support (69 | 6.6%), Cleaning & Maintenance (37 | 3.5%), Personal Care & Service (35 | 3.4%), and Security & Protection (18 | 1.7%).
Services Occupations by Sex
Within the Services occupations in McDonald borough, the most male-oriented occupations are Security & Protection (100.0%), Firefighting & Prevention (100.0%), and Law Enforcement (100.0%), while the most female-oriented occupations are Cleaning & Maintenance (100.0%), Healthcare Support (88.4%), and Food Preparation & Serving (74.4%).
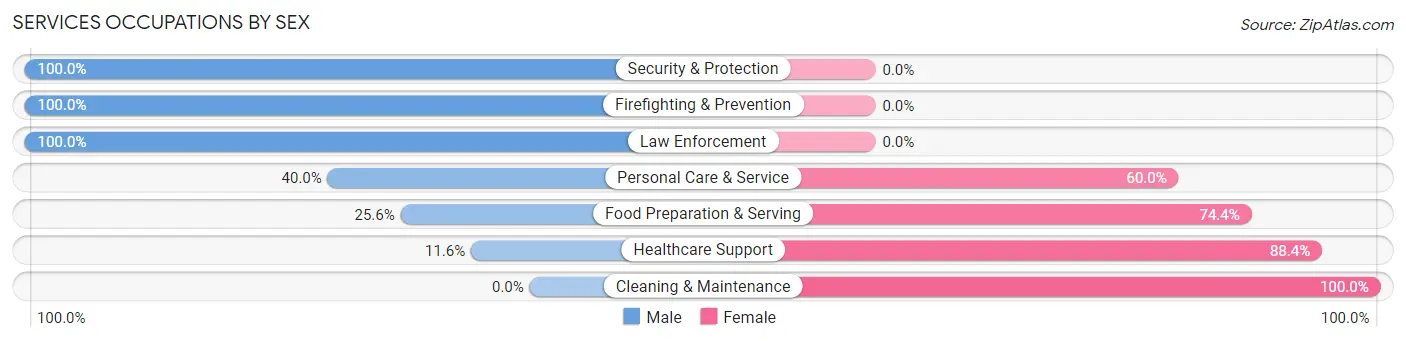
| Occupation | Male | Female |
| Healthcare Support | 8 (11.6%) | 61 (88.4%) |
| Security & Protection | 18 (100.0%) | 0 (0.0%) |
| Firefighting & Prevention | 9 (100.0%) | 0 (0.0%) |
| Law Enforcement | 9 (100.0%) | 0 (0.0%) |
| Food Preparation & Serving | 23 (25.6%) | 67 (74.4%) |
| Cleaning & Maintenance | 0 (0.0%) | 37 (100.0%) |
| Personal Care & Service | 14 (40.0%) | 21 (60.0%) |
| Total (Category) | 63 (25.3%) | 186 (74.7%) |
| Total (Overall) | 544 (52.1%) | 500 (47.9%) |
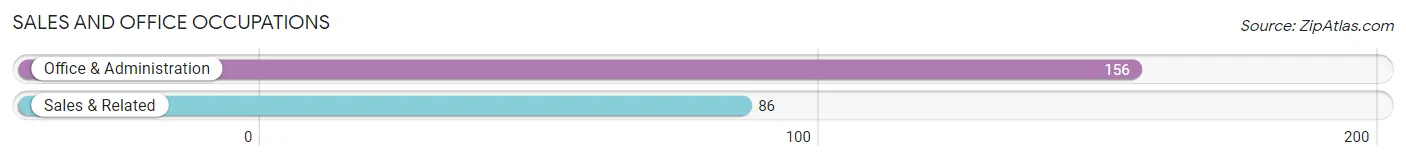
Sales and Office Occupations
The most common Sales and Office occupations in McDonald borough are Office & Administration (156 | 14.9%), and Sales & Related (86 | 8.2%).
Sales and Office Occupations by Sex
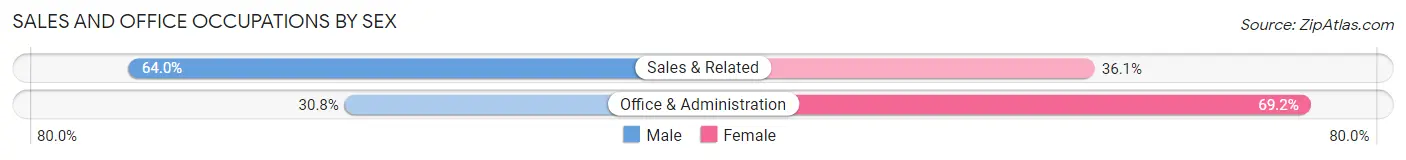
| Occupation | Male | Female |
| Sales & Related | 55 (63.9%) | 31 (36.0%) |
| Office & Administration | 48 (30.8%) | 108 (69.2%) |
| Total (Category) | 103 (42.6%) | 139 (57.4%) |
| Total (Overall) | 544 (52.1%) | 500 (47.9%) |
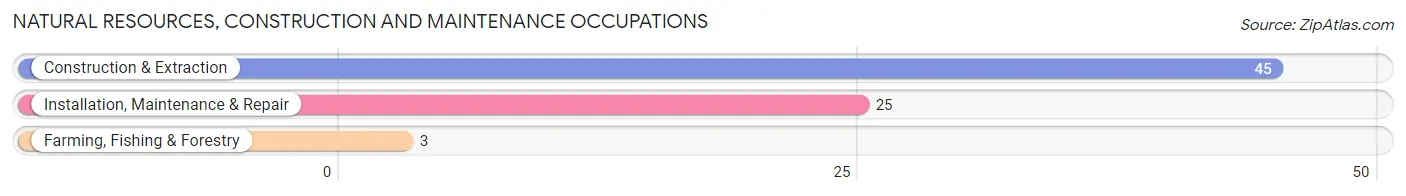
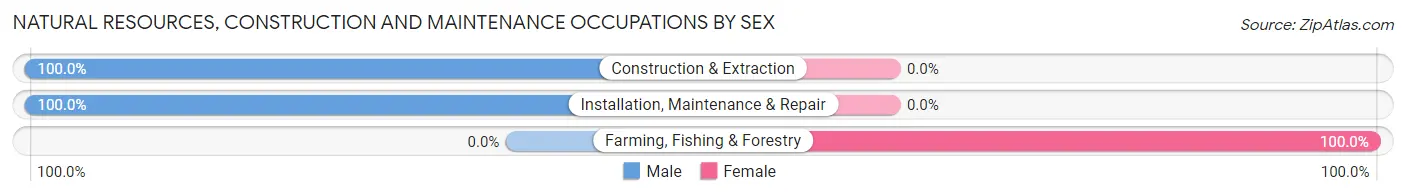
Natural Resources, Construction and Maintenance Occupations
The most common Natural Resources, Construction and Maintenance occupations in McDonald borough are Construction & Extraction (45 | 4.3%), Installation, Maintenance & Repair (25 | 2.4%), and Farming, Fishing & Forestry (3 | 0.3%).
Natural Resources, Construction and Maintenance Occupations by Sex
| Occupation | Male | Female |
| Farming, Fishing & Forestry | 0 (0.0%) | 3 (100.0%) |
| Construction & Extraction | 45 (100.0%) | 0 (0.0%) |
| Installation, Maintenance & Repair | 25 (100.0%) | 0 (0.0%) |
| Total (Category) | 70 (95.9%) | 3 (4.1%) |
| Total (Overall) | 544 (52.1%) | 500 (47.9%) |
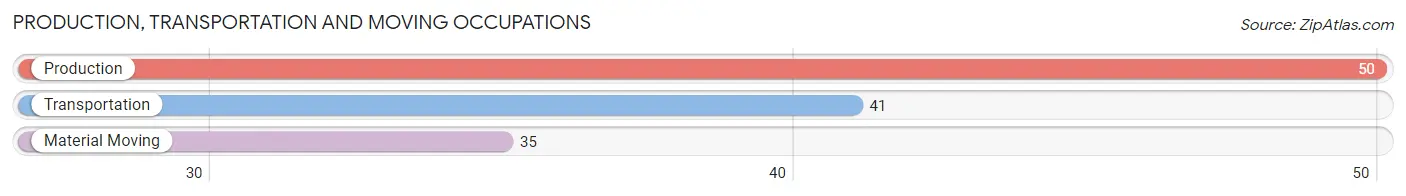
Production, Transportation and Moving Occupations
The most common Production, Transportation and Moving occupations in McDonald borough are Production (50 | 4.8%), Transportation (41 | 3.9%), and Material Moving (35 | 3.4%).
Production, Transportation and Moving Occupations by Sex
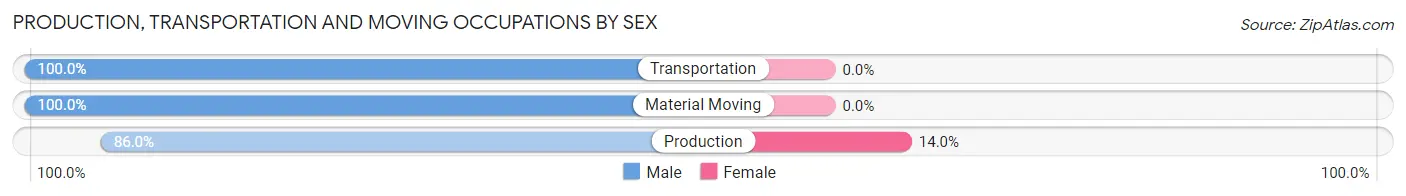
| Occupation | Male | Female |
| Production | 43 (86.0%) | 7 (14.0%) |
| Transportation | 41 (100.0%) | 0 (0.0%) |
| Material Moving | 35 (100.0%) | 0 (0.0%) |
| Total (Category) | 119 (94.4%) | 7 (5.6%) |
| Total (Overall) | 544 (52.1%) | 500 (47.9%) |
Employment Industries by Sex in McDonald borough
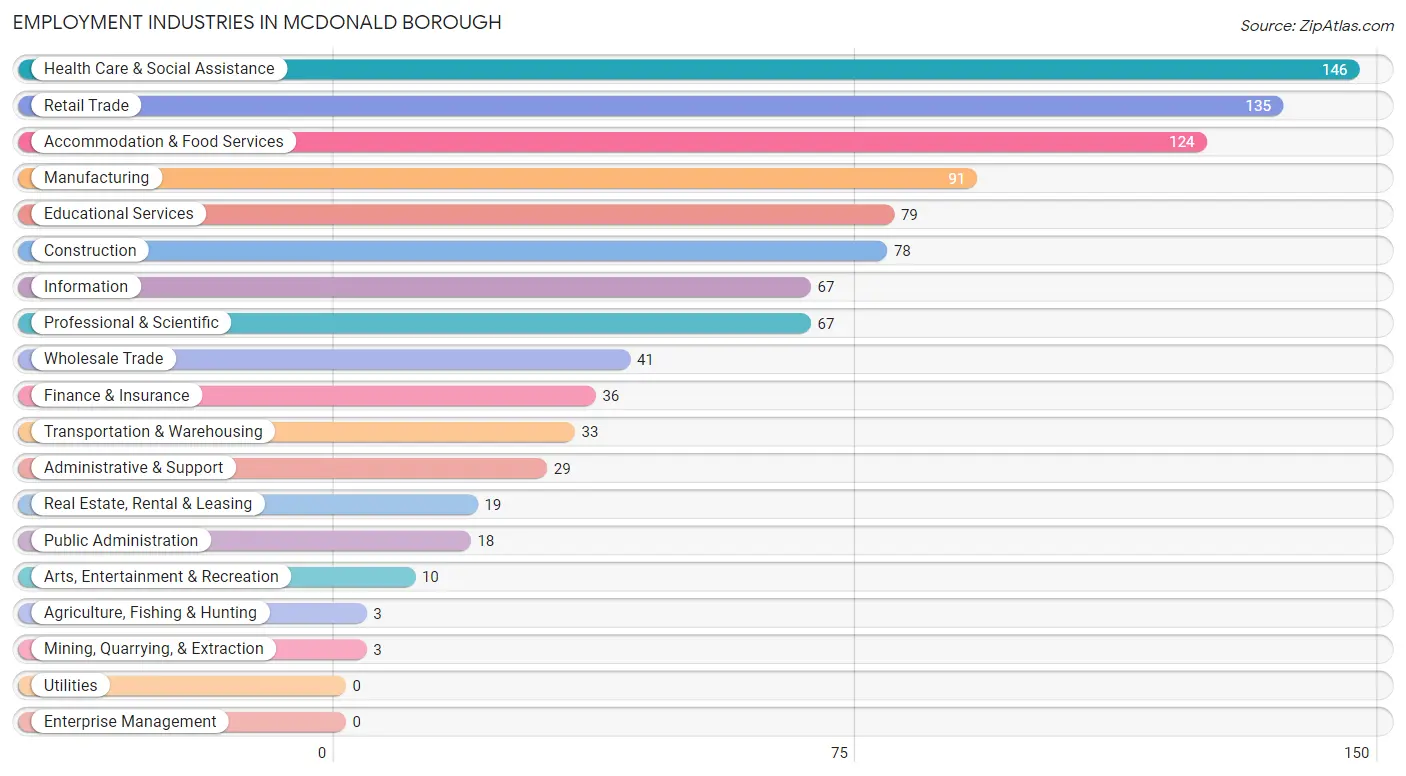
Employment Industries in McDonald borough
The major employment industries in McDonald borough include Health Care & Social Assistance (146 | 14.0%), Retail Trade (135 | 12.9%), Accommodation & Food Services (124 | 11.9%), Manufacturing (91 | 8.7%), and Educational Services (79 | 7.6%).
Employment Industries by Sex in McDonald borough
The McDonald borough industries that see more men than women are Wholesale Trade (100.0%), Arts, Entertainment & Recreation (100.0%), and Construction (89.7%), whereas the industries that tend to have a higher number of women are Agriculture, Fishing & Hunting (100.0%), Mining, Quarrying, & Extraction (100.0%), and Educational Services (91.1%).
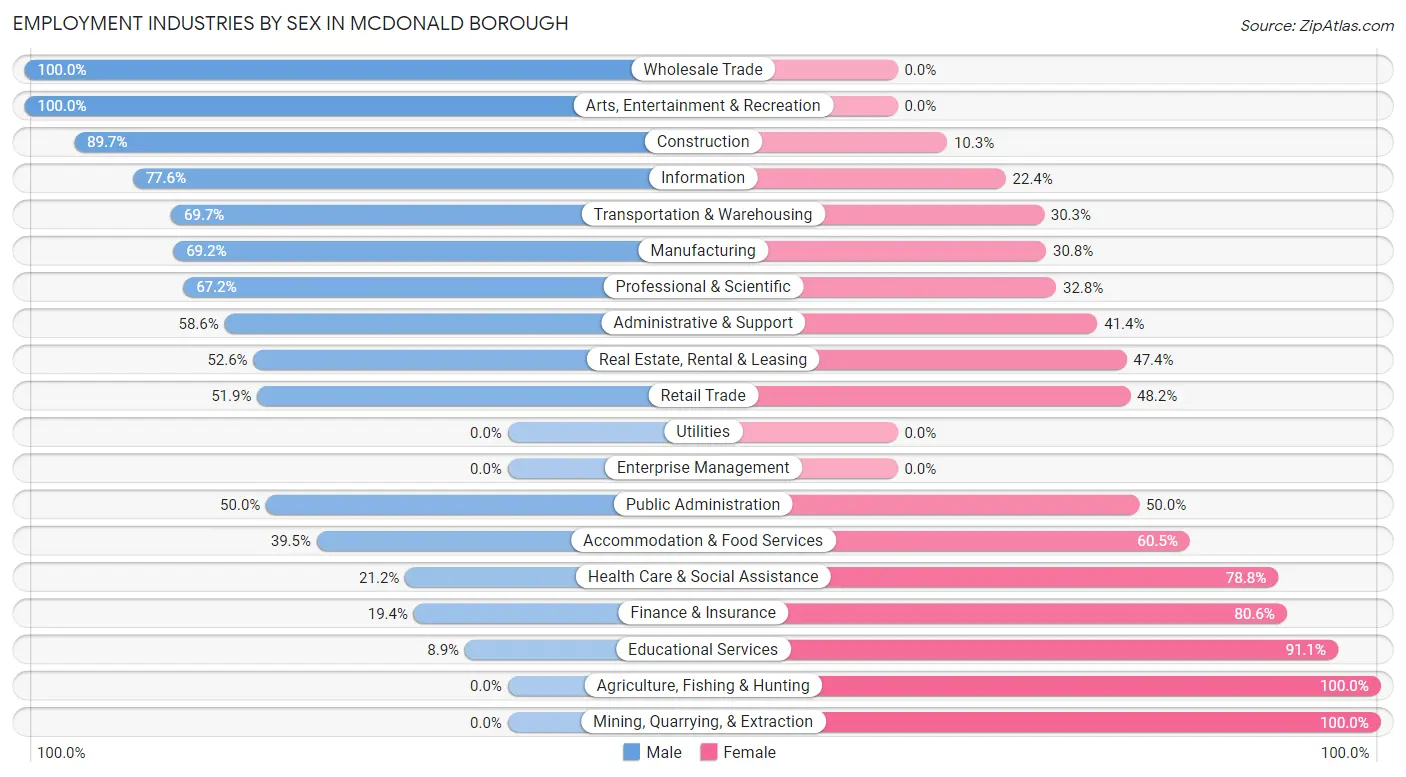
| Industry | Male | Female |
| Agriculture, Fishing & Hunting | 0 (0.0%) | 3 (100.0%) |
| Mining, Quarrying, & Extraction | 0 (0.0%) | 3 (100.0%) |
| Construction | 70 (89.7%) | 8 (10.3%) |
| Manufacturing | 63 (69.2%) | 28 (30.8%) |
| Wholesale Trade | 41 (100.0%) | 0 (0.0%) |
| Retail Trade | 70 (51.8%) | 65 (48.1%) |
| Transportation & Warehousing | 23 (69.7%) | 10 (30.3%) |
| Utilities | 0 (0.0%) | 0 (0.0%) |
| Information | 52 (77.6%) | 15 (22.4%) |
| Finance & Insurance | 7 (19.4%) | 29 (80.6%) |
| Real Estate, Rental & Leasing | 10 (52.6%) | 9 (47.4%) |
| Professional & Scientific | 45 (67.2%) | 22 (32.8%) |
| Enterprise Management | 0 (0.0%) | 0 (0.0%) |
| Administrative & Support | 17 (58.6%) | 12 (41.4%) |
| Educational Services | 7 (8.9%) | 72 (91.1%) |
| Health Care & Social Assistance | 31 (21.2%) | 115 (78.8%) |
| Arts, Entertainment & Recreation | 10 (100.0%) | 0 (0.0%) |
| Accommodation & Food Services | 49 (39.5%) | 75 (60.5%) |
| Public Administration | 9 (50.0%) | 9 (50.0%) |
| Total | 544 (52.1%) | 500 (47.9%) |
Education in McDonald borough
School Enrollment in McDonald borough
The most common levels of schooling among the 481 students in McDonald borough are elementary school (143 | 29.7%), middle school (130 | 27.0%), and high school (121 | 25.2%).
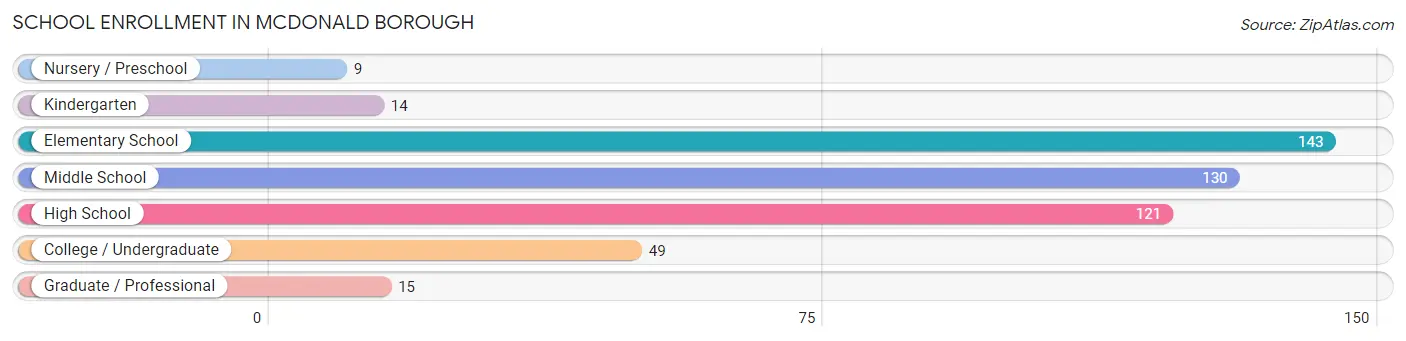
| School Level | # Students | % Students |
| Nursery / Preschool | 9 | 1.9% |
| Kindergarten | 14 | 2.9% |
| Elementary School | 143 | 29.7% |
| Middle School | 130 | 27.0% |
| High School | 121 | 25.2% |
| College / Undergraduate | 49 | 10.2% |
| Graduate / Professional | 15 | 3.1% |
| Total | 481 | 100.0% |
School Enrollment by Age by Funding Source in McDonald borough
Out of a total of 481 students who are enrolled in schools in McDonald borough, 45 (9.4%) attend a private institution, while the remaining 436 (90.6%) are enrolled in public schools. The age group of 25 to 34 year olds has the highest likelihood of being enrolled in private schools, with 9 (100.0% in the age bracket) enrolled. Conversely, the age group of 15 to 17 year olds has the lowest likelihood of being enrolled in a private school, with 108 (100.0% in the age bracket) attending a public institution.
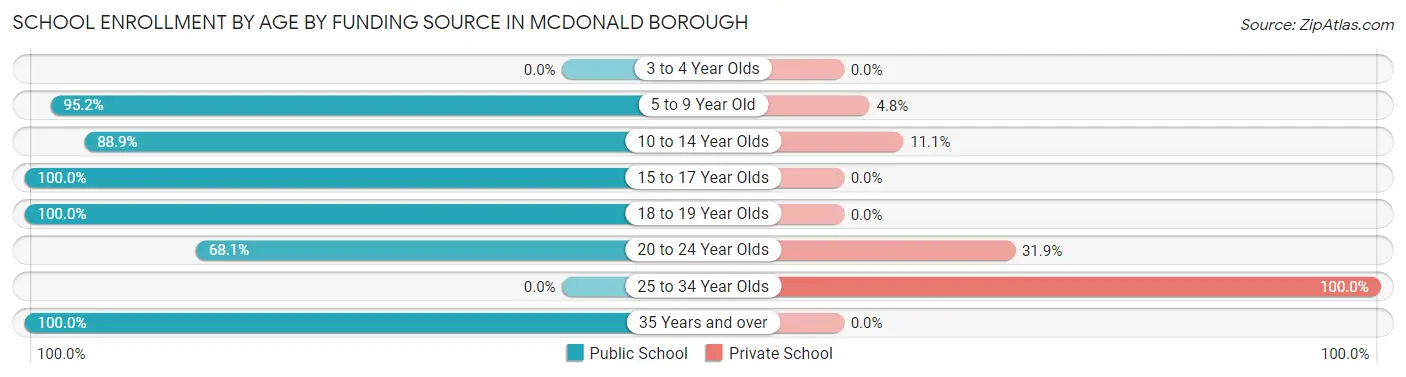
| Age Bracket | Public School | Private School |
| 3 to 4 Year Olds | 0 (0.0%) | 0 (0.0%) |
| 5 to 9 Year Old | 158 (95.2%) | 8 (4.8%) |
| 10 to 14 Year Olds | 104 (88.9%) | 13 (11.1%) |
| 15 to 17 Year Olds | 108 (100.0%) | 0 (0.0%) |
| 18 to 19 Year Olds | 26 (100.0%) | 0 (0.0%) |
| 20 to 24 Year Olds | 32 (68.1%) | 15 (31.9%) |
| 25 to 34 Year Olds | 0 (0.0%) | 9 (100.0%) |
| 35 Years and over | 8 (100.0%) | 0 (0.0%) |
| Total | 436 (90.6%) | 45 (9.4%) |
Educational Attainment by Field of Study in McDonald borough
Education (84 | 27.6%), science & technology (49 | 16.1%), physical & health sciences (46 | 15.1%), business (35 | 11.5%), and liberal arts & history (20 | 6.6%) are the most common fields of study among 304 individuals in McDonald borough who have obtained a bachelor's degree or higher.
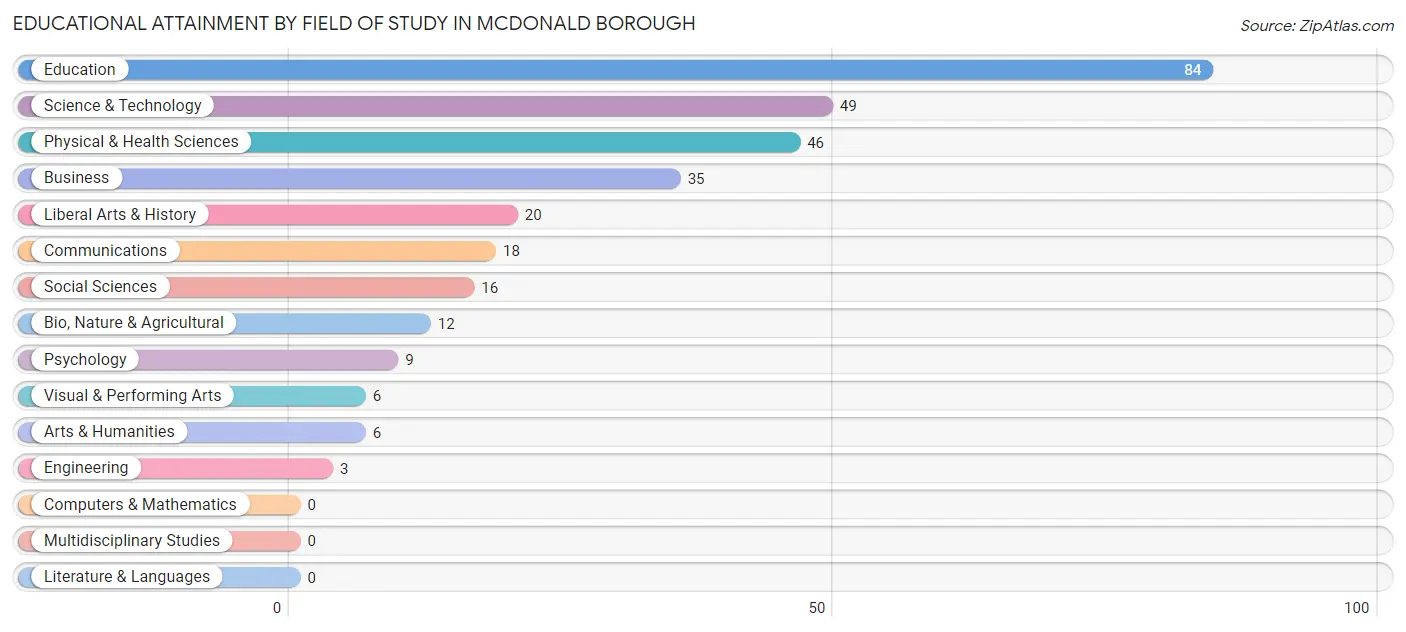
| Field of Study | # Graduates | % Graduates |
| Computers & Mathematics | 0 | 0.0% |
| Bio, Nature & Agricultural | 12 | 4.0% |
| Physical & Health Sciences | 46 | 15.1% |
| Psychology | 9 | 3.0% |
| Social Sciences | 16 | 5.3% |
| Engineering | 3 | 1.0% |
| Multidisciplinary Studies | 0 | 0.0% |
| Science & Technology | 49 | 16.1% |
| Business | 35 | 11.5% |
| Education | 84 | 27.6% |
| Literature & Languages | 0 | 0.0% |
| Liberal Arts & History | 20 | 6.6% |
| Visual & Performing Arts | 6 | 2.0% |
| Communications | 18 | 5.9% |
| Arts & Humanities | 6 | 2.0% |
| Total | 304 | 100.0% |
Transportation & Commute in McDonald borough
Vehicle Availability by Sex in McDonald borough
The most prevalent vehicle ownership categories in McDonald borough are males with 2 vehicles (205, accounting for 37.9%) and females with 2 vehicles (164, making up 41.2%).
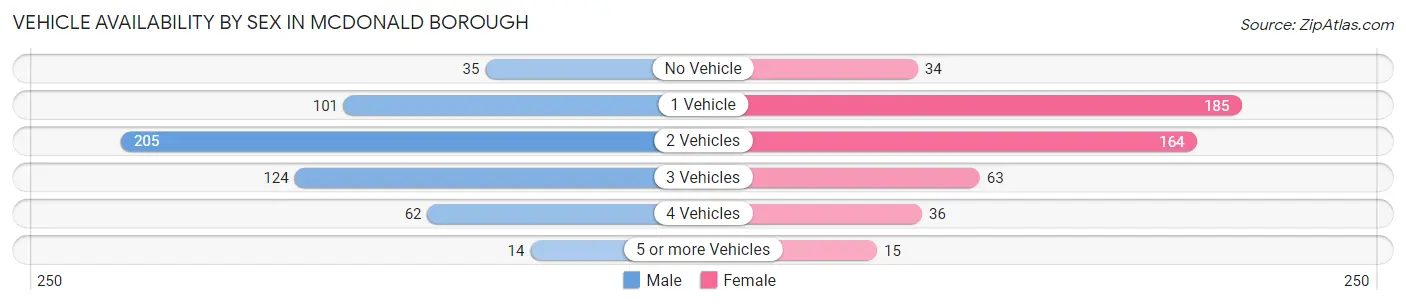
| Vehicles Available | Male | Female |
| No Vehicle | 35 (6.5%) | 34 (6.8%) |
| 1 Vehicle | 101 (18.7%) | 185 (37.2%) |
| 2 Vehicles | 205 (37.9%) | 164 (33.0%) |
| 3 Vehicles | 124 (22.9%) | 63 (12.7%) |
| 4 Vehicles | 62 (11.5%) | 36 (7.2%) |
| 5 or more Vehicles | 14 (2.6%) | 15 (3.0%) |
| Total | 541 (100.0%) | 497 (100.0%) |
Commute Time in McDonald borough
The most frequently occuring commute durations in McDonald borough are 20 to 24 minutes (193 commuters, 19.8%), 30 to 34 minutes (188 commuters, 19.3%), and 15 to 19 minutes (116 commuters, 11.9%).
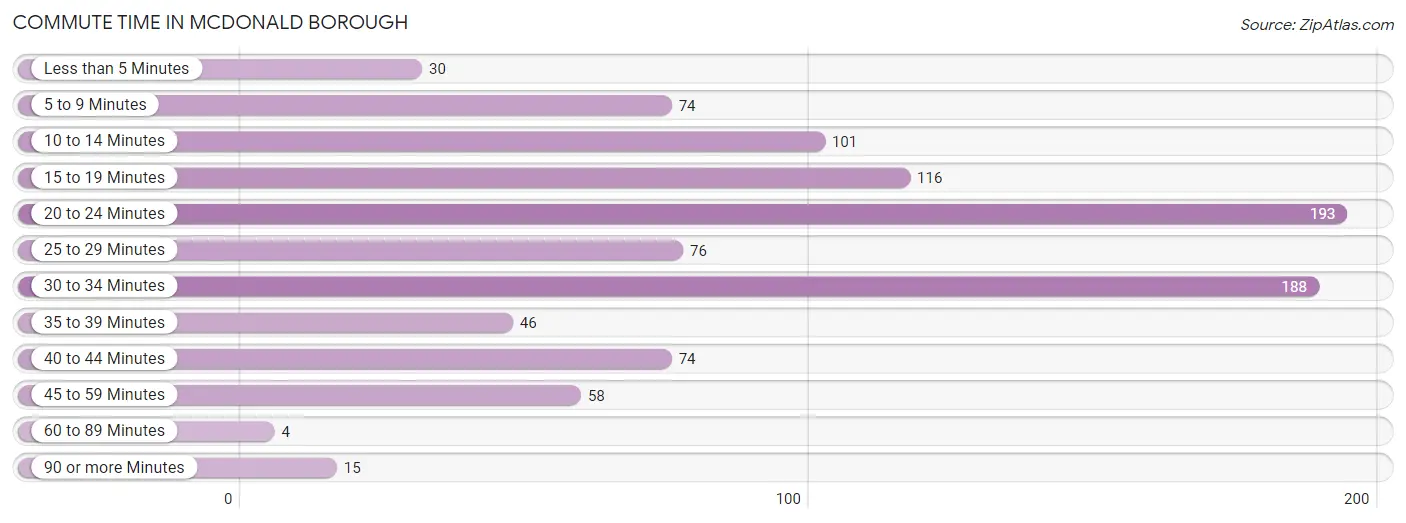
| Commute Time | # Commuters | % Commuters |
| Less than 5 Minutes | 30 | 3.1% |
| 5 to 9 Minutes | 74 | 7.6% |
| 10 to 14 Minutes | 101 | 10.4% |
| 15 to 19 Minutes | 116 | 11.9% |
| 20 to 24 Minutes | 193 | 19.8% |
| 25 to 29 Minutes | 76 | 7.8% |
| 30 to 34 Minutes | 188 | 19.3% |
| 35 to 39 Minutes | 46 | 4.7% |
| 40 to 44 Minutes | 74 | 7.6% |
| 45 to 59 Minutes | 58 | 5.9% |
| 60 to 89 Minutes | 4 | 0.4% |
| 90 or more Minutes | 15 | 1.5% |
Commute Time by Sex in McDonald borough
The most common commute times in McDonald borough are 30 to 34 minutes (137 commuters, 26.3%) for males and 20 to 24 minutes (101 commuters, 22.3%) for females.
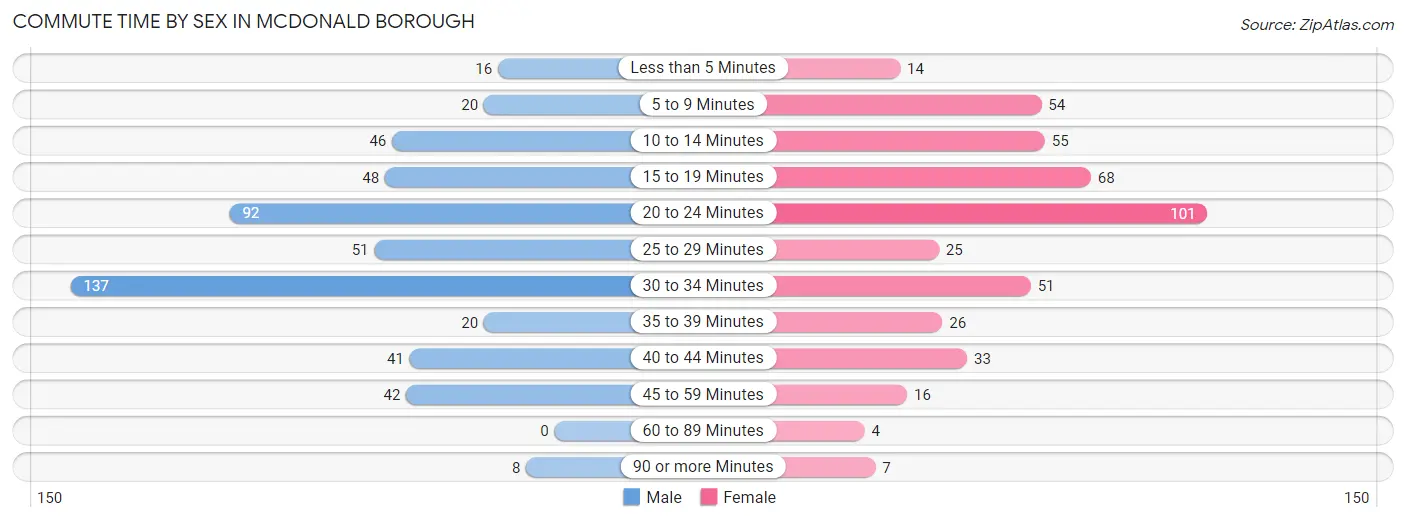
| Commute Time | Male | Female |
| Less than 5 Minutes | 16 (3.1%) | 14 (3.1%) |
| 5 to 9 Minutes | 20 (3.8%) | 54 (11.9%) |
| 10 to 14 Minutes | 46 (8.8%) | 55 (12.1%) |
| 15 to 19 Minutes | 48 (9.2%) | 68 (15.0%) |
| 20 to 24 Minutes | 92 (17.7%) | 101 (22.3%) |
| 25 to 29 Minutes | 51 (9.8%) | 25 (5.5%) |
| 30 to 34 Minutes | 137 (26.3%) | 51 (11.2%) |
| 35 to 39 Minutes | 20 (3.8%) | 26 (5.7%) |
| 40 to 44 Minutes | 41 (7.9%) | 33 (7.3%) |
| 45 to 59 Minutes | 42 (8.1%) | 16 (3.5%) |
| 60 to 89 Minutes | 0 (0.0%) | 4 (0.9%) |
| 90 or more Minutes | 8 (1.5%) | 7 (1.5%) |
Time of Departure to Work by Sex in McDonald borough
The most frequent times of departure to work in McDonald borough are 6:30 AM to 6:59 AM (92, 17.7%) for males and 8:00 AM to 8:29 AM (78, 17.2%) for females.
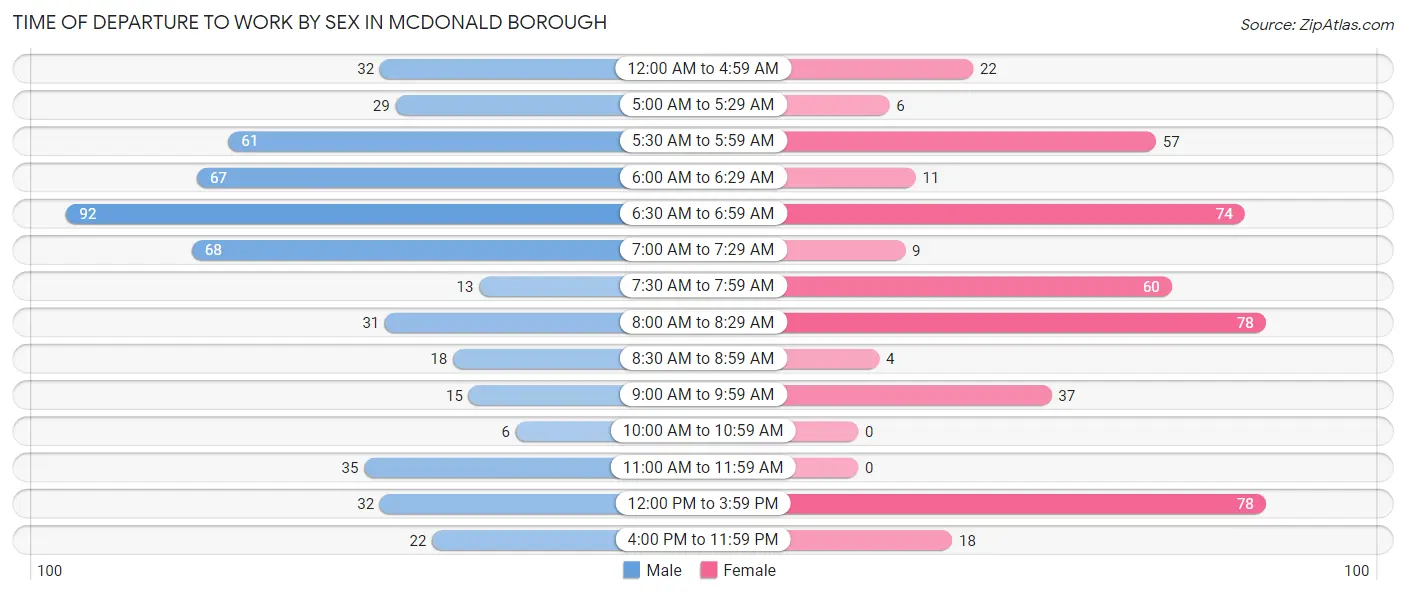
| Time of Departure | Male | Female |
| 12:00 AM to 4:59 AM | 32 (6.1%) | 22 (4.9%) |
| 5:00 AM to 5:29 AM | 29 (5.6%) | 6 (1.3%) |
| 5:30 AM to 5:59 AM | 61 (11.7%) | 57 (12.6%) |
| 6:00 AM to 6:29 AM | 67 (12.9%) | 11 (2.4%) |
| 6:30 AM to 6:59 AM | 92 (17.7%) | 74 (16.3%) |
| 7:00 AM to 7:29 AM | 68 (13.1%) | 9 (2.0%) |
| 7:30 AM to 7:59 AM | 13 (2.5%) | 60 (13.2%) |
| 8:00 AM to 8:29 AM | 31 (5.9%) | 78 (17.2%) |
| 8:30 AM to 8:59 AM | 18 (3.5%) | 4 (0.9%) |
| 9:00 AM to 9:59 AM | 15 (2.9%) | 37 (8.2%) |
| 10:00 AM to 10:59 AM | 6 (1.1%) | 0 (0.0%) |
| 11:00 AM to 11:59 AM | 35 (6.7%) | 0 (0.0%) |
| 12:00 PM to 3:59 PM | 32 (6.1%) | 78 (17.2%) |
| 4:00 PM to 11:59 PM | 22 (4.2%) | 18 (4.0%) |
| Total | 521 (100.0%) | 454 (100.0%) |
Housing Occupancy in McDonald borough
Occupancy by Ownership in McDonald borough
Of the total 1,021 dwellings in McDonald borough, owner-occupied units account for 614 (60.1%), while renter-occupied units make up 407 (39.9%).
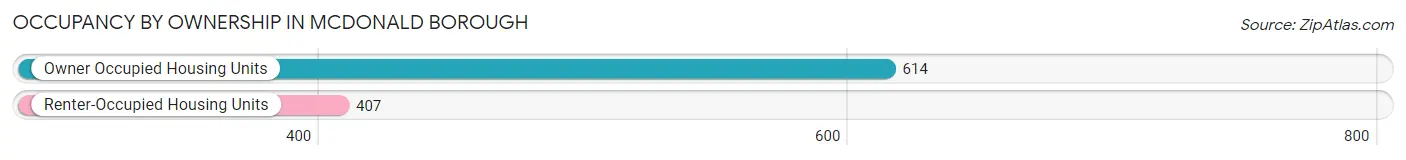
| Occupancy | # Housing Units | % Housing Units |
| Owner Occupied Housing Units | 614 | 60.1% |
| Renter-Occupied Housing Units | 407 | 39.9% |
| Total Occupied Housing Units | 1,021 | 100.0% |
Occupancy by Household Size in McDonald borough
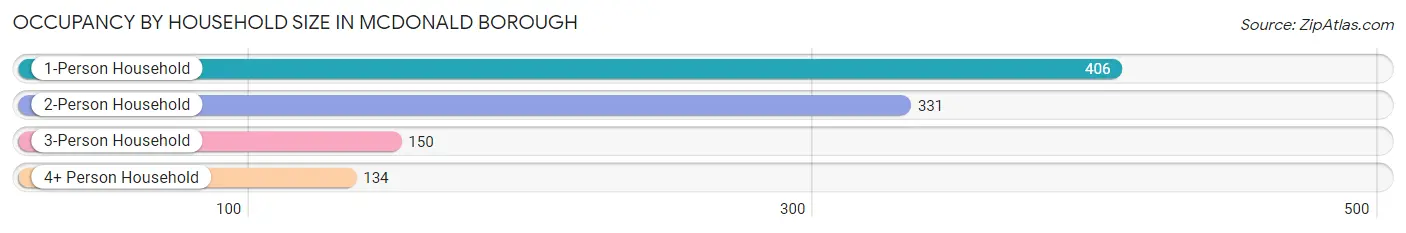
| Household Size | # Housing Units | % Housing Units |
| 1-Person Household | 406 | 39.8% |
| 2-Person Household | 331 | 32.4% |
| 3-Person Household | 150 | 14.7% |
| 4+ Person Household | 134 | 13.1% |
| Total Housing Units | 1,021 | 100.0% |
Occupancy by Ownership by Household Size in McDonald borough
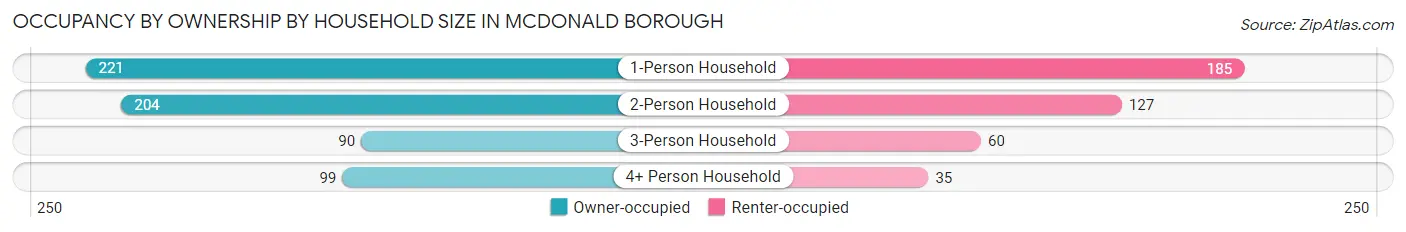
| Household Size | Owner-occupied | Renter-occupied |
| 1-Person Household | 221 (54.4%) | 185 (45.6%) |
| 2-Person Household | 204 (61.6%) | 127 (38.4%) |
| 3-Person Household | 90 (60.0%) | 60 (40.0%) |
| 4+ Person Household | 99 (73.9%) | 35 (26.1%) |
| Total Housing Units | 614 (60.1%) | 407 (39.9%) |
Occupancy by Educational Attainment in McDonald borough
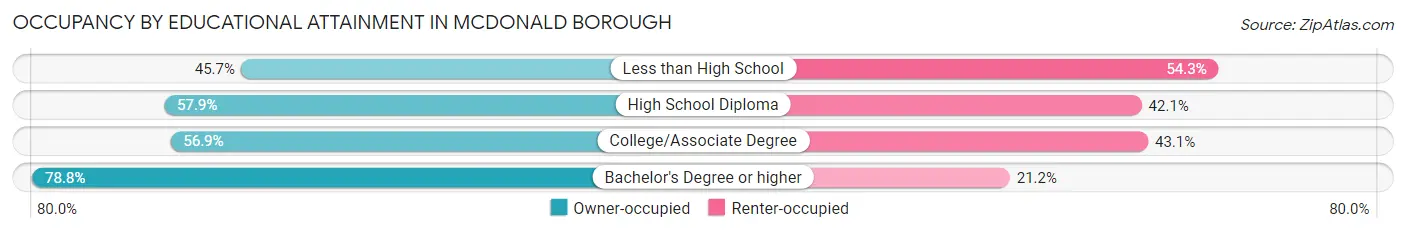
| Household Size | Owner-occupied | Renter-occupied |
| Less than High School | 48 (45.7%) | 57 (54.3%) |
| High School Diploma | 264 (57.9%) | 192 (42.1%) |
| College/Associate Degree | 157 (56.9%) | 119 (43.1%) |
| Bachelor's Degree or higher | 145 (78.8%) | 39 (21.2%) |
Occupancy by Age of Householder in McDonald borough
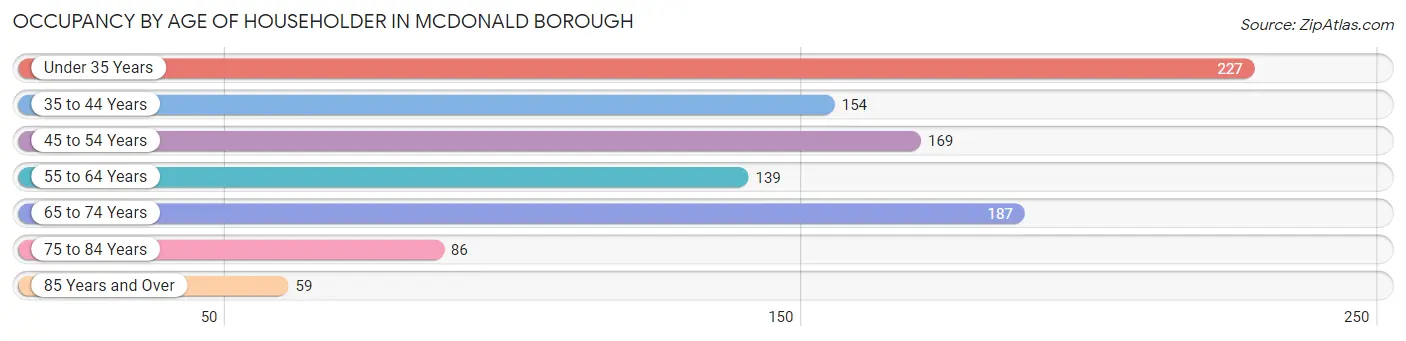
| Age Bracket | # Households | % Households |
| Under 35 Years | 227 | 22.2% |
| 35 to 44 Years | 154 | 15.1% |
| 45 to 54 Years | 169 | 16.6% |
| 55 to 64 Years | 139 | 13.6% |
| 65 to 74 Years | 187 | 18.3% |
| 75 to 84 Years | 86 | 8.4% |
| 85 Years and Over | 59 | 5.8% |
| Total | 1,021 | 100.0% |
Housing Finances in McDonald borough
Median Income by Occupancy in McDonald borough
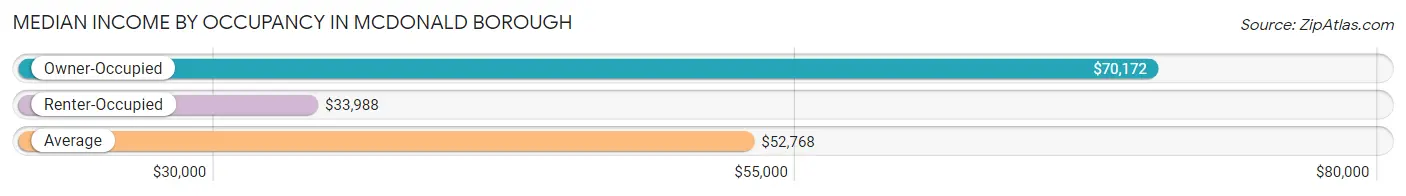
| Occupancy Type | # Households | Median Income |
| Owner-Occupied | 614 (60.1%) | $70,172 |
| Renter-Occupied | 407 (39.9%) | $33,988 |
| Average | 1,021 (100.0%) | $52,768 |
Occupancy by Householder Income Bracket in McDonald borough
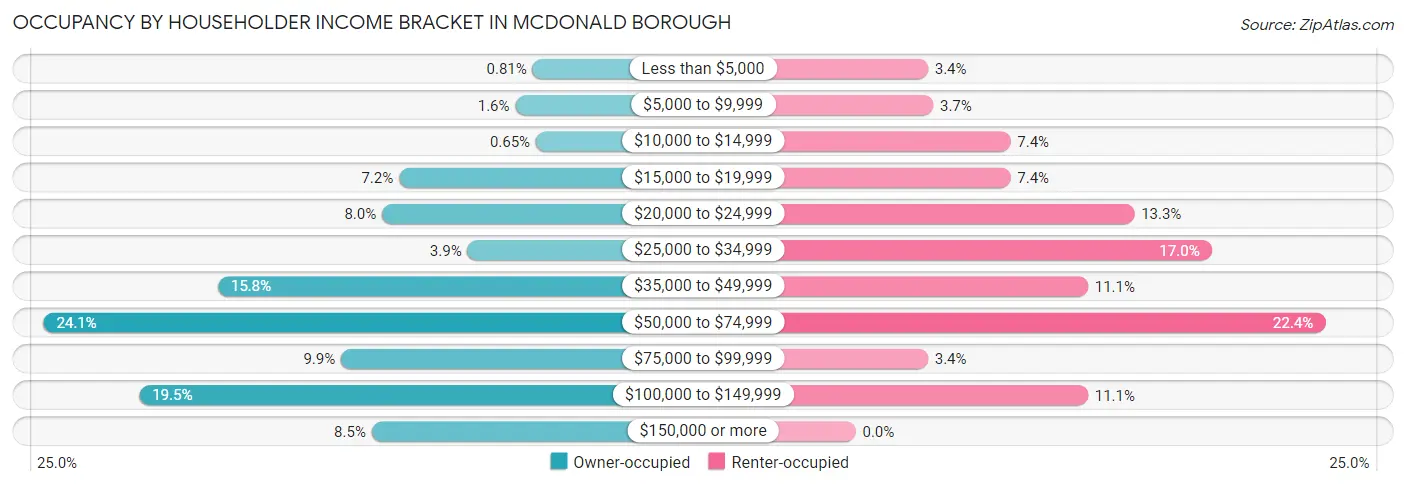
| Income Bracket | Owner-occupied | Renter-occupied |
| Less than $5,000 | 5 (0.8%) | 14 (3.4%) |
| $5,000 to $9,999 | 10 (1.6%) | 15 (3.7%) |
| $10,000 to $14,999 | 4 (0.6%) | 30 (7.4%) |
| $15,000 to $19,999 | 44 (7.2%) | 30 (7.4%) |
| $20,000 to $24,999 | 49 (8.0%) | 54 (13.3%) |
| $25,000 to $34,999 | 24 (3.9%) | 69 (17.0%) |
| $35,000 to $49,999 | 97 (15.8%) | 45 (11.1%) |
| $50,000 to $74,999 | 148 (24.1%) | 91 (22.4%) |
| $75,000 to $99,999 | 61 (9.9%) | 14 (3.4%) |
| $100,000 to $149,999 | 120 (19.5%) | 45 (11.1%) |
| $150,000 or more | 52 (8.5%) | 0 (0.0%) |
| Total | 614 (100.0%) | 407 (100.0%) |
Monthly Housing Cost Tiers in McDonald borough
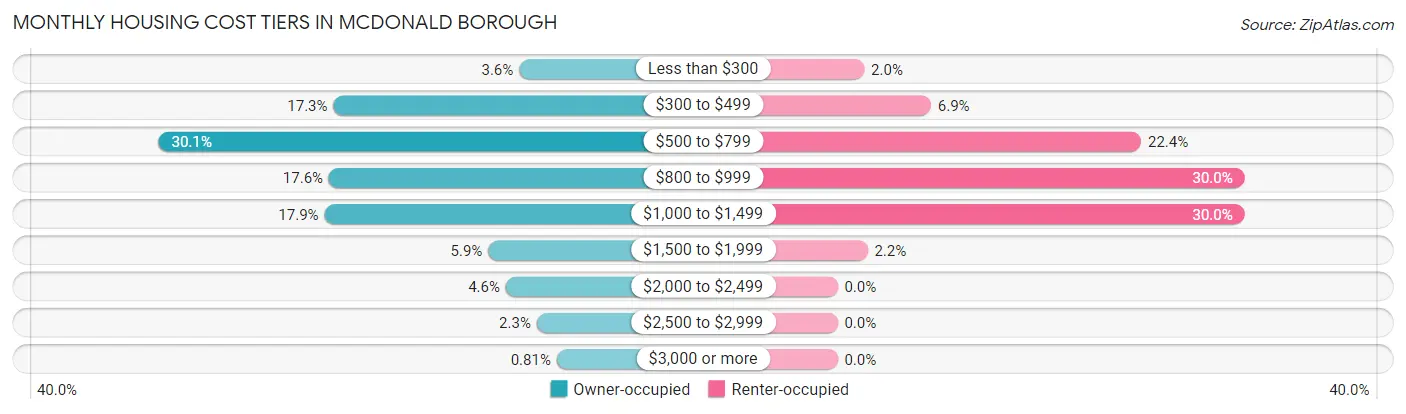
| Monthly Cost | Owner-occupied | Renter-occupied |
| Less than $300 | 22 (3.6%) | 8 (2.0%) |
| $300 to $499 | 106 (17.3%) | 28 (6.9%) |
| $500 to $799 | 185 (30.1%) | 91 (22.4%) |
| $800 to $999 | 108 (17.6%) | 122 (30.0%) |
| $1,000 to $1,499 | 110 (17.9%) | 122 (30.0%) |
| $1,500 to $1,999 | 36 (5.9%) | 9 (2.2%) |
| $2,000 to $2,499 | 28 (4.6%) | 0 (0.0%) |
| $2,500 to $2,999 | 14 (2.3%) | 0 (0.0%) |
| $3,000 or more | 5 (0.8%) | 0 (0.0%) |
| Total | 614 (100.0%) | 407 (100.0%) |
Physical Housing Characteristics in McDonald borough
Housing Structures in McDonald borough
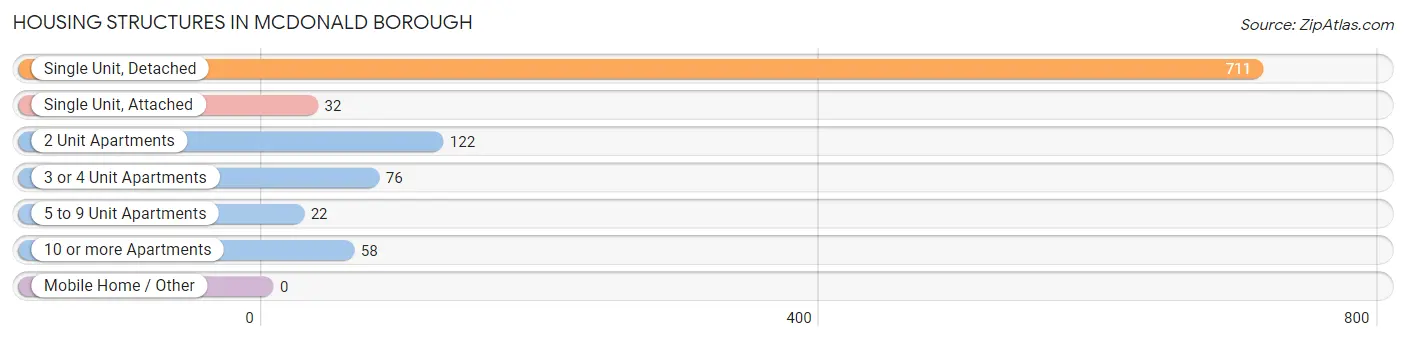
| Structure Type | # Housing Units | % Housing Units |
| Single Unit, Detached | 711 | 69.6% |
| Single Unit, Attached | 32 | 3.1% |
| 2 Unit Apartments | 122 | 11.9% |
| 3 or 4 Unit Apartments | 76 | 7.4% |
| 5 to 9 Unit Apartments | 22 | 2.1% |
| 10 or more Apartments | 58 | 5.7% |
| Mobile Home / Other | 0 | 0.0% |
| Total | 1,021 | 100.0% |
Housing Structures by Occupancy in McDonald borough
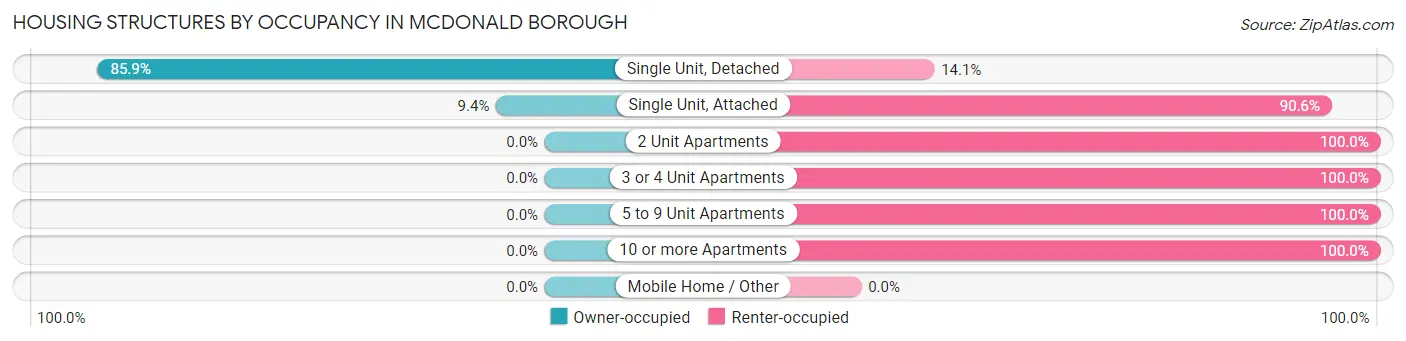
| Structure Type | Owner-occupied | Renter-occupied |
| Single Unit, Detached | 611 (85.9%) | 100 (14.1%) |
| Single Unit, Attached | 3 (9.4%) | 29 (90.6%) |
| 2 Unit Apartments | 0 (0.0%) | 122 (100.0%) |
| 3 or 4 Unit Apartments | 0 (0.0%) | 76 (100.0%) |
| 5 to 9 Unit Apartments | 0 (0.0%) | 22 (100.0%) |
| 10 or more Apartments | 0 (0.0%) | 58 (100.0%) |
| Mobile Home / Other | 0 (0.0%) | 0 (0.0%) |
| Total | 614 (60.1%) | 407 (39.9%) |
Housing Structures by Number of Rooms in McDonald borough
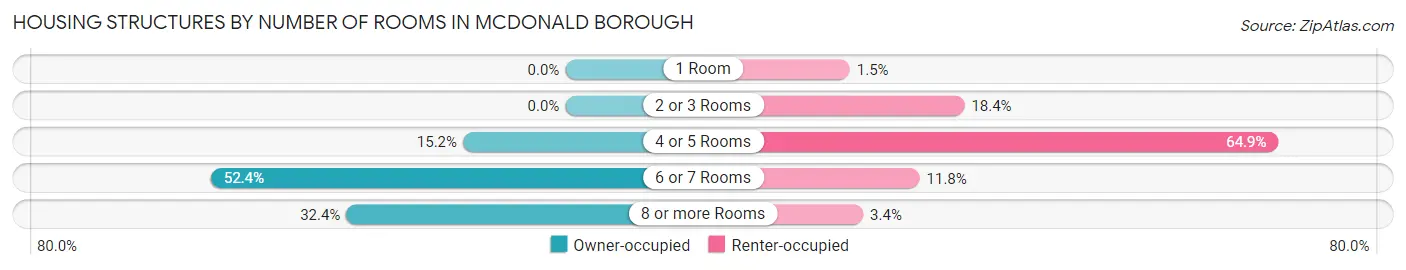
| Number of Rooms | Owner-occupied | Renter-occupied |
| 1 Room | 0 (0.0%) | 6 (1.5%) |
| 2 or 3 Rooms | 0 (0.0%) | 75 (18.4%) |
| 4 or 5 Rooms | 93 (15.1%) | 264 (64.9%) |
| 6 or 7 Rooms | 322 (52.4%) | 48 (11.8%) |
| 8 or more Rooms | 199 (32.4%) | 14 (3.4%) |
| Total | 614 (100.0%) | 407 (100.0%) |
Housing Structure by Heating Type in McDonald borough
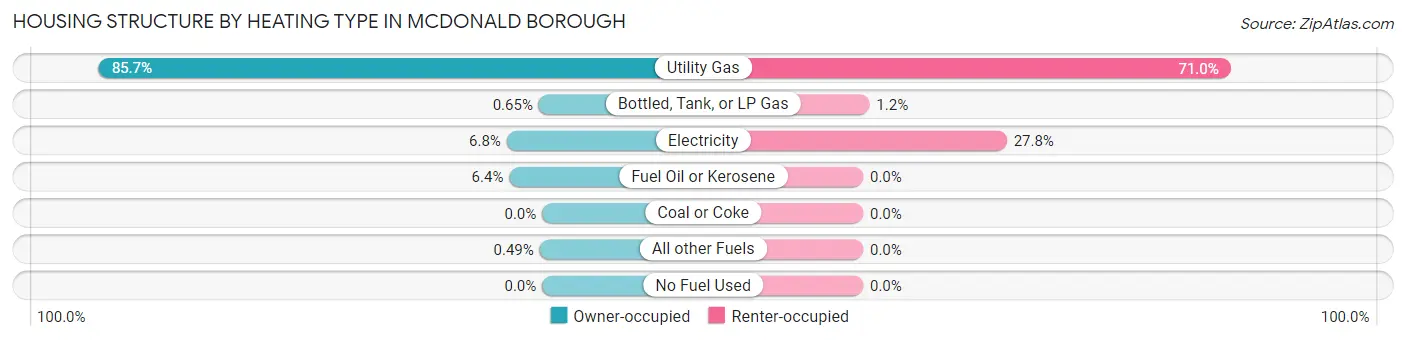
| Heating Type | Owner-occupied | Renter-occupied |
| Utility Gas | 526 (85.7%) | 289 (71.0%) |
| Bottled, Tank, or LP Gas | 4 (0.6%) | 5 (1.2%) |
| Electricity | 42 (6.8%) | 113 (27.8%) |
| Fuel Oil or Kerosene | 39 (6.4%) | 0 (0.0%) |
| Coal or Coke | 0 (0.0%) | 0 (0.0%) |
| All other Fuels | 3 (0.5%) | 0 (0.0%) |
| No Fuel Used | 0 (0.0%) | 0 (0.0%) |
| Total | 614 (100.0%) | 407 (100.0%) |
Household Vehicle Usage in McDonald borough
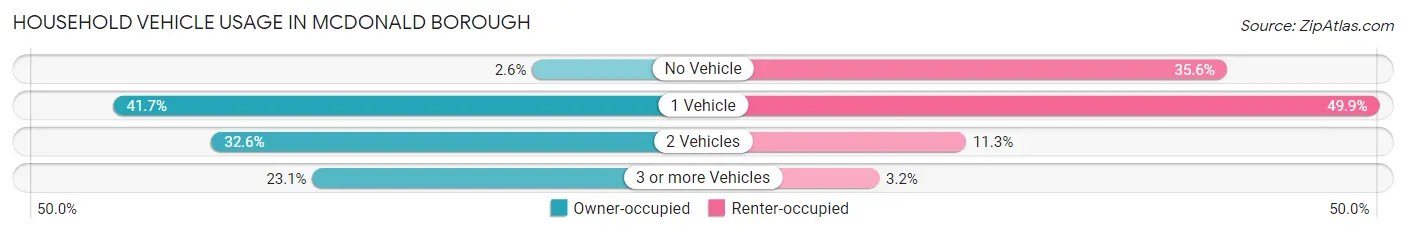
| Vehicles per Household | Owner-occupied | Renter-occupied |
| No Vehicle | 16 (2.6%) | 145 (35.6%) |
| 1 Vehicle | 256 (41.7%) | 203 (49.9%) |
| 2 Vehicles | 200 (32.6%) | 46 (11.3%) |
| 3 or more Vehicles | 142 (23.1%) | 13 (3.2%) |
| Total | 614 (100.0%) | 407 (100.0%) |
Real Estate & Mortgages in McDonald borough
Real Estate and Mortgage Overview in McDonald borough
| Characteristic | Without Mortgage | With Mortgage |
| Housing Units | 242 | 372 |
| Median Property Value | $108,000 | $149,400 |
| Median Household Income | $53,500 | $45 |
| Monthly Housing Costs | $486 | $5 |
| Real Estate Taxes | $1,625 | $0 |
Property Value by Mortgage Status in McDonald borough
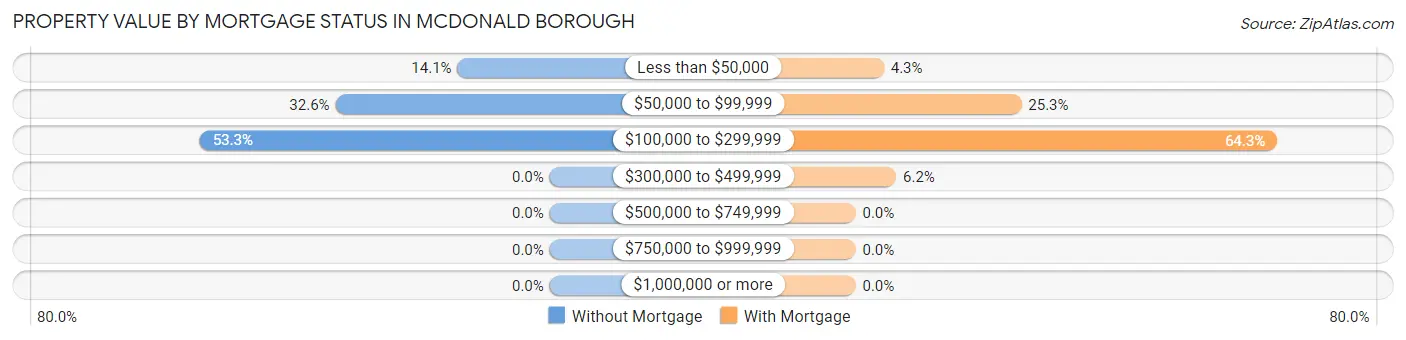
| Property Value | Without Mortgage | With Mortgage |
| Less than $50,000 | 34 (14.1%) | 16 (4.3%) |
| $50,000 to $99,999 | 79 (32.6%) | 94 (25.3%) |
| $100,000 to $299,999 | 129 (53.3%) | 239 (64.2%) |
| $300,000 to $499,999 | 0 (0.0%) | 23 (6.2%) |
| $500,000 to $749,999 | 0 (0.0%) | 0 (0.0%) |
| $750,000 to $999,999 | 0 (0.0%) | 0 (0.0%) |
| $1,000,000 or more | 0 (0.0%) | 0 (0.0%) |
| Total | 242 (100.0%) | 372 (100.0%) |
Household Income by Mortgage Status in McDonald borough
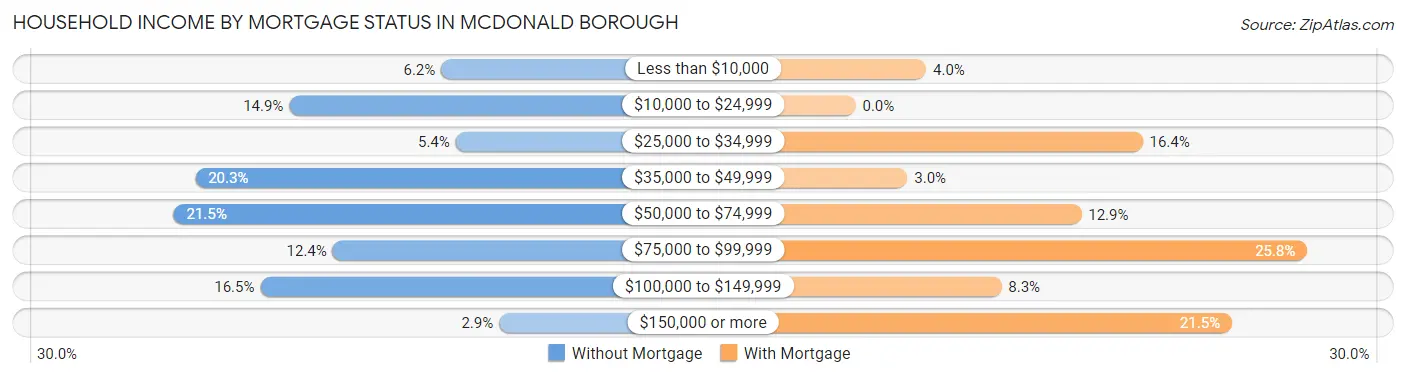
| Household Income | Without Mortgage | With Mortgage |
| Less than $10,000 | 15 (6.2%) | 15 (4.0%) |
| $10,000 to $24,999 | 36 (14.9%) | 0 (0.0%) |
| $25,000 to $34,999 | 13 (5.4%) | 61 (16.4%) |
| $35,000 to $49,999 | 49 (20.3%) | 11 (3.0%) |
| $50,000 to $74,999 | 52 (21.5%) | 48 (12.9%) |
| $75,000 to $99,999 | 30 (12.4%) | 96 (25.8%) |
| $100,000 to $149,999 | 40 (16.5%) | 31 (8.3%) |
| $150,000 or more | 7 (2.9%) | 80 (21.5%) |
| Total | 242 (100.0%) | 372 (100.0%) |
Property Value to Household Income Ratio in McDonald borough
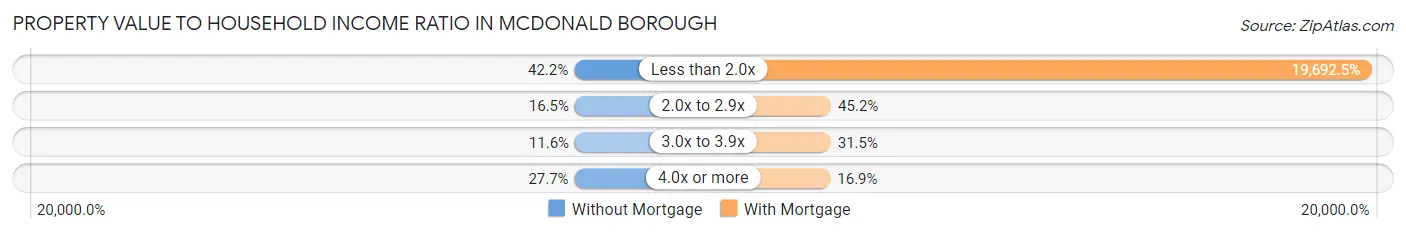
| Value-to-Income Ratio | Without Mortgage | With Mortgage |
| Less than 2.0x | 102 (42.1%) | 73,256 (19,692.5%) |
| 2.0x to 2.9x | 40 (16.5%) | 168 (45.2%) |
| 3.0x to 3.9x | 28 (11.6%) | 117 (31.5%) |
| 4.0x or more | 67 (27.7%) | 63 (16.9%) |
| Total | 242 (100.0%) | 372 (100.0%) |
Real Estate Taxes by Mortgage Status in McDonald borough
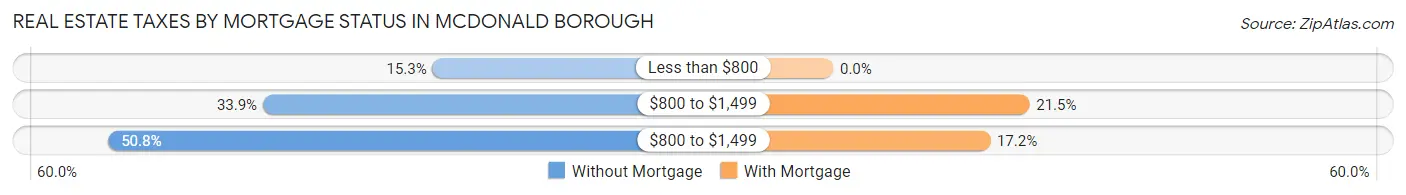
| Property Taxes | Without Mortgage | With Mortgage |
| Less than $800 | 37 (15.3%) | 0 (0.0%) |
| $800 to $1,499 | 82 (33.9%) | 80 (21.5%) |
| $800 to $1,499 | 123 (50.8%) | 64 (17.2%) |
| Total | 242 (100.0%) | 372 (100.0%) |
Health & Disability in McDonald borough
Health Insurance Coverage by Age in McDonald borough
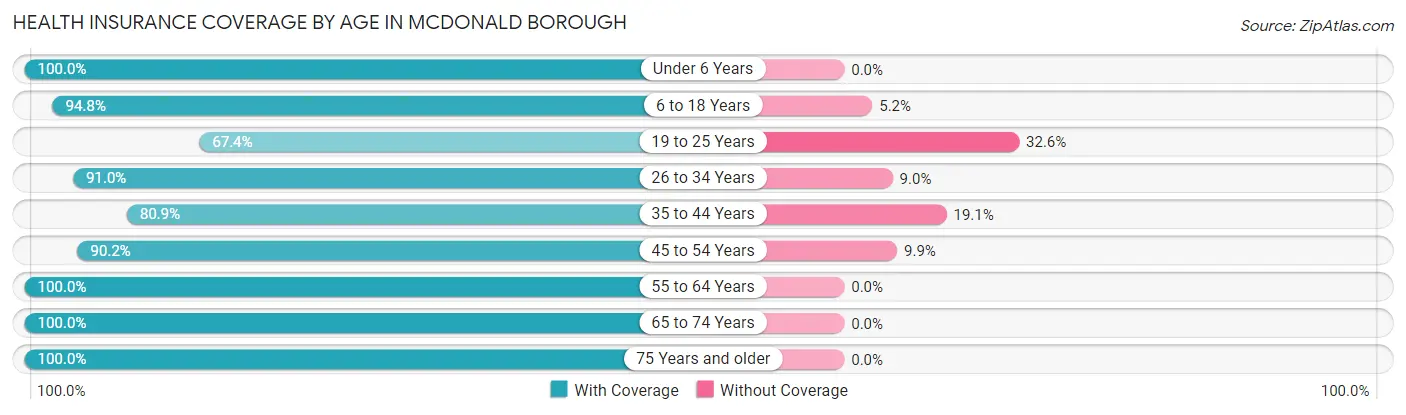
| Age Bracket | With Coverage | Without Coverage |
| Under 6 Years | 119 (100.0%) | 0 (0.0%) |
| 6 to 18 Years | 381 (94.8%) | 21 (5.2%) |
| 19 to 25 Years | 122 (67.4%) | 59 (32.6%) |
| 26 to 34 Years | 232 (91.0%) | 23 (9.0%) |
| 35 to 44 Years | 276 (80.9%) | 65 (19.1%) |
| 45 to 54 Years | 238 (90.1%) | 26 (9.9%) |
| 55 to 64 Years | 237 (100.0%) | 0 (0.0%) |
| 65 to 74 Years | 225 (100.0%) | 0 (0.0%) |
| 75 Years and older | 239 (100.0%) | 0 (0.0%) |
| Total | 2,069 (91.4%) | 194 (8.6%) |
Health Insurance Coverage by Citizenship Status in McDonald borough
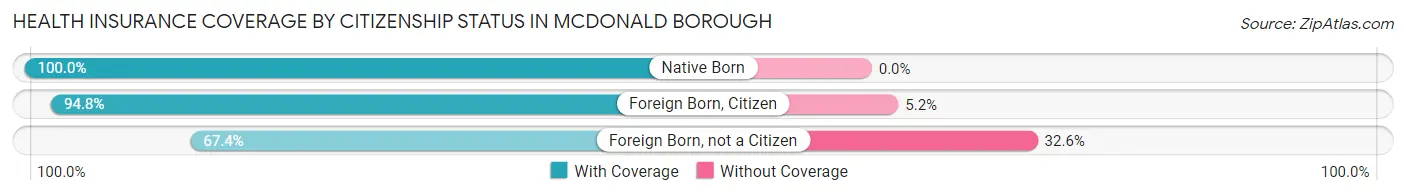
| Citizenship Status | With Coverage | Without Coverage |
| Native Born | 119 (100.0%) | 0 (0.0%) |
| Foreign Born, Citizen | 381 (94.8%) | 21 (5.2%) |
| Foreign Born, not a Citizen | 122 (67.4%) | 59 (32.6%) |
Health Insurance Coverage by Household Income in McDonald borough
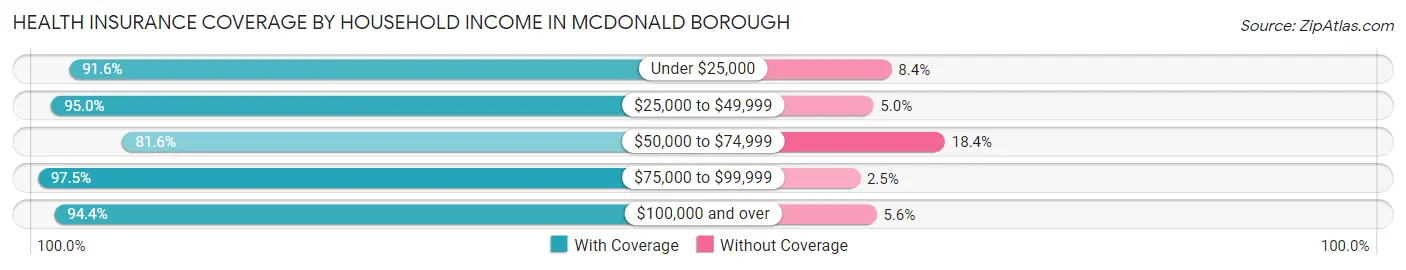
| Household Income | With Coverage | Without Coverage |
| Under $25,000 | 285 (91.6%) | 26 (8.4%) |
| $25,000 to $49,999 | 419 (95.0%) | 22 (5.0%) |
| $50,000 to $74,999 | 440 (81.6%) | 99 (18.4%) |
| $75,000 to $99,999 | 198 (97.5%) | 5 (2.5%) |
| $100,000 and over | 712 (94.4%) | 42 (5.6%) |
Public vs Private Health Insurance Coverage by Age in McDonald borough
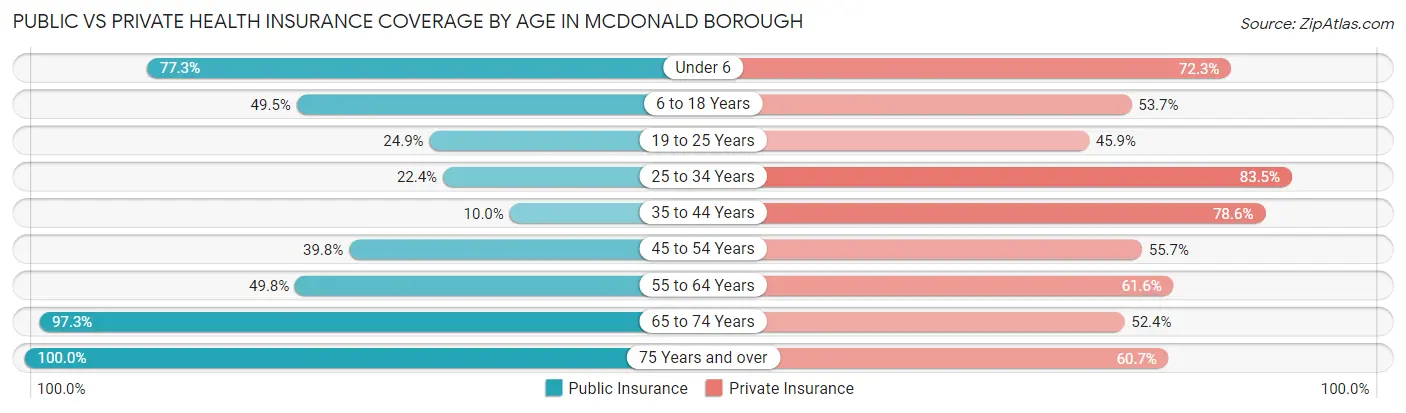
| Age Bracket | Public Insurance | Private Insurance |
| Under 6 | 92 (77.3%) | 86 (72.3%) |
| 6 to 18 Years | 199 (49.5%) | 216 (53.7%) |
| 19 to 25 Years | 45 (24.9%) | 83 (45.9%) |
| 25 to 34 Years | 57 (22.4%) | 213 (83.5%) |
| 35 to 44 Years | 34 (10.0%) | 268 (78.6%) |
| 45 to 54 Years | 105 (39.8%) | 147 (55.7%) |
| 55 to 64 Years | 118 (49.8%) | 146 (61.6%) |
| 65 to 74 Years | 219 (97.3%) | 118 (52.4%) |
| 75 Years and over | 239 (100.0%) | 145 (60.7%) |
| Total | 1,108 (49.0%) | 1,422 (62.8%) |
Disability Status by Sex by Age in McDonald borough
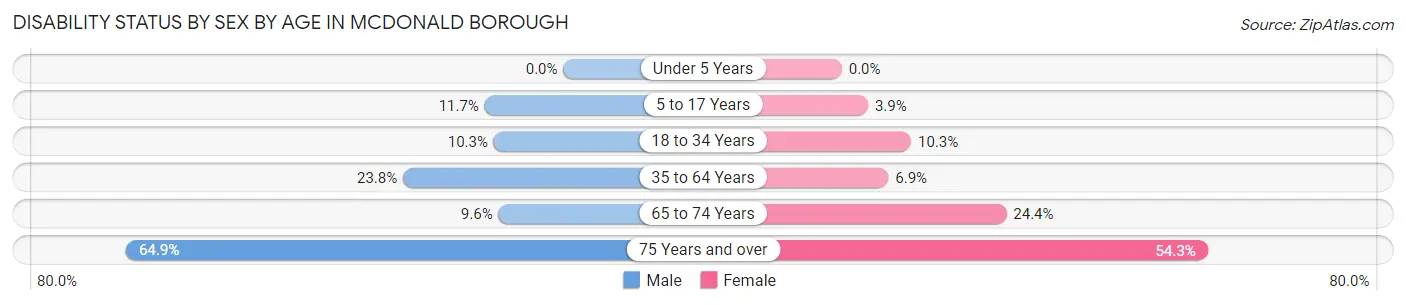
| Age Bracket | Male | Female |
| Under 5 Years | 0 (0.0%) | 0 (0.0%) |
| 5 to 17 Years | 25 (11.7%) | 7 (3.9%) |
| 18 to 34 Years | 25 (10.3%) | 22 (10.3%) |
| 35 to 64 Years | 104 (23.8%) | 28 (6.9%) |
| 65 to 74 Years | 13 (9.6%) | 22 (24.4%) |
| 75 Years and over | 50 (64.9%) | 88 (54.3%) |
Disability Class by Sex by Age in McDonald borough
Disability Class: Hearing Difficulty
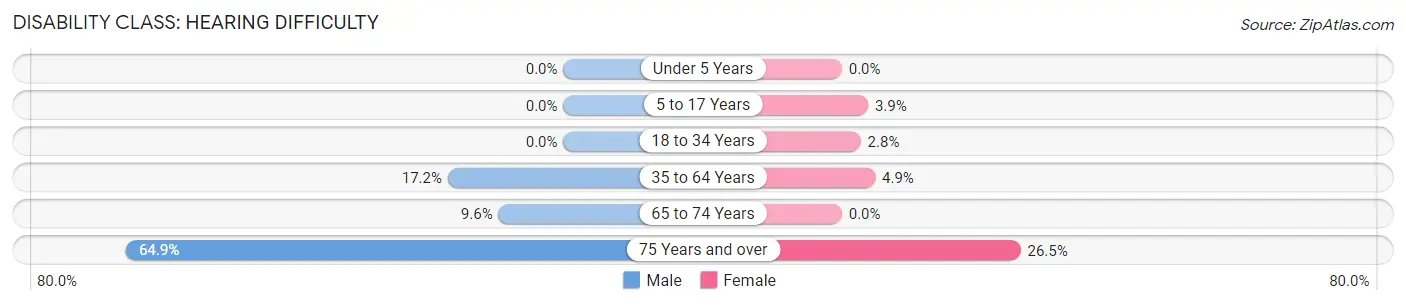
| Age Bracket | Male | Female |
| Under 5 Years | 0 (0.0%) | 0 (0.0%) |
| 5 to 17 Years | 0 (0.0%) | 7 (3.9%) |
| 18 to 34 Years | 0 (0.0%) | 6 (2.8%) |
| 35 to 64 Years | 75 (17.2%) | 20 (4.9%) |
| 65 to 74 Years | 13 (9.6%) | 0 (0.0%) |
| 75 Years and over | 50 (64.9%) | 43 (26.5%) |
Disability Class: Vision Difficulty
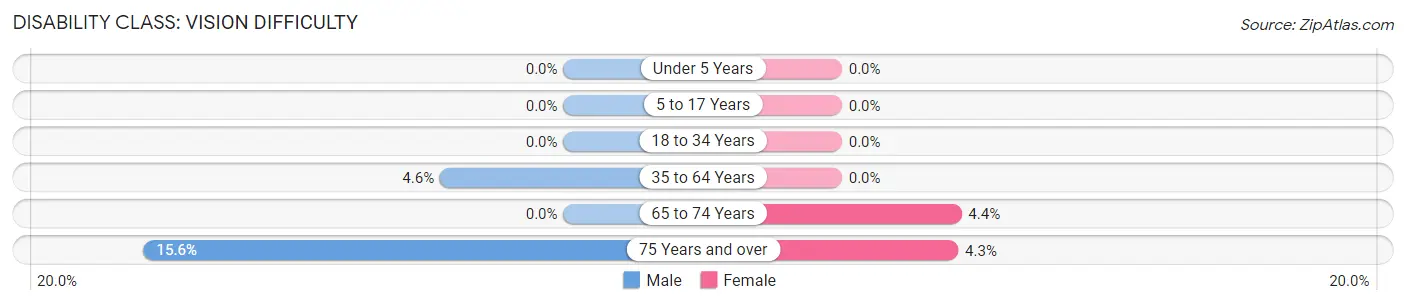
| Age Bracket | Male | Female |
| Under 5 Years | 0 (0.0%) | 0 (0.0%) |
| 5 to 17 Years | 0 (0.0%) | 0 (0.0%) |
| 18 to 34 Years | 0 (0.0%) | 0 (0.0%) |
| 35 to 64 Years | 20 (4.6%) | 0 (0.0%) |
| 65 to 74 Years | 0 (0.0%) | 4 (4.4%) |
| 75 Years and over | 12 (15.6%) | 7 (4.3%) |
Disability Class: Cognitive Difficulty
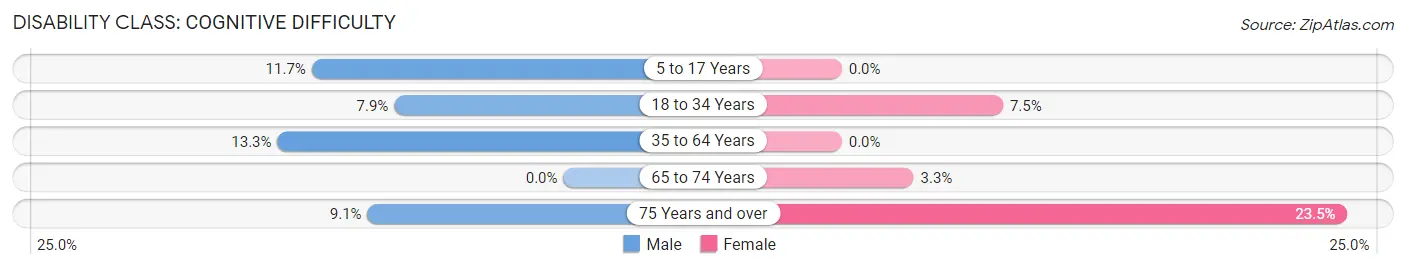
| Age Bracket | Male | Female |
| 5 to 17 Years | 25 (11.7%) | 0 (0.0%) |
| 18 to 34 Years | 19 (7.9%) | 16 (7.5%) |
| 35 to 64 Years | 58 (13.3%) | 0 (0.0%) |
| 65 to 74 Years | 0 (0.0%) | 3 (3.3%) |
| 75 Years and over | 7 (9.1%) | 38 (23.5%) |
Disability Class: Ambulatory Difficulty
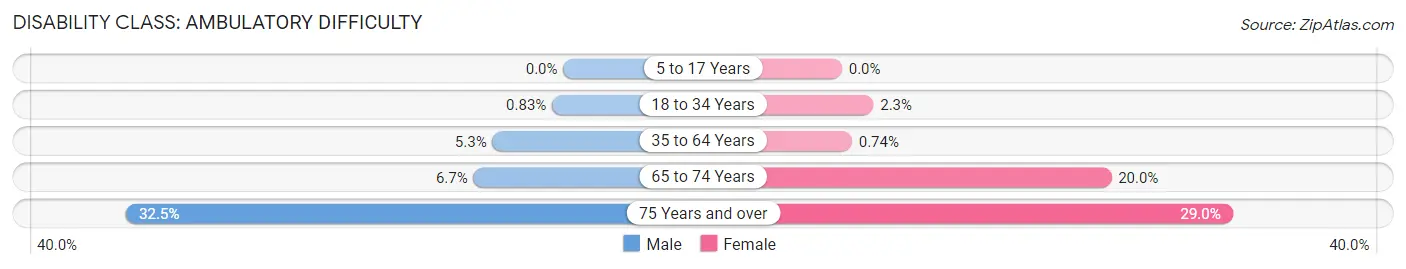
| Age Bracket | Male | Female |
| 5 to 17 Years | 0 (0.0%) | 0 (0.0%) |
| 18 to 34 Years | 2 (0.8%) | 5 (2.3%) |
| 35 to 64 Years | 23 (5.3%) | 3 (0.7%) |
| 65 to 74 Years | 9 (6.7%) | 18 (20.0%) |
| 75 Years and over | 25 (32.5%) | 47 (29.0%) |
Disability Class: Self-Care Difficulty
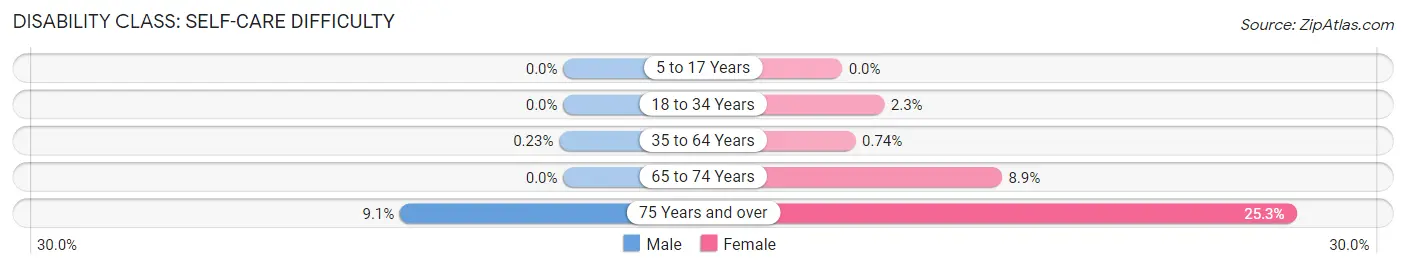
| Age Bracket | Male | Female |
| 5 to 17 Years | 0 (0.0%) | 0 (0.0%) |
| 18 to 34 Years | 0 (0.0%) | 5 (2.3%) |
| 35 to 64 Years | 1 (0.2%) | 3 (0.7%) |
| 65 to 74 Years | 0 (0.0%) | 8 (8.9%) |
| 75 Years and over | 7 (9.1%) | 41 (25.3%) |
Technology Access in McDonald borough
Computing Device Access in McDonald borough
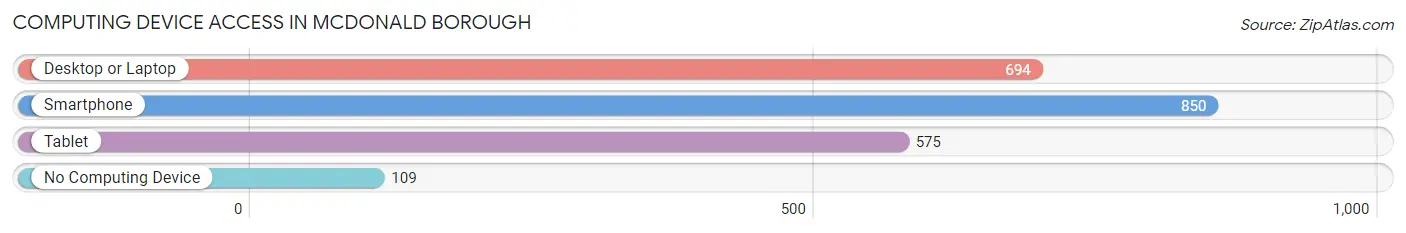
| Device Type | # Households | % Households |
| Desktop or Laptop | 694 | 68.0% |
| Smartphone | 850 | 83.3% |
| Tablet | 575 | 56.3% |
| No Computing Device | 109 | 10.7% |
| Total | 1,021 | 100.0% |
Internet Access in McDonald borough
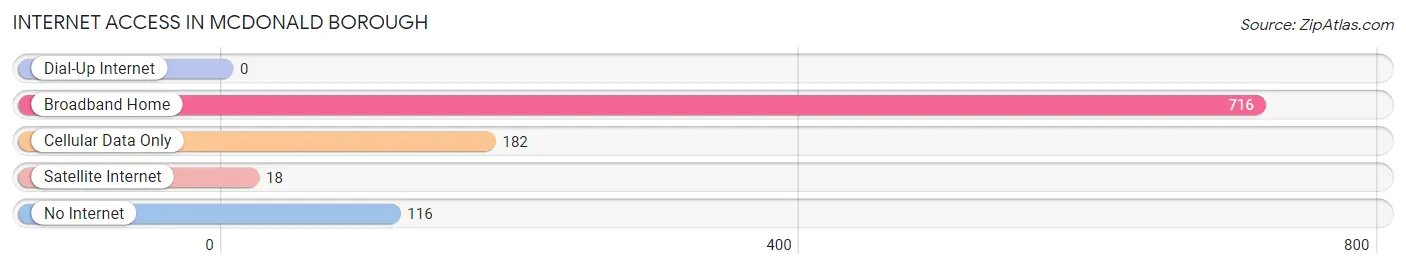
| Internet Type | # Households | % Households |
| Dial-Up Internet | 0 | 0.0% |
| Broadband Home | 716 | 70.1% |
| Cellular Data Only | 182 | 17.8% |
| Satellite Internet | 18 | 1.8% |
| No Internet | 116 | 11.4% |
| Total | 1,021 | 100.0% |
McDonald borough Summary
McDonald Borough is a small borough located in Allegheny County, Pennsylvania. It is situated in the southwestern corner of the county, just north of the city of Pittsburgh. The borough was incorporated in 1875 and is home to approximately 2,500 people.
History
McDonald Borough was founded in 1875 by a group of settlers from the nearby town of McDonald. The settlers were looking for a place to call home and chose the area due to its proximity to the city of Pittsburgh. The borough was named after the McDonald family, who were among the first settlers.
The borough was originally a farming community, but as the city of Pittsburgh grew, so did the borough. In the late 19th century, the borough began to develop into a residential area. The population grew steadily throughout the 20th century, reaching its peak in the 1950s.
Geography
McDonald Borough is located in the southwestern corner of Allegheny County, just north of the city of Pittsburgh. The borough is bordered by the townships of Robinson, Collier, and Cecil. The borough is situated on the banks of the Ohio River and is home to several parks and recreational areas.
The borough has a total area of 1.2 square miles, all of which is land. The terrain is mostly flat, with some rolling hills. The climate is humid continental, with hot summers and cold winters.
Economy
McDonald Borough has a diverse economy, with a mix of manufacturing, retail, and service industries. The borough is home to several small businesses, including restaurants, shops, and professional services. The borough also has a number of industrial parks, which are home to a variety of manufacturing and distribution companies.
The borough is also home to several large employers, including the University of Pittsburgh Medical Center, UPMC Presbyterian, and the Allegheny County Airport. The borough is also home to several educational institutions, including the University of Pittsburgh, Carnegie Mellon University, and the Community College of Allegheny County.
Demographics
As of the 2010 census, the population of McDonald Borough was 2,521. The racial makeup of the borough was 94.3% White, 2.3% African American, 0.2% Native American, 0.7% Asian, 0.1% Pacific Islander, and 2.4% from other races. Hispanic or Latino of any race were 1.3% of the population.
The median household income in McDonald Borough was $45,938, and the median family income was $54,938. The per capita income was $22,938. About 8.3% of families and 10.2% of the population were below the poverty line, including 14.2% of those under age 18 and 6.2% of those age 65 or over.
Conclusion
McDonald Borough is a small borough located in Allegheny County, Pennsylvania. It was founded in 1875 and is home to approximately 2,500 people. The borough has a diverse economy, with a mix of manufacturing, retail, and service industries. The population is mostly white, with a small percentage of African Americans, Native Americans, Asians, and Pacific Islanders. The median household income is $45,938, and the median family income is $54,938. The borough is home to several large employers, including the University of Pittsburgh Medical Center, UPMC Presbyterian, and the Allegheny County Airport.
Common Questions
What is Per Capita Income in McDonald borough?
Per Capita income in McDonald borough is $29,557.
What is the Median Family Income in McDonald borough?
Median Family Income in McDonald borough is $61,674.
What is the Median Household income in McDonald borough?
Median Household Income in McDonald borough is $52,768.
What is Income or Wage Gap in McDonald borough?
Income or Wage Gap in McDonald borough is 35.3%.
Women in McDonald borough earn 64.7 cents for every dollar earned by a man.
What is Inequality or Gini Index in McDonald borough?
Inequality or Gini Index in McDonald borough is 0.39.
What is the Total Population of McDonald borough?
Total Population of McDonald borough is 2,263.
What is the Total Male Population of McDonald borough?
Total Male Population of McDonald borough is 1,143.
What is the Total Female Population of McDonald borough?
Total Female Population of McDonald borough is 1,120.
What is the Ratio of Males per 100 Females in McDonald borough?
There are 102.05 Males per 100 Females in McDonald borough.
What is the Ratio of Females per 100 Males in McDonald borough?
There are 97.99 Females per 100 Males in McDonald borough.
What is the Median Population Age in McDonald borough?
Median Population Age in McDonald borough is 39.7 Years.
What is the Average Family Size in McDonald borough
Average Family Size in McDonald borough is 3.1 People.
What is the Average Household Size in McDonald borough
Average Household Size in McDonald borough is 2.2 People.
How Large is the Labor Force in McDonald borough?
There are 1,102 People in the Labor Forcein in McDonald borough.
What is the Percentage of People in the Labor Force in McDonald borough?
60.1% of People are in the Labor Force in McDonald borough.
What is the Unemployment Rate in McDonald borough?
Unemployment Rate in McDonald borough is 5.3%.