Nescopeck borough, PA Map & Demographics
Nescopeck borough Overview
$34,993
PER CAPITA INCOME
$75,114
AVG FAMILY INCOME
$59,779
AVG HOUSEHOLD INCOME
16.1%
WAGE / INCOME GAP [ % ]
83.9¢/ $1
WAGE / INCOME GAP [ $ ]
0.43
INEQUALITY / GINI INDEX
1,426
TOTAL POPULATION
721
MALE POPULATION
705
FEMALE POPULATION
102.27
MALES / 100 FEMALES
97.78
FEMALES / 100 MALES
42.9
MEDIAN AGE
2.9
AVG FAMILY SIZE
2.2
AVG HOUSEHOLD SIZE
753
LABOR FORCE [ PEOPLE ]
66.4%
PERCENT IN LABOR FORCE
2.9%
UNEMPLOYMENT RATE
Income in Nescopeck borough
Income Overview in Nescopeck borough
Per Capita Income in Nescopeck borough is $34,993, while median incomes of families and households are $75,114 and $59,779 respectively.
| Characteristic | Number | Measure |
| Per Capita Income | 1,426 | $34,993 |
| Median Family Income | 369 | $75,114 |
| Mean Family Income | 369 | $95,437 |
| Median Household Income | 657 | $59,779 |
| Mean Household Income | 657 | $76,950 |
| Income Deficit | 369 | $0 |
| Wage / Income Gap (%) | 1,426 | 16.14% |
| Wage / Income Gap ($) | 1,426 | 83.86¢ per $1 |
| Gini / Inequality Index | 1,426 | 0.43 |
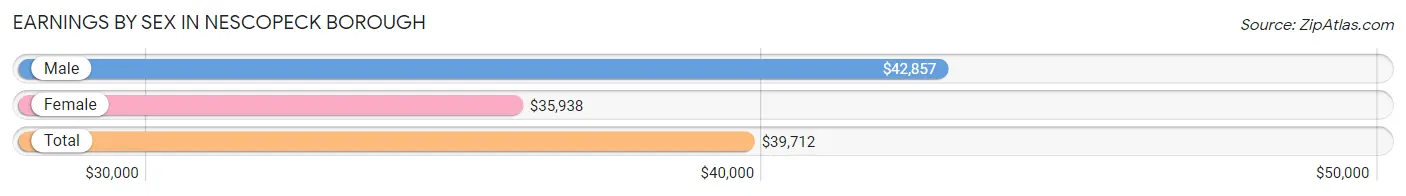
Earnings by Sex in Nescopeck borough
Average Earnings in Nescopeck borough are $39,712, $42,857 for men and $35,938 for women, a difference of 16.1%.
| Sex | Number | Average Earnings |
| Male | 396 (51.7%) | $42,857 |
| Female | 370 (48.3%) | $35,938 |
| Total | 766 (100.0%) | $39,712 |
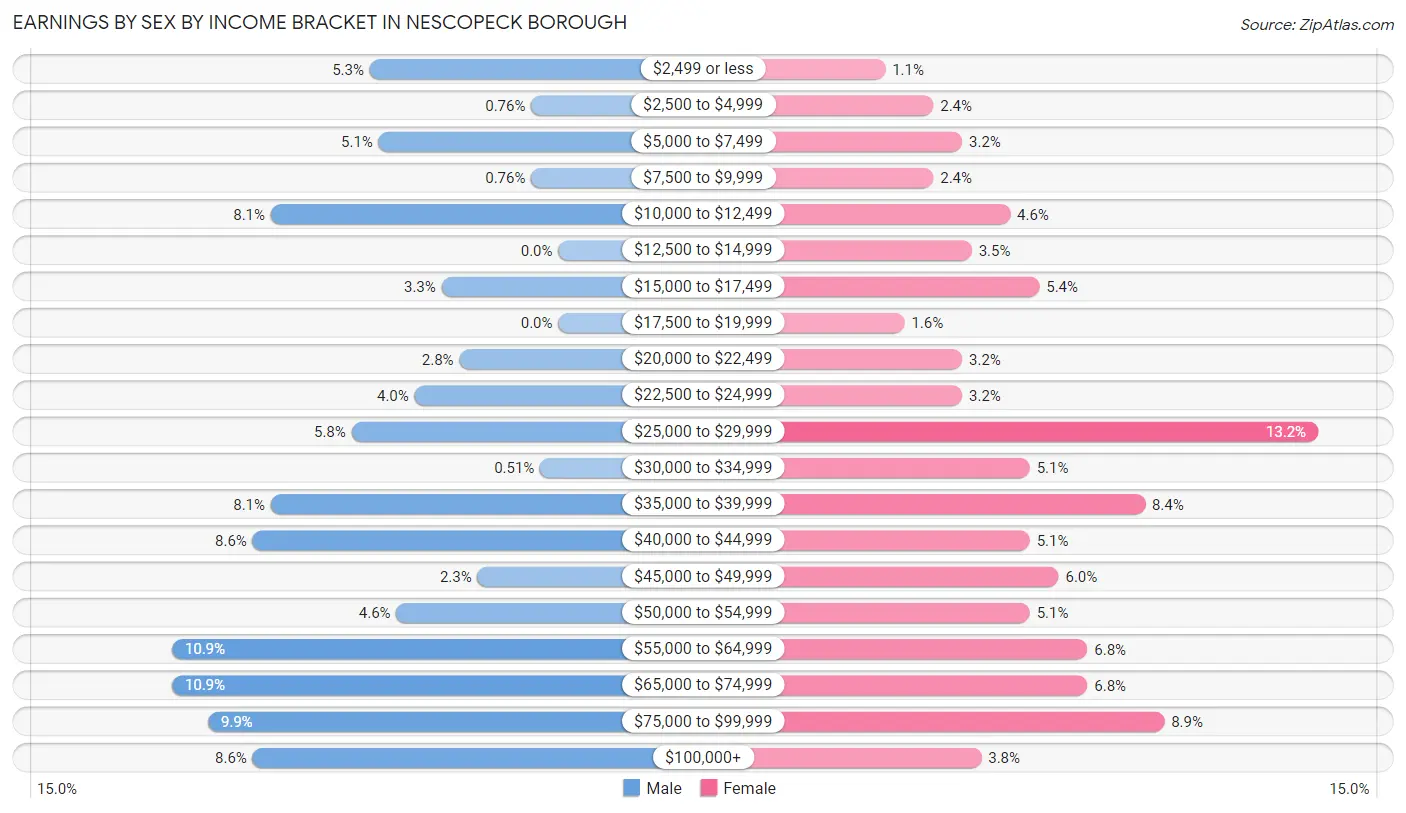
Earnings by Sex by Income Bracket in Nescopeck borough
The most common earnings brackets in Nescopeck borough are $55,000 to $64,999 for men (43 | 10.9%) and $25,000 to $29,999 for women (49 | 13.2%).
| Income | Male | Female |
| $2,499 or less | 21 (5.3%) | 4 (1.1%) |
| $2,500 to $4,999 | 3 (0.8%) | 9 (2.4%) |
| $5,000 to $7,499 | 20 (5.1%) | 12 (3.2%) |
| $7,500 to $9,999 | 3 (0.8%) | 9 (2.4%) |
| $10,000 to $12,499 | 32 (8.1%) | 17 (4.6%) |
| $12,500 to $14,999 | 0 (0.0%) | 13 (3.5%) |
| $15,000 to $17,499 | 13 (3.3%) | 20 (5.4%) |
| $17,500 to $19,999 | 0 (0.0%) | 6 (1.6%) |
| $20,000 to $22,499 | 11 (2.8%) | 12 (3.2%) |
| $22,500 to $24,999 | 16 (4.0%) | 12 (3.2%) |
| $25,000 to $29,999 | 23 (5.8%) | 49 (13.2%) |
| $30,000 to $34,999 | 2 (0.5%) | 19 (5.1%) |
| $35,000 to $39,999 | 32 (8.1%) | 31 (8.4%) |
| $40,000 to $44,999 | 34 (8.6%) | 19 (5.1%) |
| $45,000 to $49,999 | 9 (2.3%) | 22 (5.9%) |
| $50,000 to $54,999 | 18 (4.5%) | 19 (5.1%) |
| $55,000 to $64,999 | 43 (10.9%) | 25 (6.8%) |
| $65,000 to $74,999 | 43 (10.9%) | 25 (6.8%) |
| $75,000 to $99,999 | 39 (9.9%) | 33 (8.9%) |
| $100,000+ | 34 (8.6%) | 14 (3.8%) |
| Total | 396 (100.0%) | 370 (100.0%) |
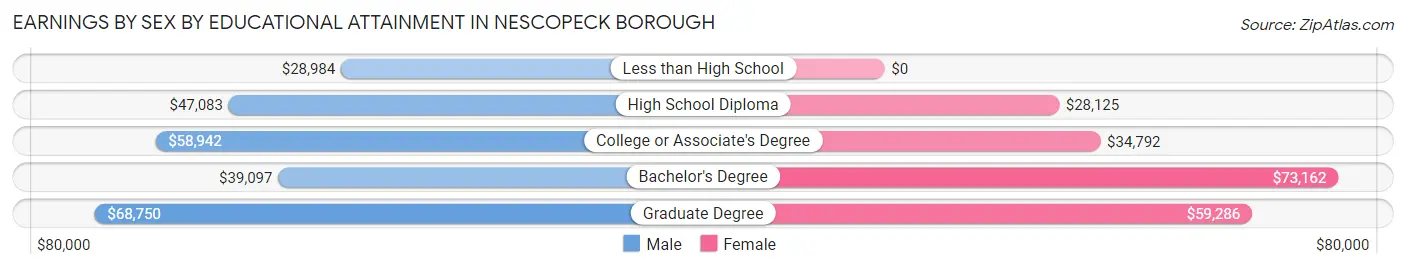
Earnings by Sex by Educational Attainment in Nescopeck borough
Average earnings in Nescopeck borough are $47,500 for men and $39,511 for women, a difference of 16.8%. Men with an educational attainment of graduate degree enjoy the highest average annual earnings of $68,750, while those with less than high school education earn the least with $28,984. Women with an educational attainment of bachelor's degree earn the most with the average annual earnings of $73,162, while those with high school diploma education have the smallest earnings of $28,125.
| Educational Attainment | Male Income | Female Income |
| Less than High School | $28,984 | $0 |
| High School Diploma | $47,083 | $28,125 |
| College or Associate's Degree | $58,942 | $34,792 |
| Bachelor's Degree | $39,097 | $73,162 |
| Graduate Degree | $68,750 | $59,286 |
| Total | $47,500 | $39,511 |
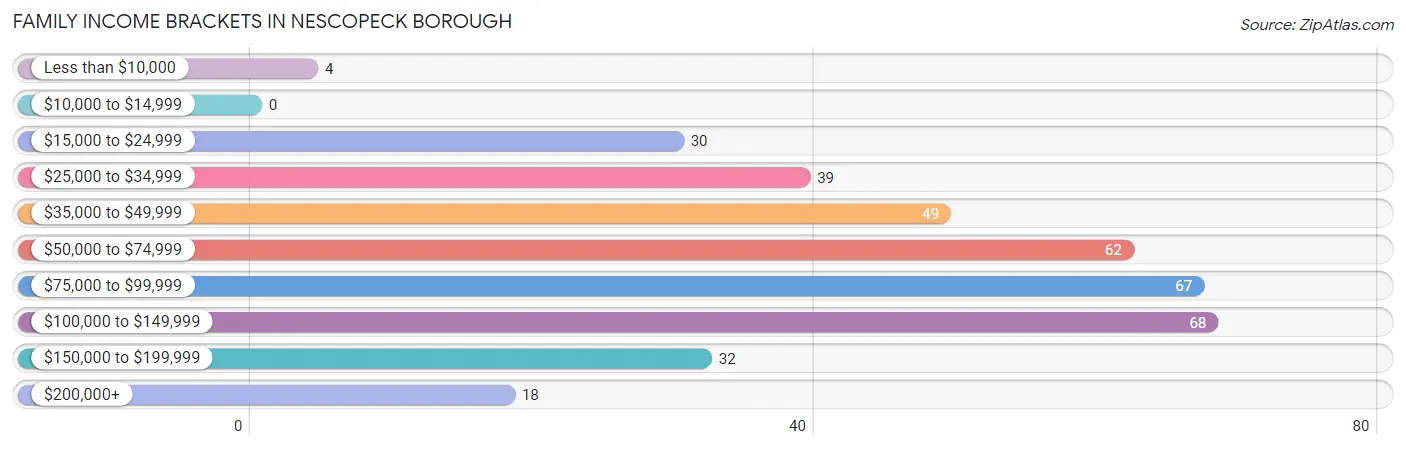
Family Income in Nescopeck borough
Family Income Brackets in Nescopeck borough
According to the Nescopeck borough family income data, there are 68 families falling into the $100,000 to $149,999 income range, which is the most common income bracket and makes up 18.4% of all families.
| Income Bracket | # Families | % Families |
| Less than $10,000 | 4 | 1.1% |
| $10,000 to $14,999 | 0 | 0.0% |
| $15,000 to $24,999 | 30 | 8.1% |
| $25,000 to $34,999 | 39 | 10.6% |
| $35,000 to $49,999 | 49 | 13.3% |
| $50,000 to $74,999 | 62 | 16.8% |
| $75,000 to $99,999 | 67 | 18.2% |
| $100,000 to $149,999 | 68 | 18.4% |
| $150,000 to $199,999 | 32 | 8.7% |
| $200,000+ | 18 | 4.9% |
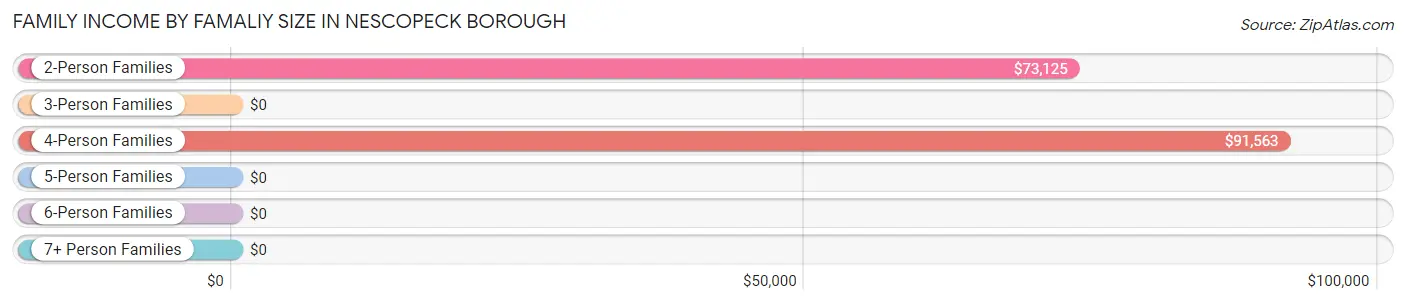
Family Income by Famaliy Size in Nescopeck borough
4-person families (43 | 11.7%) account for the highest median family income in Nescopeck borough with $91,563 per family, while 2-person families (204 | 55.3%) have the highest median income of $36,562 per family member.
| Income Bracket | # Families | Median Income |
| 2-Person Families | 204 (55.3%) | $73,125 |
| 3-Person Families | 86 (23.3%) | $0 |
| 4-Person Families | 43 (11.7%) | $91,563 |
| 5-Person Families | 9 (2.4%) | $0 |
| 6-Person Families | 27 (7.3%) | $0 |
| 7+ Person Families | 0 (0.0%) | $0 |
| Total | 369 (100.0%) | $75,114 |
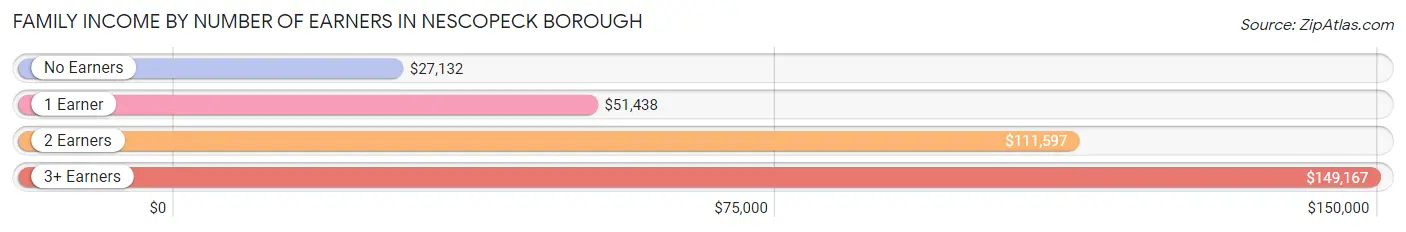
Family Income by Number of Earners in Nescopeck borough
The median family income in Nescopeck borough is $75,114, with families comprising 3+ earners (38) having the highest median family income of $149,167, while families with no earners (65) have the lowest median family income of $27,132, accounting for 10.3% and 17.6% of families, respectively.
| Number of Earners | # Families | Median Income |
| No Earners | 65 (17.6%) | $27,132 |
| 1 Earner | 159 (43.1%) | $51,438 |
| 2 Earners | 107 (29.0%) | $111,597 |
| 3+ Earners | 38 (10.3%) | $149,167 |
| Total | 369 (100.0%) | $75,114 |
Household Income in Nescopeck borough
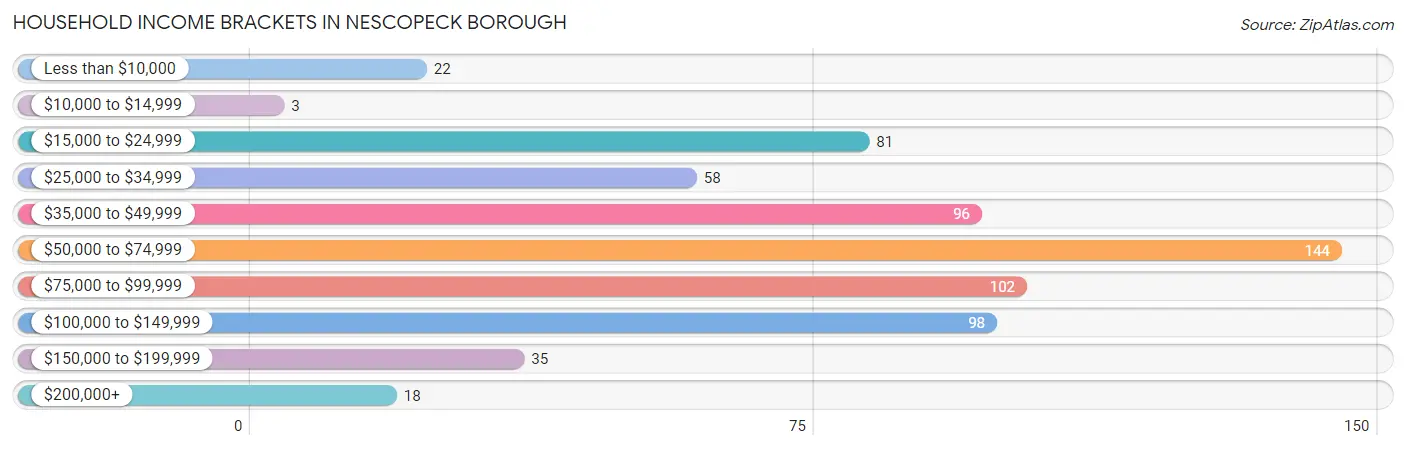
Household Income Brackets in Nescopeck borough
With 144 households falling in the category, the $50,000 to $74,999 income range is the most frequent in Nescopeck borough, accounting for 21.9% of all households. In contrast, only 3 households (0.5%) fall into the $10,000 to $14,999 income bracket, making it the least populous group.
| Income Bracket | # Households | % Households |
| Less than $10,000 | 22 | 3.3% |
| $10,000 to $14,999 | 3 | 0.5% |
| $15,000 to $24,999 | 81 | 12.3% |
| $25,000 to $34,999 | 58 | 8.8% |
| $35,000 to $49,999 | 96 | 14.6% |
| $50,000 to $74,999 | 144 | 21.9% |
| $75,000 to $99,999 | 102 | 15.5% |
| $100,000 to $149,999 | 98 | 14.9% |
| $150,000 to $199,999 | 35 | 5.3% |
| $200,000+ | 18 | 2.7% |
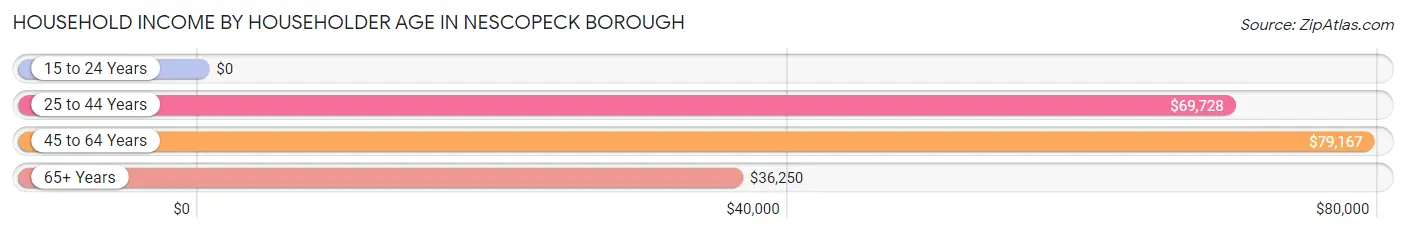
Household Income by Householder Age in Nescopeck borough
The median household income in Nescopeck borough is $59,779, with the highest median household income of $79,167 found in the 45 to 64 years age bracket for the primary householder. A total of 214 households (32.6%) fall into this category. Meanwhile, the 15 to 24 years age bracket for the primary householder has the lowest median household income of $0, with 41 households (6.2%) in this group.
| Income Bracket | # Households | Median Income |
| 15 to 24 Years | 41 (6.2%) | $0 |
| 25 to 44 Years | 161 (24.5%) | $69,728 |
| 45 to 64 Years | 214 (32.6%) | $79,167 |
| 65+ Years | 241 (36.7%) | $36,250 |
| Total | 657 (100.0%) | $59,779 |
Poverty in Nescopeck borough
Income Below Poverty by Sex and Age in Nescopeck borough
With 5.6% poverty level for males and 6.1% for females among the residents of Nescopeck borough, 18 to 24 year old males and under 5 year old females are the most vulnerable to poverty, with 13 males (30.9%) and 4 females (19.1%) in their respective age groups living below the poverty level.
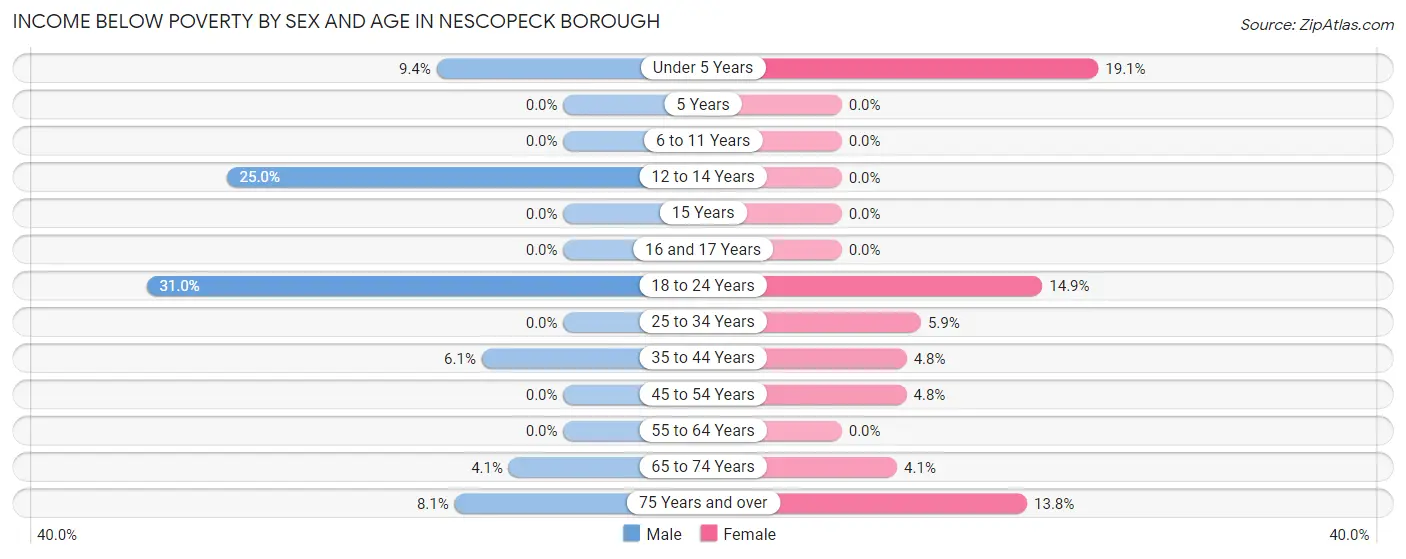
| Age Bracket | Male | Female |
| Under 5 Years | 8 (9.4%) | 4 (19.1%) |
| 5 Years | 0 (0.0%) | 0 (0.0%) |
| 6 to 11 Years | 0 (0.0%) | 0 (0.0%) |
| 12 to 14 Years | 4 (25.0%) | 0 (0.0%) |
| 15 Years | 0 (0.0%) | 0 (0.0%) |
| 16 and 17 Years | 0 (0.0%) | 0 (0.0%) |
| 18 to 24 Years | 13 (30.9%) | 7 (14.9%) |
| 25 to 34 Years | 0 (0.0%) | 5 (5.9%) |
| 35 to 44 Years | 4 (6.1%) | 4 (4.8%) |
| 45 to 54 Years | 0 (0.0%) | 5 (4.8%) |
| 55 to 64 Years | 0 (0.0%) | 0 (0.0%) |
| 65 to 74 Years | 3 (4.1%) | 3 (4.1%) |
| 75 Years and over | 8 (8.1%) | 15 (13.8%) |
| Total | 40 (5.6%) | 43 (6.1%) |
Income Above Poverty by Sex and Age in Nescopeck borough
According to the poverty statistics in Nescopeck borough, males aged 5 years and females aged 5 years are the age groups that are most secure financially, with 100.0% of males and 100.0% of females in these age groups living above the poverty line.
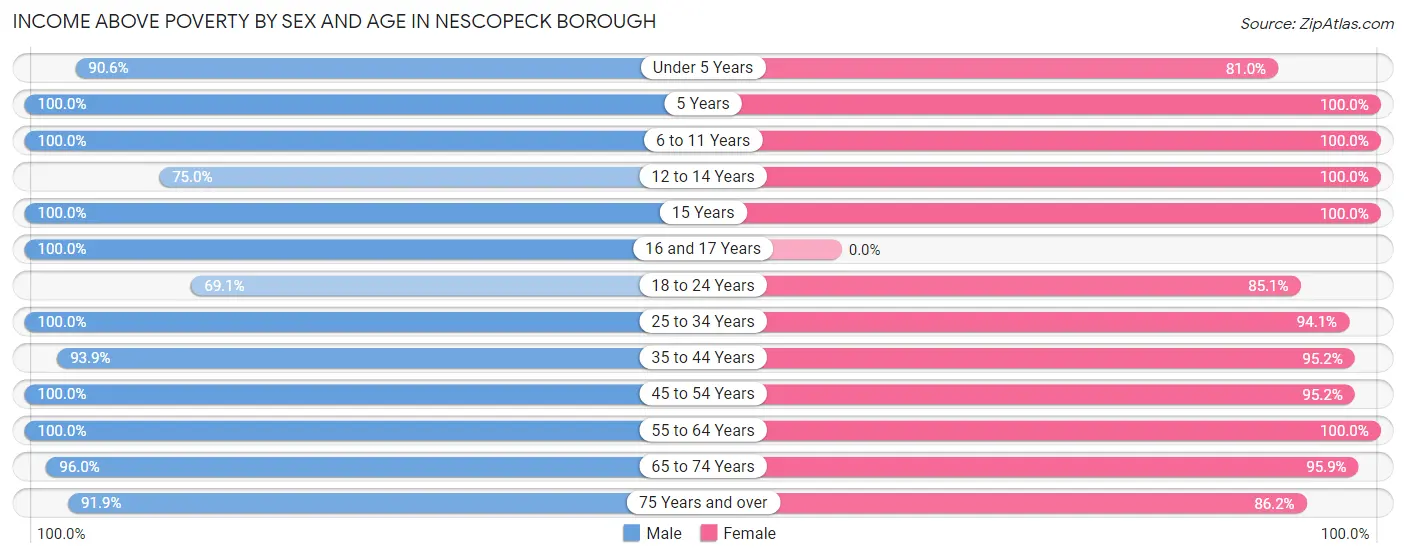
| Age Bracket | Male | Female |
| Under 5 Years | 77 (90.6%) | 17 (80.9%) |
| 5 Years | 22 (100.0%) | 26 (100.0%) |
| 6 to 11 Years | 42 (100.0%) | 33 (100.0%) |
| 12 to 14 Years | 12 (75.0%) | 28 (100.0%) |
| 15 Years | 3 (100.0%) | 12 (100.0%) |
| 16 and 17 Years | 17 (100.0%) | 0 (0.0%) |
| 18 to 24 Years | 29 (69.1%) | 40 (85.1%) |
| 25 to 34 Years | 98 (100.0%) | 80 (94.1%) |
| 35 to 44 Years | 62 (93.9%) | 79 (95.2%) |
| 45 to 54 Years | 89 (100.0%) | 99 (95.2%) |
| 55 to 64 Years | 64 (100.0%) | 84 (100.0%) |
| 65 to 74 Years | 71 (96.0%) | 70 (95.9%) |
| 75 Years and over | 91 (91.9%) | 94 (86.2%) |
| Total | 677 (94.4%) | 662 (93.9%) |
Income Below Poverty Among Married-Couple Families in Nescopeck borough
The poverty statistics for married-couple families in Nescopeck borough show that 6.4% or 19 of the total 295 families live below the poverty line. Families with no children have the highest poverty rate of 7.8%, comprising of 15 families. On the other hand, families with 3 or 4 children have the lowest poverty rate of 0.0%, which includes 0 families.
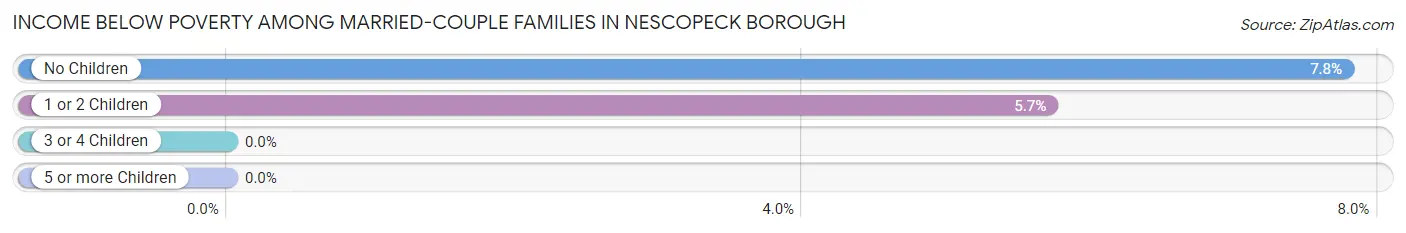
| Children | Above Poverty | Below Poverty |
| No Children | 178 (92.2%) | 15 (7.8%) |
| 1 or 2 Children | 66 (94.3%) | 4 (5.7%) |
| 3 or 4 Children | 32 (100.0%) | 0 (0.0%) |
| 5 or more Children | 0 (0.0%) | 0 (0.0%) |
| Total | 276 (93.6%) | 19 (6.4%) |
Income Below Poverty Among Single-Parent Households in Nescopeck borough
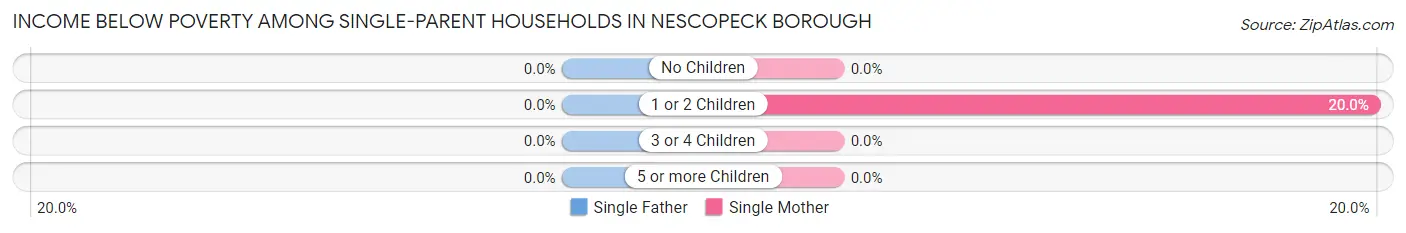
| Children | Single Father | Single Mother |
| No Children | 0 (0.0%) | 0 (0.0%) |
| 1 or 2 Children | 0 (0.0%) | 7 (20.0%) |
| 3 or 4 Children | 0 (0.0%) | 0 (0.0%) |
| 5 or more Children | 0 (0.0%) | 0 (0.0%) |
| Total | 0 (0.0%) | 7 (12.5%) |
Income Below Poverty Among Married-Couple vs Single-Parent Households in Nescopeck borough
The poverty data for Nescopeck borough shows that 19 of the married-couple family households (6.4%) and 7 of the single-parent households (9.5%) are living below the poverty level. Within the married-couple family households, those with no children have the highest poverty rate, with 15 households (7.8%) falling below the poverty line. Among the single-parent households, those with 1 or 2 children have the highest poverty rate, with 7 household (17.5%) living below poverty.
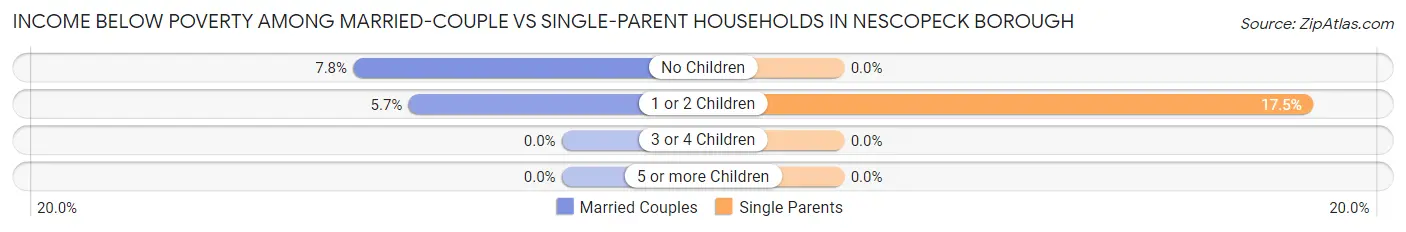
| Children | Married-Couple Families | Single-Parent Households |
| No Children | 15 (7.8%) | 0 (0.0%) |
| 1 or 2 Children | 4 (5.7%) | 7 (17.5%) |
| 3 or 4 Children | 0 (0.0%) | 0 (0.0%) |
| 5 or more Children | 0 (0.0%) | 0 (0.0%) |
| Total | 19 (6.4%) | 7 (9.5%) |
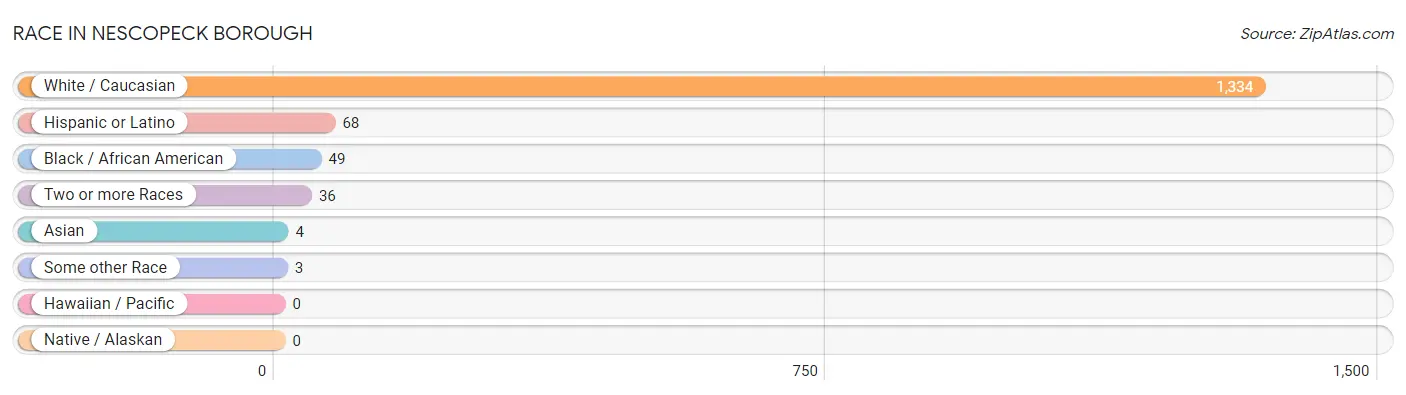
Race in Nescopeck borough
The most populous races in Nescopeck borough are White / Caucasian (1,334 | 93.5%), Hispanic or Latino (68 | 4.8%), and Black / African American (49 | 3.4%).
| Race | # Population | % Population |
| Asian | 4 | 0.3% |
| Black / African American | 49 | 3.4% |
| Hawaiian / Pacific | 0 | 0.0% |
| Hispanic or Latino | 68 | 4.8% |
| Native / Alaskan | 0 | 0.0% |
| White / Caucasian | 1,334 | 93.5% |
| Two or more Races | 36 | 2.5% |
| Some other Race | 3 | 0.2% |
| Total | 1,426 | 100.0% |
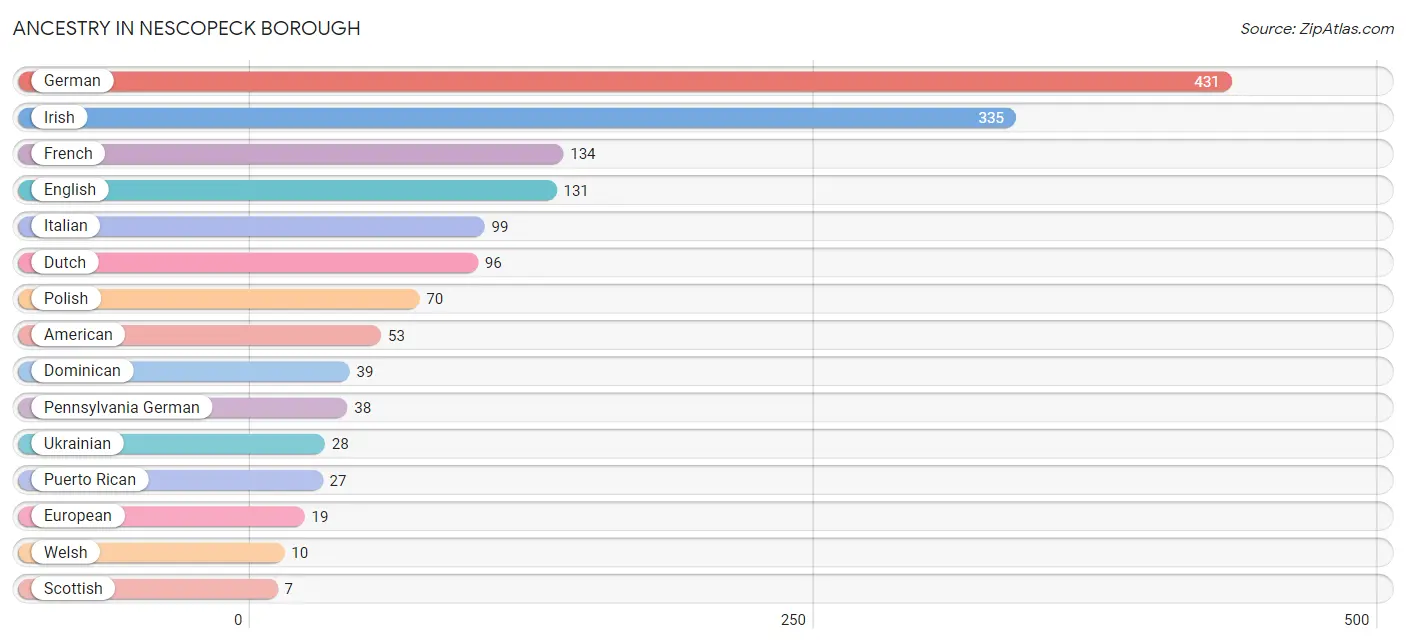
Ancestry in Nescopeck borough
The most populous ancestries reported in Nescopeck borough are German (431 | 30.2%), Irish (335 | 23.5%), French (134 | 9.4%), English (131 | 9.2%), and Italian (99 | 6.9%), together accounting for 79.2% of all Nescopeck borough residents.
| Ancestry | # Population | % Population |
| American | 53 | 3.7% |
| Arab | 2 | 0.1% |
| Austrian | 6 | 0.4% |
| British | 6 | 0.4% |
| Colombian | 2 | 0.1% |
| Czech | 2 | 0.1% |
| Danish | 3 | 0.2% |
| Dominican | 39 | 2.7% |
| Dutch | 96 | 6.7% |
| English | 131 | 9.2% |
| European | 19 | 1.3% |
| French | 134 | 9.4% |
| German | 431 | 30.2% |
| Greek | 4 | 0.3% |
| Hungarian | 1 | 0.1% |
| Irish | 335 | 23.5% |
| Iroquois | 2 | 0.1% |
| Italian | 99 | 6.9% |
| Lebanese | 2 | 0.1% |
| Lithuanian | 4 | 0.3% |
| Pennsylvania German | 38 | 2.7% |
| Polish | 70 | 4.9% |
| Puerto Rican | 27 | 1.9% |
| Russian | 3 | 0.2% |
| Scandinavian | 2 | 0.1% |
| Scottish | 7 | 0.5% |
| South American | 2 | 0.1% |
| Swedish | 5 | 0.4% |
| Syrian | 2 | 0.1% |
| Ukrainian | 28 | 2.0% |
| Welsh | 10 | 0.7% | View All 31 Rows |
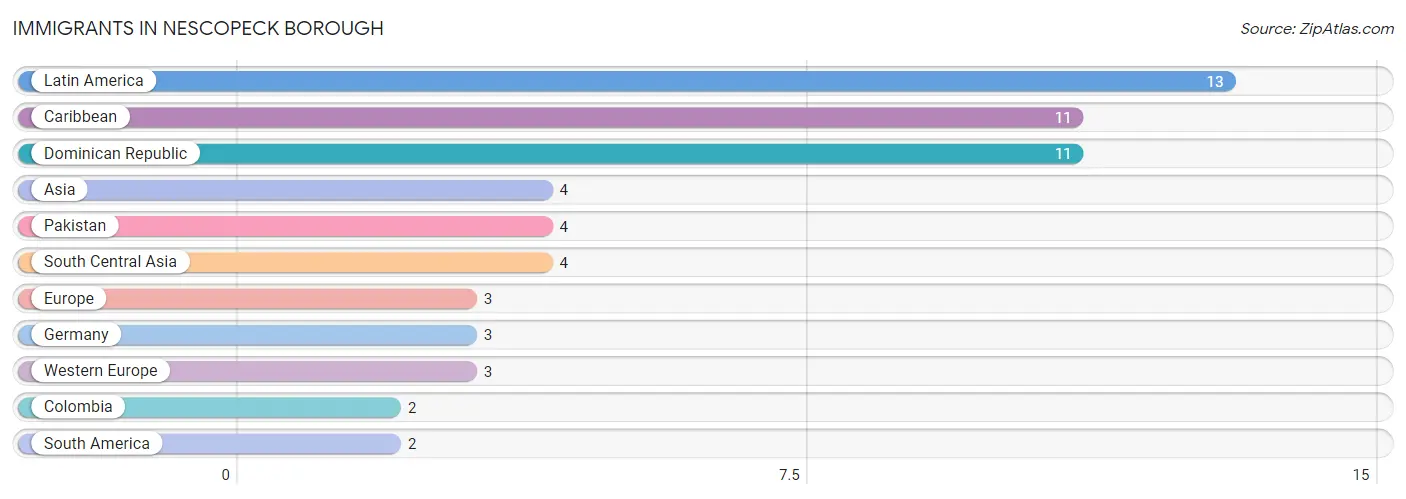
Immigrants in Nescopeck borough
The most numerous immigrant groups reported in Nescopeck borough came from Latin America (13 | 0.9%), Caribbean (11 | 0.8%), Dominican Republic (11 | 0.8%), Asia (4 | 0.3%), and Pakistan (4 | 0.3%), together accounting for 3.0% of all Nescopeck borough residents.
| Immigration Origin | # Population | % Population |
| Asia | 4 | 0.3% |
| Caribbean | 11 | 0.8% |
| Colombia | 2 | 0.1% |
| Dominican Republic | 11 | 0.8% |
| Europe | 3 | 0.2% |
| Germany | 3 | 0.2% |
| Latin America | 13 | 0.9% |
| Pakistan | 4 | 0.3% |
| South America | 2 | 0.1% |
| South Central Asia | 4 | 0.3% |
| Western Europe | 3 | 0.2% | View All 11 Rows |
Sex and Age in Nescopeck borough
Sex and Age in Nescopeck borough
The most populous age groups in Nescopeck borough are Under 5 Years (85 | 11.8%) for men and 85 Years and over (84 | 11.9%) for women.
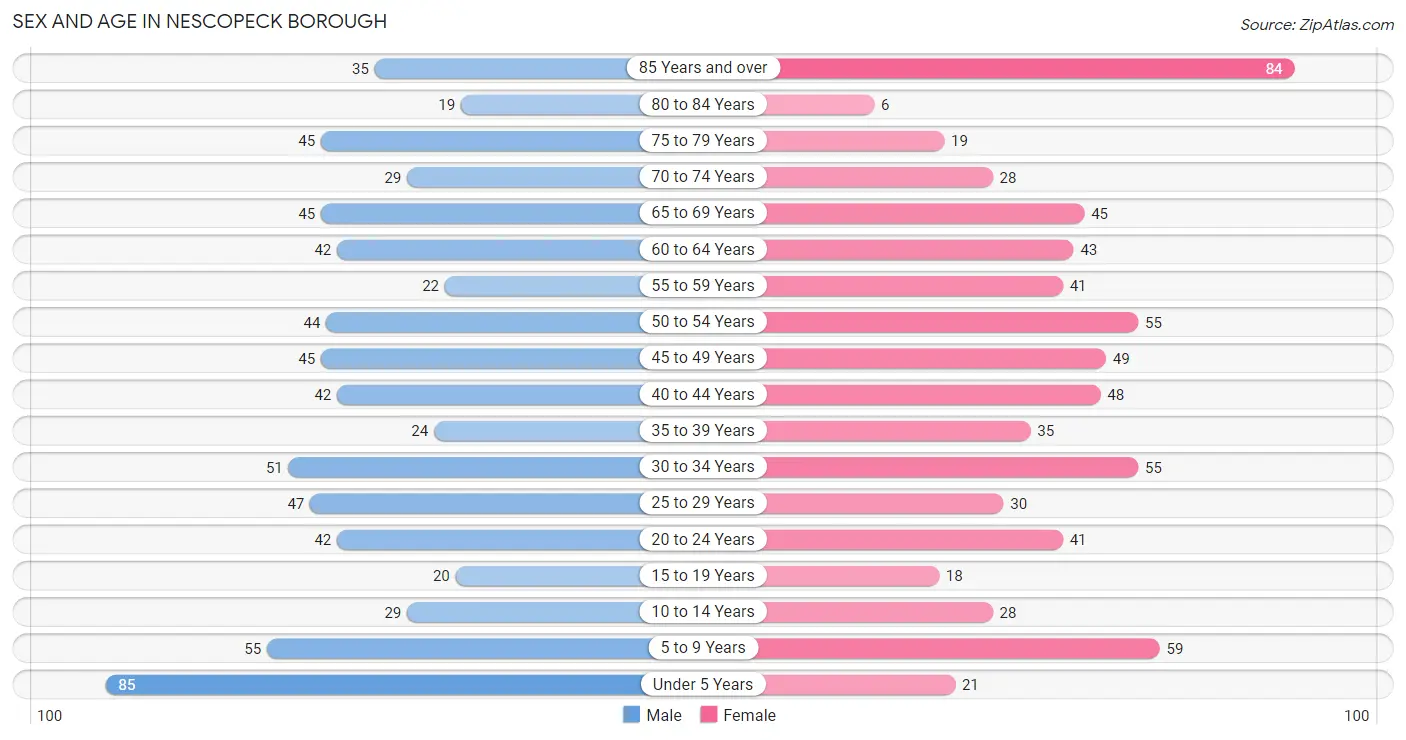
| Age Bracket | Male | Female |
| Under 5 Years | 85 (11.8%) | 21 (3.0%) |
| 5 to 9 Years | 55 (7.6%) | 59 (8.4%) |
| 10 to 14 Years | 29 (4.0%) | 28 (4.0%) |
| 15 to 19 Years | 20 (2.8%) | 18 (2.5%) |
| 20 to 24 Years | 42 (5.8%) | 41 (5.8%) |
| 25 to 29 Years | 47 (6.5%) | 30 (4.3%) |
| 30 to 34 Years | 51 (7.1%) | 55 (7.8%) |
| 35 to 39 Years | 24 (3.3%) | 35 (5.0%) |
| 40 to 44 Years | 42 (5.8%) | 48 (6.8%) |
| 45 to 49 Years | 45 (6.2%) | 49 (7.0%) |
| 50 to 54 Years | 44 (6.1%) | 55 (7.8%) |
| 55 to 59 Years | 22 (3.0%) | 41 (5.8%) |
| 60 to 64 Years | 42 (5.8%) | 43 (6.1%) |
| 65 to 69 Years | 45 (6.2%) | 45 (6.4%) |
| 70 to 74 Years | 29 (4.0%) | 28 (4.0%) |
| 75 to 79 Years | 45 (6.2%) | 19 (2.7%) |
| 80 to 84 Years | 19 (2.6%) | 6 (0.9%) |
| 85 Years and over | 35 (4.9%) | 84 (11.9%) |
| Total | 721 (100.0%) | 705 (100.0%) |
Families and Households in Nescopeck borough
Median Family Size in Nescopeck borough
The median family size in Nescopeck borough is 2.85 persons per family, with married-couple families (295 | 79.9%) accounting for the largest median family size of 2.92 persons per family. On the other hand, single male/father families (18 | 4.9%) represent the smallest median family size with 2.56 persons per family.
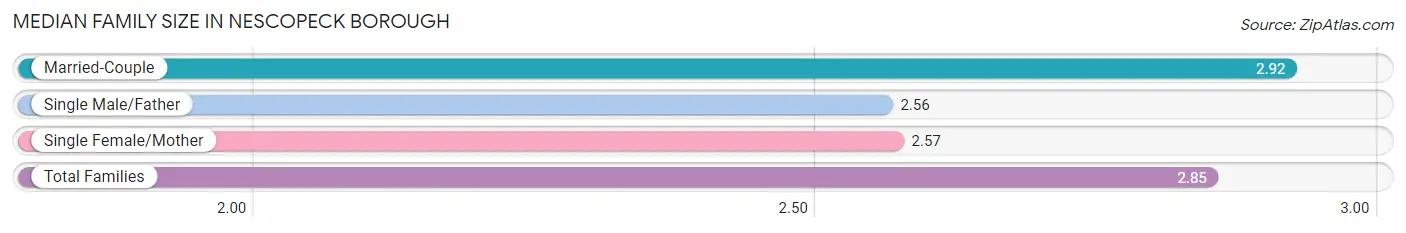
| Family Type | # Families | Family Size |
| Married-Couple | 295 (79.9%) | 2.92 |
| Single Male/Father | 18 (4.9%) | 2.56 |
| Single Female/Mother | 56 (15.2%) | 2.57 |
| Total Families | 369 (100.0%) | 2.85 |
Median Household Size in Nescopeck borough
The median household size in Nescopeck borough is 2.17 persons per household, with single male/father households (18 | 2.7%) accounting for the largest median household size of 3.22 persons per household. non-family households (288 | 43.8%) represent the smallest median household size with 1.15 persons per household.
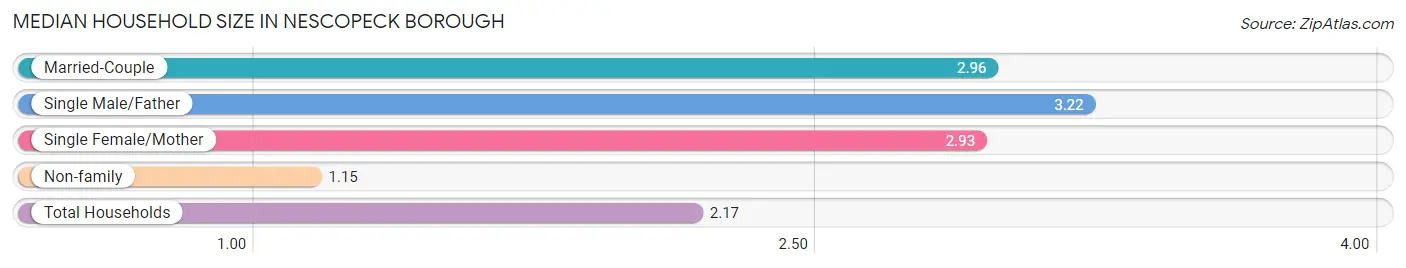
| Household Type | # Households | Household Size |
| Married-Couple | 295 (44.9%) | 2.96 |
| Single Male/Father | 18 (2.7%) | 3.22 |
| Single Female/Mother | 56 (8.5%) | 2.93 |
| Non-family | 288 (43.8%) | 1.15 |
| Total Households | 657 (100.0%) | 2.17 |
Household Size by Marriage Status in Nescopeck borough
Out of a total of 657 households in Nescopeck borough, 369 (56.2%) are family households, while 288 (43.8%) are nonfamily households. The most numerous type of family households are 2-person households, comprising 194, and the most common type of nonfamily households are 1-person households, comprising 247.
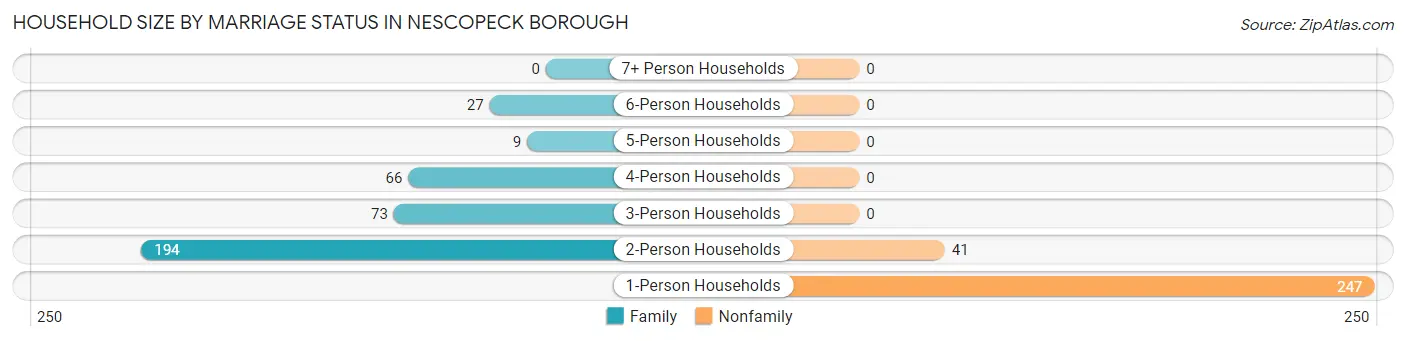
| Household Size | Family Households | Nonfamily Households |
| 1-Person Households | - | 247 (37.6%) |
| 2-Person Households | 194 (29.5%) | 41 (6.2%) |
| 3-Person Households | 73 (11.1%) | 0 (0.0%) |
| 4-Person Households | 66 (10.1%) | 0 (0.0%) |
| 5-Person Households | 9 (1.4%) | 0 (0.0%) |
| 6-Person Households | 27 (4.1%) | 0 (0.0%) |
| 7+ Person Households | 0 (0.0%) | 0 (0.0%) |
| Total | 369 (56.2%) | 288 (43.8%) |
Female Fertility in Nescopeck borough
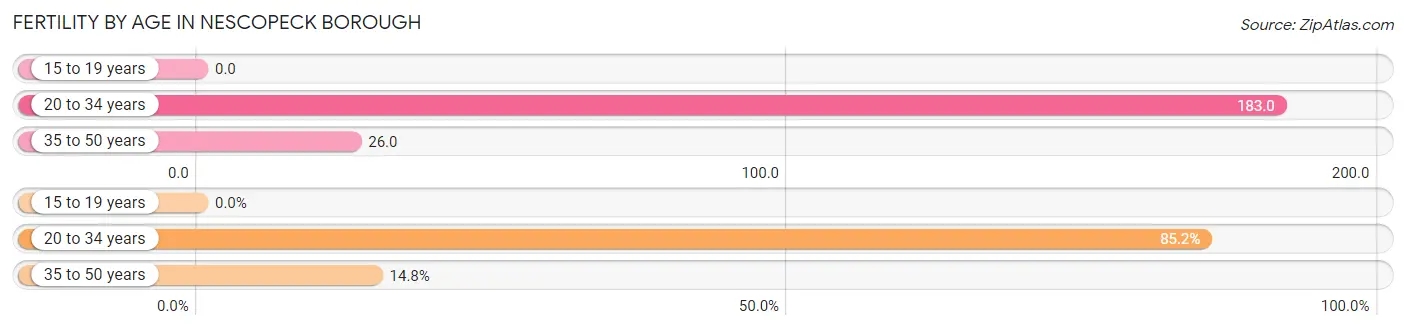
Fertility by Age in Nescopeck borough
Average fertility rate in Nescopeck borough is 90.0 births per 1,000 women. Women in the age bracket of 20 to 34 years have the highest fertility rate with 183.0 births per 1,000 women. Women in the age bracket of 20 to 34 years acount for 85.2% of all women with births.
| Age Bracket | Women with Births | Births / 1,000 Women |
| 15 to 19 years | 0 (0.0%) | 0.0 |
| 20 to 34 years | 23 (85.2%) | 183.0 |
| 35 to 50 years | 4 (14.8%) | 26.0 |
| Total | 27 (100.0%) | 90.0 |
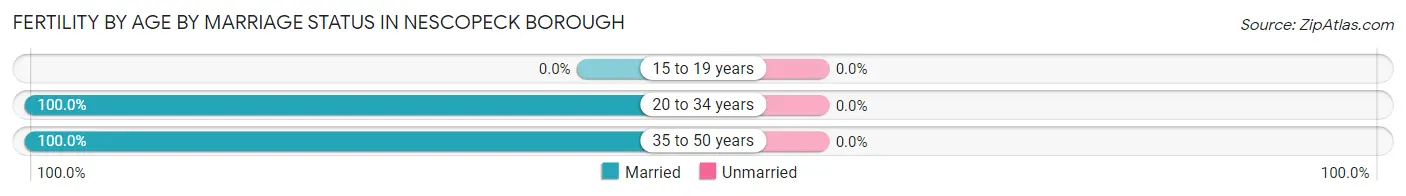
Fertility by Age by Marriage Status in Nescopeck borough
| Age Bracket | Married | Unmarried |
| 15 to 19 years | 0 (0.0%) | 0 (0.0%) |
| 20 to 34 years | 23 (100.0%) | 0 (0.0%) |
| 35 to 50 years | 4 (100.0%) | 0 (0.0%) |
| Total | 27 (100.0%) | 0 (0.0%) |
Fertility by Education in Nescopeck borough
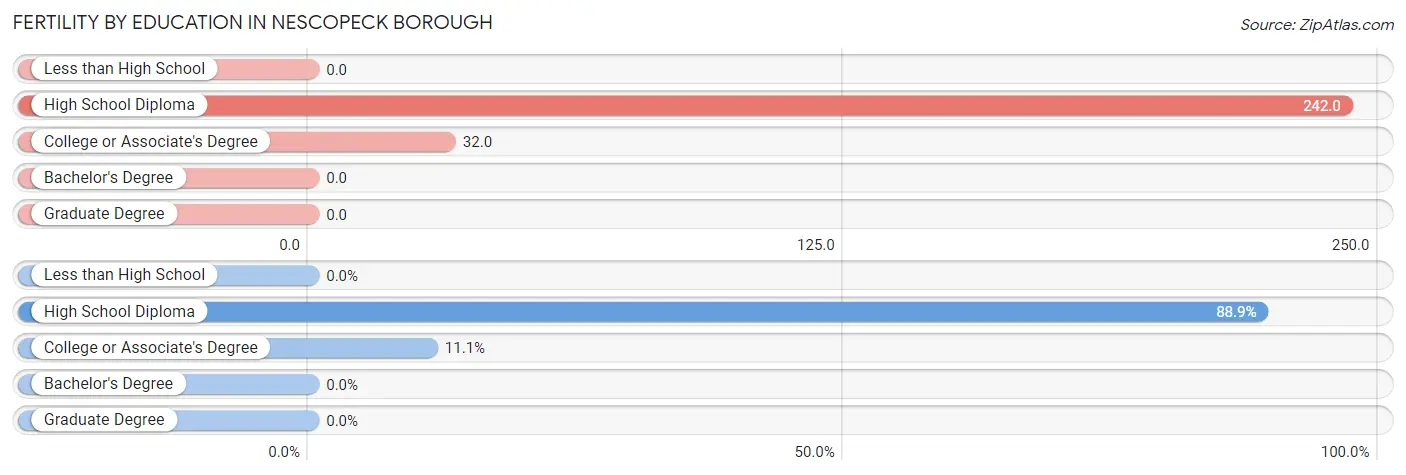
| Educational Attainment | Women with Births | Births / 1,000 Women |
| Less than High School | 0 (0.0%) | 0.0 |
| High School Diploma | 24 (88.9%) | 242.0 |
| College or Associate's Degree | 3 (11.1%) | 32.0 |
| Bachelor's Degree | 0 (0.0%) | 0.0 |
| Graduate Degree | 0 (0.0%) | 0.0 |
| Total | 27 (100.0%) | 90.0 |
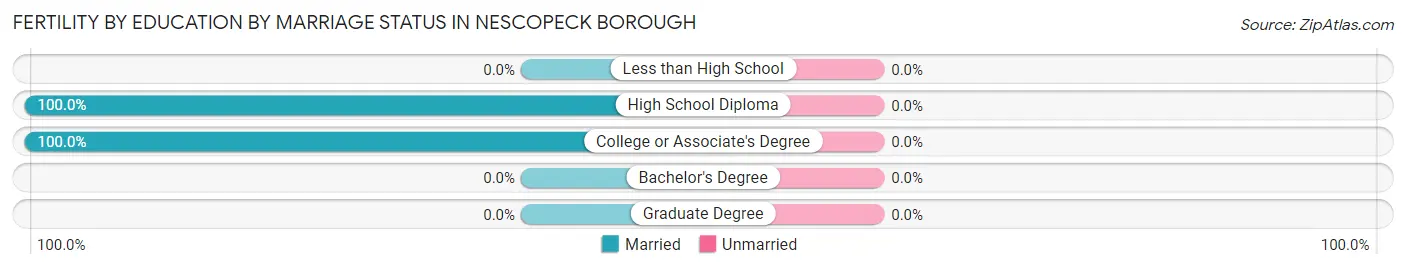
Fertility by Education by Marriage Status in Nescopeck borough
| Educational Attainment | Married | Unmarried |
| Less than High School | 0 (0.0%) | 0 (0.0%) |
| High School Diploma | 24 (100.0%) | 0 (0.0%) |
| College or Associate's Degree | 3 (100.0%) | 0 (0.0%) |
| Bachelor's Degree | 0 (0.0%) | 0 (0.0%) |
| Graduate Degree | 0 (0.0%) | 0 (0.0%) |
| Total | 27 (100.0%) | 0 (0.0%) |
Employment Characteristics in Nescopeck borough
Employment by Class of Employer in Nescopeck borough
Among the 722 employed individuals in Nescopeck borough, private company employees (482 | 66.8%), not-for-profit organizations (75 | 10.4%), and state government employees (62 | 8.6%) make up the most common classes of employment.
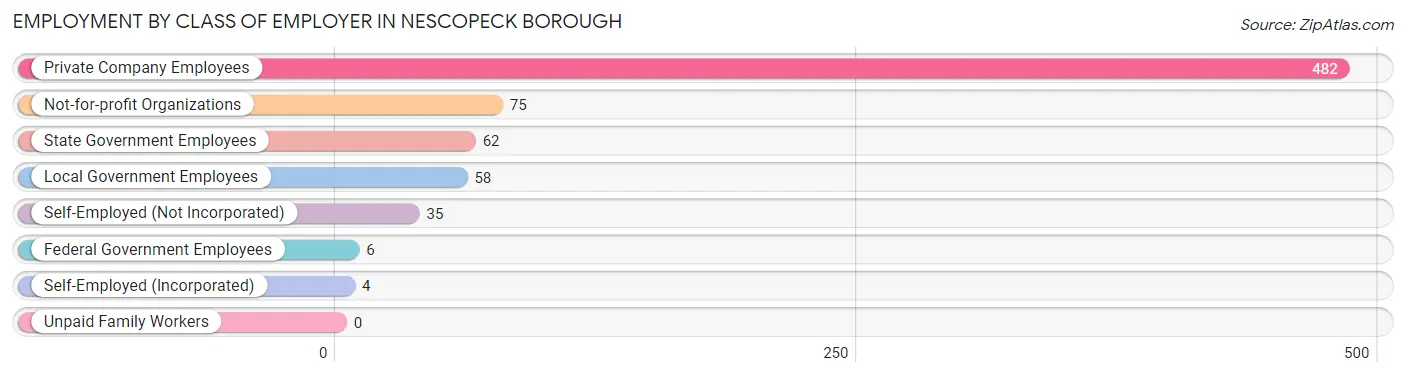
| Employer Class | # Employees | % Employees |
| Private Company Employees | 482 | 66.8% |
| Self-Employed (Incorporated) | 4 | 0.5% |
| Self-Employed (Not Incorporated) | 35 | 4.9% |
| Not-for-profit Organizations | 75 | 10.4% |
| Local Government Employees | 58 | 8.0% |
| State Government Employees | 62 | 8.6% |
| Federal Government Employees | 6 | 0.8% |
| Unpaid Family Workers | 0 | 0.0% |
| Total | 722 | 100.0% |
Employment Status by Age in Nescopeck borough
According to the labor force statistics for Nescopeck borough, out of the total population over 16 years of age (1,134), 66.4% or 753 individuals are in the labor force, with 2.9% or 22 of them unemployed. The age group with the highest labor force participation rate is 45 to 54 years, with 93.8% or 181 individuals in the labor force. Within the labor force, the 20 to 24 years age range has the highest percentage of unemployed individuals, with 30.3% or 20 of them being unemployed.
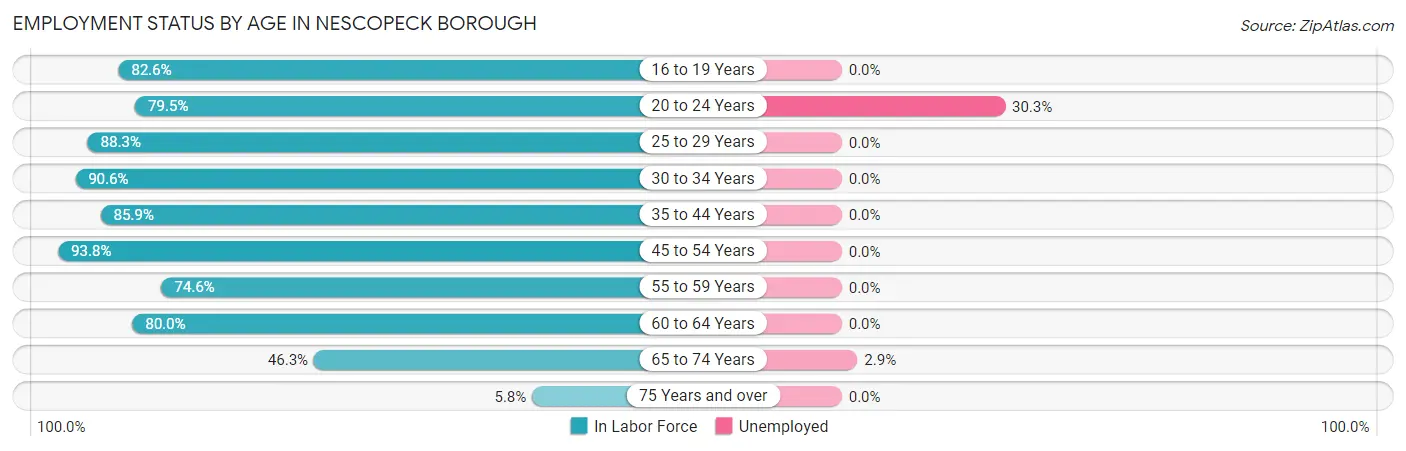
| Age Bracket | In Labor Force | Unemployed |
| 16 to 19 Years | 19 (82.6%) | 0 (0.0%) |
| 20 to 24 Years | 66 (79.5%) | 20 (30.3%) |
| 25 to 29 Years | 68 (88.3%) | 0 (0.0%) |
| 30 to 34 Years | 96 (90.6%) | 0 (0.0%) |
| 35 to 44 Years | 128 (85.9%) | 0 (0.0%) |
| 45 to 54 Years | 181 (93.8%) | 0 (0.0%) |
| 55 to 59 Years | 47 (74.6%) | 0 (0.0%) |
| 60 to 64 Years | 68 (80.0%) | 0 (0.0%) |
| 65 to 74 Years | 68 (46.3%) | 2 (2.9%) |
| 75 Years and over | 12 (5.8%) | 0 (0.0%) |
| Total | 753 (66.4%) | 22 (2.9%) |
Employment Status by Educational Attainment in Nescopeck borough
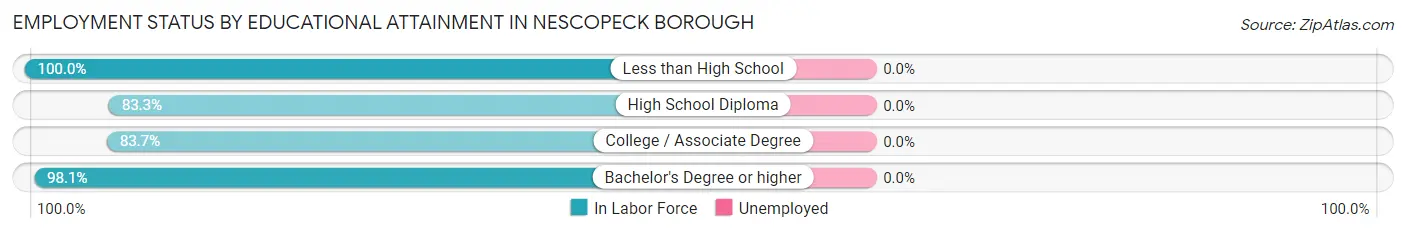
| Educational Attainment | In Labor Force | Unemployed |
| Less than High School | 19 (100.0%) | 0 (0.0%) |
| High School Diploma | 239 (83.3%) | 0 (0.0%) |
| College / Associate Degree | 175 (83.7%) | 0 (0.0%) |
| Bachelor's Degree or higher | 155 (98.1%) | 0 (0.0%) |
| Total | 588 (87.4%) | 0 (0.0%) |
Employment Occupations by Sex in Nescopeck borough
Management, Business, Science and Arts Occupations
The most common Management, Business, Science and Arts occupations in Nescopeck borough are Community & Social Service (85 | 11.6%), Health Diagnosing & Treating (64 | 8.8%), Education Instruction & Library (61 | 8.3%), Management (57 | 7.8%), and Health Technologists (46 | 6.3%).
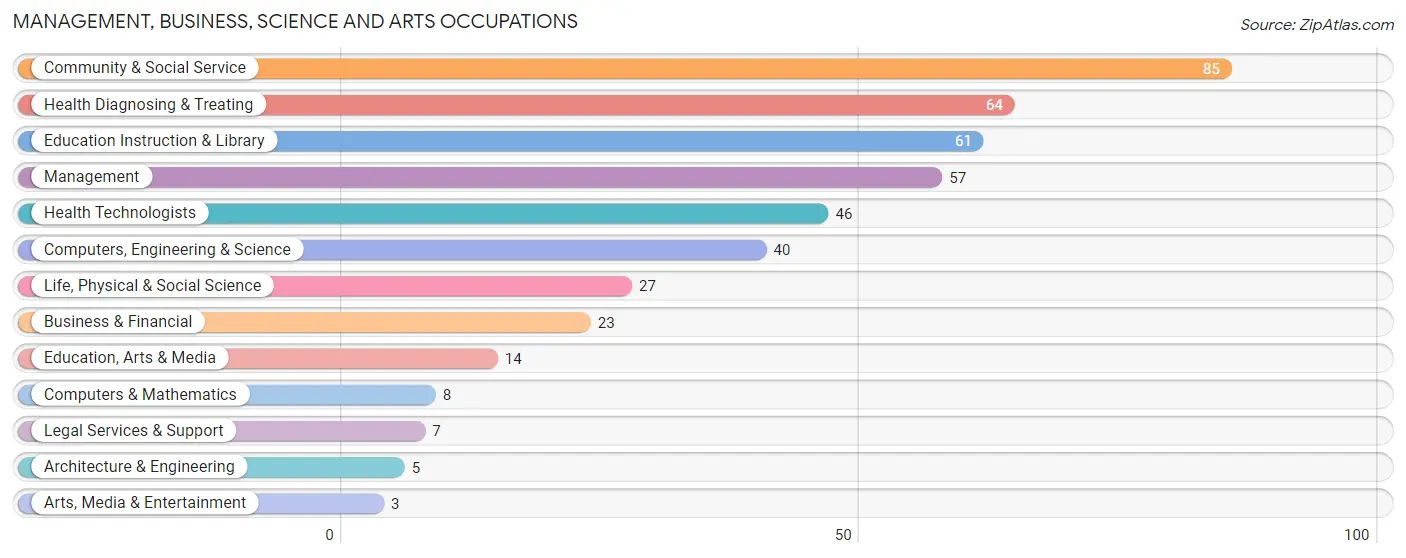
Management, Business, Science and Arts Occupations by Sex
Within the Management, Business, Science and Arts occupations in Nescopeck borough, the most male-oriented occupations are Computers & Mathematics (100.0%), Education, Arts & Media (85.7%), and Life, Physical & Social Science (77.8%), while the most female-oriented occupations are Arts, Media & Entertainment (100.0%), Health Diagnosing & Treating (71.9%), and Health Technologists (67.4%).
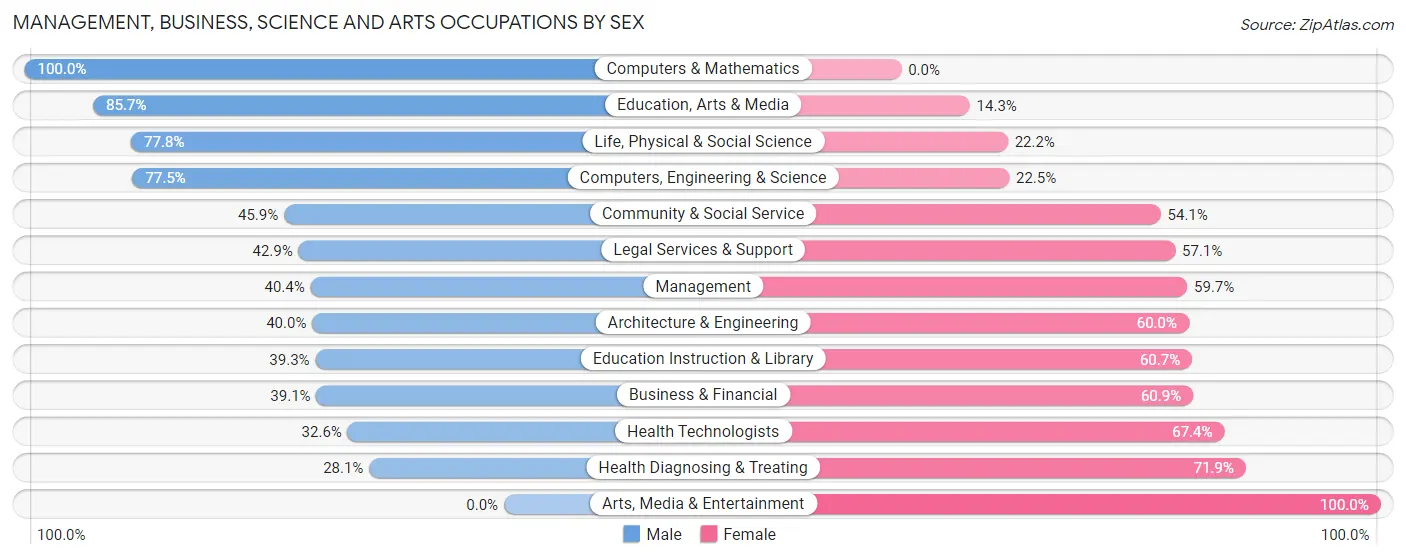
| Occupation | Male | Female |
| Management | 23 (40.4%) | 34 (59.7%) |
| Business & Financial | 9 (39.1%) | 14 (60.9%) |
| Computers, Engineering & Science | 31 (77.5%) | 9 (22.5%) |
| Computers & Mathematics | 8 (100.0%) | 0 (0.0%) |
| Architecture & Engineering | 2 (40.0%) | 3 (60.0%) |
| Life, Physical & Social Science | 21 (77.8%) | 6 (22.2%) |
| Community & Social Service | 39 (45.9%) | 46 (54.1%) |
| Education, Arts & Media | 12 (85.7%) | 2 (14.3%) |
| Legal Services & Support | 3 (42.9%) | 4 (57.1%) |
| Education Instruction & Library | 24 (39.3%) | 37 (60.7%) |
| Arts, Media & Entertainment | 0 (0.0%) | 3 (100.0%) |
| Health Diagnosing & Treating | 18 (28.1%) | 46 (71.9%) |
| Health Technologists | 15 (32.6%) | 31 (67.4%) |
| Total (Category) | 120 (44.6%) | 149 (55.4%) |
| Total (Overall) | 390 (53.3%) | 341 (46.7%) |
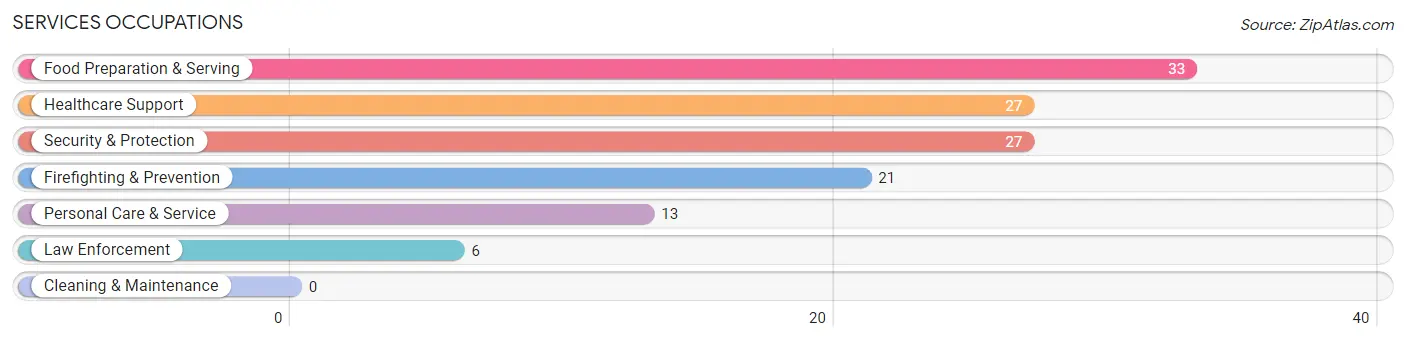
Services Occupations
The most common Services occupations in Nescopeck borough are Food Preparation & Serving (33 | 4.5%), Healthcare Support (27 | 3.7%), Security & Protection (27 | 3.7%), Firefighting & Prevention (21 | 2.9%), and Personal Care & Service (13 | 1.8%).
Services Occupations by Sex
Within the Services occupations in Nescopeck borough, the most male-oriented occupations are Security & Protection (100.0%), Firefighting & Prevention (100.0%), and Law Enforcement (100.0%), while the most female-oriented occupations are Personal Care & Service (100.0%), Food Preparation & Serving (54.5%), and Healthcare Support (33.3%).
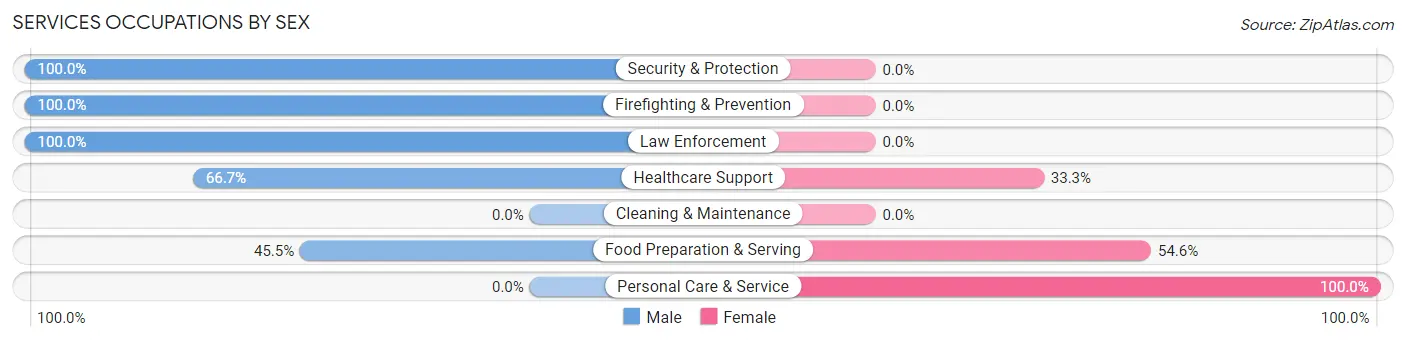
| Occupation | Male | Female |
| Healthcare Support | 18 (66.7%) | 9 (33.3%) |
| Security & Protection | 27 (100.0%) | 0 (0.0%) |
| Firefighting & Prevention | 21 (100.0%) | 0 (0.0%) |
| Law Enforcement | 6 (100.0%) | 0 (0.0%) |
| Food Preparation & Serving | 15 (45.5%) | 18 (54.5%) |
| Cleaning & Maintenance | 0 (0.0%) | 0 (0.0%) |
| Personal Care & Service | 0 (0.0%) | 13 (100.0%) |
| Total (Category) | 60 (60.0%) | 40 (40.0%) |
| Total (Overall) | 390 (53.3%) | 341 (46.7%) |
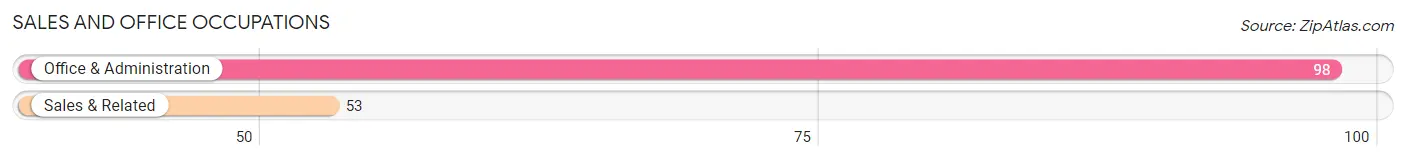
Sales and Office Occupations
The most common Sales and Office occupations in Nescopeck borough are Office & Administration (98 | 13.4%), and Sales & Related (53 | 7.2%).
Sales and Office Occupations by Sex
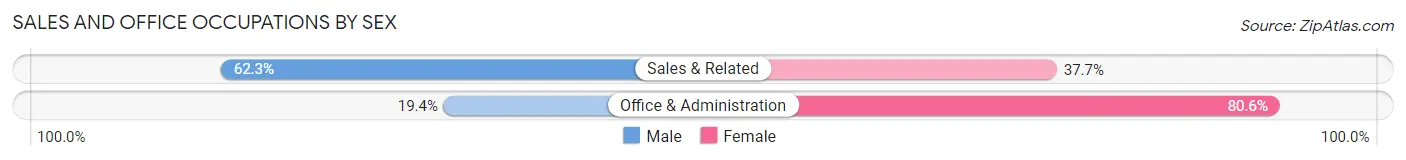
| Occupation | Male | Female |
| Sales & Related | 33 (62.3%) | 20 (37.7%) |
| Office & Administration | 19 (19.4%) | 79 (80.6%) |
| Total (Category) | 52 (34.4%) | 99 (65.6%) |
| Total (Overall) | 390 (53.3%) | 341 (46.7%) |
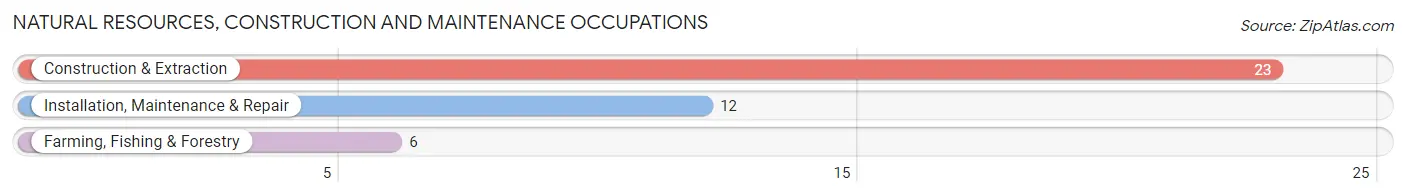
Natural Resources, Construction and Maintenance Occupations
The most common Natural Resources, Construction and Maintenance occupations in Nescopeck borough are Construction & Extraction (23 | 3.2%), Installation, Maintenance & Repair (12 | 1.6%), and Farming, Fishing & Forestry (6 | 0.8%).
Natural Resources, Construction and Maintenance Occupations by Sex
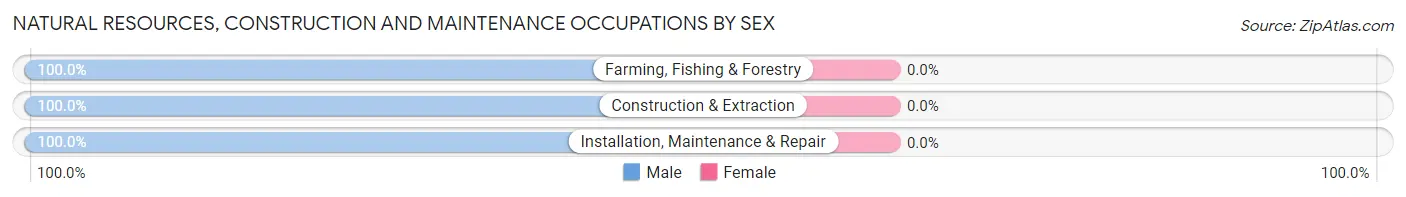
| Occupation | Male | Female |
| Farming, Fishing & Forestry | 6 (100.0%) | 0 (0.0%) |
| Construction & Extraction | 23 (100.0%) | 0 (0.0%) |
| Installation, Maintenance & Repair | 12 (100.0%) | 0 (0.0%) |
| Total (Category) | 41 (100.0%) | 0 (0.0%) |
| Total (Overall) | 390 (53.3%) | 341 (46.7%) |
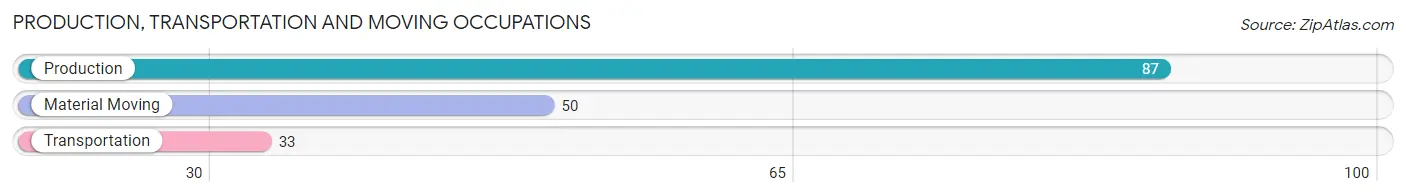
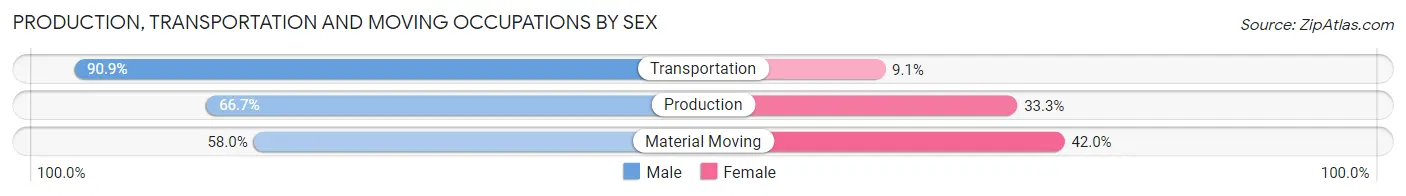
Production, Transportation and Moving Occupations
The most common Production, Transportation and Moving occupations in Nescopeck borough are Production (87 | 11.9%), Material Moving (50 | 6.8%), and Transportation (33 | 4.5%).
Production, Transportation and Moving Occupations by Sex
| Occupation | Male | Female |
| Production | 58 (66.7%) | 29 (33.3%) |
| Transportation | 30 (90.9%) | 3 (9.1%) |
| Material Moving | 29 (58.0%) | 21 (42.0%) |
| Total (Category) | 117 (68.8%) | 53 (31.2%) |
| Total (Overall) | 390 (53.3%) | 341 (46.7%) |
Employment Industries by Sex in Nescopeck borough
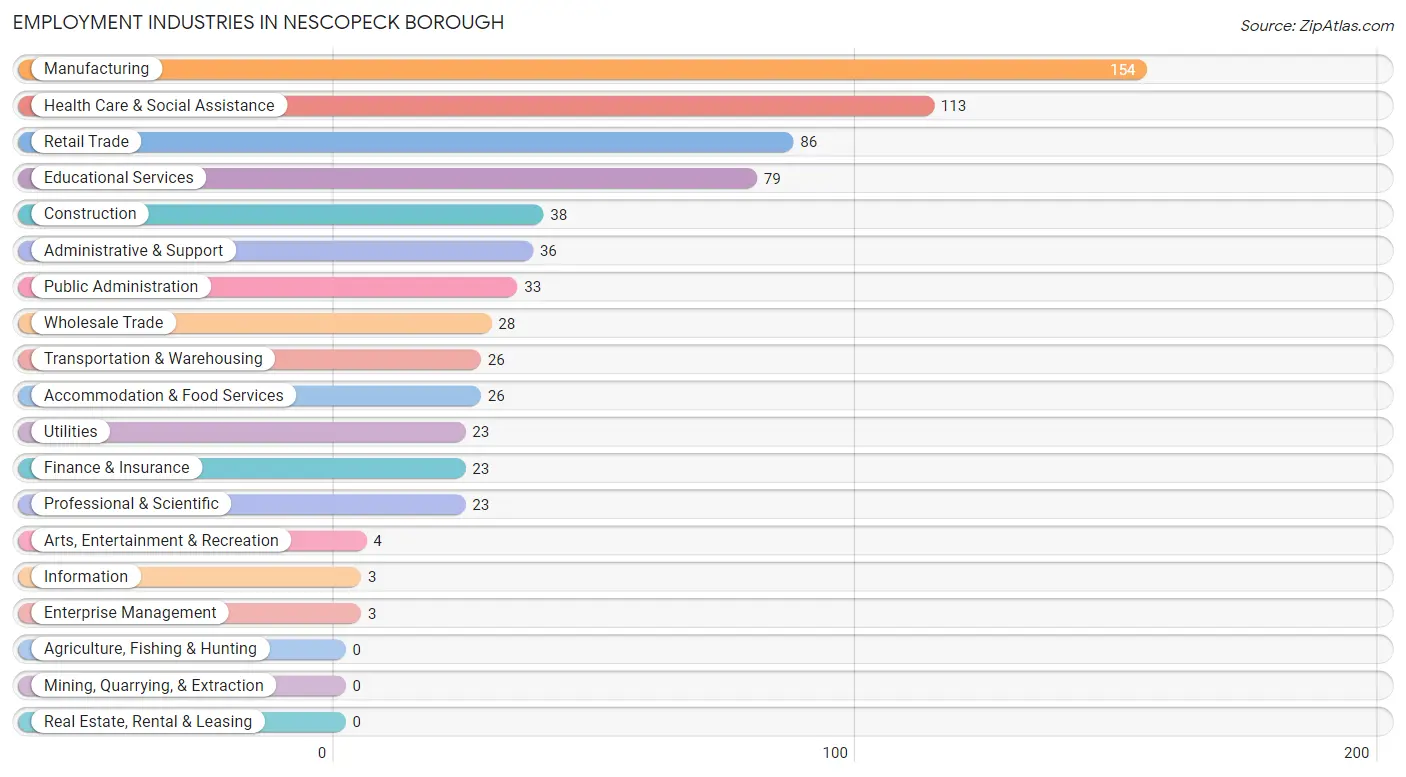
Employment Industries in Nescopeck borough
The major employment industries in Nescopeck borough include Manufacturing (154 | 21.1%), Health Care & Social Assistance (113 | 15.5%), Retail Trade (86 | 11.8%), Educational Services (79 | 10.8%), and Construction (38 | 5.2%).
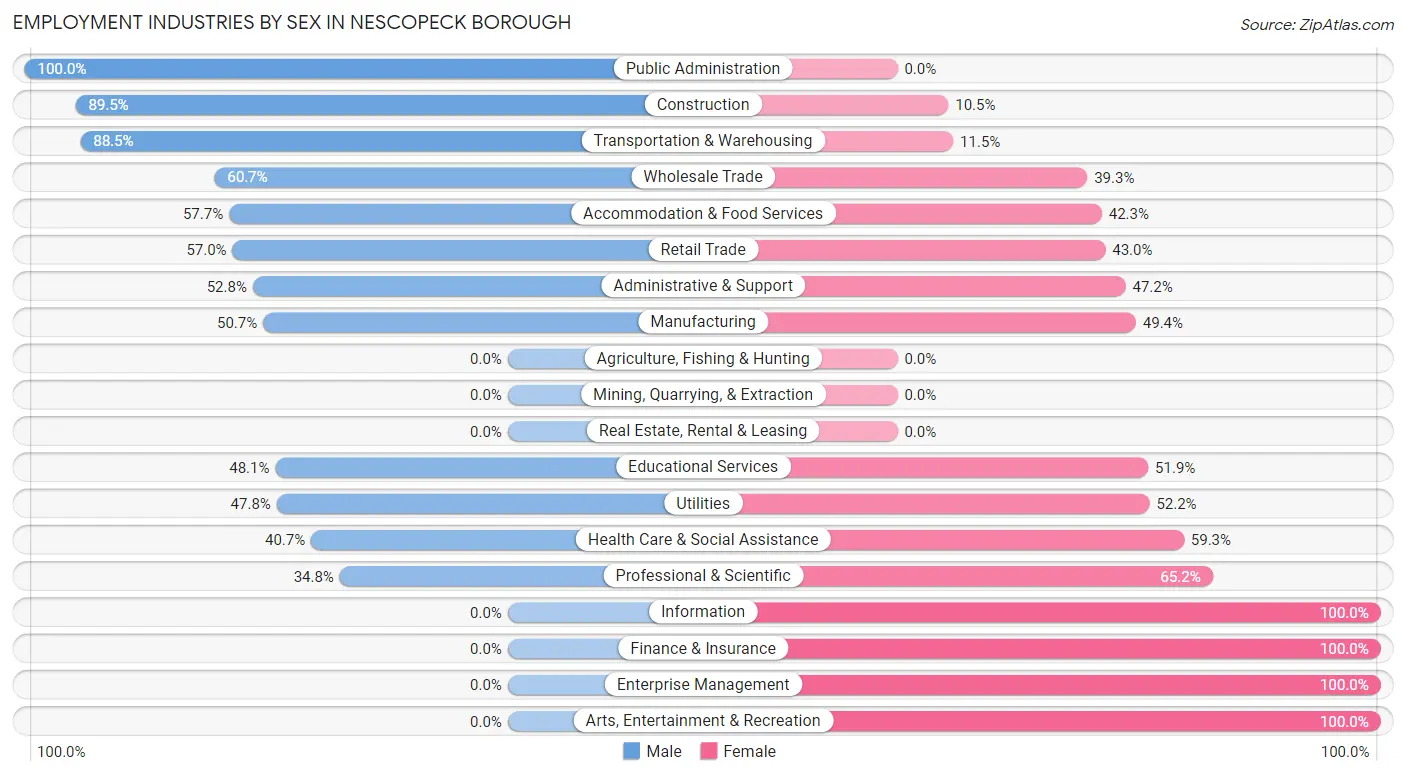
Employment Industries by Sex in Nescopeck borough
The Nescopeck borough industries that see more men than women are Public Administration (100.0%), Construction (89.5%), and Transportation & Warehousing (88.5%), whereas the industries that tend to have a higher number of women are Information (100.0%), Finance & Insurance (100.0%), and Enterprise Management (100.0%).
| Industry | Male | Female |
| Agriculture, Fishing & Hunting | 0 (0.0%) | 0 (0.0%) |
| Mining, Quarrying, & Extraction | 0 (0.0%) | 0 (0.0%) |
| Construction | 34 (89.5%) | 4 (10.5%) |
| Manufacturing | 78 (50.6%) | 76 (49.3%) |
| Wholesale Trade | 17 (60.7%) | 11 (39.3%) |
| Retail Trade | 49 (57.0%) | 37 (43.0%) |
| Transportation & Warehousing | 23 (88.5%) | 3 (11.5%) |
| Utilities | 11 (47.8%) | 12 (52.2%) |
| Information | 0 (0.0%) | 3 (100.0%) |
| Finance & Insurance | 0 (0.0%) | 23 (100.0%) |
| Real Estate, Rental & Leasing | 0 (0.0%) | 0 (0.0%) |
| Professional & Scientific | 8 (34.8%) | 15 (65.2%) |
| Enterprise Management | 0 (0.0%) | 3 (100.0%) |
| Administrative & Support | 19 (52.8%) | 17 (47.2%) |
| Educational Services | 38 (48.1%) | 41 (51.9%) |
| Health Care & Social Assistance | 46 (40.7%) | 67 (59.3%) |
| Arts, Entertainment & Recreation | 0 (0.0%) | 4 (100.0%) |
| Accommodation & Food Services | 15 (57.7%) | 11 (42.3%) |
| Public Administration | 33 (100.0%) | 0 (0.0%) |
| Total | 390 (53.3%) | 341 (46.7%) |
Education in Nescopeck borough
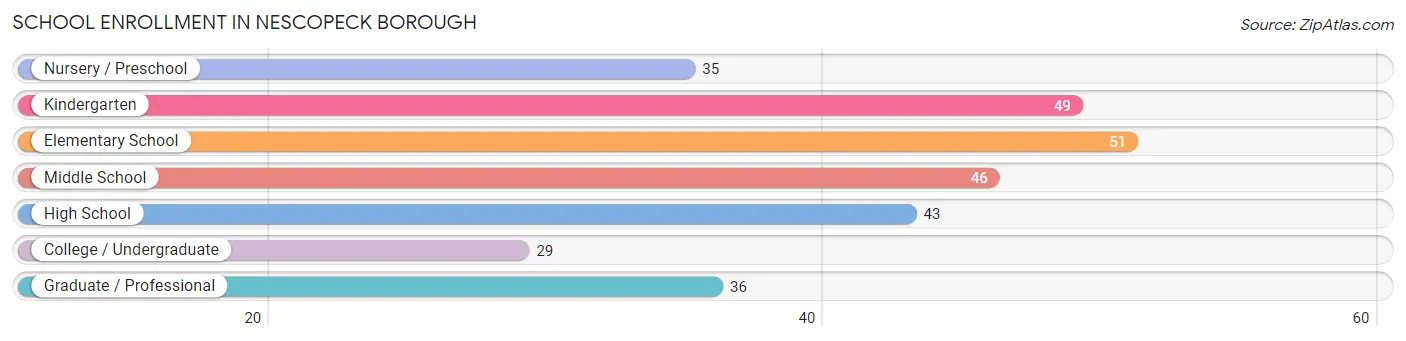
School Enrollment in Nescopeck borough
The most common levels of schooling among the 289 students in Nescopeck borough are elementary school (51 | 17.6%), kindergarten (49 | 17.0%), and middle school (46 | 15.9%).
| School Level | # Students | % Students |
| Nursery / Preschool | 35 | 12.1% |
| Kindergarten | 49 | 17.0% |
| Elementary School | 51 | 17.6% |
| Middle School | 46 | 15.9% |
| High School | 43 | 14.9% |
| College / Undergraduate | 29 | 10.0% |
| Graduate / Professional | 36 | 12.5% |
| Total | 289 | 100.0% |
School Enrollment by Age by Funding Source in Nescopeck borough
Out of a total of 289 students who are enrolled in schools in Nescopeck borough, 35 (12.1%) attend a private institution, while the remaining 254 (87.9%) are enrolled in public schools. The age group of 25 to 34 year olds has the highest likelihood of being enrolled in private schools, with 21 (75.0% in the age bracket) enrolled. Conversely, the age group of 3 to 4 year olds has the lowest likelihood of being enrolled in a private school, with 31 (100.0% in the age bracket) attending a public institution.
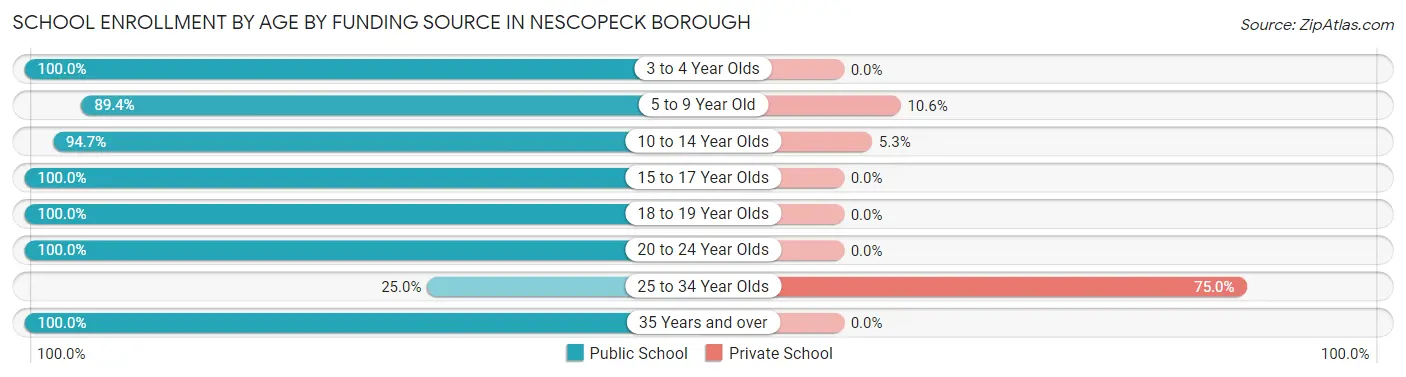
| Age Bracket | Public School | Private School |
| 3 to 4 Year Olds | 31 (100.0%) | 0 (0.0%) |
| 5 to 9 Year Old | 93 (89.4%) | 11 (10.6%) |
| 10 to 14 Year Olds | 54 (94.7%) | 3 (5.3%) |
| 15 to 17 Year Olds | 32 (100.0%) | 0 (0.0%) |
| 18 to 19 Year Olds | 6 (100.0%) | 0 (0.0%) |
| 20 to 24 Year Olds | 17 (100.0%) | 0 (0.0%) |
| 25 to 34 Year Olds | 7 (25.0%) | 21 (75.0%) |
| 35 Years and over | 14 (100.0%) | 0 (0.0%) |
| Total | 254 (87.9%) | 35 (12.1%) |
Educational Attainment by Field of Study in Nescopeck borough
Bio, nature & agricultural (47 | 18.8%), education (43 | 17.2%), science & technology (33 | 13.2%), business (33 | 13.2%), and physical & health sciences (26 | 10.4%) are the most common fields of study among 250 individuals in Nescopeck borough who have obtained a bachelor's degree or higher.
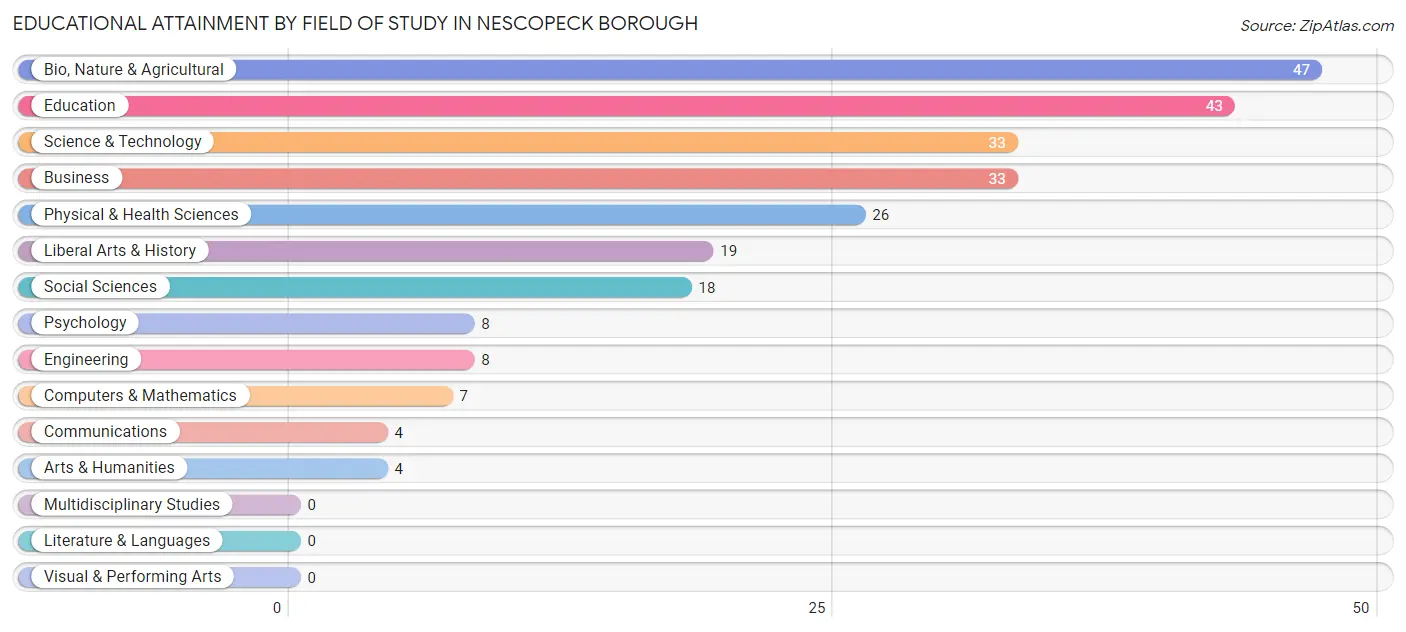
| Field of Study | # Graduates | % Graduates |
| Computers & Mathematics | 7 | 2.8% |
| Bio, Nature & Agricultural | 47 | 18.8% |
| Physical & Health Sciences | 26 | 10.4% |
| Psychology | 8 | 3.2% |
| Social Sciences | 18 | 7.2% |
| Engineering | 8 | 3.2% |
| Multidisciplinary Studies | 0 | 0.0% |
| Science & Technology | 33 | 13.2% |
| Business | 33 | 13.2% |
| Education | 43 | 17.2% |
| Literature & Languages | 0 | 0.0% |
| Liberal Arts & History | 19 | 7.6% |
| Visual & Performing Arts | 0 | 0.0% |
| Communications | 4 | 1.6% |
| Arts & Humanities | 4 | 1.6% |
| Total | 250 | 100.0% |
Transportation & Commute in Nescopeck borough
Vehicle Availability by Sex in Nescopeck borough
The most prevalent vehicle ownership categories in Nescopeck borough are males with 2 vehicles (190, accounting for 49.1%) and females with 2 vehicles (133, making up 56.7%).
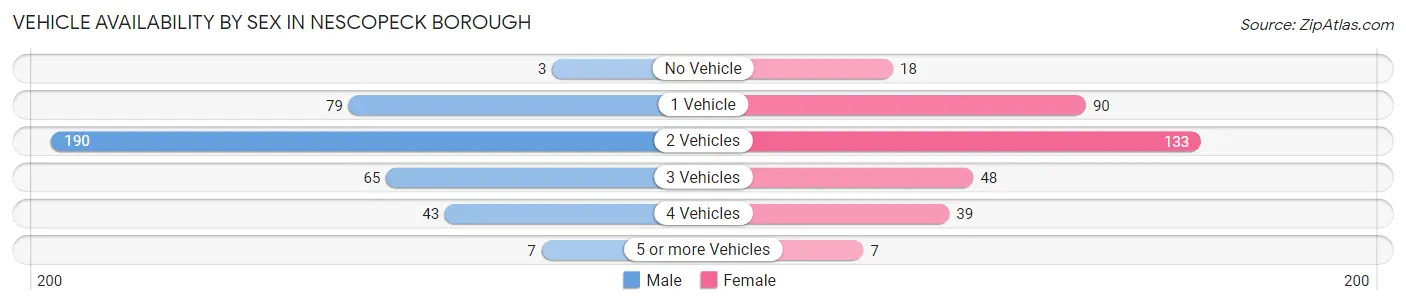
| Vehicles Available | Male | Female |
| No Vehicle | 3 (0.8%) | 18 (5.4%) |
| 1 Vehicle | 79 (20.4%) | 90 (26.9%) |
| 2 Vehicles | 190 (49.1%) | 133 (39.7%) |
| 3 Vehicles | 65 (16.8%) | 48 (14.3%) |
| 4 Vehicles | 43 (11.1%) | 39 (11.6%) |
| 5 or more Vehicles | 7 (1.8%) | 7 (2.1%) |
| Total | 387 (100.0%) | 335 (100.0%) |
Commute Time in Nescopeck borough
The most frequently occuring commute durations in Nescopeck borough are 15 to 19 minutes (152 commuters, 22.7%), 10 to 14 minutes (101 commuters, 15.0%), and 20 to 24 minutes (90 commuters, 13.4%).
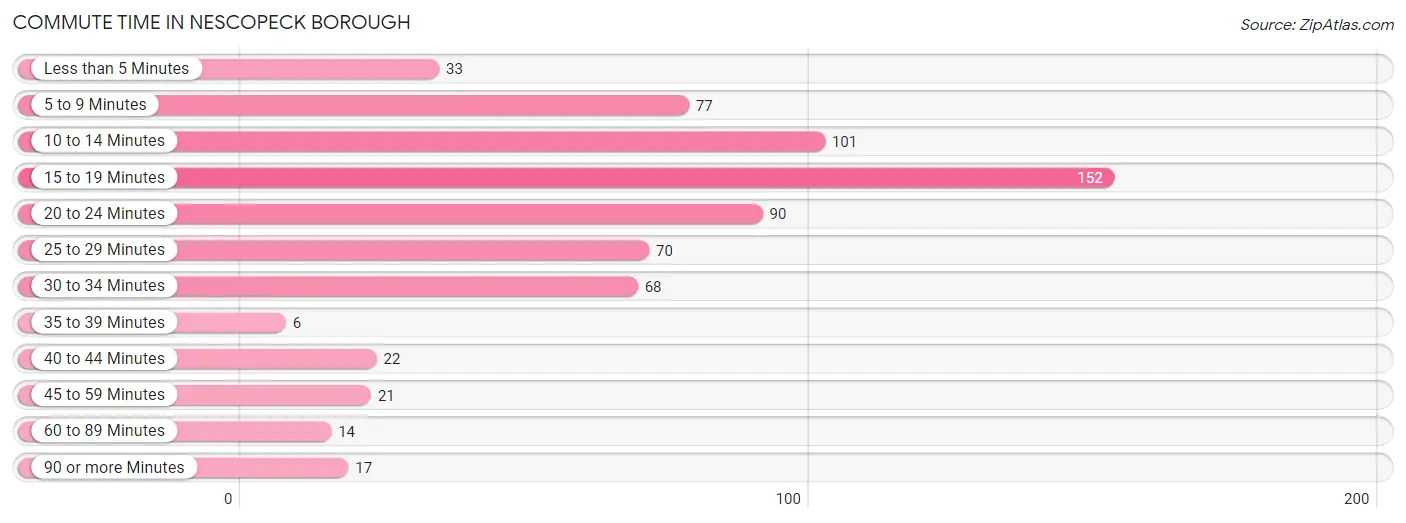
| Commute Time | # Commuters | % Commuters |
| Less than 5 Minutes | 33 | 4.9% |
| 5 to 9 Minutes | 77 | 11.5% |
| 10 to 14 Minutes | 101 | 15.0% |
| 15 to 19 Minutes | 152 | 22.7% |
| 20 to 24 Minutes | 90 | 13.4% |
| 25 to 29 Minutes | 70 | 10.4% |
| 30 to 34 Minutes | 68 | 10.1% |
| 35 to 39 Minutes | 6 | 0.9% |
| 40 to 44 Minutes | 22 | 3.3% |
| 45 to 59 Minutes | 21 | 3.1% |
| 60 to 89 Minutes | 14 | 2.1% |
| 90 or more Minutes | 17 | 2.5% |
Commute Time by Sex in Nescopeck borough
The most common commute times in Nescopeck borough are 15 to 19 minutes (88 commuters, 24.6%) for males and 15 to 19 minutes (64 commuters, 20.4%) for females.
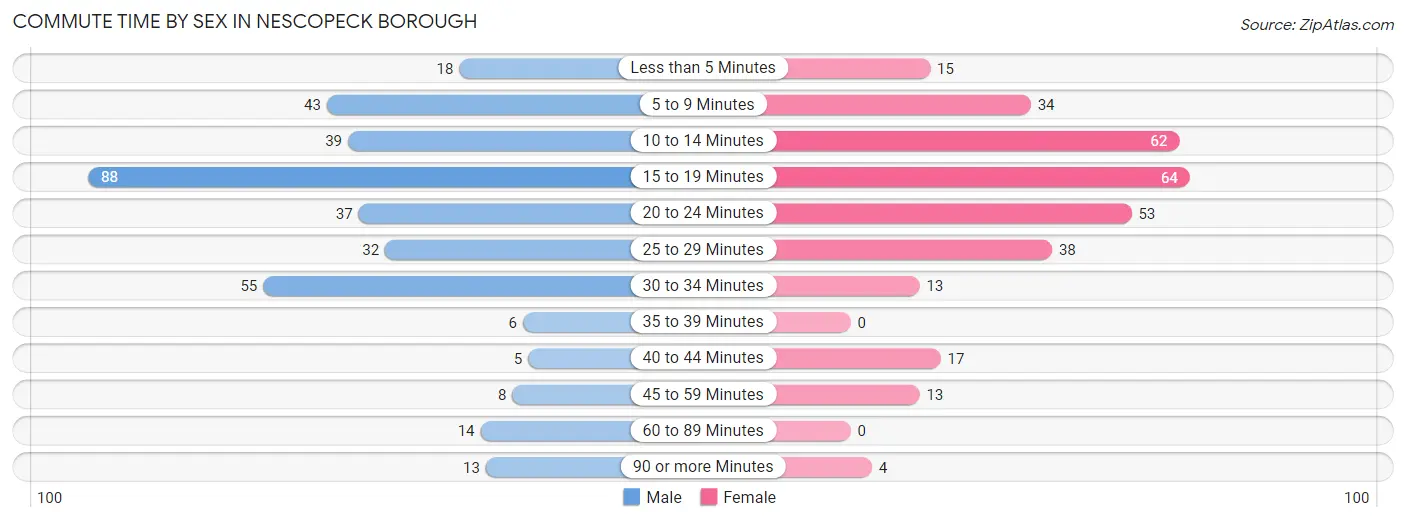
| Commute Time | Male | Female |
| Less than 5 Minutes | 18 (5.0%) | 15 (4.8%) |
| 5 to 9 Minutes | 43 (12.0%) | 34 (10.9%) |
| 10 to 14 Minutes | 39 (10.9%) | 62 (19.8%) |
| 15 to 19 Minutes | 88 (24.6%) | 64 (20.4%) |
| 20 to 24 Minutes | 37 (10.3%) | 53 (16.9%) |
| 25 to 29 Minutes | 32 (8.9%) | 38 (12.1%) |
| 30 to 34 Minutes | 55 (15.4%) | 13 (4.2%) |
| 35 to 39 Minutes | 6 (1.7%) | 0 (0.0%) |
| 40 to 44 Minutes | 5 (1.4%) | 17 (5.4%) |
| 45 to 59 Minutes | 8 (2.2%) | 13 (4.2%) |
| 60 to 89 Minutes | 14 (3.9%) | 0 (0.0%) |
| 90 or more Minutes | 13 (3.6%) | 4 (1.3%) |
Time of Departure to Work by Sex in Nescopeck borough
The most frequent times of departure to work in Nescopeck borough are 4:00 PM to 11:59 PM (60, 16.8%) for males and 7:00 AM to 7:29 AM (93, 29.7%) for females.
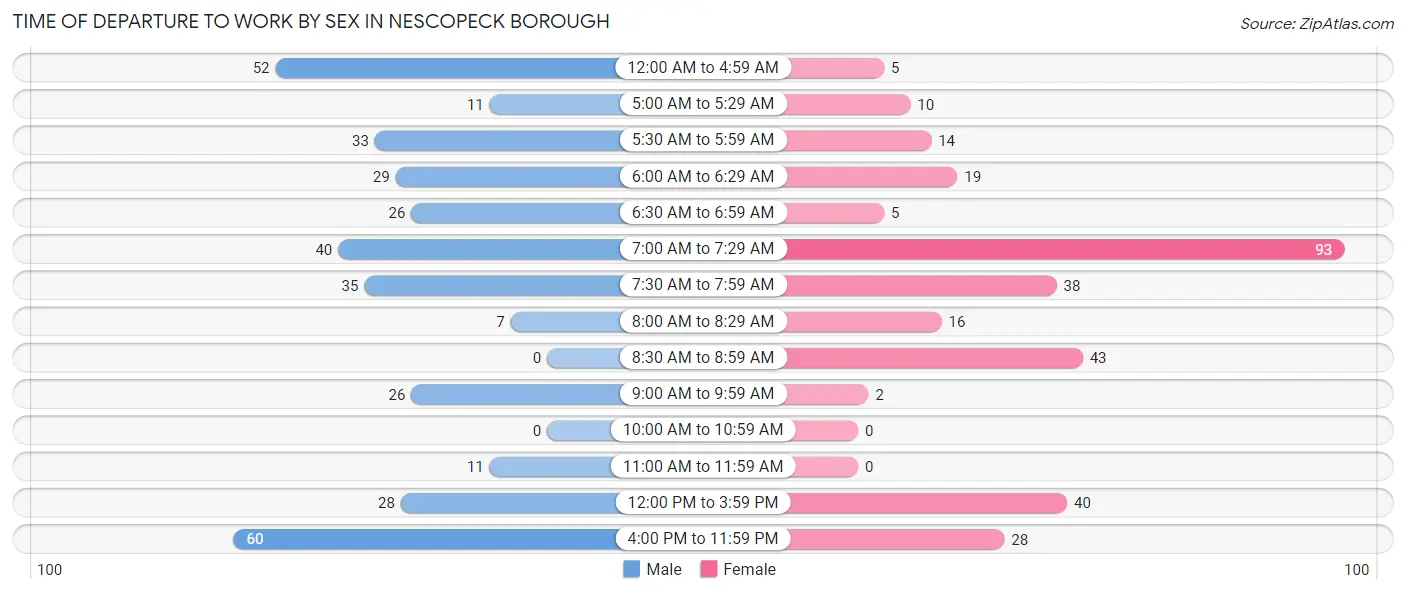
| Time of Departure | Male | Female |
| 12:00 AM to 4:59 AM | 52 (14.5%) | 5 (1.6%) |
| 5:00 AM to 5:29 AM | 11 (3.1%) | 10 (3.2%) |
| 5:30 AM to 5:59 AM | 33 (9.2%) | 14 (4.5%) |
| 6:00 AM to 6:29 AM | 29 (8.1%) | 19 (6.1%) |
| 6:30 AM to 6:59 AM | 26 (7.3%) | 5 (1.6%) |
| 7:00 AM to 7:29 AM | 40 (11.2%) | 93 (29.7%) |
| 7:30 AM to 7:59 AM | 35 (9.8%) | 38 (12.1%) |
| 8:00 AM to 8:29 AM | 7 (2.0%) | 16 (5.1%) |
| 8:30 AM to 8:59 AM | 0 (0.0%) | 43 (13.7%) |
| 9:00 AM to 9:59 AM | 26 (7.3%) | 2 (0.6%) |
| 10:00 AM to 10:59 AM | 0 (0.0%) | 0 (0.0%) |
| 11:00 AM to 11:59 AM | 11 (3.1%) | 0 (0.0%) |
| 12:00 PM to 3:59 PM | 28 (7.8%) | 40 (12.8%) |
| 4:00 PM to 11:59 PM | 60 (16.8%) | 28 (8.9%) |
| Total | 358 (100.0%) | 313 (100.0%) |
Housing Occupancy in Nescopeck borough
Occupancy by Ownership in Nescopeck borough
Of the total 657 dwellings in Nescopeck borough, owner-occupied units account for 440 (67.0%), while renter-occupied units make up 217 (33.0%).
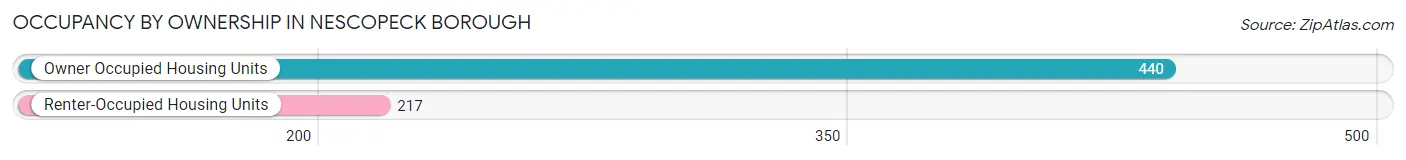
| Occupancy | # Housing Units | % Housing Units |
| Owner Occupied Housing Units | 440 | 67.0% |
| Renter-Occupied Housing Units | 217 | 33.0% |
| Total Occupied Housing Units | 657 | 100.0% |
Occupancy by Household Size in Nescopeck borough
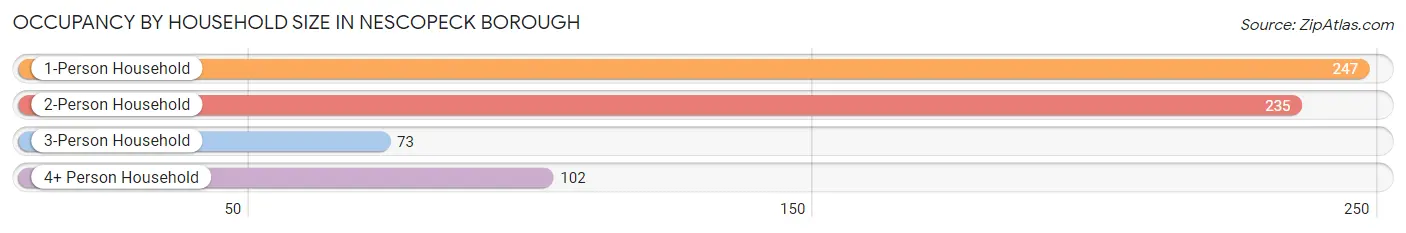
| Household Size | # Housing Units | % Housing Units |
| 1-Person Household | 247 | 37.6% |
| 2-Person Household | 235 | 35.8% |
| 3-Person Household | 73 | 11.1% |
| 4+ Person Household | 102 | 15.5% |
| Total Housing Units | 657 | 100.0% |
Occupancy by Ownership by Household Size in Nescopeck borough
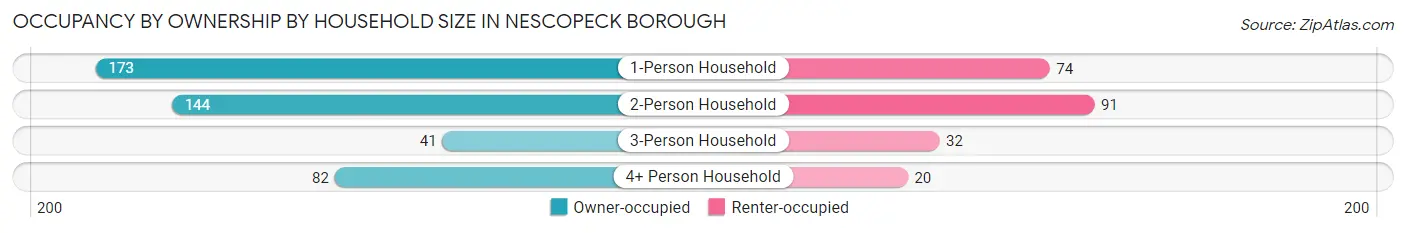
| Household Size | Owner-occupied | Renter-occupied |
| 1-Person Household | 173 (70.0%) | 74 (30.0%) |
| 2-Person Household | 144 (61.3%) | 91 (38.7%) |
| 3-Person Household | 41 (56.2%) | 32 (43.8%) |
| 4+ Person Household | 82 (80.4%) | 20 (19.6%) |
| Total Housing Units | 440 (67.0%) | 217 (33.0%) |
Occupancy by Educational Attainment in Nescopeck borough
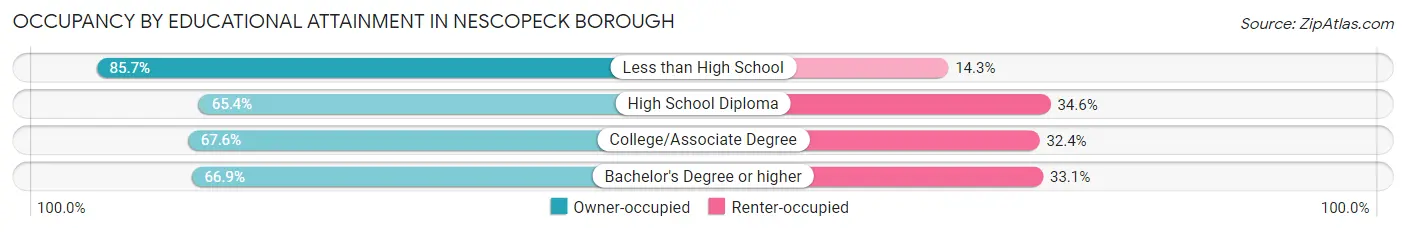
| Household Size | Owner-occupied | Renter-occupied |
| Less than High School | 18 (85.7%) | 3 (14.3%) |
| High School Diploma | 214 (65.4%) | 113 (34.6%) |
| College/Associate Degree | 117 (67.6%) | 56 (32.4%) |
| Bachelor's Degree or higher | 91 (66.9%) | 45 (33.1%) |
Occupancy by Age of Householder in Nescopeck borough
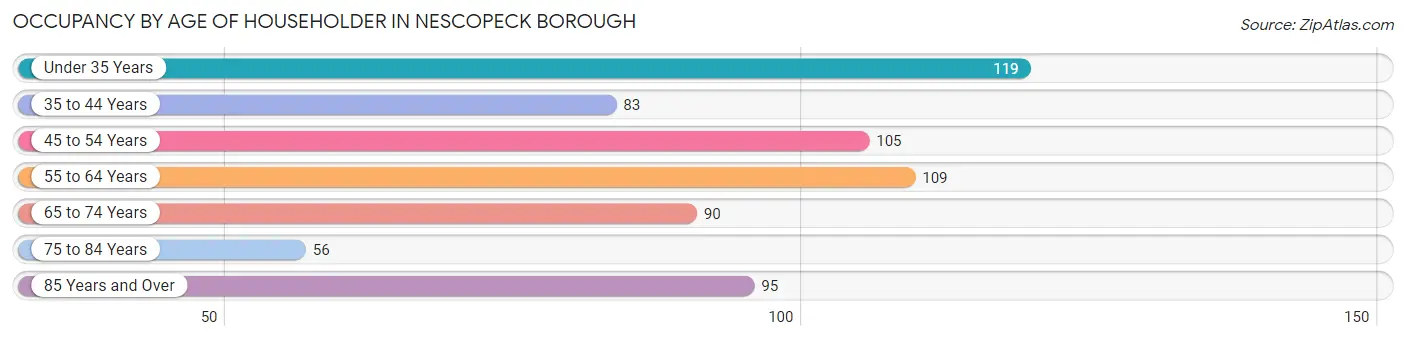
| Age Bracket | # Households | % Households |
| Under 35 Years | 119 | 18.1% |
| 35 to 44 Years | 83 | 12.6% |
| 45 to 54 Years | 105 | 16.0% |
| 55 to 64 Years | 109 | 16.6% |
| 65 to 74 Years | 90 | 13.7% |
| 75 to 84 Years | 56 | 8.5% |
| 85 Years and Over | 95 | 14.5% |
| Total | 657 | 100.0% |
Housing Finances in Nescopeck borough
Median Income by Occupancy in Nescopeck borough
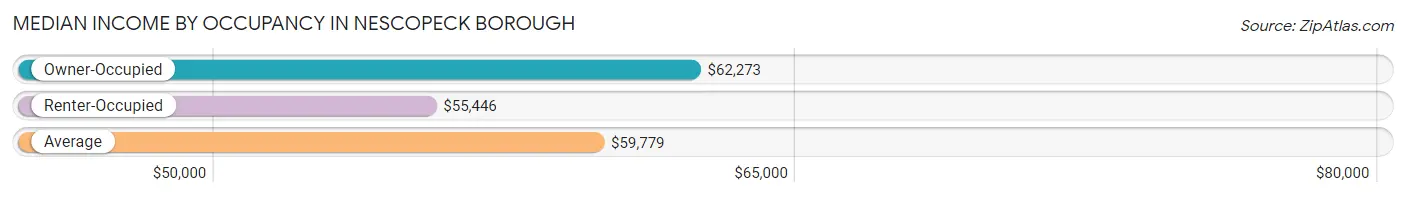
| Occupancy Type | # Households | Median Income |
| Owner-Occupied | 440 (67.0%) | $62,273 |
| Renter-Occupied | 217 (33.0%) | $55,446 |
| Average | 657 (100.0%) | $59,779 |
Occupancy by Householder Income Bracket in Nescopeck borough
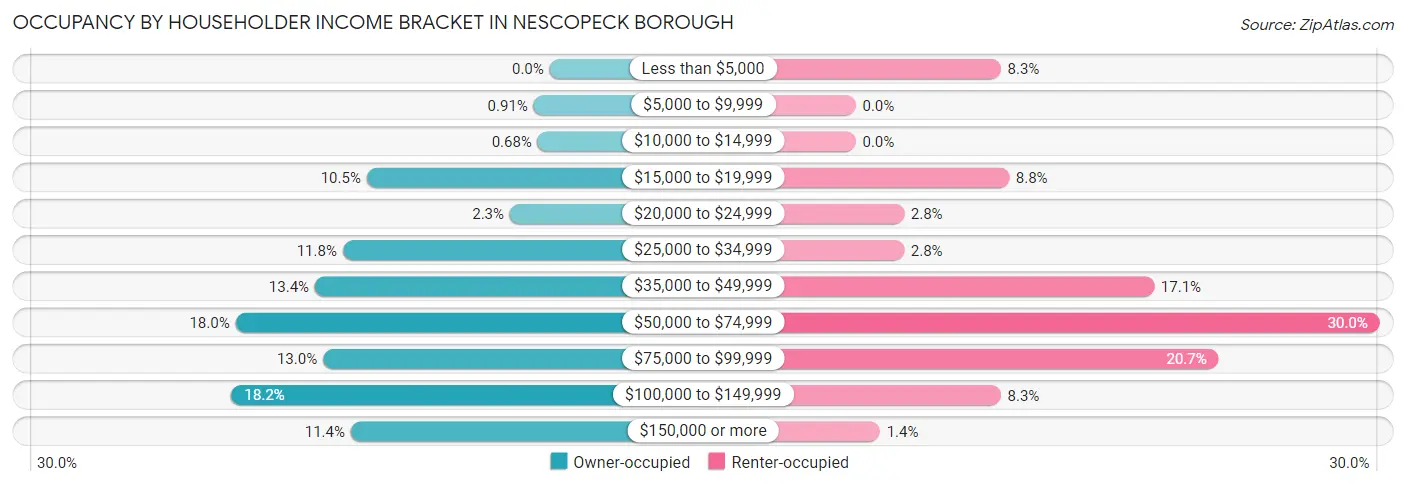
| Income Bracket | Owner-occupied | Renter-occupied |
| Less than $5,000 | 0 (0.0%) | 18 (8.3%) |
| $5,000 to $9,999 | 4 (0.9%) | 0 (0.0%) |
| $10,000 to $14,999 | 3 (0.7%) | 0 (0.0%) |
| $15,000 to $19,999 | 46 (10.4%) | 19 (8.8%) |
| $20,000 to $24,999 | 10 (2.3%) | 6 (2.8%) |
| $25,000 to $34,999 | 52 (11.8%) | 6 (2.8%) |
| $35,000 to $49,999 | 59 (13.4%) | 37 (17.1%) |
| $50,000 to $74,999 | 79 (17.9%) | 65 (29.9%) |
| $75,000 to $99,999 | 57 (13.0%) | 45 (20.7%) |
| $100,000 to $149,999 | 80 (18.2%) | 18 (8.3%) |
| $150,000 or more | 50 (11.4%) | 3 (1.4%) |
| Total | 440 (100.0%) | 217 (100.0%) |
Monthly Housing Cost Tiers in Nescopeck borough
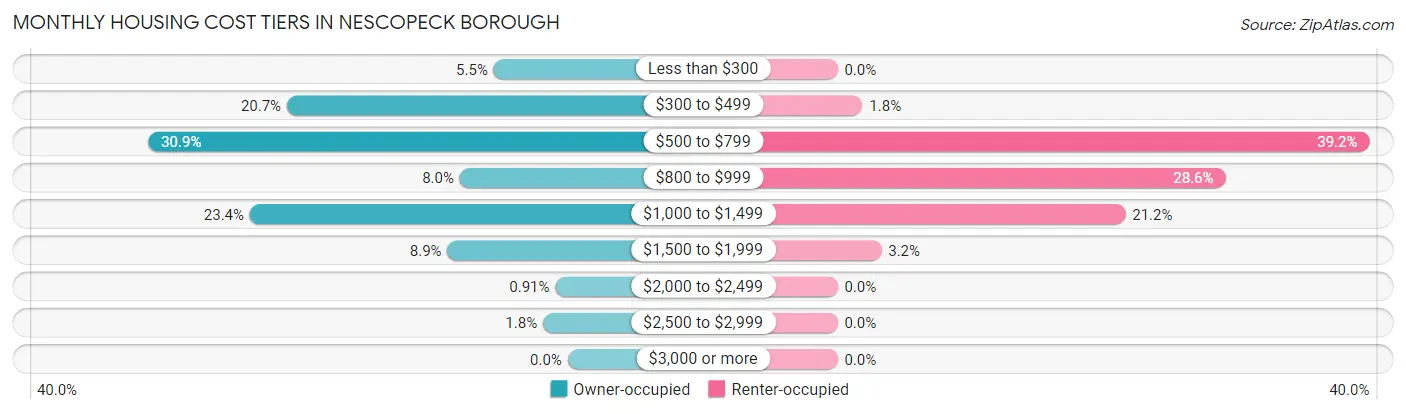
| Monthly Cost | Owner-occupied | Renter-occupied |
| Less than $300 | 24 (5.4%) | 0 (0.0%) |
| $300 to $499 | 91 (20.7%) | 4 (1.8%) |
| $500 to $799 | 136 (30.9%) | 85 (39.2%) |
| $800 to $999 | 35 (8.0%) | 62 (28.6%) |
| $1,000 to $1,499 | 103 (23.4%) | 46 (21.2%) |
| $1,500 to $1,999 | 39 (8.9%) | 7 (3.2%) |
| $2,000 to $2,499 | 4 (0.9%) | 0 (0.0%) |
| $2,500 to $2,999 | 8 (1.8%) | 0 (0.0%) |
| $3,000 or more | 0 (0.0%) | 0 (0.0%) |
| Total | 440 (100.0%) | 217 (100.0%) |
Physical Housing Characteristics in Nescopeck borough
Housing Structures in Nescopeck borough
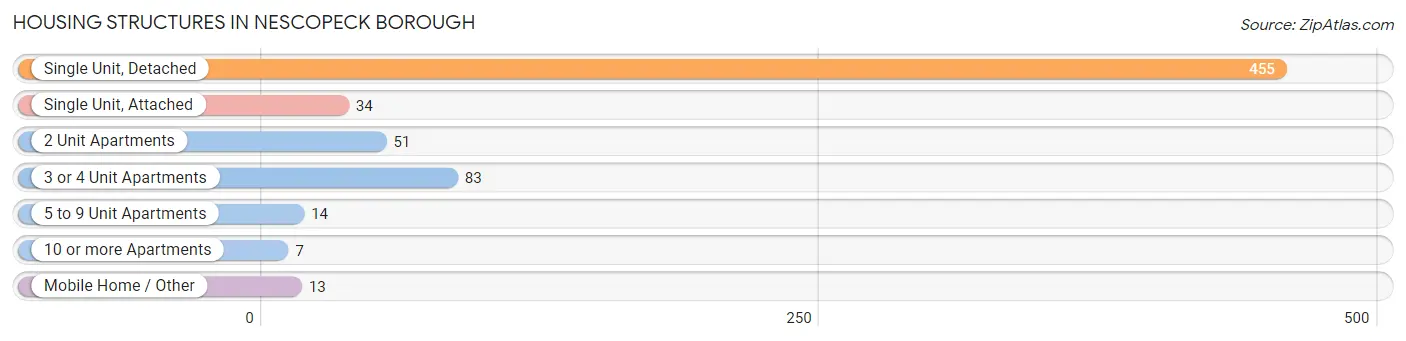
| Structure Type | # Housing Units | % Housing Units |
| Single Unit, Detached | 455 | 69.3% |
| Single Unit, Attached | 34 | 5.2% |
| 2 Unit Apartments | 51 | 7.8% |
| 3 or 4 Unit Apartments | 83 | 12.6% |
| 5 to 9 Unit Apartments | 14 | 2.1% |
| 10 or more Apartments | 7 | 1.1% |
| Mobile Home / Other | 13 | 2.0% |
| Total | 657 | 100.0% |
Housing Structures by Occupancy in Nescopeck borough
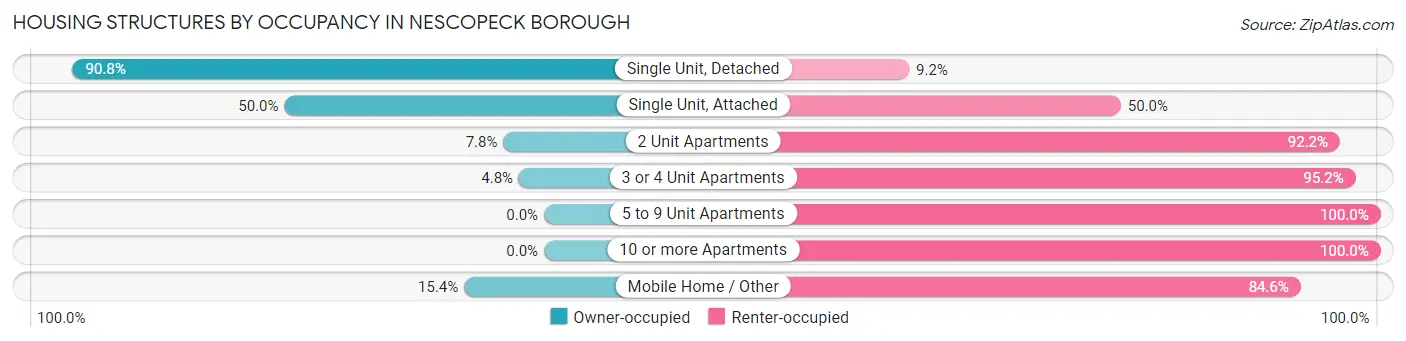
| Structure Type | Owner-occupied | Renter-occupied |
| Single Unit, Detached | 413 (90.8%) | 42 (9.2%) |
| Single Unit, Attached | 17 (50.0%) | 17 (50.0%) |
| 2 Unit Apartments | 4 (7.8%) | 47 (92.2%) |
| 3 or 4 Unit Apartments | 4 (4.8%) | 79 (95.2%) |
| 5 to 9 Unit Apartments | 0 (0.0%) | 14 (100.0%) |
| 10 or more Apartments | 0 (0.0%) | 7 (100.0%) |
| Mobile Home / Other | 2 (15.4%) | 11 (84.6%) |
| Total | 440 (67.0%) | 217 (33.0%) |
Housing Structures by Number of Rooms in Nescopeck borough
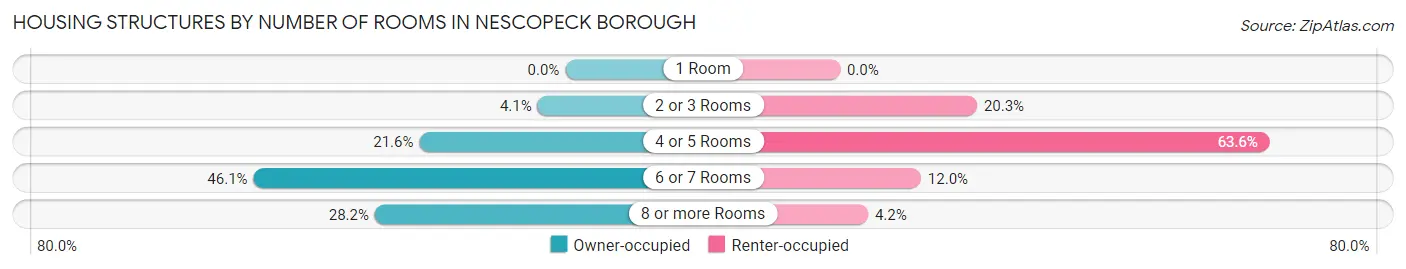
| Number of Rooms | Owner-occupied | Renter-occupied |
| 1 Room | 0 (0.0%) | 0 (0.0%) |
| 2 or 3 Rooms | 18 (4.1%) | 44 (20.3%) |
| 4 or 5 Rooms | 95 (21.6%) | 138 (63.6%) |
| 6 or 7 Rooms | 203 (46.1%) | 26 (12.0%) |
| 8 or more Rooms | 124 (28.2%) | 9 (4.2%) |
| Total | 440 (100.0%) | 217 (100.0%) |
Housing Structure by Heating Type in Nescopeck borough
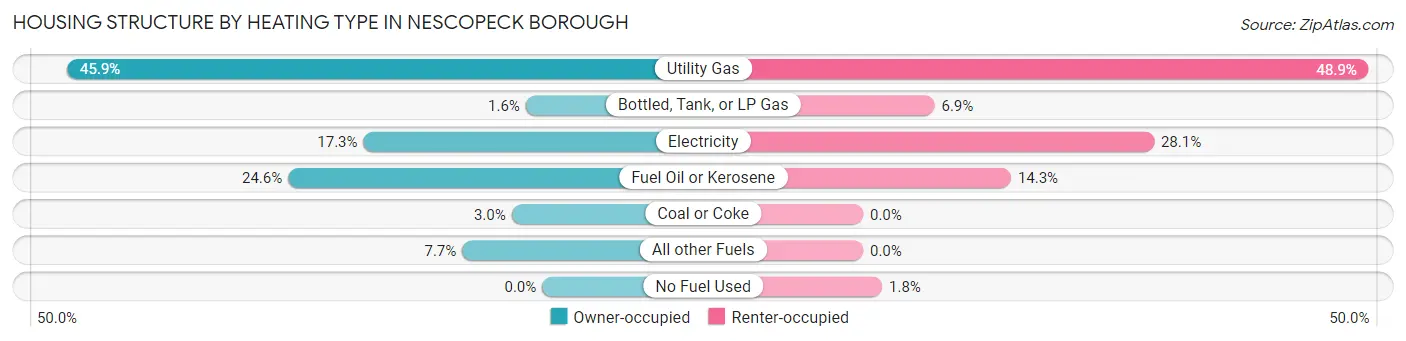
| Heating Type | Owner-occupied | Renter-occupied |
| Utility Gas | 202 (45.9%) | 106 (48.8%) |
| Bottled, Tank, or LP Gas | 7 (1.6%) | 15 (6.9%) |
| Electricity | 76 (17.3%) | 61 (28.1%) |
| Fuel Oil or Kerosene | 108 (24.5%) | 31 (14.3%) |
| Coal or Coke | 13 (2.9%) | 0 (0.0%) |
| All other Fuels | 34 (7.7%) | 0 (0.0%) |
| No Fuel Used | 0 (0.0%) | 4 (1.8%) |
| Total | 440 (100.0%) | 217 (100.0%) |
Household Vehicle Usage in Nescopeck borough
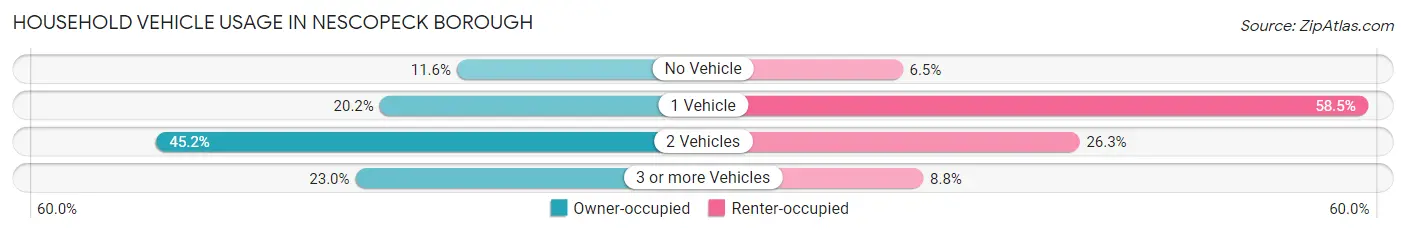
| Vehicles per Household | Owner-occupied | Renter-occupied |
| No Vehicle | 51 (11.6%) | 14 (6.5%) |
| 1 Vehicle | 89 (20.2%) | 127 (58.5%) |
| 2 Vehicles | 199 (45.2%) | 57 (26.3%) |
| 3 or more Vehicles | 101 (23.0%) | 19 (8.8%) |
| Total | 440 (100.0%) | 217 (100.0%) |
Real Estate & Mortgages in Nescopeck borough
Real Estate and Mortgage Overview in Nescopeck borough
| Characteristic | Without Mortgage | With Mortgage |
| Housing Units | 233 | 207 |
| Median Property Value | $147,200 | $160,400 |
| Median Household Income | $39,375 | $36 |
| Monthly Housing Costs | $503 | $0 |
| Real Estate Taxes | $1,561 | $21 |
Property Value by Mortgage Status in Nescopeck borough
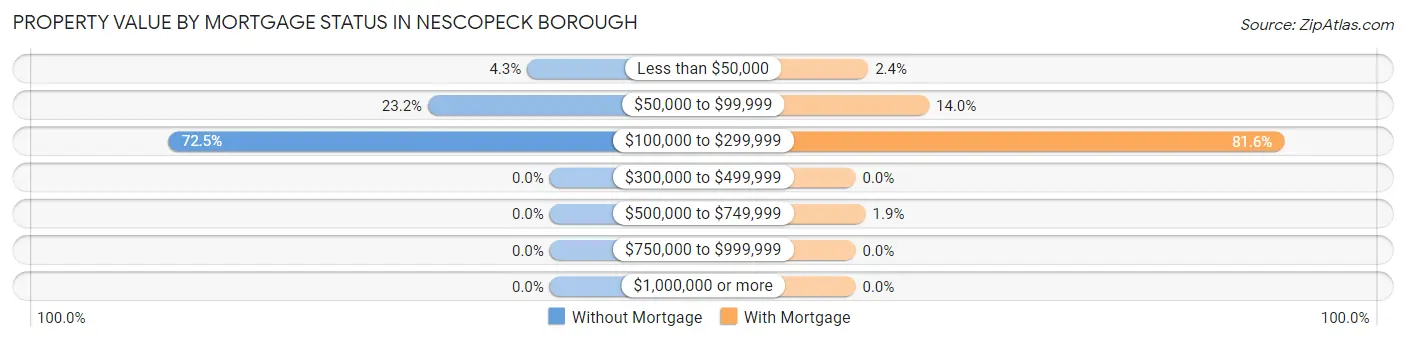
| Property Value | Without Mortgage | With Mortgage |
| Less than $50,000 | 10 (4.3%) | 5 (2.4%) |
| $50,000 to $99,999 | 54 (23.2%) | 29 (14.0%) |
| $100,000 to $299,999 | 169 (72.5%) | 169 (81.6%) |
| $300,000 to $499,999 | 0 (0.0%) | 0 (0.0%) |
| $500,000 to $749,999 | 0 (0.0%) | 4 (1.9%) |
| $750,000 to $999,999 | 0 (0.0%) | 0 (0.0%) |
| $1,000,000 or more | 0 (0.0%) | 0 (0.0%) |
| Total | 233 (100.0%) | 207 (100.0%) |
Household Income by Mortgage Status in Nescopeck borough
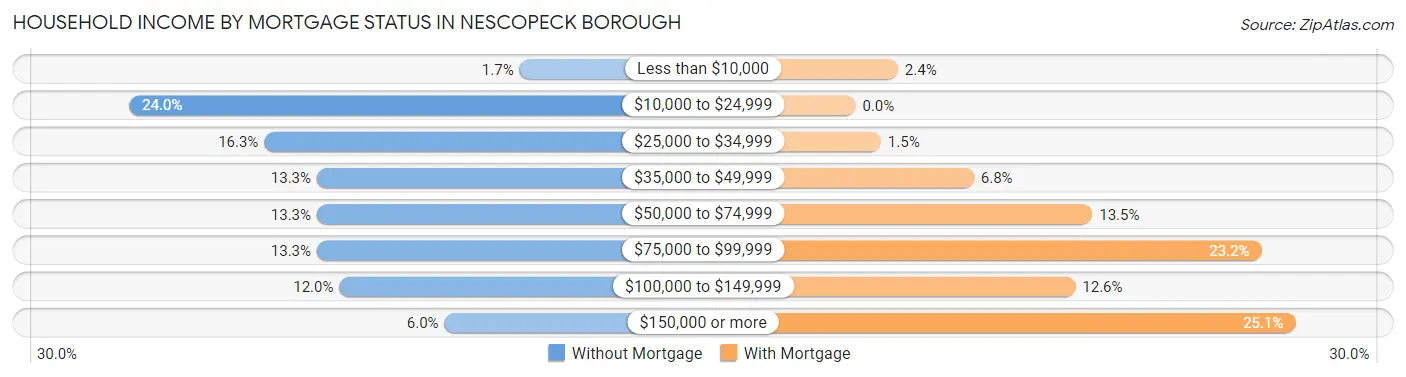
| Household Income | Without Mortgage | With Mortgage |
| Less than $10,000 | 4 (1.7%) | 5 (2.4%) |
| $10,000 to $24,999 | 56 (24.0%) | 0 (0.0%) |
| $25,000 to $34,999 | 38 (16.3%) | 3 (1.5%) |
| $35,000 to $49,999 | 31 (13.3%) | 14 (6.8%) |
| $50,000 to $74,999 | 31 (13.3%) | 28 (13.5%) |
| $75,000 to $99,999 | 31 (13.3%) | 48 (23.2%) |
| $100,000 to $149,999 | 28 (12.0%) | 26 (12.6%) |
| $150,000 or more | 14 (6.0%) | 52 (25.1%) |
| Total | 233 (100.0%) | 207 (100.0%) |
Property Value to Household Income Ratio in Nescopeck borough
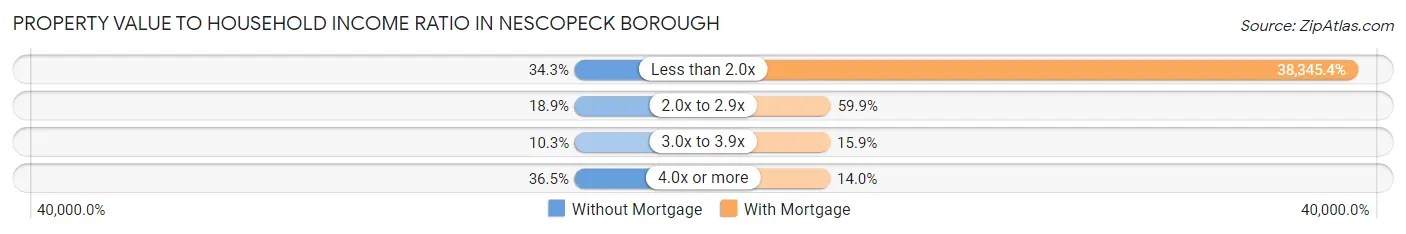
| Value-to-Income Ratio | Without Mortgage | With Mortgage |
| Less than 2.0x | 80 (34.3%) | 79,375 (38,345.4%) |
| 2.0x to 2.9x | 44 (18.9%) | 124 (59.9%) |
| 3.0x to 3.9x | 24 (10.3%) | 33 (15.9%) |
| 4.0x or more | 85 (36.5%) | 29 (14.0%) |
| Total | 233 (100.0%) | 207 (100.0%) |
Real Estate Taxes by Mortgage Status in Nescopeck borough
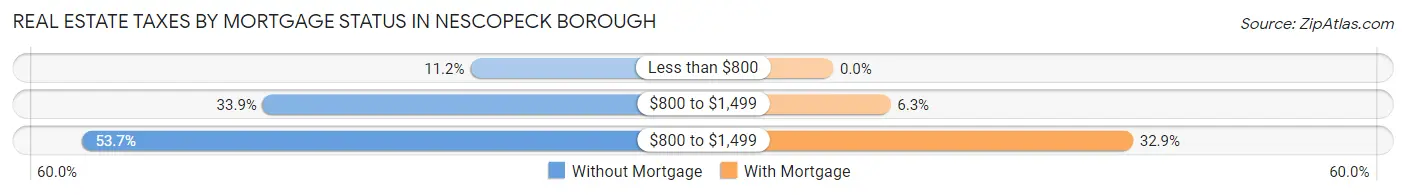
| Property Taxes | Without Mortgage | With Mortgage |
| Less than $800 | 26 (11.2%) | 0 (0.0%) |
| $800 to $1,499 | 79 (33.9%) | 13 (6.3%) |
| $800 to $1,499 | 125 (53.6%) | 68 (32.9%) |
| Total | 233 (100.0%) | 207 (100.0%) |
Health & Disability in Nescopeck borough
Health Insurance Coverage by Age in Nescopeck borough
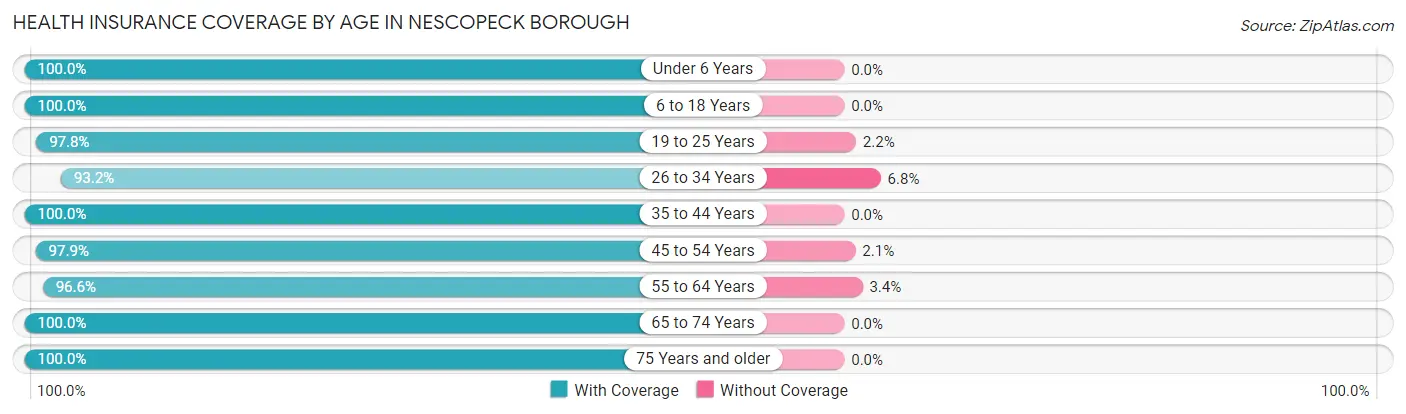
| Age Bracket | With Coverage | Without Coverage |
| Under 6 Years | 154 (100.0%) | 0 (0.0%) |
| 6 to 18 Years | 158 (100.0%) | 0 (0.0%) |
| 19 to 25 Years | 90 (97.8%) | 2 (2.2%) |
| 26 to 34 Years | 165 (93.2%) | 12 (6.8%) |
| 35 to 44 Years | 149 (100.0%) | 0 (0.0%) |
| 45 to 54 Years | 189 (97.9%) | 4 (2.1%) |
| 55 to 64 Years | 143 (96.6%) | 5 (3.4%) |
| 65 to 74 Years | 147 (100.0%) | 0 (0.0%) |
| 75 Years and older | 208 (100.0%) | 0 (0.0%) |
| Total | 1,403 (98.4%) | 23 (1.6%) |
Health Insurance Coverage by Citizenship Status in Nescopeck borough
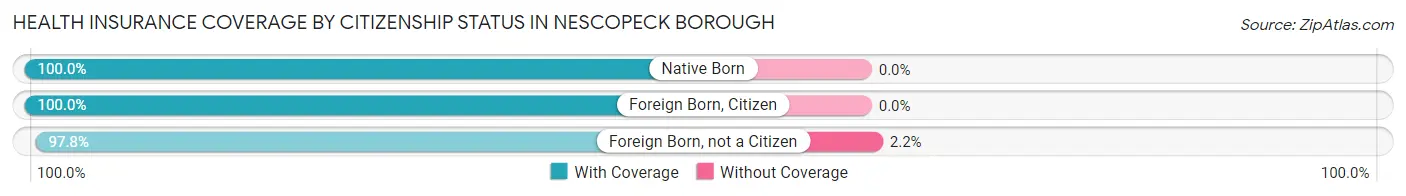
| Citizenship Status | With Coverage | Without Coverage |
| Native Born | 154 (100.0%) | 0 (0.0%) |
| Foreign Born, Citizen | 158 (100.0%) | 0 (0.0%) |
| Foreign Born, not a Citizen | 90 (97.8%) | 2 (2.2%) |
Health Insurance Coverage by Household Income in Nescopeck borough
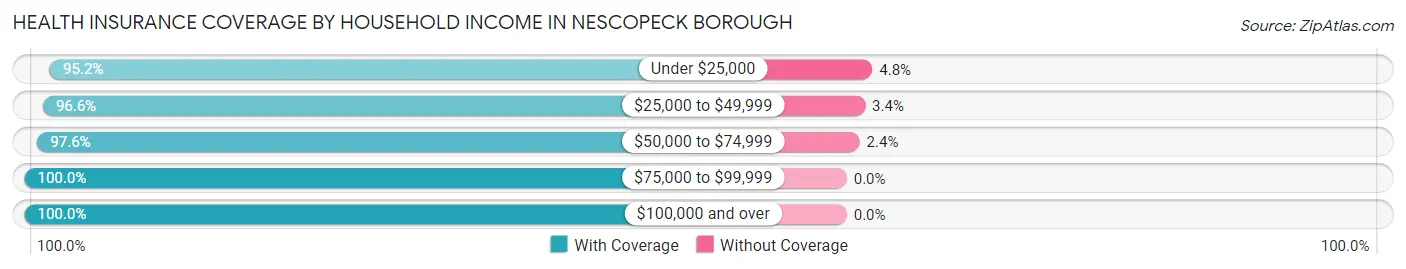
| Household Income | With Coverage | Without Coverage |
| Under $25,000 | 139 (95.2%) | 7 (4.8%) |
| $25,000 to $49,999 | 253 (96.6%) | 9 (3.4%) |
| $50,000 to $74,999 | 283 (97.6%) | 7 (2.4%) |
| $75,000 to $99,999 | 252 (100.0%) | 0 (0.0%) |
| $100,000 and over | 476 (100.0%) | 0 (0.0%) |
Public vs Private Health Insurance Coverage by Age in Nescopeck borough
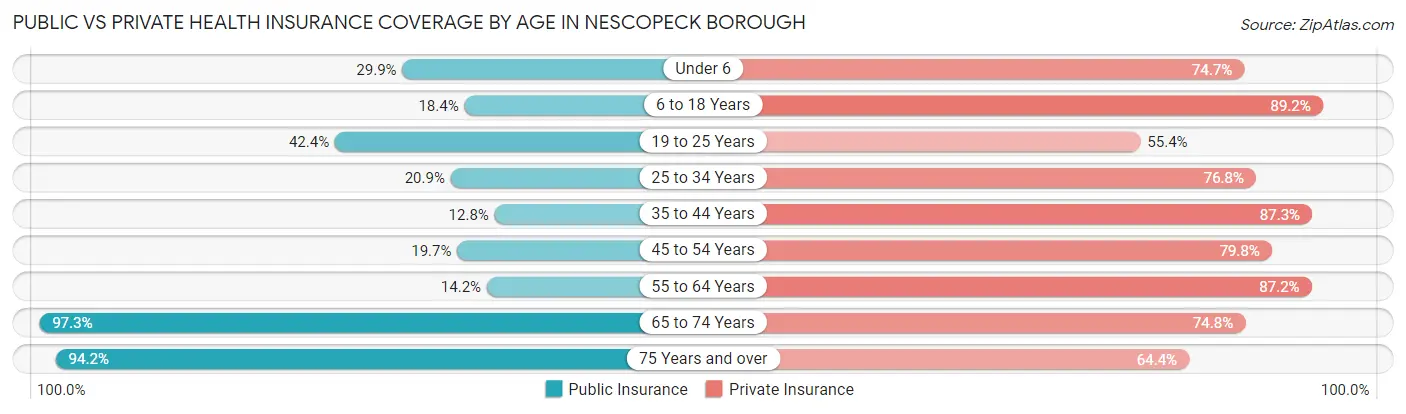
| Age Bracket | Public Insurance | Private Insurance |
| Under 6 | 46 (29.9%) | 115 (74.7%) |
| 6 to 18 Years | 29 (18.3%) | 141 (89.2%) |
| 19 to 25 Years | 39 (42.4%) | 51 (55.4%) |
| 25 to 34 Years | 37 (20.9%) | 136 (76.8%) |
| 35 to 44 Years | 19 (12.8%) | 130 (87.3%) |
| 45 to 54 Years | 38 (19.7%) | 154 (79.8%) |
| 55 to 64 Years | 21 (14.2%) | 129 (87.2%) |
| 65 to 74 Years | 143 (97.3%) | 110 (74.8%) |
| 75 Years and over | 196 (94.2%) | 134 (64.4%) |
| Total | 568 (39.8%) | 1,100 (77.1%) |
Disability Status by Sex by Age in Nescopeck borough
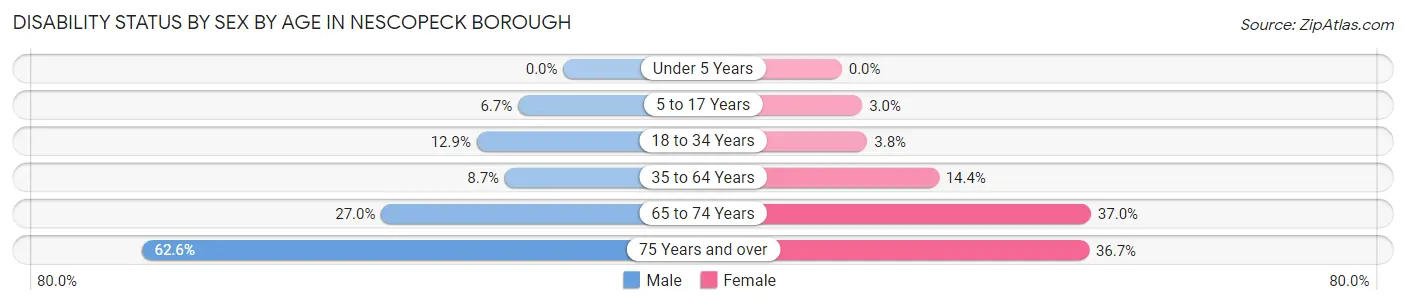
| Age Bracket | Male | Female |
| Under 5 Years | 0 (0.0%) | 0 (0.0%) |
| 5 to 17 Years | 7 (6.7%) | 3 (3.0%) |
| 18 to 34 Years | 18 (12.9%) | 5 (3.8%) |
| 35 to 64 Years | 19 (8.7%) | 39 (14.4%) |
| 65 to 74 Years | 20 (27.0%) | 27 (37.0%) |
| 75 Years and over | 62 (62.6%) | 40 (36.7%) |
Disability Class by Sex by Age in Nescopeck borough
Disability Class: Hearing Difficulty
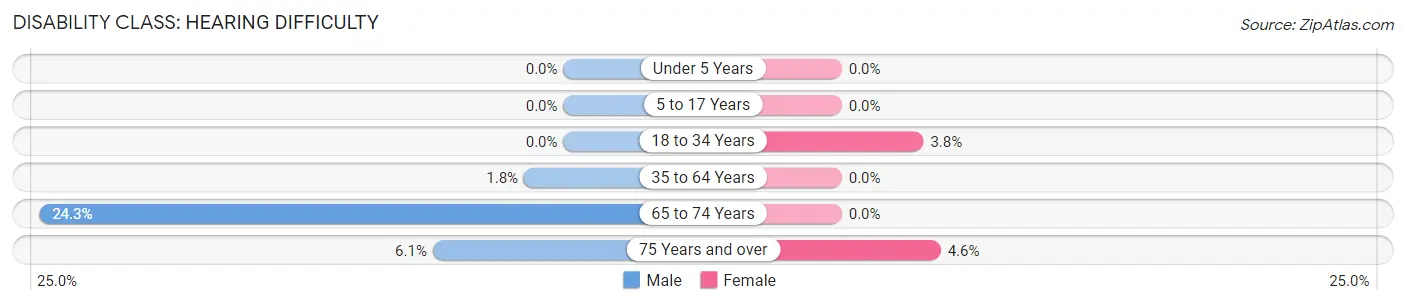
| Age Bracket | Male | Female |
| Under 5 Years | 0 (0.0%) | 0 (0.0%) |
| 5 to 17 Years | 0 (0.0%) | 0 (0.0%) |
| 18 to 34 Years | 0 (0.0%) | 5 (3.8%) |
| 35 to 64 Years | 4 (1.8%) | 0 (0.0%) |
| 65 to 74 Years | 18 (24.3%) | 0 (0.0%) |
| 75 Years and over | 6 (6.1%) | 5 (4.6%) |
Disability Class: Vision Difficulty
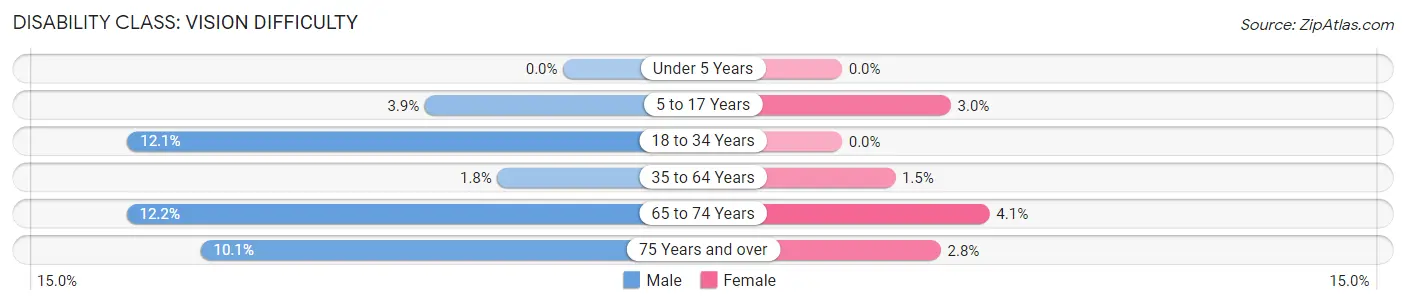
| Age Bracket | Male | Female |
| Under 5 Years | 0 (0.0%) | 0 (0.0%) |
| 5 to 17 Years | 4 (3.8%) | 3 (3.0%) |
| 18 to 34 Years | 17 (12.1%) | 0 (0.0%) |
| 35 to 64 Years | 4 (1.8%) | 4 (1.5%) |
| 65 to 74 Years | 9 (12.2%) | 3 (4.1%) |
| 75 Years and over | 10 (10.1%) | 3 (2.8%) |
Disability Class: Cognitive Difficulty
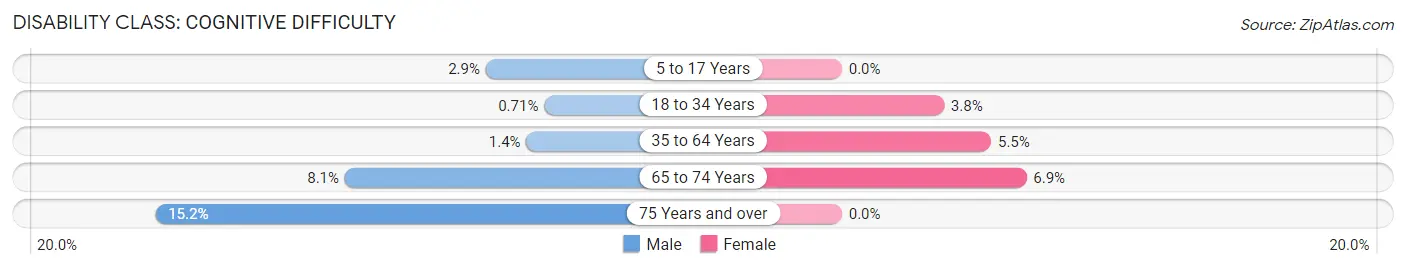
| Age Bracket | Male | Female |
| 5 to 17 Years | 3 (2.9%) | 0 (0.0%) |
| 18 to 34 Years | 1 (0.7%) | 5 (3.8%) |
| 35 to 64 Years | 3 (1.4%) | 15 (5.5%) |
| 65 to 74 Years | 6 (8.1%) | 5 (6.9%) |
| 75 Years and over | 15 (15.1%) | 0 (0.0%) |
Disability Class: Ambulatory Difficulty
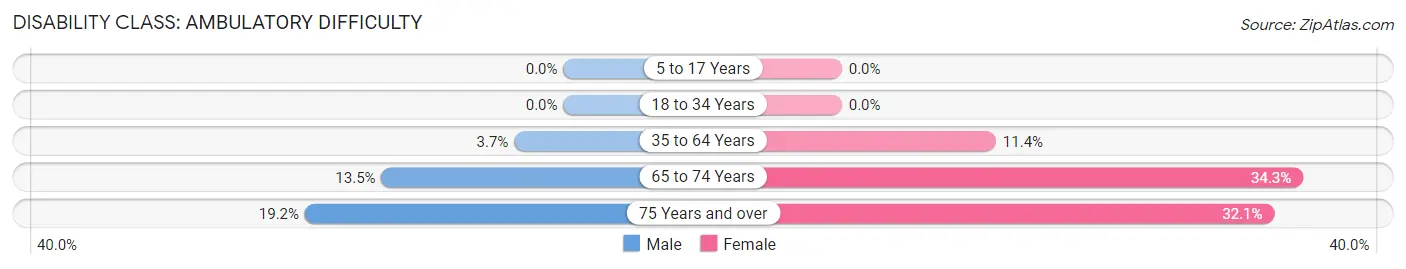
| Age Bracket | Male | Female |
| 5 to 17 Years | 0 (0.0%) | 0 (0.0%) |
| 18 to 34 Years | 0 (0.0%) | 0 (0.0%) |
| 35 to 64 Years | 8 (3.6%) | 31 (11.4%) |
| 65 to 74 Years | 10 (13.5%) | 25 (34.3%) |
| 75 Years and over | 19 (19.2%) | 35 (32.1%) |
Disability Class: Self-Care Difficulty
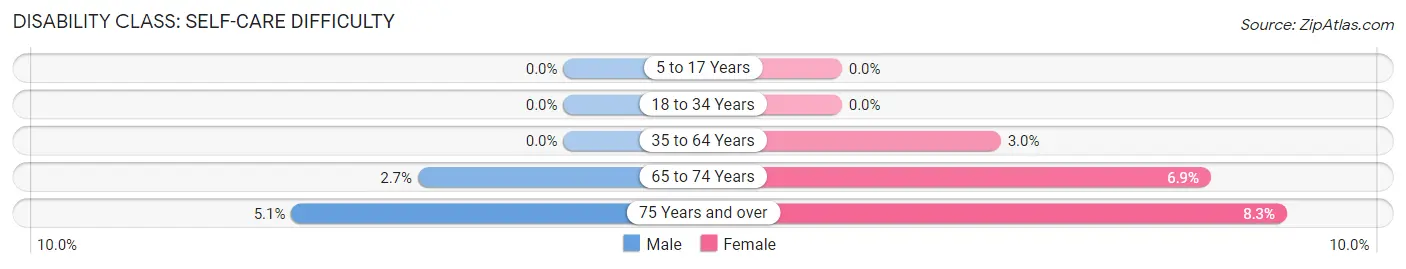
| Age Bracket | Male | Female |
| 5 to 17 Years | 0 (0.0%) | 0 (0.0%) |
| 18 to 34 Years | 0 (0.0%) | 0 (0.0%) |
| 35 to 64 Years | 0 (0.0%) | 8 (2.9%) |
| 65 to 74 Years | 2 (2.7%) | 5 (6.9%) |
| 75 Years and over | 5 (5.1%) | 9 (8.3%) |
Technology Access in Nescopeck borough
Computing Device Access in Nescopeck borough
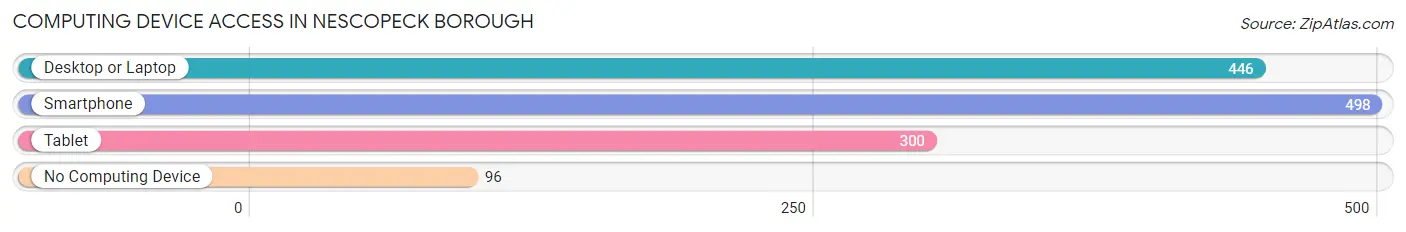
| Device Type | # Households | % Households |
| Desktop or Laptop | 446 | 67.9% |
| Smartphone | 498 | 75.8% |
| Tablet | 300 | 45.7% |
| No Computing Device | 96 | 14.6% |
| Total | 657 | 100.0% |
Internet Access in Nescopeck borough
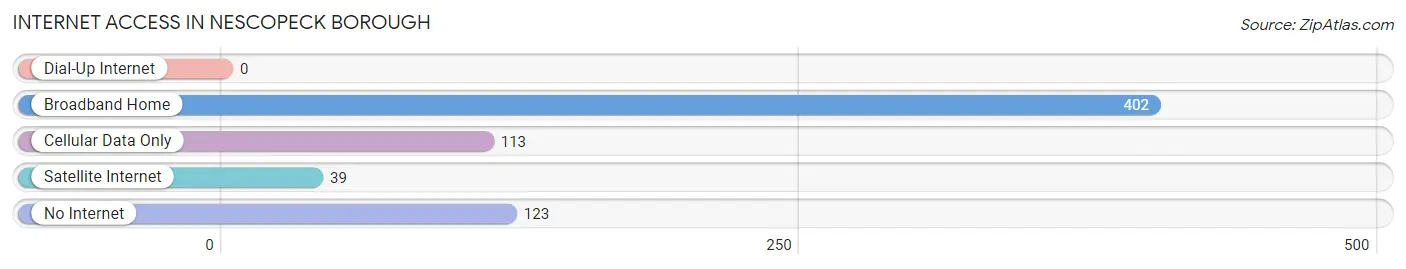
| Internet Type | # Households | % Households |
| Dial-Up Internet | 0 | 0.0% |
| Broadband Home | 402 | 61.2% |
| Cellular Data Only | 113 | 17.2% |
| Satellite Internet | 39 | 5.9% |
| No Internet | 123 | 18.7% |
| Total | 657 | 100.0% |
Nescopeck borough Summary
Nescopeck Borough is a small borough located in Luzerne County, Pennsylvania. It is situated in the heart of the Wyoming Valley, and is bordered by the Susquehanna River to the east and the Nescopeck Creek to the west. The borough is home to a population of 1,845 people, according to the 2010 census.
Geography
Nescopeck Borough is located in the Wyoming Valley of northeastern Pennsylvania. It is situated in the heart of the valley, bordered by the Susquehanna River to the east and the Nescopeck Creek to the west. The borough is located approximately 10 miles south of Wilkes-Barre and 25 miles north of Hazleton. The borough is situated at an elevation of approximately 500 feet above sea level.
The borough is located in a region of rolling hills and valleys, with the Susquehanna River forming the eastern boundary. The Nescopeck Creek flows through the borough, and is a tributary of the Susquehanna River. The borough is located in a humid continental climate zone, with cold winters and hot, humid summers.
History
Nescopeck Borough was founded in 1845, and was originally known as Nescopeckville. The borough was named after the Nescopeck Indians, who were the original inhabitants of the area. The borough was incorporated in 1851, and was the first borough in Luzerne County.
The borough was an important stop on the Lehigh Valley Railroad, which ran through the borough from 1855 to 1972. The railroad was a major factor in the growth of the borough, and helped to bring industry and commerce to the area.
The borough was also home to a number of coal mines, which were a major source of employment for the residents of the borough. The coal mines were in operation until the 1950s, when they were closed due to the decline of the coal industry.
Economy
The economy of Nescopeck Borough is largely based on the service industry. The borough is home to a number of restaurants, retail stores, and other businesses. The borough is also home to a number of manufacturing companies, including a plastics manufacturer and a metal fabrication company.
The borough is also home to a number of small businesses, including a bakery, a florist, and a furniture store. The borough is also home to a number of professional services, such as lawyers, accountants, and doctors.
Demographics
According to the 2010 census, the population of Nescopeck Borough was 1,845. The population is largely white (94.3%), with a small percentage of African Americans (2.2%) and Hispanics (2.2%). The median household income in the borough is $41,944, and the median age is 43.
The borough is home to a number of churches, including the Nescopeck United Methodist Church, the Nescopeck Presbyterian Church, and the Nescopeck Baptist Church. The borough is also home to a number of schools, including the Nescopeck Elementary School, the Nescopeck Middle School, and the Nescopeck High School.
Conclusion
Nescopeck Borough is a small borough located in Luzerne County, Pennsylvania. It is situated in the heart of the Wyoming Valley, and is bordered by the Susquehanna River to the east and the Nescopeck Creek to the west. The borough is home to a population of 1,845 people, according to the 2010 census. The economy of the borough is largely based on the service industry, and the borough is home to a number of churches, schools, and small businesses.
Common Questions
What is Per Capita Income in Nescopeck borough?
Per Capita income in Nescopeck borough is $34,993.
What is the Median Family Income in Nescopeck borough?
Median Family Income in Nescopeck borough is $75,114.
What is the Median Household income in Nescopeck borough?
Median Household Income in Nescopeck borough is $59,779.
What is Income or Wage Gap in Nescopeck borough?
Income or Wage Gap in Nescopeck borough is 16.1%.
Women in Nescopeck borough earn 83.9 cents for every dollar earned by a man.
What is Inequality or Gini Index in Nescopeck borough?
Inequality or Gini Index in Nescopeck borough is 0.43.
What is the Total Population of Nescopeck borough?
Total Population of Nescopeck borough is 1,426.
What is the Total Male Population of Nescopeck borough?
Total Male Population of Nescopeck borough is 721.
What is the Total Female Population of Nescopeck borough?
Total Female Population of Nescopeck borough is 705.
What is the Ratio of Males per 100 Females in Nescopeck borough?
There are 102.27 Males per 100 Females in Nescopeck borough.
What is the Ratio of Females per 100 Males in Nescopeck borough?
There are 97.78 Females per 100 Males in Nescopeck borough.
What is the Median Population Age in Nescopeck borough?
Median Population Age in Nescopeck borough is 42.9 Years.
What is the Average Family Size in Nescopeck borough
Average Family Size in Nescopeck borough is 2.9 People.
What is the Average Household Size in Nescopeck borough
Average Household Size in Nescopeck borough is 2.2 People.
How Large is the Labor Force in Nescopeck borough?
There are 753 People in the Labor Forcein in Nescopeck borough.
What is the Percentage of People in the Labor Force in Nescopeck borough?
66.4% of People are in the Labor Force in Nescopeck borough.
What is the Unemployment Rate in Nescopeck borough?
Unemployment Rate in Nescopeck borough is 2.9%.