Bulger, PA Map & Demographics
Bulger Map
Bulger Overview
$38,693
PER CAPITA INCOME
$103,894
AVG FAMILY INCOME
$83,250
AVG HOUSEHOLD INCOME
66.5%
WAGE / INCOME GAP [ % ]
33.5¢/ $1
WAGE / INCOME GAP [ $ ]
0.34
INEQUALITY / GINI INDEX
314
TOTAL POPULATION
138
MALE POPULATION
176
FEMALE POPULATION
78.41
MALES / 100 FEMALES
127.54
FEMALES / 100 MALES
47.6
MEDIAN AGE
2.2
AVG FAMILY SIZE
2.1
AVG HOUSEHOLD SIZE
186
LABOR FORCE [ PEOPLE ]
68.6%
PERCENT IN LABOR FORCE
20.4%
UNEMPLOYMENT RATE
Bulger Zip Codes
Bulger Area Codes
Income in Bulger
Income Overview in Bulger
Per Capita Income in Bulger is $38,693, while median incomes of families and households are $103,894 and $83,250 respectively.
| Characteristic | Number | Measure |
| Per Capita Income | 314 | $38,693 |
| Median Family Income | 91 | $103,894 |
| Mean Family Income | 91 | $105,480 |
| Median Household Income | 149 | $83,250 |
| Mean Household Income | 149 | $83,148 |
| Income Deficit | 91 | $0 |
| Wage / Income Gap (%) | 314 | 66.52% |
| Wage / Income Gap ($) | 314 | 33.48¢ per $1 |
| Gini / Inequality Index | 314 | 0.34 |
Earnings by Sex in Bulger
Average Earnings in Bulger are $33,833, $84,750 for men and $28,375 for women, a difference of 66.5%.
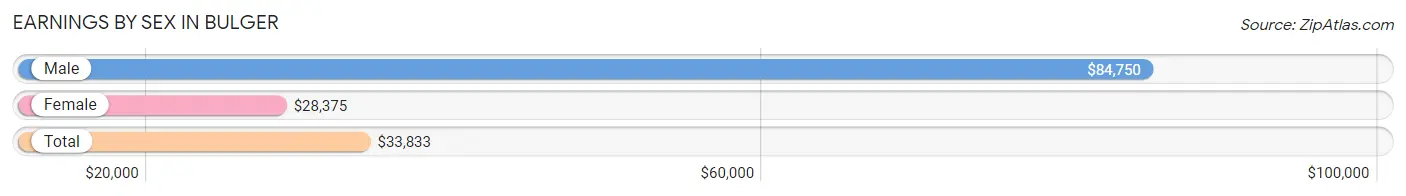
| Sex | Number | Average Earnings |
| Male | 89 (47.3%) | $84,750 |
| Female | 99 (52.7%) | $28,375 |
| Total | 188 (100.0%) | $33,833 |
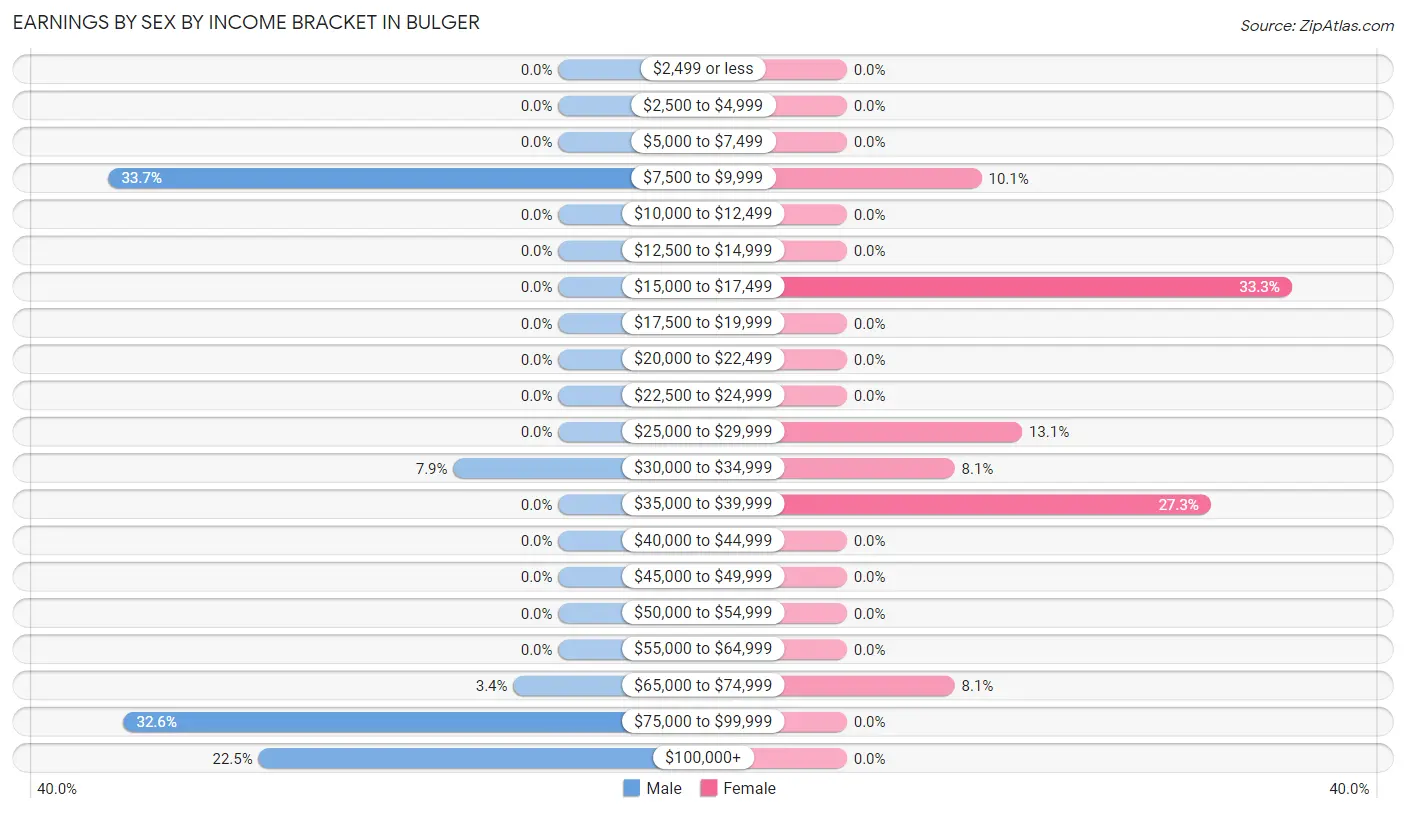
Earnings by Sex by Income Bracket in Bulger
The most common earnings brackets in Bulger are $7,500 to $9,999 for men (30 | 33.7%) and $15,000 to $17,499 for women (33 | 33.3%).
| Income | Male | Female |
| $2,499 or less | 0 (0.0%) | 0 (0.0%) |
| $2,500 to $4,999 | 0 (0.0%) | 0 (0.0%) |
| $5,000 to $7,499 | 0 (0.0%) | 0 (0.0%) |
| $7,500 to $9,999 | 30 (33.7%) | 10 (10.1%) |
| $10,000 to $12,499 | 0 (0.0%) | 0 (0.0%) |
| $12,500 to $14,999 | 0 (0.0%) | 0 (0.0%) |
| $15,000 to $17,499 | 0 (0.0%) | 33 (33.3%) |
| $17,500 to $19,999 | 0 (0.0%) | 0 (0.0%) |
| $20,000 to $22,499 | 0 (0.0%) | 0 (0.0%) |
| $22,500 to $24,999 | 0 (0.0%) | 0 (0.0%) |
| $25,000 to $29,999 | 0 (0.0%) | 13 (13.1%) |
| $30,000 to $34,999 | 7 (7.9%) | 8 (8.1%) |
| $35,000 to $39,999 | 0 (0.0%) | 27 (27.3%) |
| $40,000 to $44,999 | 0 (0.0%) | 0 (0.0%) |
| $45,000 to $49,999 | 0 (0.0%) | 0 (0.0%) |
| $50,000 to $54,999 | 0 (0.0%) | 0 (0.0%) |
| $55,000 to $64,999 | 0 (0.0%) | 0 (0.0%) |
| $65,000 to $74,999 | 3 (3.4%) | 8 (8.1%) |
| $75,000 to $99,999 | 29 (32.6%) | 0 (0.0%) |
| $100,000+ | 20 (22.5%) | 0 (0.0%) |
| Total | 89 (100.0%) | 99 (100.0%) |
Earnings by Sex by Educational Attainment in Bulger
| Educational Attainment | Male Income | Female Income |
| Less than High School | - | - |
| High School Diploma | - | - |
| College or Associate's Degree | - | - |
| Bachelor's Degree | - | - |
| Graduate Degree | - | - |
| Total | $84,750 | $29,250 |
Family Income in Bulger
Family Income Brackets in Bulger
According to the Bulger family income data, there are 40 families falling into the $100,000 to $149,999 income range, which is the most common income bracket and makes up 44.0% of all families.
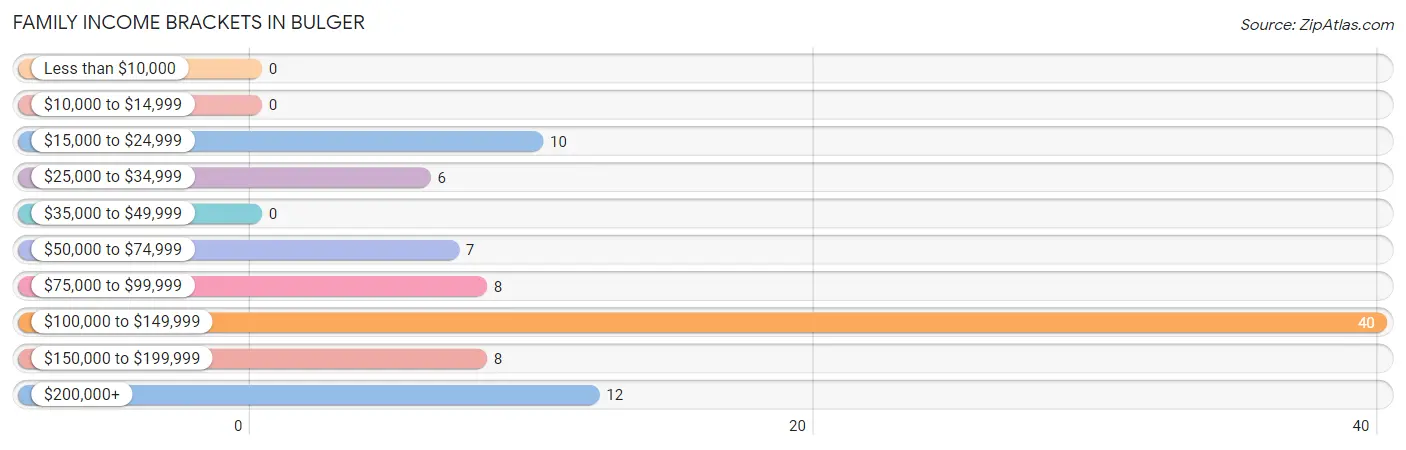
| Income Bracket | # Families | % Families |
| Less than $10,000 | 0 | 0.0% |
| $10,000 to $14,999 | 0 | 0.0% |
| $15,000 to $24,999 | 10 | 11.0% |
| $25,000 to $34,999 | 6 | 6.6% |
| $35,000 to $49,999 | 0 | 0.0% |
| $50,000 to $74,999 | 7 | 7.7% |
| $75,000 to $99,999 | 8 | 8.8% |
| $100,000 to $149,999 | 40 | 44.0% |
| $150,000 to $199,999 | 8 | 8.8% |
| $200,000+ | 12 | 13.2% |
Family Income by Famaliy Size in Bulger
2-person families (73 | 80.2%) account for the highest median family income in Bulger with $103,606 per family, while 2-person families (73 | 80.2%) have the highest median income of $51,803 per family member.
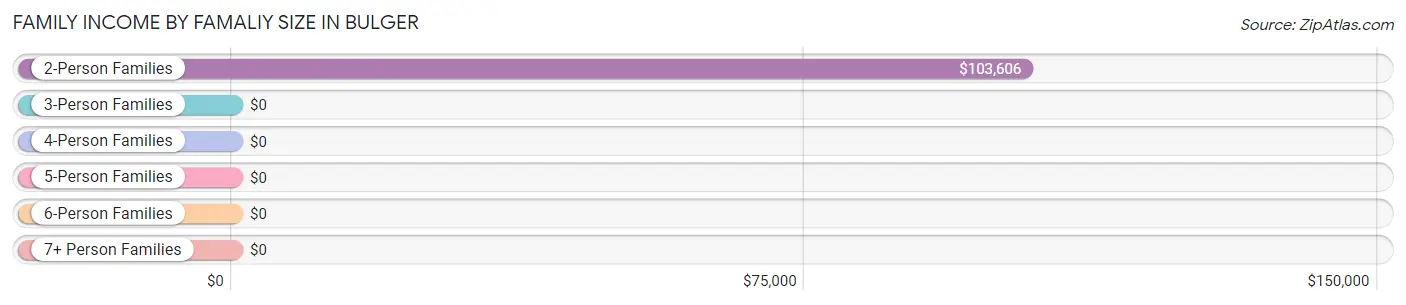
| Income Bracket | # Families | Median Income |
| 2-Person Families | 73 (80.2%) | $103,606 |
| 3-Person Families | 12 (13.2%) | $0 |
| 4-Person Families | 6 (6.6%) | $0 |
| 5-Person Families | 0 (0.0%) | $0 |
| 6-Person Families | 0 (0.0%) | $0 |
| 7+ Person Families | 0 (0.0%) | $0 |
| Total | 91 (100.0%) | $103,894 |
Family Income by Number of Earners in Bulger
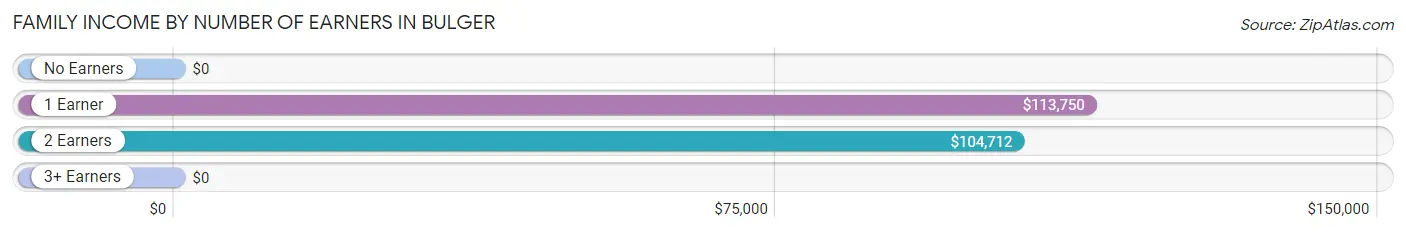
| Number of Earners | # Families | Median Income |
| No Earners | 25 (27.5%) | $0 |
| 1 Earner | 20 (22.0%) | $113,750 |
| 2 Earners | 46 (50.5%) | $104,712 |
| 3+ Earners | 0 (0.0%) | $0 |
| Total | 91 (100.0%) | $103,894 |
Household Income in Bulger
Household Income Brackets in Bulger
With 40 households falling in the category, the $35,000 to $49,999 income range is the most frequent in Bulger, accounting for 26.9% of all households.
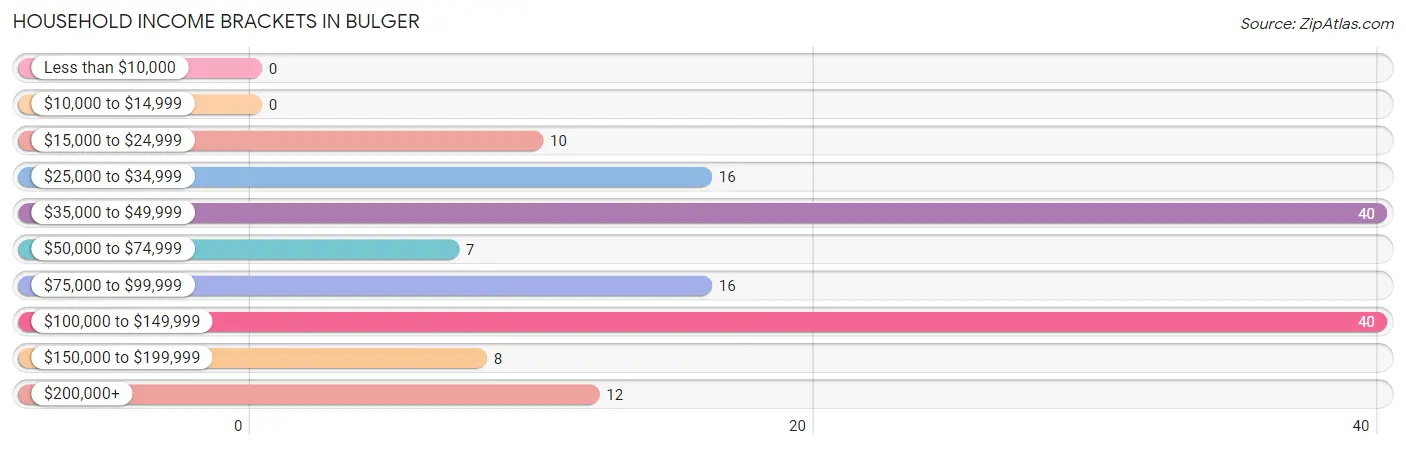
| Income Bracket | # Households | % Households |
| Less than $10,000 | 0 | 0.0% |
| $10,000 to $14,999 | 0 | 0.0% |
| $15,000 to $24,999 | 10 | 6.7% |
| $25,000 to $34,999 | 16 | 10.7% |
| $35,000 to $49,999 | 40 | 26.8% |
| $50,000 to $74,999 | 7 | 4.7% |
| $75,000 to $99,999 | 16 | 10.7% |
| $100,000 to $149,999 | 40 | 26.8% |
| $150,000 to $199,999 | 8 | 5.4% |
| $200,000+ | 12 | 8.1% |
Household Income by Householder Age in Bulger
The median household income in Bulger is $83,250, with the highest median household income of $104,231 found in the 45 to 64 years age bracket for the primary householder. A total of 48 households (32.2%) fall into this category.
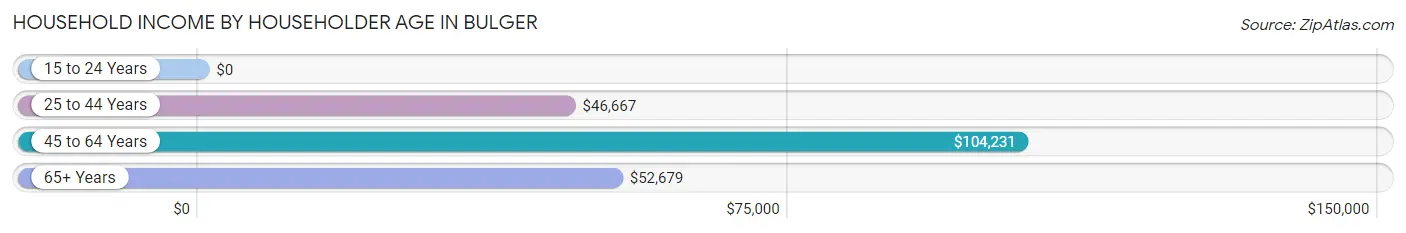
| Income Bracket | # Households | Median Income |
| 15 to 24 Years | 0 (0.0%) | $0 |
| 25 to 44 Years | 60 (40.3%) | $46,667 |
| 45 to 64 Years | 48 (32.2%) | $104,231 |
| 65+ Years | 41 (27.5%) | $52,679 |
| Total | 149 (100.0%) | $83,250 |
Poverty in Bulger
Income Below Poverty by Sex and Age in Bulger
With 26.1% poverty level for males and 12.8% for females among the residents of Bulger, 45 to 54 year old males and 6 to 11 year old females are the most vulnerable to poverty, with 6 males (100.0%) and 6 females (100.0%) in their respective age groups living below the poverty level.
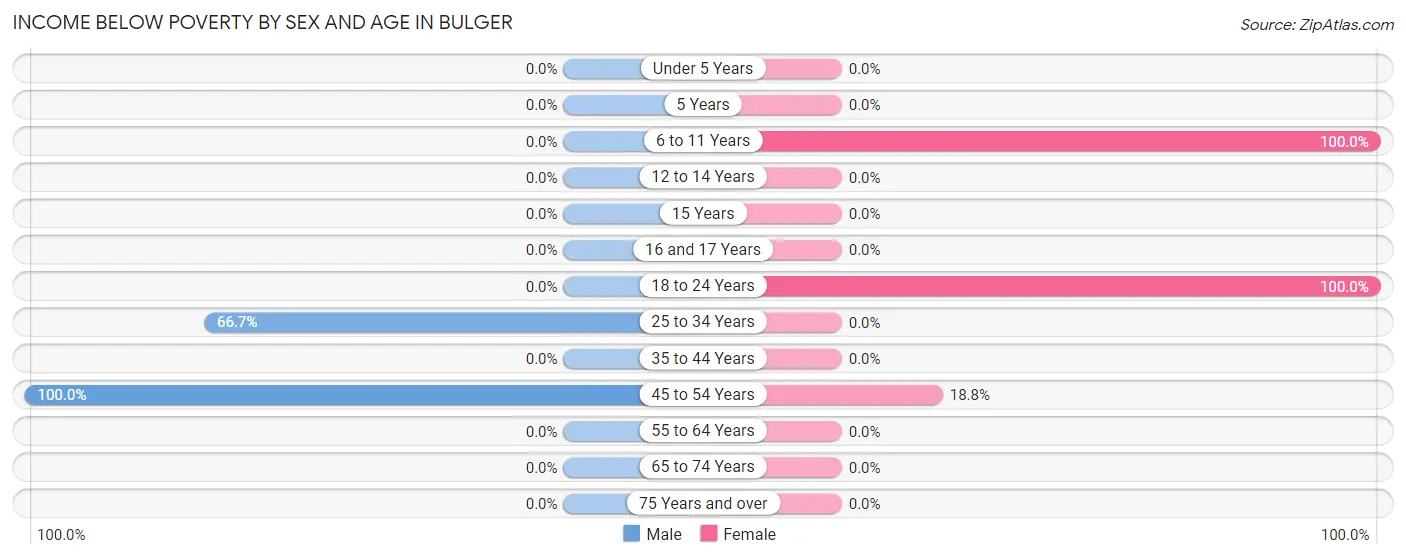
| Age Bracket | Male | Female |
| Under 5 Years | 0 (0.0%) | 0 (0.0%) |
| 5 Years | 0 (0.0%) | 0 (0.0%) |
| 6 to 11 Years | 0 (0.0%) | 6 (100.0%) |
| 12 to 14 Years | 0 (0.0%) | 0 (0.0%) |
| 15 Years | 0 (0.0%) | 0 (0.0%) |
| 16 and 17 Years | 0 (0.0%) | 0 (0.0%) |
| 18 to 24 Years | 0 (0.0%) | 7 (100.0%) |
| 25 to 34 Years | 30 (66.7%) | 0 (0.0%) |
| 35 to 44 Years | 0 (0.0%) | 0 (0.0%) |
| 45 to 54 Years | 6 (100.0%) | 6 (18.8%) |
| 55 to 64 Years | 0 (0.0%) | 0 (0.0%) |
| 65 to 74 Years | 0 (0.0%) | 0 (0.0%) |
| 75 Years and over | 0 (0.0%) | 0 (0.0%) |
| Total | 36 (26.1%) | 19 (12.8%) |
Income Above Poverty by Sex and Age in Bulger
According to the poverty statistics in Bulger, males aged under 5 years and females aged 25 to 34 years are the age groups that are most secure financially, with 100.0% of males and 100.0% of females in these age groups living above the poverty line.
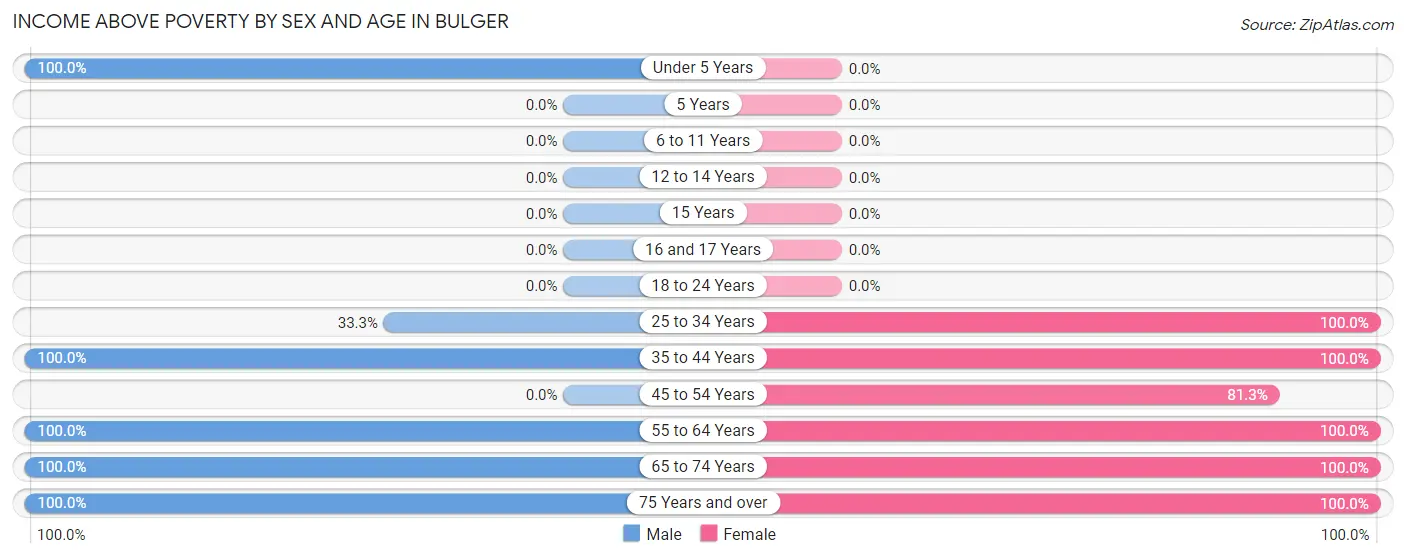
| Age Bracket | Male | Female |
| Under 5 Years | 10 (100.0%) | 0 (0.0%) |
| 5 Years | 0 (0.0%) | 0 (0.0%) |
| 6 to 11 Years | 0 (0.0%) | 0 (0.0%) |
| 12 to 14 Years | 0 (0.0%) | 0 (0.0%) |
| 15 Years | 0 (0.0%) | 0 (0.0%) |
| 16 and 17 Years | 0 (0.0%) | 0 (0.0%) |
| 18 to 24 Years | 0 (0.0%) | 0 (0.0%) |
| 25 to 34 Years | 15 (33.3%) | 40 (100.0%) |
| 35 to 44 Years | 5 (100.0%) | 10 (100.0%) |
| 45 to 54 Years | 0 (0.0%) | 26 (81.2%) |
| 55 to 64 Years | 40 (100.0%) | 8 (100.0%) |
| 65 to 74 Years | 17 (100.0%) | 30 (100.0%) |
| 75 Years and over | 15 (100.0%) | 16 (100.0%) |
| Total | 102 (73.9%) | 130 (87.3%) |
Income Below Poverty Among Married-Couple Families in Bulger
The poverty statistics for married-couple families in Bulger show that 6.6% or 6 of the total 91 families live below the poverty line. Families with 1 or 2 children have the highest poverty rate of 33.3%, comprising of 6 families. On the other hand, families with no children have the lowest poverty rate of 0.0%, which includes 0 families.
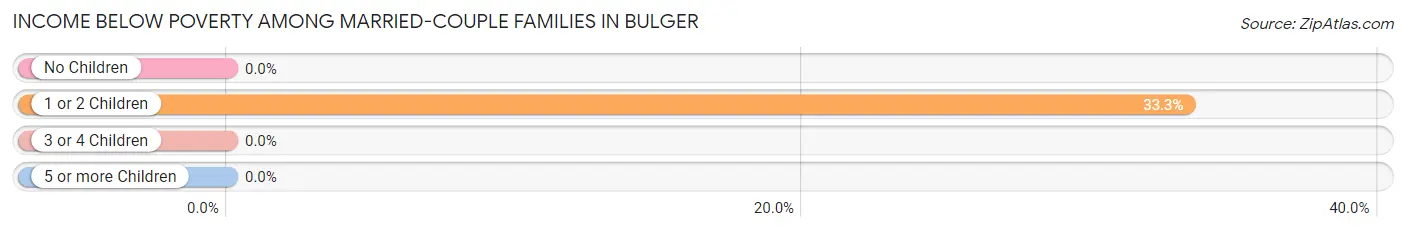
| Children | Above Poverty | Below Poverty |
| No Children | 73 (100.0%) | 0 (0.0%) |
| 1 or 2 Children | 12 (66.7%) | 6 (33.3%) |
| 3 or 4 Children | 0 (0.0%) | 0 (0.0%) |
| 5 or more Children | 0 (0.0%) | 0 (0.0%) |
| Total | 85 (93.4%) | 6 (6.6%) |
Income Below Poverty Among Single-Parent Households in Bulger
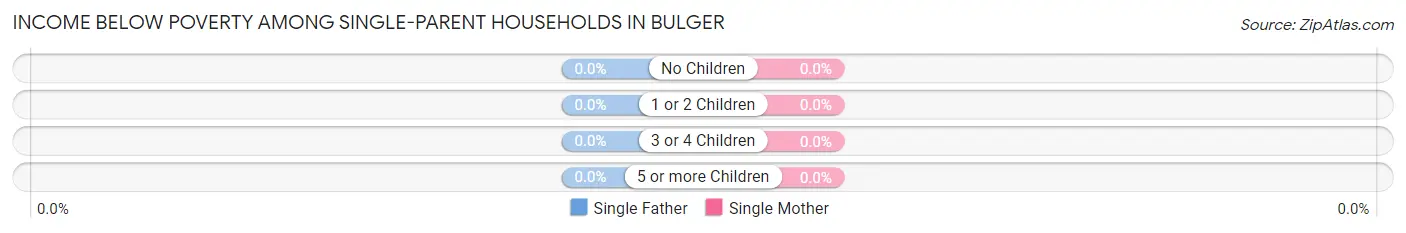
| Children | Single Father | Single Mother |
| No Children | 0 (0.0%) | 0 (0.0%) |
| 1 or 2 Children | 0 (0.0%) | 0 (0.0%) |
| 3 or 4 Children | 0 (0.0%) | 0 (0.0%) |
| 5 or more Children | 0 (0.0%) | 0 (0.0%) |
| Total | 0 (0.0%) | 0 (0.0%) |
Income Below Poverty Among Married-Couple vs Single-Parent Households in Bulger
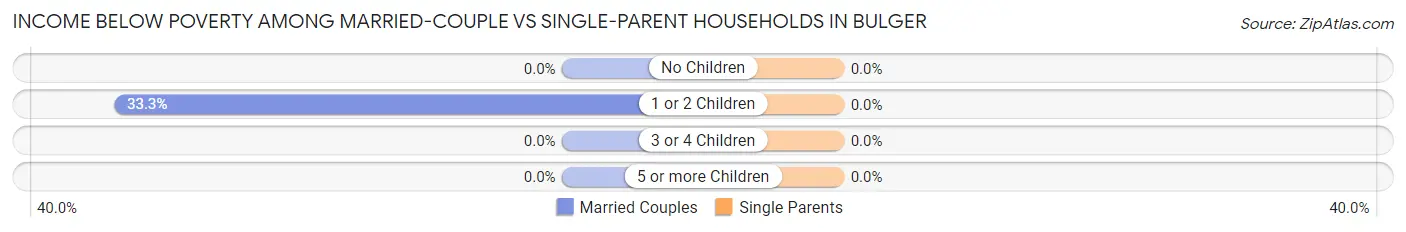
| Children | Married-Couple Families | Single-Parent Households |
| No Children | 0 (0.0%) | 0 (0.0%) |
| 1 or 2 Children | 6 (33.3%) | 0 (0.0%) |
| 3 or 4 Children | 0 (0.0%) | 0 (0.0%) |
| 5 or more Children | 0 (0.0%) | 0 (0.0%) |
| Total | 6 (6.6%) | 0 (0.0%) |
Race in Bulger
The most populous races in Bulger are , and White / Caucasian (314 | 100.0%).
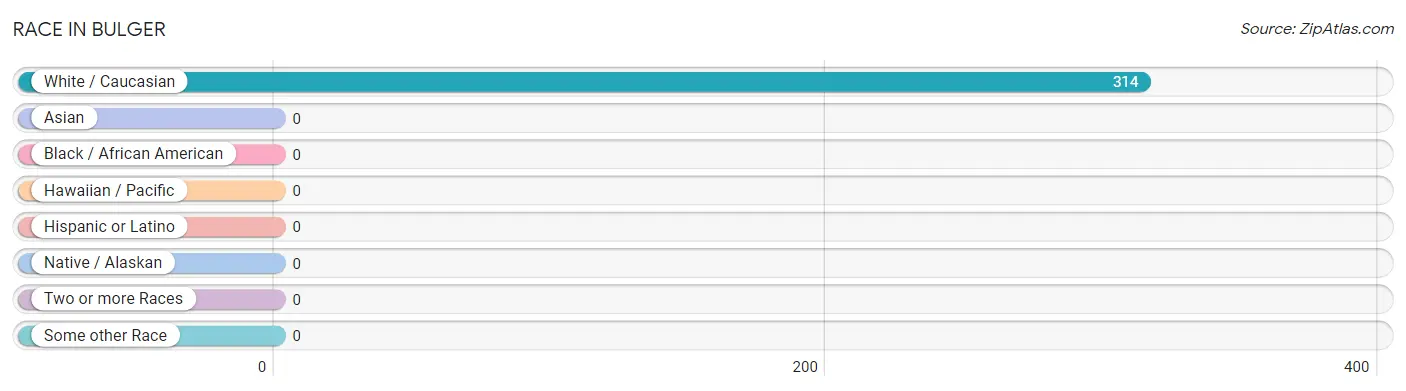
| Race | # Population | % Population |
| Asian | 0 | 0.0% |
| Black / African American | 0 | 0.0% |
| Hawaiian / Pacific | 0 | 0.0% |
| Hispanic or Latino | 0 | 0.0% |
| Native / Alaskan | 0 | 0.0% |
| White / Caucasian | 314 | 100.0% |
| Two or more Races | 0 | 0.0% |
| Some other Race | 0 | 0.0% |
| Total | 314 | 100.0% |
Ancestry in Bulger
The most populous ancestries reported in Bulger are Italian (103 | 32.8%), German (87 | 27.7%), Slovene (47 | 15.0%), Irish (36 | 11.5%), and Scotch-Irish (24 | 7.6%), together accounting for 94.6% of all Bulger residents.
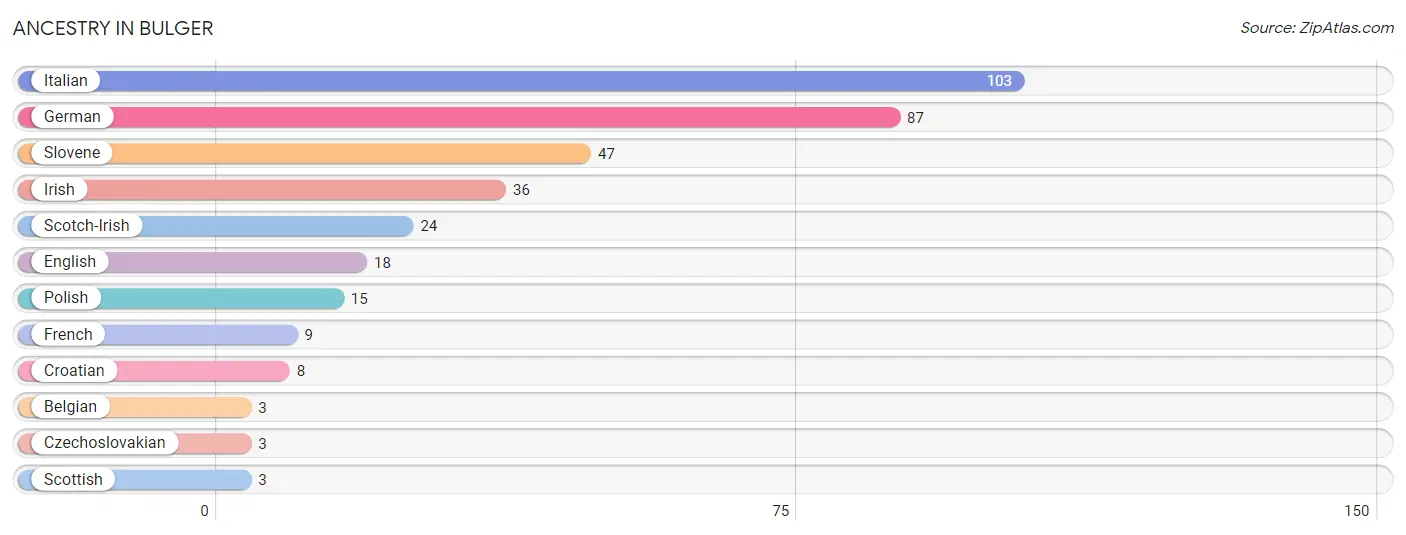
| Ancestry | # Population | % Population |
| Belgian | 3 | 1.0% |
| Croatian | 8 | 2.5% |
| Czechoslovakian | 3 | 1.0% |
| English | 18 | 5.7% |
| French | 9 | 2.9% |
| German | 87 | 27.7% |
| Irish | 36 | 11.5% |
| Italian | 103 | 32.8% |
| Polish | 15 | 4.8% |
| Scotch-Irish | 24 | 7.6% |
| Scottish | 3 | 1.0% |
| Slovene | 47 | 15.0% | View All 12 Rows |
Immigrants in Bulger

| Immigration Origin | # Population | % Population | View All 0 Rows |
Sex and Age in Bulger
Sex and Age in Bulger
The most populous age groups in Bulger are 60 to 64 Years (40 | 29.0%) for men and 30 to 34 Years (37 | 21.0%) for women.
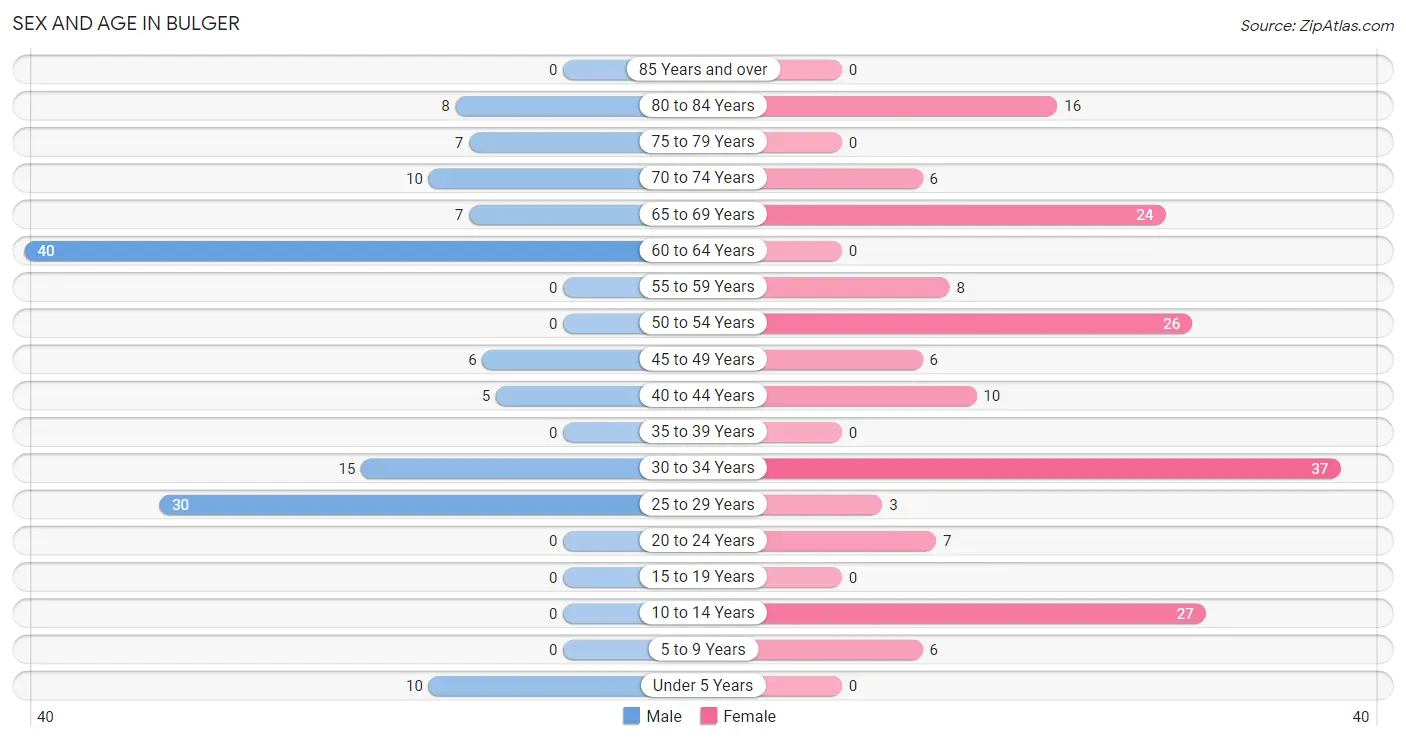
| Age Bracket | Male | Female |
| Under 5 Years | 10 (7.2%) | 0 (0.0%) |
| 5 to 9 Years | 0 (0.0%) | 6 (3.4%) |
| 10 to 14 Years | 0 (0.0%) | 27 (15.3%) |
| 15 to 19 Years | 0 (0.0%) | 0 (0.0%) |
| 20 to 24 Years | 0 (0.0%) | 7 (4.0%) |
| 25 to 29 Years | 30 (21.7%) | 3 (1.7%) |
| 30 to 34 Years | 15 (10.9%) | 37 (21.0%) |
| 35 to 39 Years | 0 (0.0%) | 0 (0.0%) |
| 40 to 44 Years | 5 (3.6%) | 10 (5.7%) |
| 45 to 49 Years | 6 (4.3%) | 6 (3.4%) |
| 50 to 54 Years | 0 (0.0%) | 26 (14.8%) |
| 55 to 59 Years | 0 (0.0%) | 8 (4.5%) |
| 60 to 64 Years | 40 (29.0%) | 0 (0.0%) |
| 65 to 69 Years | 7 (5.1%) | 24 (13.6%) |
| 70 to 74 Years | 10 (7.2%) | 6 (3.4%) |
| 75 to 79 Years | 7 (5.1%) | 0 (0.0%) |
| 80 to 84 Years | 8 (5.8%) | 16 (9.1%) |
| 85 Years and over | 0 (0.0%) | 0 (0.0%) |
| Total | 138 (100.0%) | 176 (100.0%) |
Families and Households in Bulger
Median Family Size in Bulger
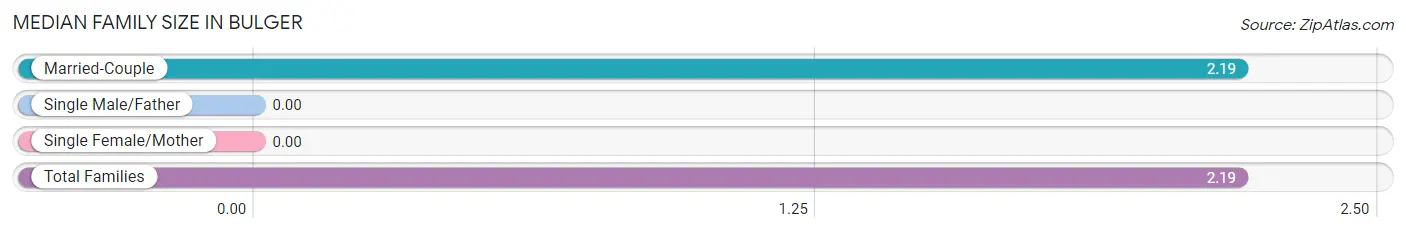
| Family Type | # Families | Family Size |
| Married-Couple | 91 (100.0%) | 2.19 |
| Single Male/Father | 0 (0.0%) | - |
| Single Female/Mother | 0 (0.0%) | - |
| Total Families | 91 (100.0%) | 2.19 |
Median Household Size in Bulger
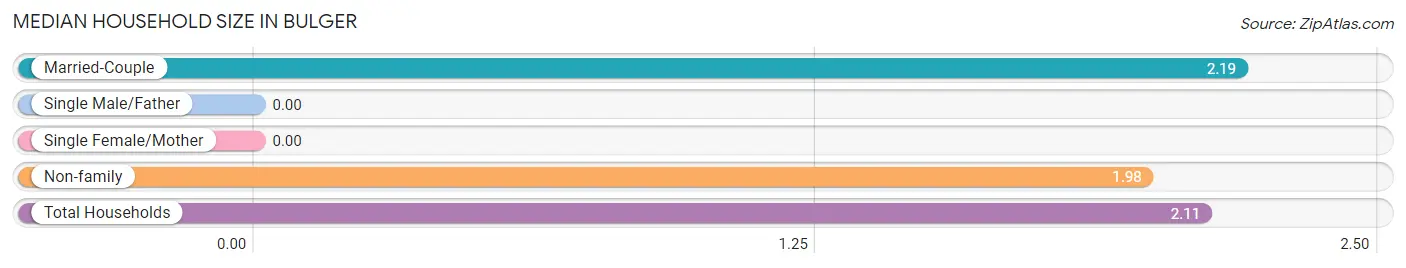
| Household Type | # Households | Household Size |
| Married-Couple | 91 (61.1%) | 2.19 |
| Single Male/Father | 0 (0.0%) | - |
| Single Female/Mother | 0 (0.0%) | - |
| Non-family | 58 (38.9%) | 1.98 |
| Total Households | 149 (100.0%) | 2.11 |
Household Size by Marriage Status in Bulger
Out of a total of 149 households in Bulger, 91 (61.1%) are family households, while 58 (38.9%) are nonfamily households. The most numerous type of family households are 2-person households, comprising 73, and the most common type of nonfamily households are 3-person households, comprising 30.
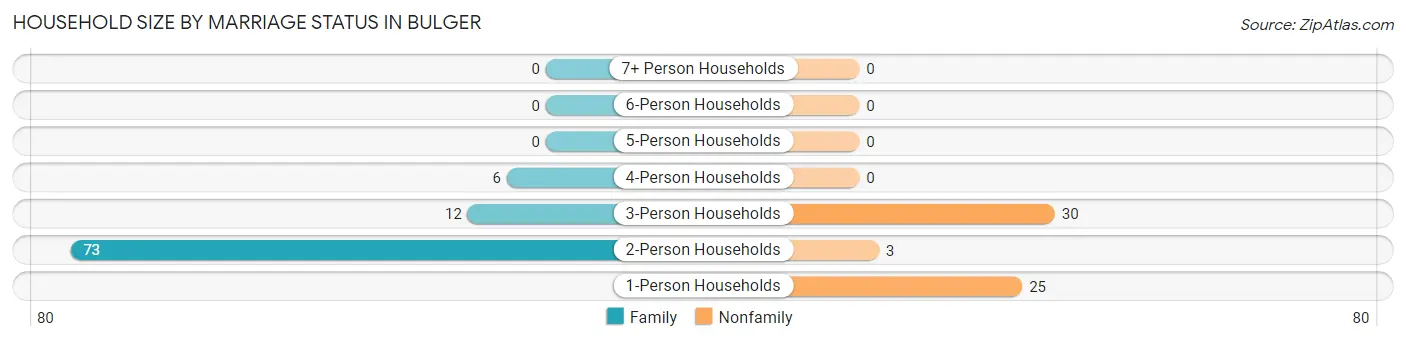
| Household Size | Family Households | Nonfamily Households |
| 1-Person Households | - | 25 (16.8%) |
| 2-Person Households | 73 (49.0%) | 3 (2.0%) |
| 3-Person Households | 12 (8.1%) | 30 (20.1%) |
| 4-Person Households | 6 (4.0%) | 0 (0.0%) |
| 5-Person Households | 0 (0.0%) | 0 (0.0%) |
| 6-Person Households | 0 (0.0%) | 0 (0.0%) |
| 7+ Person Households | 0 (0.0%) | 0 (0.0%) |
| Total | 91 (61.1%) | 58 (38.9%) |
Female Fertility in Bulger
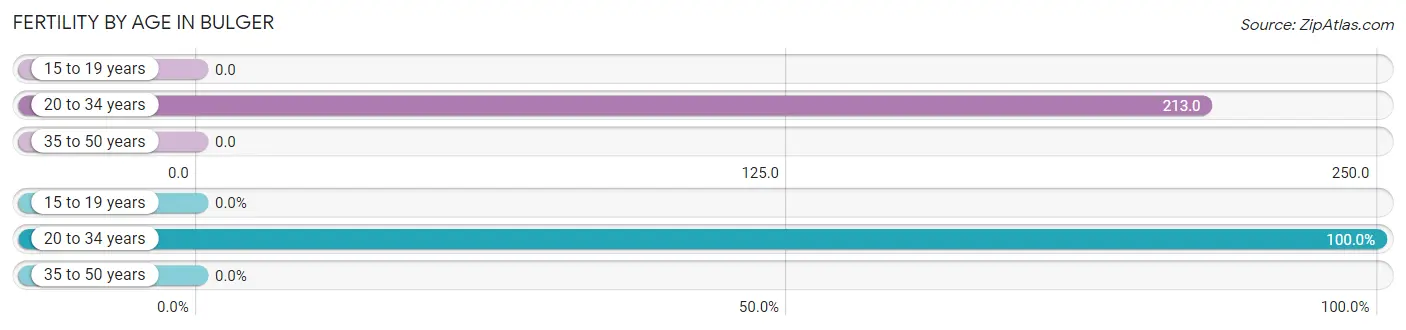
Fertility by Age in Bulger
Average fertility rate in Bulger is 112.0 births per 1,000 women. Women in the age bracket of 20 to 34 years have the highest fertility rate with 213.0 births per 1,000 women. Women in the age bracket of 20 to 34 years acount for 100.0% of all women with births.
| Age Bracket | Women with Births | Births / 1,000 Women |
| 15 to 19 years | 0 (0.0%) | 0.0 |
| 20 to 34 years | 10 (100.0%) | 213.0 |
| 35 to 50 years | 0 (0.0%) | 0.0 |
| Total | 10 (100.0%) | 112.0 |
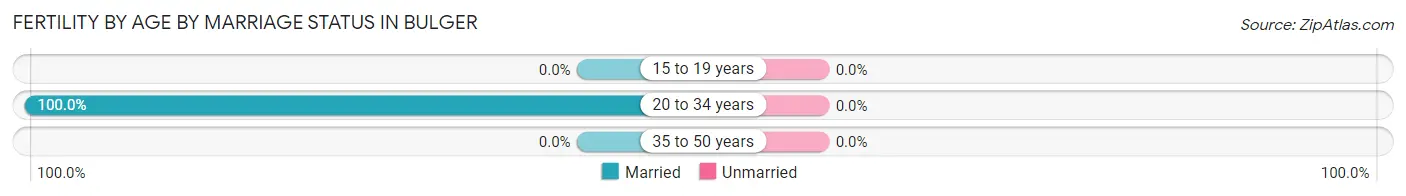
Fertility by Age by Marriage Status in Bulger
| Age Bracket | Married | Unmarried |
| 15 to 19 years | 0 (0.0%) | 0 (0.0%) |
| 20 to 34 years | 10 (100.0%) | 0 (0.0%) |
| 35 to 50 years | 0 (0.0%) | 0 (0.0%) |
| Total | 10 (100.0%) | 0 (0.0%) |
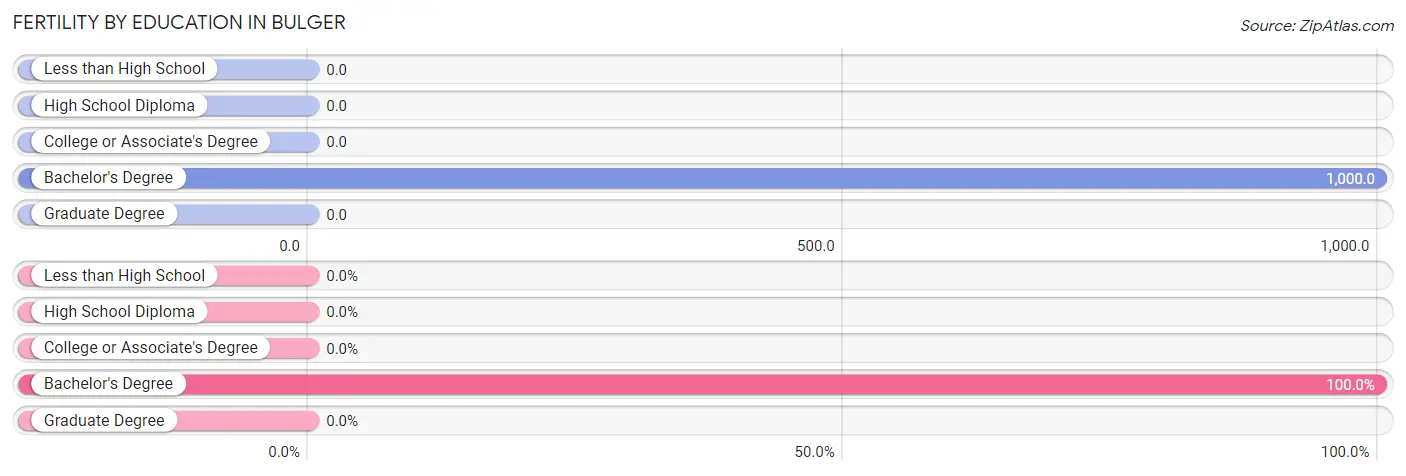
Fertility by Education in Bulger
| Educational Attainment | Women with Births | Births / 1,000 Women |
| Less than High School | 0 (0.0%) | 0.0 |
| High School Diploma | 0 (0.0%) | 0.0 |
| College or Associate's Degree | 0 (0.0%) | 0.0 |
| Bachelor's Degree | 10 (100.0%) | 1,000.0 |
| Graduate Degree | 0 (0.0%) | 0.0 |
| Total | 10 (100.0%) | 112.0 |
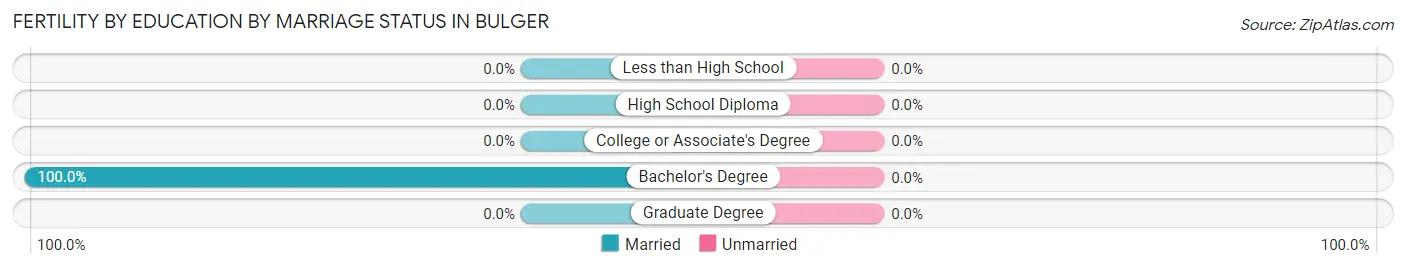
Fertility by Education by Marriage Status in Bulger
| Educational Attainment | Married | Unmarried |
| Less than High School | 0 (0.0%) | 0 (0.0%) |
| High School Diploma | 0 (0.0%) | 0 (0.0%) |
| College or Associate's Degree | 0 (0.0%) | 0 (0.0%) |
| Bachelor's Degree | 10 (100.0%) | 0 (0.0%) |
| Graduate Degree | 0 (0.0%) | 0 (0.0%) |
| Total | 10 (100.0%) | 0 (0.0%) |
Employment Characteristics in Bulger
Employment by Class of Employer in Bulger
Among the 148 employed individuals in Bulger, private company employees (121 | 81.8%), and local government employees (27 | 18.2%) make up the most common classes of employment.
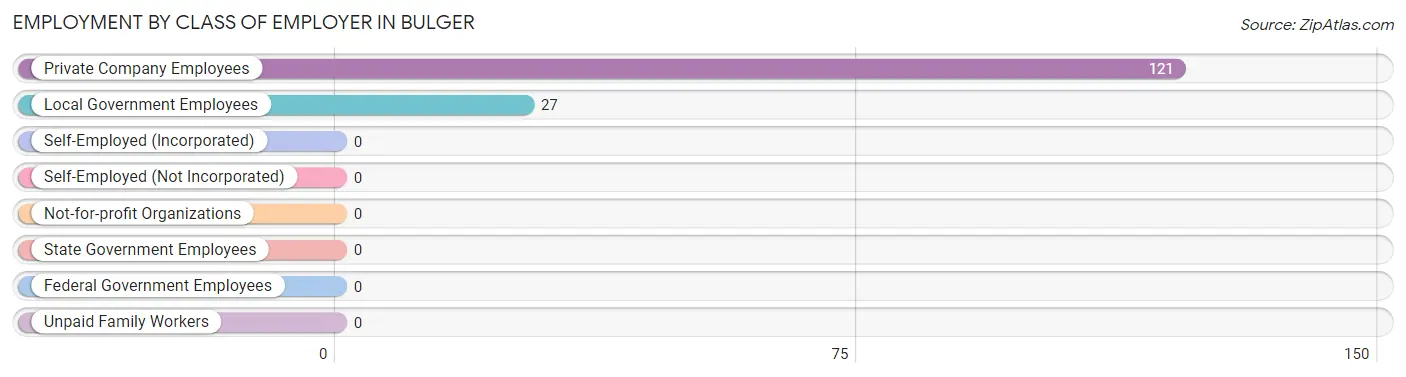
| Employer Class | # Employees | % Employees |
| Private Company Employees | 121 | 81.8% |
| Self-Employed (Incorporated) | 0 | 0.0% |
| Self-Employed (Not Incorporated) | 0 | 0.0% |
| Not-for-profit Organizations | 0 | 0.0% |
| Local Government Employees | 27 | 18.2% |
| State Government Employees | 0 | 0.0% |
| Federal Government Employees | 0 | 0.0% |
| Unpaid Family Workers | 0 | 0.0% |
| Total | 148 | 100.0% |
Employment Status by Age in Bulger
According to the labor force statistics for Bulger, out of the total population over 16 years of age (271), 68.6% or 186 individuals are in the labor force, with 20.4% or 38 of them unemployed. The age group with the highest labor force participation rate is 20 to 24 years, with 100.0% or 7 individuals in the labor force. Within the labor force, the 25 to 29 years age range has the highest percentage of unemployed individuals, with 90.9% or 30 of them being unemployed.
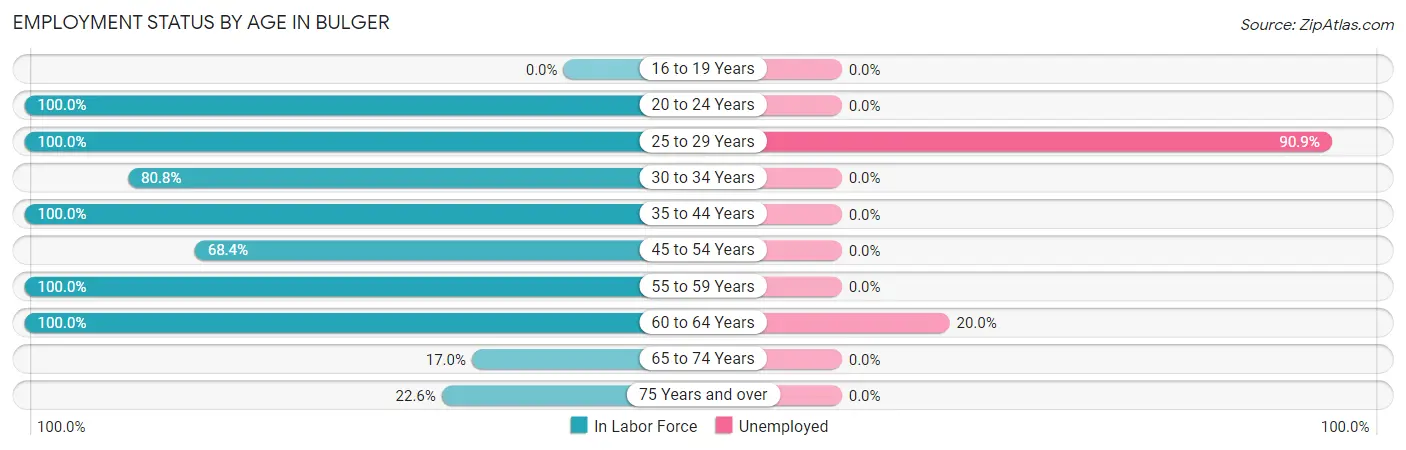
| Age Bracket | In Labor Force | Unemployed |
| 16 to 19 Years | 0 (0.0%) | 0 (0.0%) |
| 20 to 24 Years | 7 (100.0%) | 0 (0.0%) |
| 25 to 29 Years | 33 (100.0%) | 30 (90.9%) |
| 30 to 34 Years | 42 (80.8%) | 0 (0.0%) |
| 35 to 44 Years | 15 (100.0%) | 0 (0.0%) |
| 45 to 54 Years | 26 (68.4%) | 0 (0.0%) |
| 55 to 59 Years | 8 (100.0%) | 0 (0.0%) |
| 60 to 64 Years | 40 (100.0%) | 8 (20.0%) |
| 65 to 74 Years | 8 (17.0%) | 0 (0.0%) |
| 75 Years and over | 7 (22.6%) | 0 (0.0%) |
| Total | 186 (68.6%) | 38 (20.4%) |
Employment Status by Educational Attainment in Bulger
According to labor force statistics for Bulger, 88.2% of individuals (164) out of the total population between 25 and 64 years of age (186) are in the labor force, with 23.2% or 38 of them being unemployed. The group with the highest labor force participation rate are those with the educational attainment of college / associate degree, with 100.0% or 40 individuals in the labor force. Within the labor force, individuals with high school diploma education have the highest percentage of unemployment, with 34.1% or 30 of them being unemployed.
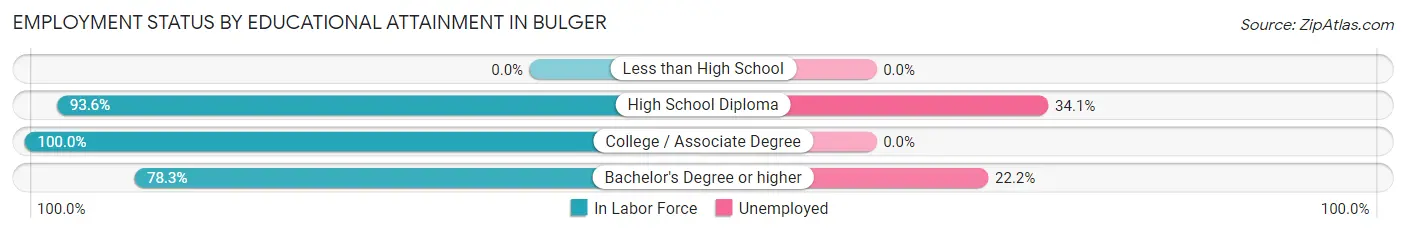
| Educational Attainment | In Labor Force | Unemployed |
| Less than High School | 0 (0.0%) | 0 (0.0%) |
| High School Diploma | 88 (93.6%) | 32 (34.1%) |
| College / Associate Degree | 40 (100.0%) | 0 (0.0%) |
| Bachelor's Degree or higher | 36 (78.3%) | 10 (22.2%) |
| Total | 164 (88.2%) | 43 (23.2%) |
Employment Occupations by Sex in Bulger
Management, Business, Science and Arts Occupations
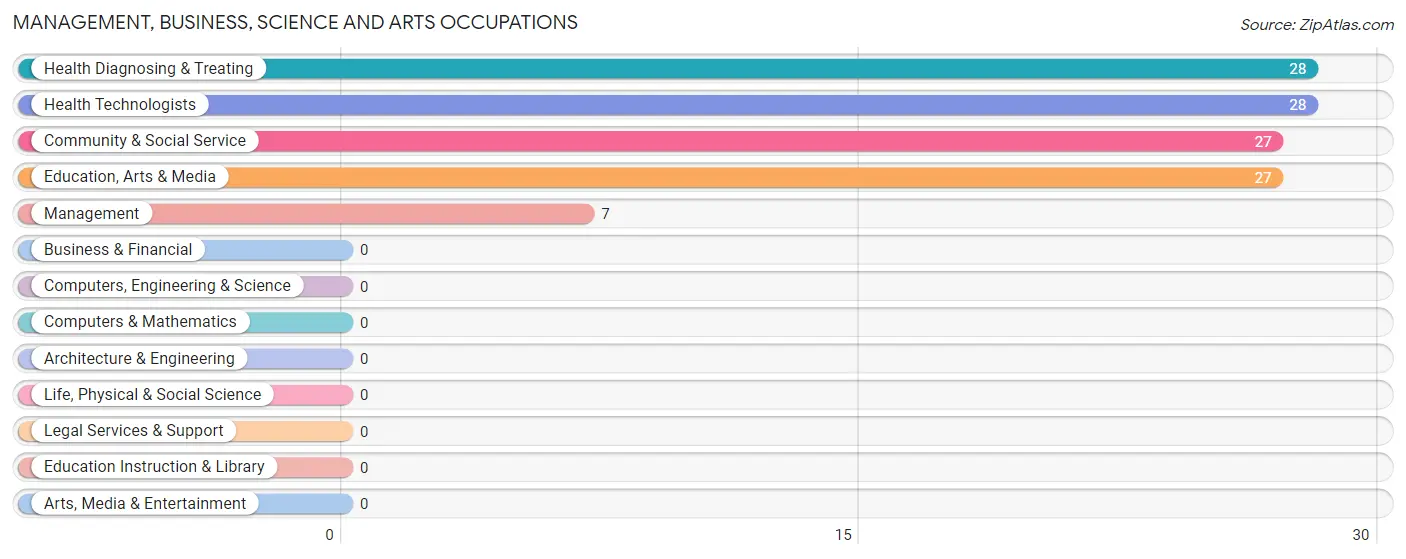
The most common Management, Business, Science and Arts occupations in Bulger are Health Diagnosing & Treating (28 | 18.9%), Health Technologists (28 | 18.9%), Community & Social Service (27 | 18.2%), Education, Arts & Media (27 | 18.2%), and Management (7 | 4.7%).
Management, Business, Science and Arts Occupations by Sex
Within the Management, Business, Science and Arts occupations in Bulger, the most male-oriented occupations are Management (100.0%), Health Diagnosing & Treating (71.4%), and Health Technologists (71.4%), while the most female-oriented occupations are Community & Social Service (100.0%), Education, Arts & Media (100.0%), and Health Diagnosing & Treating (28.6%).
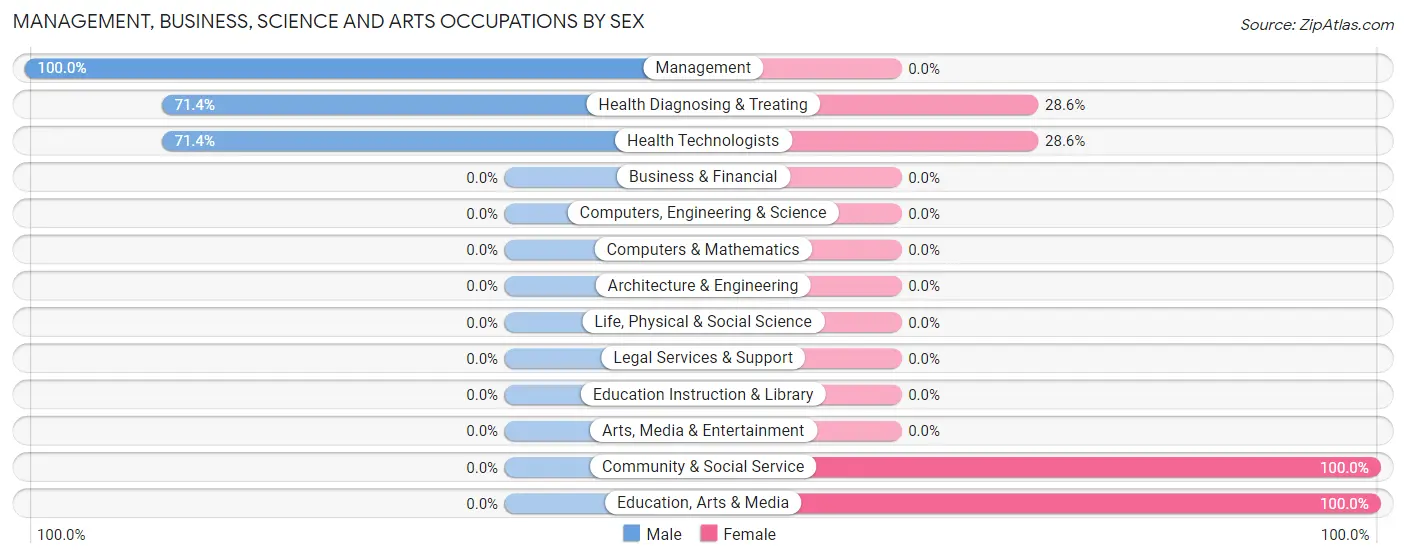
| Occupation | Male | Female |
| Management | 7 (100.0%) | 0 (0.0%) |
| Business & Financial | 0 (0.0%) | 0 (0.0%) |
| Computers, Engineering & Science | 0 (0.0%) | 0 (0.0%) |
| Computers & Mathematics | 0 (0.0%) | 0 (0.0%) |
| Architecture & Engineering | 0 (0.0%) | 0 (0.0%) |
| Life, Physical & Social Science | 0 (0.0%) | 0 (0.0%) |
| Community & Social Service | 0 (0.0%) | 27 (100.0%) |
| Education, Arts & Media | 0 (0.0%) | 27 (100.0%) |
| Legal Services & Support | 0 (0.0%) | 0 (0.0%) |
| Education Instruction & Library | 0 (0.0%) | 0 (0.0%) |
| Arts, Media & Entertainment | 0 (0.0%) | 0 (0.0%) |
| Health Diagnosing & Treating | 20 (71.4%) | 8 (28.6%) |
| Health Technologists | 20 (71.4%) | 8 (28.6%) |
| Total (Category) | 27 (43.5%) | 35 (56.5%) |
| Total (Overall) | 59 (39.9%) | 89 (60.1%) |
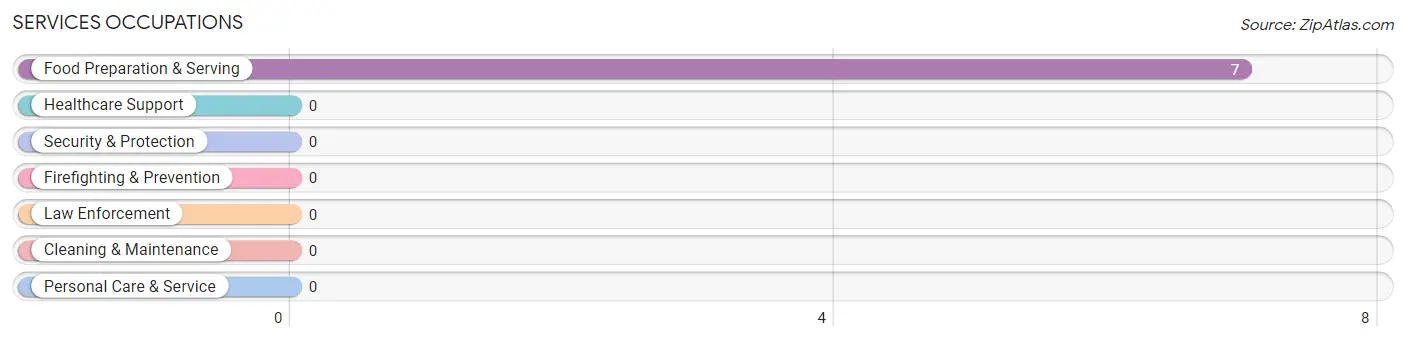
Services Occupations
The most common Services occupations in Bulger are , and Food Preparation & Serving (7 | 4.7%).
Services Occupations by Sex
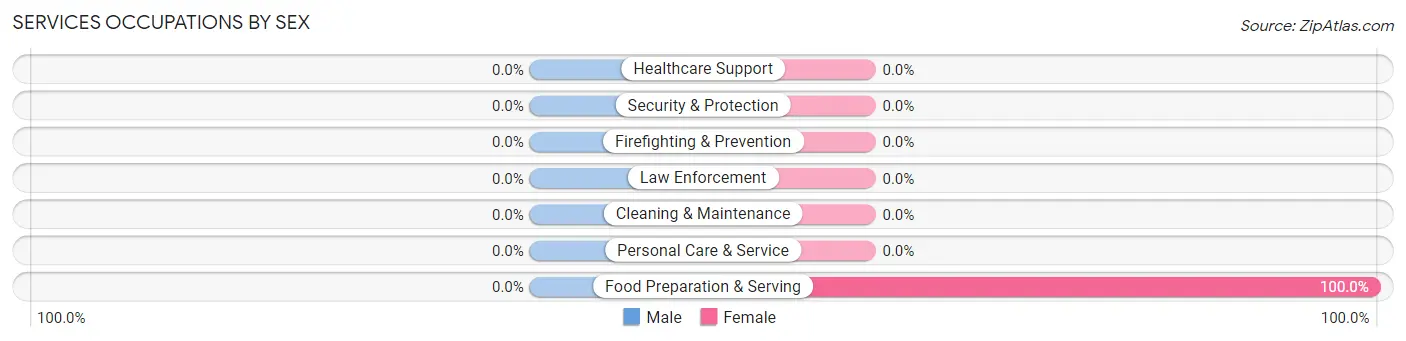
| Occupation | Male | Female |
| Healthcare Support | 0 (0.0%) | 0 (0.0%) |
| Security & Protection | 0 (0.0%) | 0 (0.0%) |
| Firefighting & Prevention | 0 (0.0%) | 0 (0.0%) |
| Law Enforcement | 0 (0.0%) | 0 (0.0%) |
| Food Preparation & Serving | 0 (0.0%) | 7 (100.0%) |
| Cleaning & Maintenance | 0 (0.0%) | 0 (0.0%) |
| Personal Care & Service | 0 (0.0%) | 0 (0.0%) |
| Total (Category) | 0 (0.0%) | 7 (100.0%) |
| Total (Overall) | 59 (39.9%) | 89 (60.1%) |
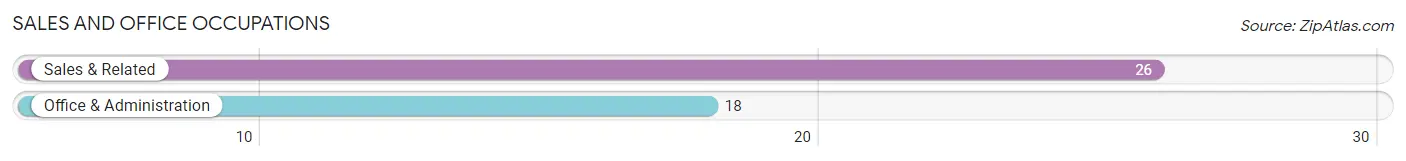
Sales and Office Occupations
The most common Sales and Office occupations in Bulger are Sales & Related (26 | 17.6%), and Office & Administration (18 | 12.2%).
Sales and Office Occupations by Sex

| Occupation | Male | Female |
| Sales & Related | 0 (0.0%) | 26 (100.0%) |
| Office & Administration | 0 (0.0%) | 18 (100.0%) |
| Total (Category) | 0 (0.0%) | 44 (100.0%) |
| Total (Overall) | 59 (39.9%) | 89 (60.1%) |
Natural Resources, Construction and Maintenance Occupations
The most common Natural Resources, Construction and Maintenance occupations in Bulger are , and Installation, Maintenance & Repair (24 | 16.2%).
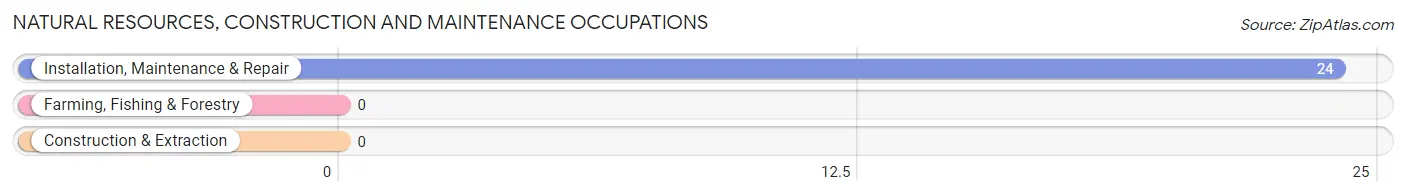
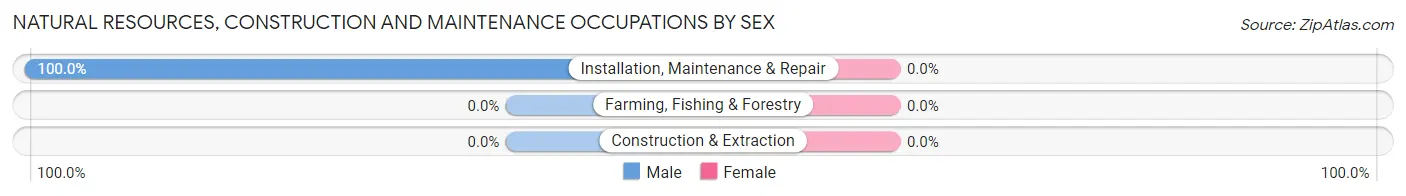
Natural Resources, Construction and Maintenance Occupations by Sex
| Occupation | Male | Female |
| Farming, Fishing & Forestry | 0 (0.0%) | 0 (0.0%) |
| Construction & Extraction | 0 (0.0%) | 0 (0.0%) |
| Installation, Maintenance & Repair | 24 (100.0%) | 0 (0.0%) |
| Total (Category) | 24 (100.0%) | 0 (0.0%) |
| Total (Overall) | 59 (39.9%) | 89 (60.1%) |
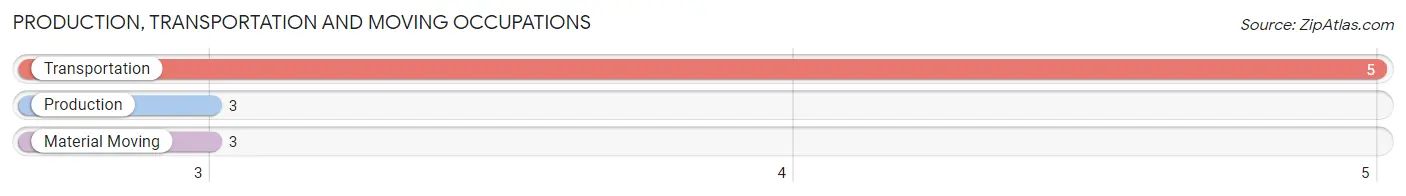
Production, Transportation and Moving Occupations
The most common Production, Transportation and Moving occupations in Bulger are Transportation (5 | 3.4%), Production (3 | 2.0%), and Material Moving (3 | 2.0%).
Production, Transportation and Moving Occupations by Sex
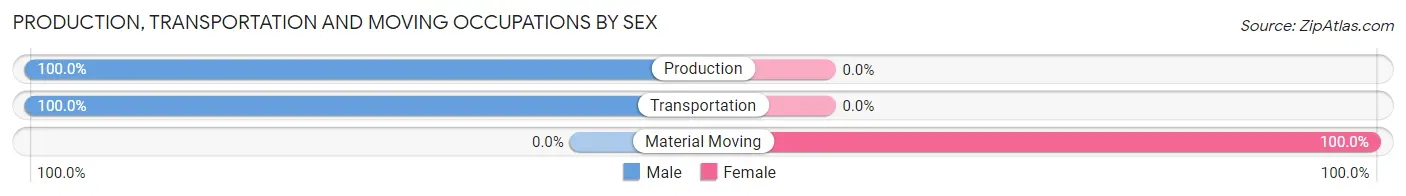
| Occupation | Male | Female |
| Production | 3 (100.0%) | 0 (0.0%) |
| Transportation | 5 (100.0%) | 0 (0.0%) |
| Material Moving | 0 (0.0%) | 3 (100.0%) |
| Total (Category) | 8 (72.7%) | 3 (27.3%) |
| Total (Overall) | 59 (39.9%) | 89 (60.1%) |
Employment Industries by Sex in Bulger
Employment Industries in Bulger
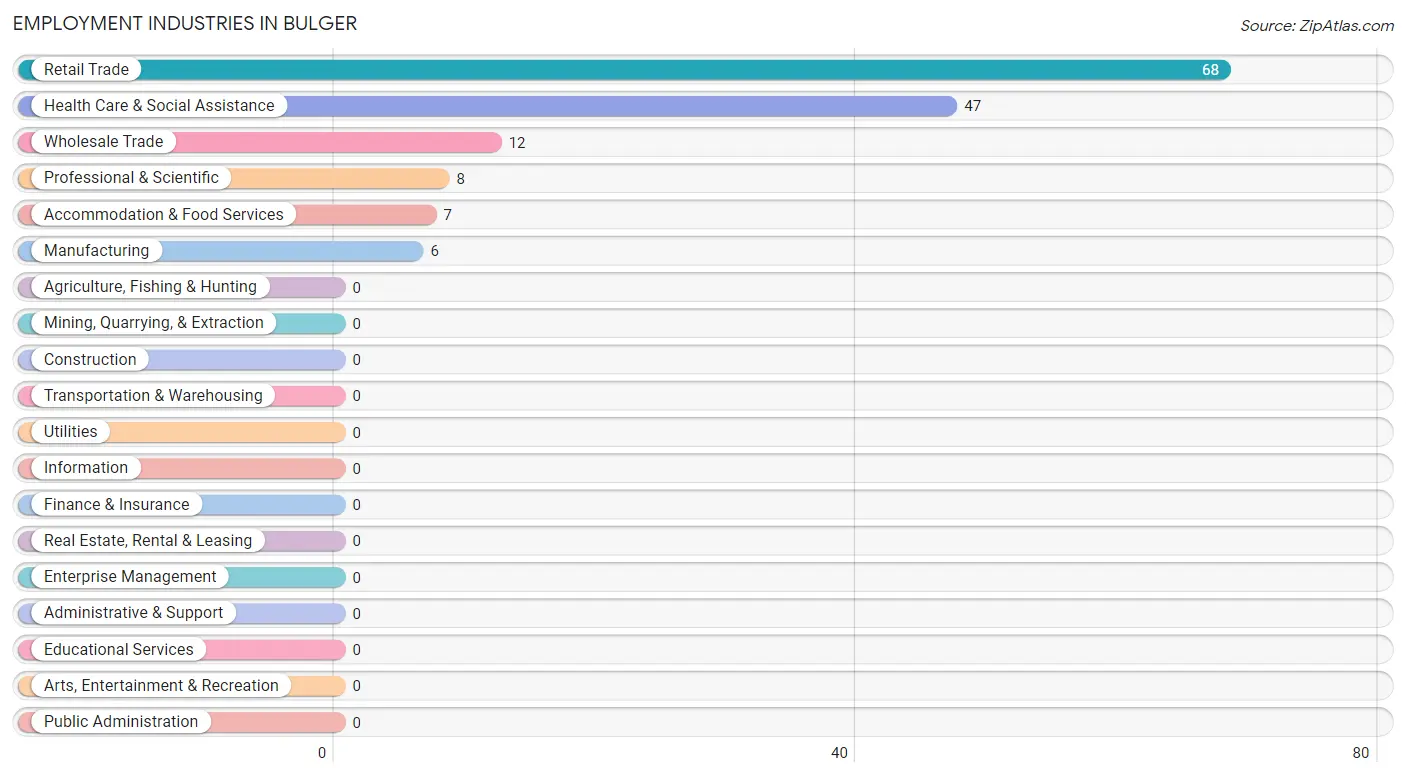
The major employment industries in Bulger include Retail Trade (68 | 46.0%), Health Care & Social Assistance (47 | 31.8%), Wholesale Trade (12 | 8.1%), Professional & Scientific (8 | 5.4%), and Accommodation & Food Services (7 | 4.7%).
Employment Industries by Sex in Bulger
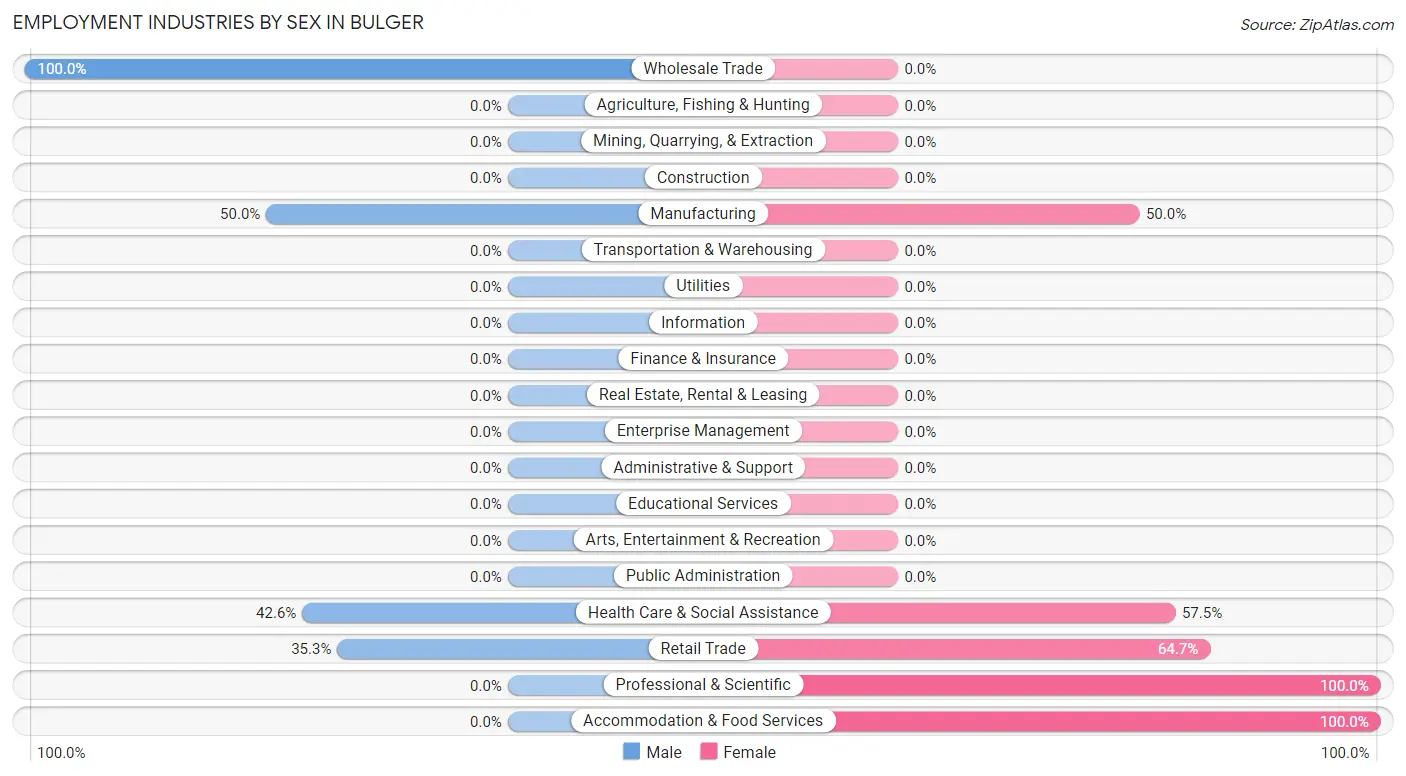
The Bulger industries that see more men than women are Wholesale Trade (100.0%), Manufacturing (50.0%), and Health Care & Social Assistance (42.5%), whereas the industries that tend to have a higher number of women are Professional & Scientific (100.0%), Accommodation & Food Services (100.0%), and Retail Trade (64.7%).
| Industry | Male | Female |
| Agriculture, Fishing & Hunting | 0 (0.0%) | 0 (0.0%) |
| Mining, Quarrying, & Extraction | 0 (0.0%) | 0 (0.0%) |
| Construction | 0 (0.0%) | 0 (0.0%) |
| Manufacturing | 3 (50.0%) | 3 (50.0%) |
| Wholesale Trade | 12 (100.0%) | 0 (0.0%) |
| Retail Trade | 24 (35.3%) | 44 (64.7%) |
| Transportation & Warehousing | 0 (0.0%) | 0 (0.0%) |
| Utilities | 0 (0.0%) | 0 (0.0%) |
| Information | 0 (0.0%) | 0 (0.0%) |
| Finance & Insurance | 0 (0.0%) | 0 (0.0%) |
| Real Estate, Rental & Leasing | 0 (0.0%) | 0 (0.0%) |
| Professional & Scientific | 0 (0.0%) | 8 (100.0%) |
| Enterprise Management | 0 (0.0%) | 0 (0.0%) |
| Administrative & Support | 0 (0.0%) | 0 (0.0%) |
| Educational Services | 0 (0.0%) | 0 (0.0%) |
| Health Care & Social Assistance | 20 (42.5%) | 27 (57.5%) |
| Arts, Entertainment & Recreation | 0 (0.0%) | 0 (0.0%) |
| Accommodation & Food Services | 0 (0.0%) | 7 (100.0%) |
| Public Administration | 0 (0.0%) | 0 (0.0%) |
| Total | 59 (39.9%) | 89 (60.1%) |
Education in Bulger
School Enrollment in Bulger
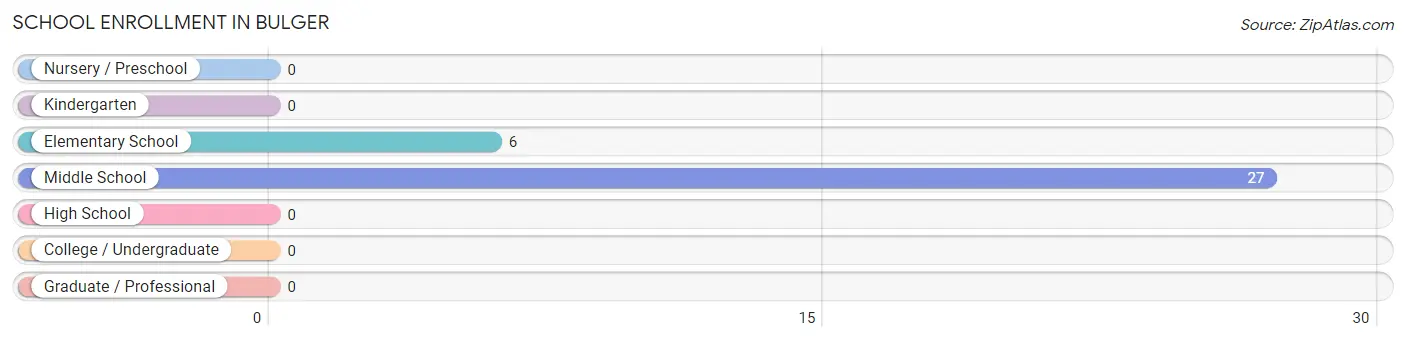
The most common levels of schooling among the 33 students in Bulger are middle school (27 | 81.8%), and elementary school (6 | 18.2%).
| School Level | # Students | % Students |
| Nursery / Preschool | 0 | 0.0% |
| Kindergarten | 0 | 0.0% |
| Elementary School | 6 | 18.2% |
| Middle School | 27 | 81.8% |
| High School | 0 | 0.0% |
| College / Undergraduate | 0 | 0.0% |
| Graduate / Professional | 0 | 0.0% |
| Total | 33 | 100.0% |
School Enrollment by Age by Funding Source in Bulger
| Age Bracket | Public School | Private School |
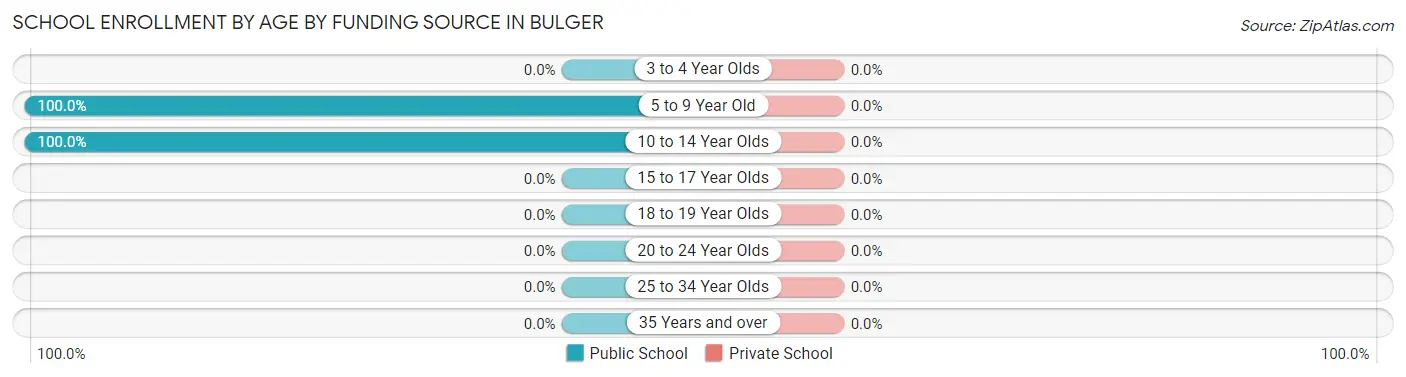
| 3 to 4 Year Olds | 0 (0.0%) | 0 (0.0%) |
| 5 to 9 Year Old | 6 (100.0%) | 0 (0.0%) |
| 10 to 14 Year Olds | 27 (100.0%) | 0 (0.0%) |
| 15 to 17 Year Olds | 0 (0.0%) | 0 (0.0%) |
| 18 to 19 Year Olds | 0 (0.0%) | 0 (0.0%) |
| 20 to 24 Year Olds | 0 (0.0%) | 0 (0.0%) |
| 25 to 34 Year Olds | 0 (0.0%) | 0 (0.0%) |
| 35 Years and over | 0 (0.0%) | 0 (0.0%) |
| Total | 33 (100.0%) | 0 (0.0%) |
Educational Attainment by Field of Study in Bulger
Engineering (16 | 25.8%), science & technology (16 | 25.8%), bio, nature & agricultural (12 | 19.4%), business (10 | 16.1%), and physical & health sciences (8 | 12.9%) are the most common fields of study among 62 individuals in Bulger who have obtained a bachelor's degree or higher.
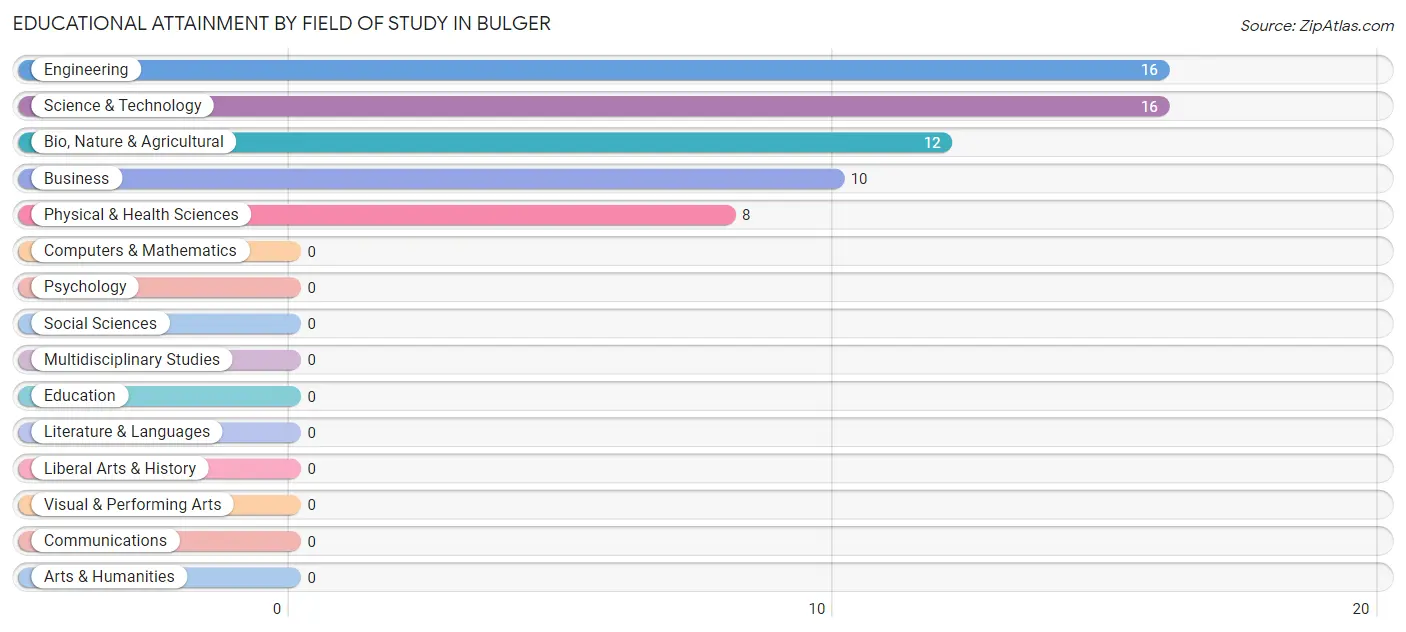
| Field of Study | # Graduates | % Graduates |
| Computers & Mathematics | 0 | 0.0% |
| Bio, Nature & Agricultural | 12 | 19.4% |
| Physical & Health Sciences | 8 | 12.9% |
| Psychology | 0 | 0.0% |
| Social Sciences | 0 | 0.0% |
| Engineering | 16 | 25.8% |
| Multidisciplinary Studies | 0 | 0.0% |
| Science & Technology | 16 | 25.8% |
| Business | 10 | 16.1% |
| Education | 0 | 0.0% |
| Literature & Languages | 0 | 0.0% |
| Liberal Arts & History | 0 | 0.0% |
| Visual & Performing Arts | 0 | 0.0% |
| Communications | 0 | 0.0% |
| Arts & Humanities | 0 | 0.0% |
| Total | 62 | 100.0% |
Transportation & Commute in Bulger
Vehicle Availability by Sex in Bulger
The most prevalent vehicle ownership categories in Bulger are males with 2 vehicles (43, accounting for 72.9%) and females with 2 vehicles (60, making up 48.3%).
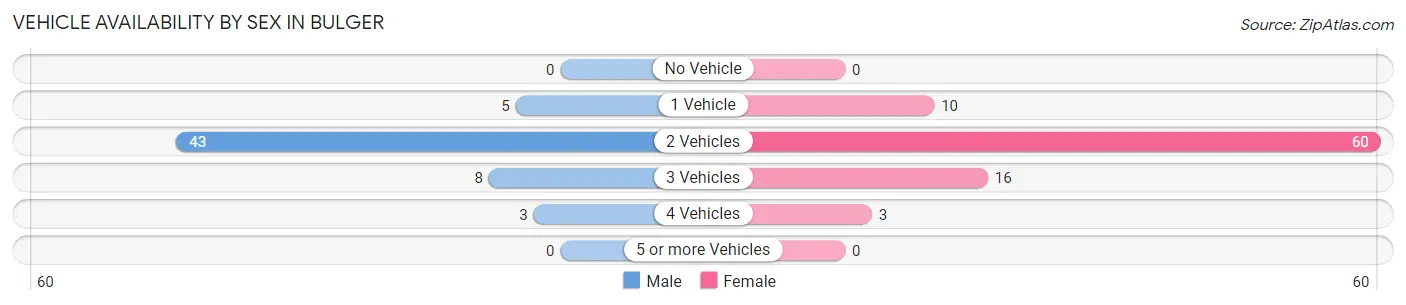
| Vehicles Available | Male | Female |
| No Vehicle | 0 (0.0%) | 0 (0.0%) |
| 1 Vehicle | 5 (8.5%) | 10 (11.2%) |
| 2 Vehicles | 43 (72.9%) | 60 (67.4%) |
| 3 Vehicles | 8 (13.6%) | 16 (18.0%) |
| 4 Vehicles | 3 (5.1%) | 3 (3.4%) |
| 5 or more Vehicles | 0 (0.0%) | 0 (0.0%) |
| Total | 59 (100.0%) | 89 (100.0%) |
Commute Time in Bulger
The most frequently occuring commute durations in Bulger are 30 to 34 minutes (37 commuters, 26.8%), 40 to 44 minutes (27 commuters, 19.6%), and 20 to 24 minutes (26 commuters, 18.8%).
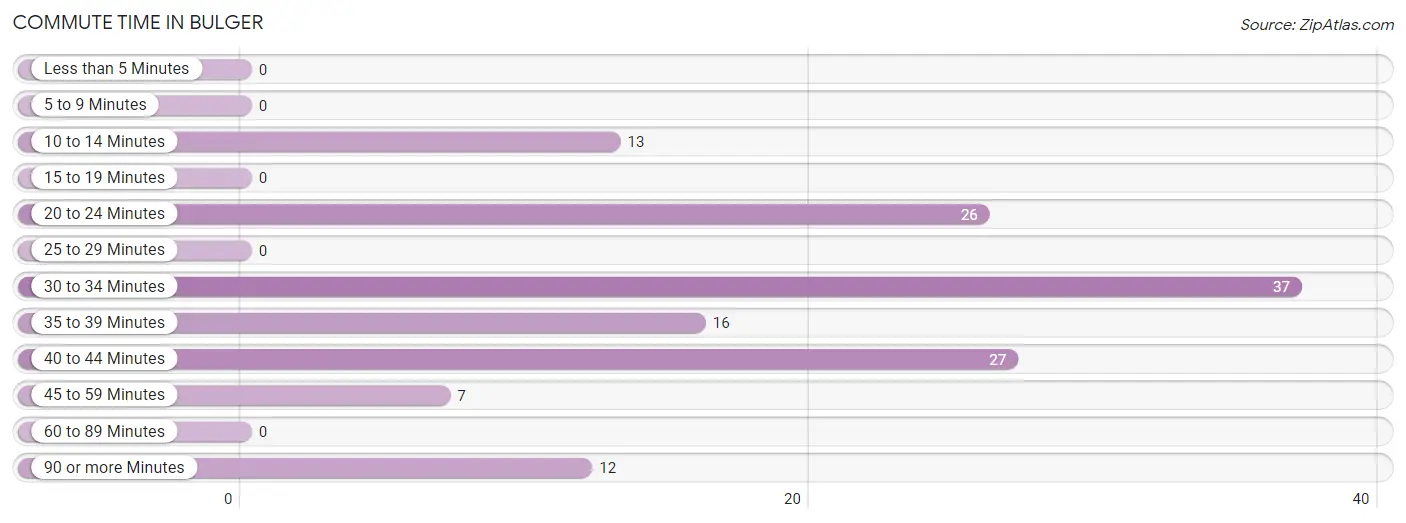
| Commute Time | # Commuters | % Commuters |
| Less than 5 Minutes | 0 | 0.0% |
| 5 to 9 Minutes | 0 | 0.0% |
| 10 to 14 Minutes | 13 | 9.4% |
| 15 to 19 Minutes | 0 | 0.0% |
| 20 to 24 Minutes | 26 | 18.8% |
| 25 to 29 Minutes | 0 | 0.0% |
| 30 to 34 Minutes | 37 | 26.8% |
| 35 to 39 Minutes | 16 | 11.6% |
| 40 to 44 Minutes | 27 | 19.6% |
| 45 to 59 Minutes | 7 | 5.1% |
| 60 to 89 Minutes | 0 | 0.0% |
| 90 or more Minutes | 12 | 8.7% |
Commute Time by Sex in Bulger
The most common commute times in Bulger are 30 to 34 minutes (27 commuters, 45.8%) for males and 40 to 44 minutes (27 commuters, 34.2%) for females.
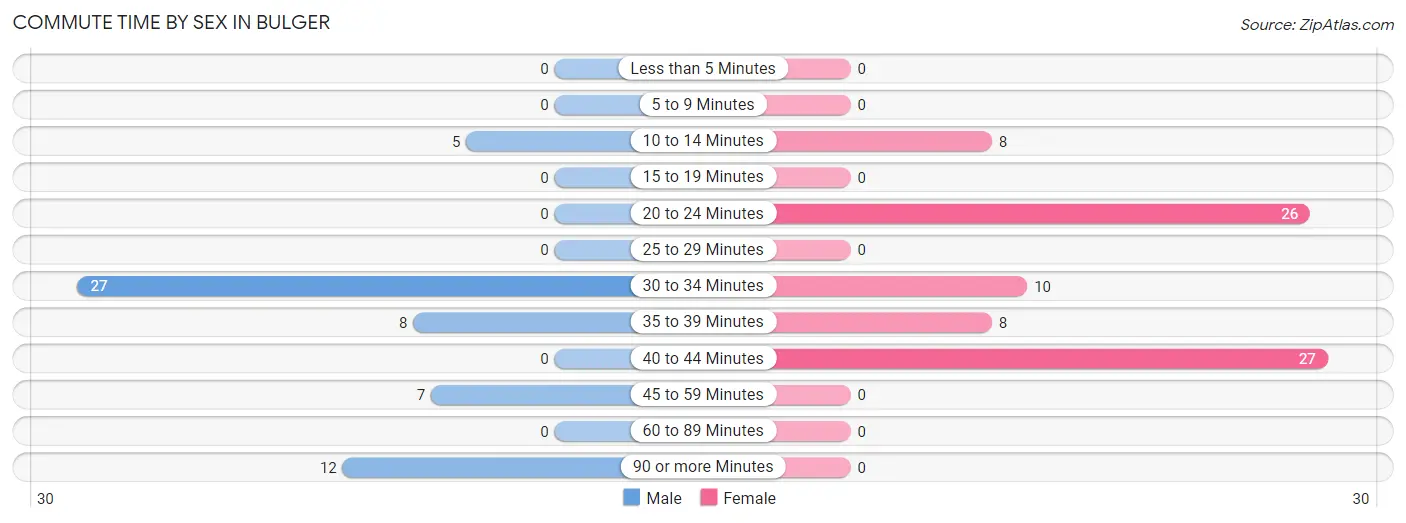
| Commute Time | Male | Female |
| Less than 5 Minutes | 0 (0.0%) | 0 (0.0%) |
| 5 to 9 Minutes | 0 (0.0%) | 0 (0.0%) |
| 10 to 14 Minutes | 5 (8.5%) | 8 (10.1%) |
| 15 to 19 Minutes | 0 (0.0%) | 0 (0.0%) |
| 20 to 24 Minutes | 0 (0.0%) | 26 (32.9%) |
| 25 to 29 Minutes | 0 (0.0%) | 0 (0.0%) |
| 30 to 34 Minutes | 27 (45.8%) | 10 (12.7%) |
| 35 to 39 Minutes | 8 (13.6%) | 8 (10.1%) |
| 40 to 44 Minutes | 0 (0.0%) | 27 (34.2%) |
| 45 to 59 Minutes | 7 (11.9%) | 0 (0.0%) |
| 60 to 89 Minutes | 0 (0.0%) | 0 (0.0%) |
| 90 or more Minutes | 12 (20.3%) | 0 (0.0%) |
Time of Departure to Work by Sex in Bulger
The most frequent times of departure to work in Bulger are 7:00 AM to 7:29 AM (44, 74.6%) for males and 7:00 AM to 7:29 AM (27, 34.2%) for females.
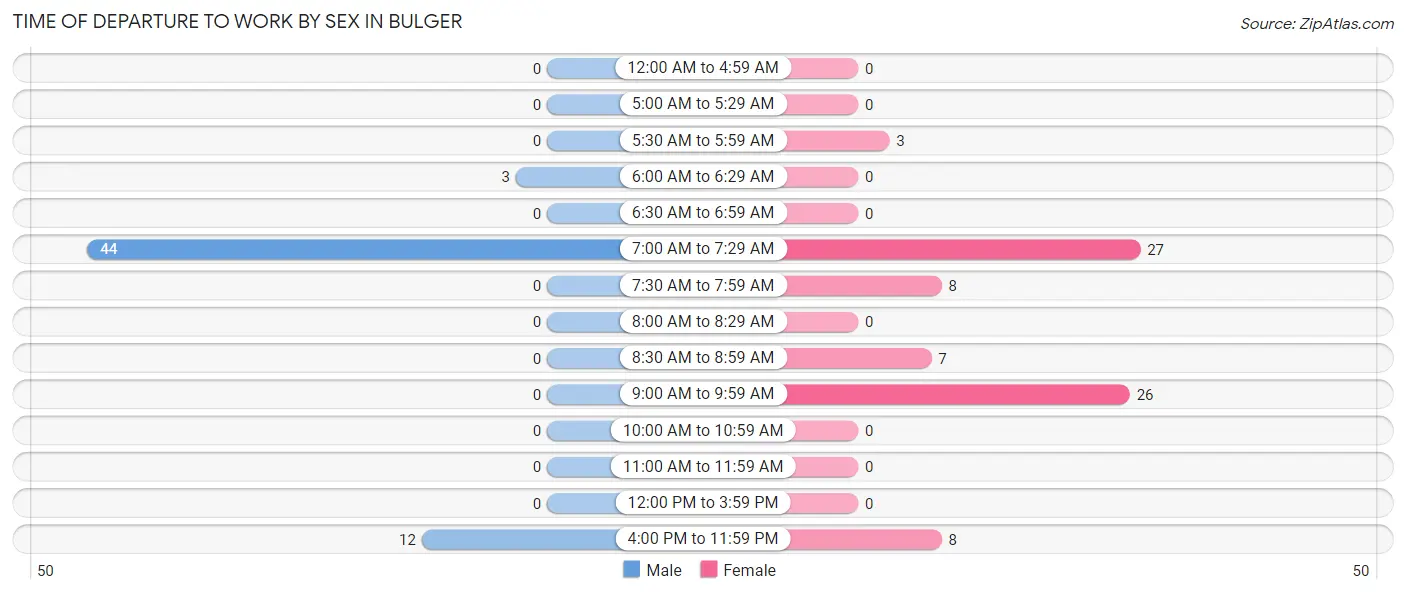
| Time of Departure | Male | Female |
| 12:00 AM to 4:59 AM | 0 (0.0%) | 0 (0.0%) |
| 5:00 AM to 5:29 AM | 0 (0.0%) | 0 (0.0%) |
| 5:30 AM to 5:59 AM | 0 (0.0%) | 3 (3.8%) |
| 6:00 AM to 6:29 AM | 3 (5.1%) | 0 (0.0%) |
| 6:30 AM to 6:59 AM | 0 (0.0%) | 0 (0.0%) |
| 7:00 AM to 7:29 AM | 44 (74.6%) | 27 (34.2%) |
| 7:30 AM to 7:59 AM | 0 (0.0%) | 8 (10.1%) |
| 8:00 AM to 8:29 AM | 0 (0.0%) | 0 (0.0%) |
| 8:30 AM to 8:59 AM | 0 (0.0%) | 7 (8.9%) |
| 9:00 AM to 9:59 AM | 0 (0.0%) | 26 (32.9%) |
| 10:00 AM to 10:59 AM | 0 (0.0%) | 0 (0.0%) |
| 11:00 AM to 11:59 AM | 0 (0.0%) | 0 (0.0%) |
| 12:00 PM to 3:59 PM | 0 (0.0%) | 0 (0.0%) |
| 4:00 PM to 11:59 PM | 12 (20.3%) | 8 (10.1%) |
| Total | 59 (100.0%) | 79 (100.0%) |
Housing Occupancy in Bulger
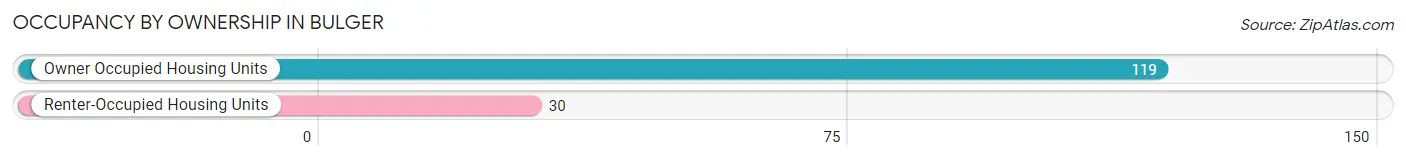
Occupancy by Ownership in Bulger
Of the total 149 dwellings in Bulger, owner-occupied units account for 119 (79.9%), while renter-occupied units make up 30 (20.1%).
| Occupancy | # Housing Units | % Housing Units |
| Owner Occupied Housing Units | 119 | 79.9% |
| Renter-Occupied Housing Units | 30 | 20.1% |
| Total Occupied Housing Units | 149 | 100.0% |
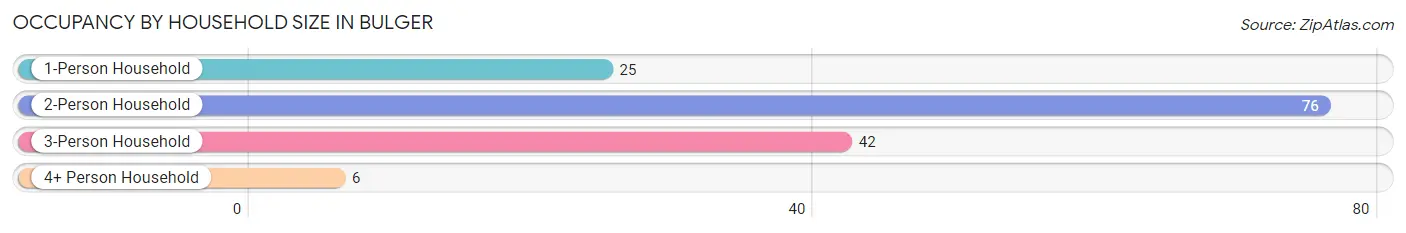
Occupancy by Household Size in Bulger
| Household Size | # Housing Units | % Housing Units |
| 1-Person Household | 25 | 16.8% |
| 2-Person Household | 76 | 51.0% |
| 3-Person Household | 42 | 28.2% |
| 4+ Person Household | 6 | 4.0% |
| Total Housing Units | 149 | 100.0% |
Occupancy by Ownership by Household Size in Bulger
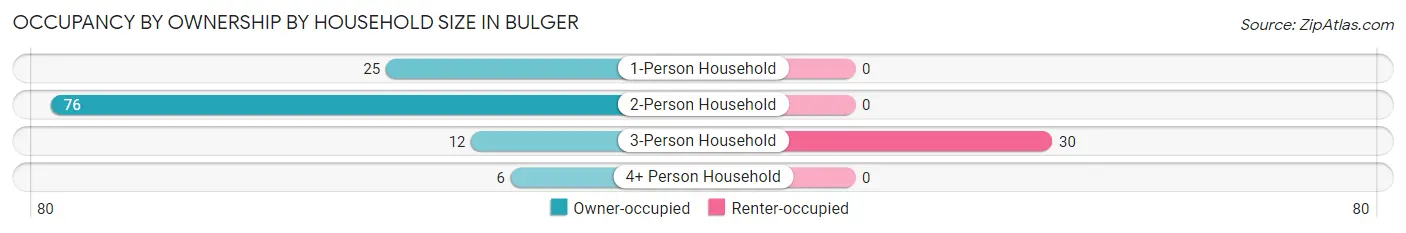
| Household Size | Owner-occupied | Renter-occupied |
| 1-Person Household | 25 (100.0%) | 0 (0.0%) |
| 2-Person Household | 76 (100.0%) | 0 (0.0%) |
| 3-Person Household | 12 (28.6%) | 30 (71.4%) |
| 4+ Person Household | 6 (100.0%) | 0 (0.0%) |
| Total Housing Units | 119 (79.9%) | 30 (20.1%) |
Occupancy by Educational Attainment in Bulger
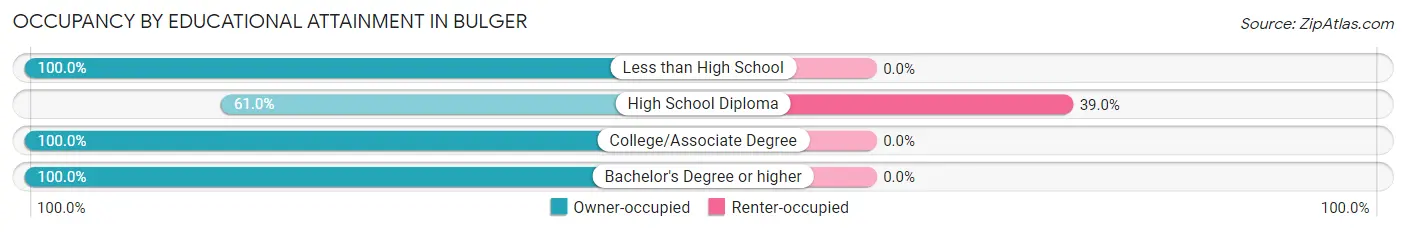
| Household Size | Owner-occupied | Renter-occupied |
| Less than High School | 16 (100.0%) | 0 (0.0%) |
| High School Diploma | 47 (61.0%) | 30 (39.0%) |
| College/Associate Degree | 20 (100.0%) | 0 (0.0%) |
| Bachelor's Degree or higher | 36 (100.0%) | 0 (0.0%) |
Occupancy by Age of Householder in Bulger
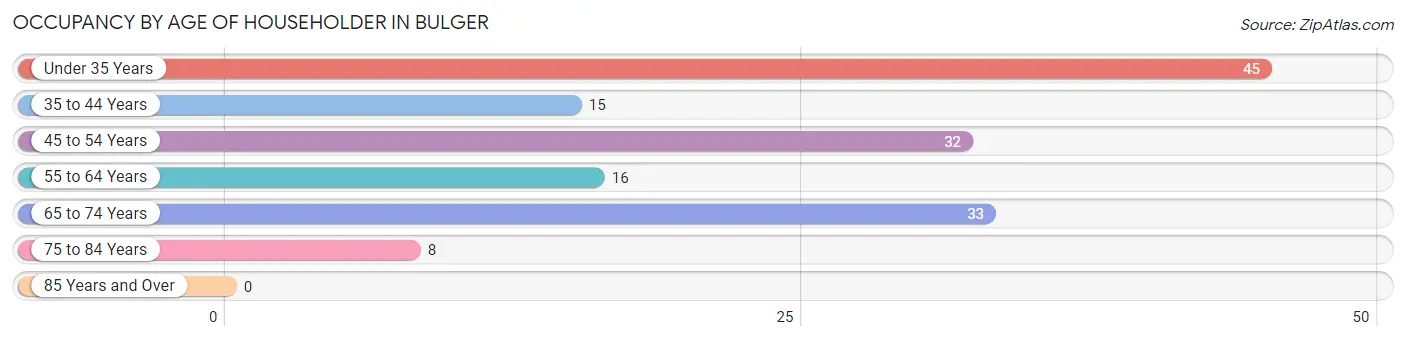
| Age Bracket | # Households | % Households |
| Under 35 Years | 45 | 30.2% |
| 35 to 44 Years | 15 | 10.1% |
| 45 to 54 Years | 32 | 21.5% |
| 55 to 64 Years | 16 | 10.7% |
| 65 to 74 Years | 33 | 22.2% |
| 75 to 84 Years | 8 | 5.4% |
| 85 Years and Over | 0 | 0.0% |
| Total | 149 | 100.0% |
Housing Finances in Bulger
Median Income by Occupancy in Bulger
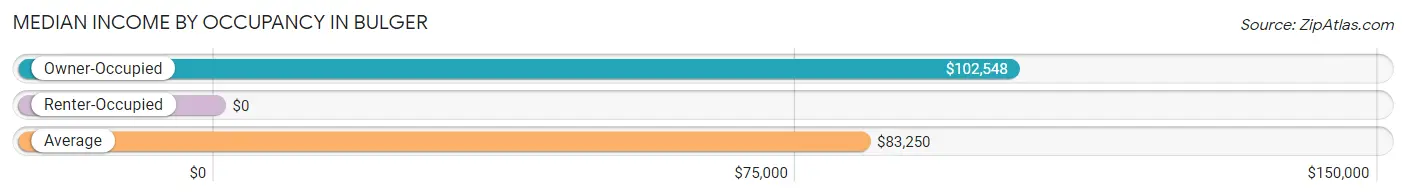
| Occupancy Type | # Households | Median Income |
| Owner-Occupied | 119 (79.9%) | $102,548 |
| Renter-Occupied | 30 (20.1%) | $0 |
| Average | 149 (100.0%) | $83,250 |
Occupancy by Householder Income Bracket in Bulger
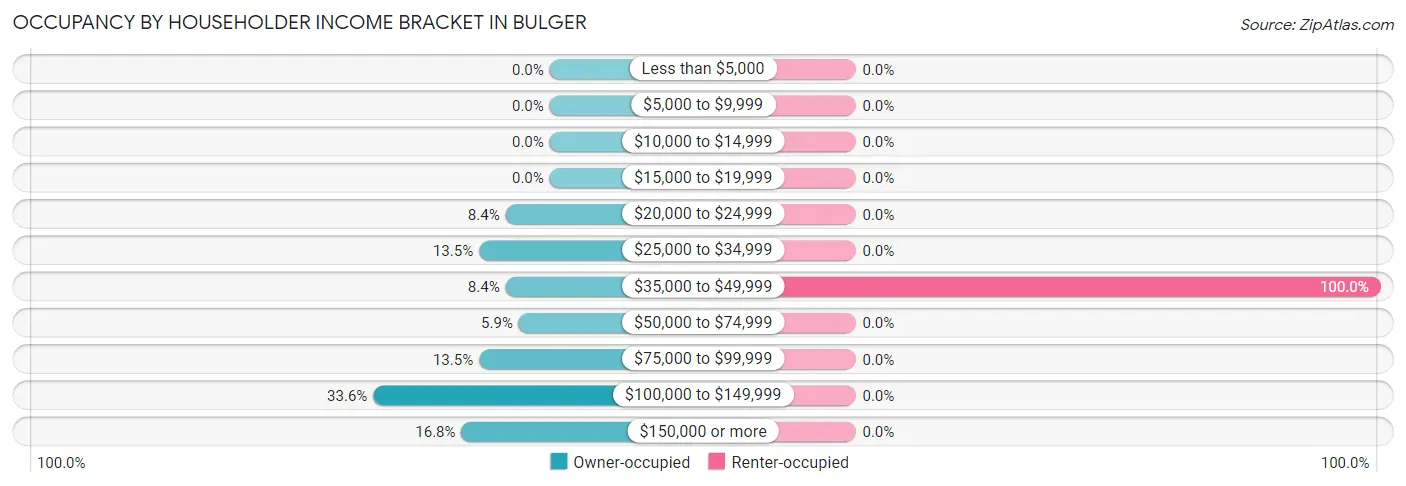
| Income Bracket | Owner-occupied | Renter-occupied |
| Less than $5,000 | 0 (0.0%) | 0 (0.0%) |
| $5,000 to $9,999 | 0 (0.0%) | 0 (0.0%) |
| $10,000 to $14,999 | 0 (0.0%) | 0 (0.0%) |
| $15,000 to $19,999 | 0 (0.0%) | 0 (0.0%) |
| $20,000 to $24,999 | 10 (8.4%) | 0 (0.0%) |
| $25,000 to $34,999 | 16 (13.5%) | 0 (0.0%) |
| $35,000 to $49,999 | 10 (8.4%) | 30 (100.0%) |
| $50,000 to $74,999 | 7 (5.9%) | 0 (0.0%) |
| $75,000 to $99,999 | 16 (13.5%) | 0 (0.0%) |
| $100,000 to $149,999 | 40 (33.6%) | 0 (0.0%) |
| $150,000 or more | 20 (16.8%) | 0 (0.0%) |
| Total | 119 (100.0%) | 30 (100.0%) |
Monthly Housing Cost Tiers in Bulger
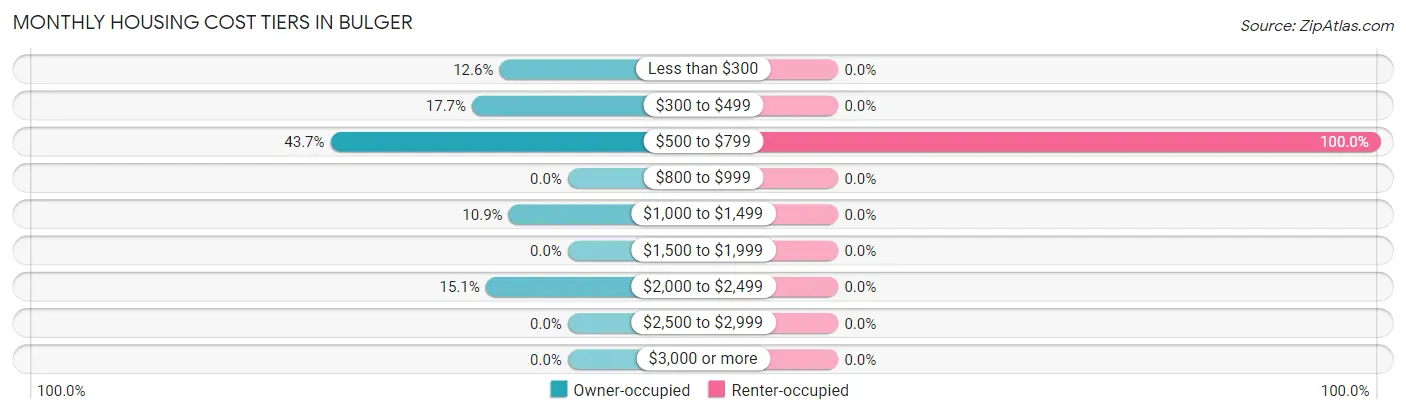
| Monthly Cost | Owner-occupied | Renter-occupied |
| Less than $300 | 15 (12.6%) | 0 (0.0%) |
| $300 to $499 | 21 (17.6%) | 0 (0.0%) |
| $500 to $799 | 52 (43.7%) | 30 (100.0%) |
| $800 to $999 | 0 (0.0%) | 0 (0.0%) |
| $1,000 to $1,499 | 13 (10.9%) | 0 (0.0%) |
| $1,500 to $1,999 | 0 (0.0%) | 0 (0.0%) |
| $2,000 to $2,499 | 18 (15.1%) | 0 (0.0%) |
| $2,500 to $2,999 | 0 (0.0%) | 0 (0.0%) |
| $3,000 or more | 0 (0.0%) | 0 (0.0%) |
| Total | 119 (100.0%) | 30 (100.0%) |
Physical Housing Characteristics in Bulger
Housing Structures in Bulger
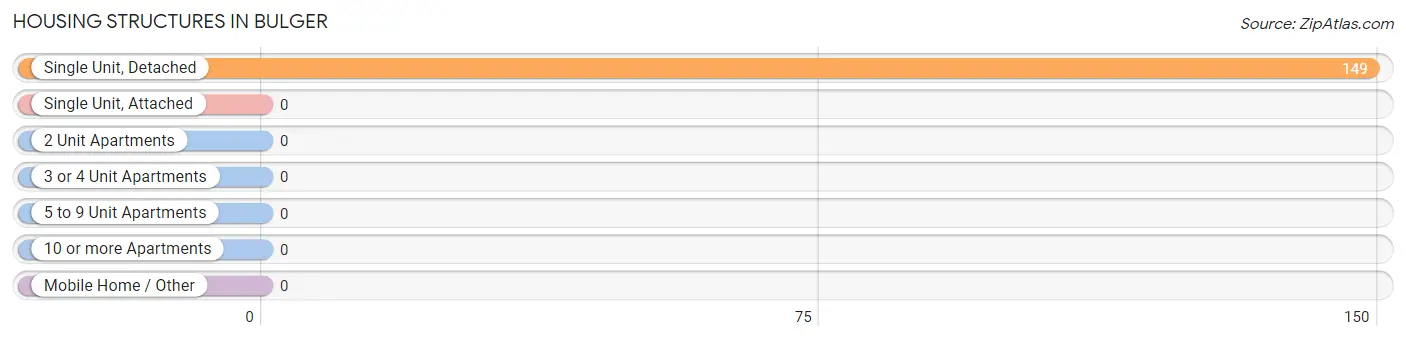
| Structure Type | # Housing Units | % Housing Units |
| Single Unit, Detached | 149 | 100.0% |
| Single Unit, Attached | 0 | 0.0% |
| 2 Unit Apartments | 0 | 0.0% |
| 3 or 4 Unit Apartments | 0 | 0.0% |
| 5 to 9 Unit Apartments | 0 | 0.0% |
| 10 or more Apartments | 0 | 0.0% |
| Mobile Home / Other | 0 | 0.0% |
| Total | 149 | 100.0% |
Housing Structures by Occupancy in Bulger
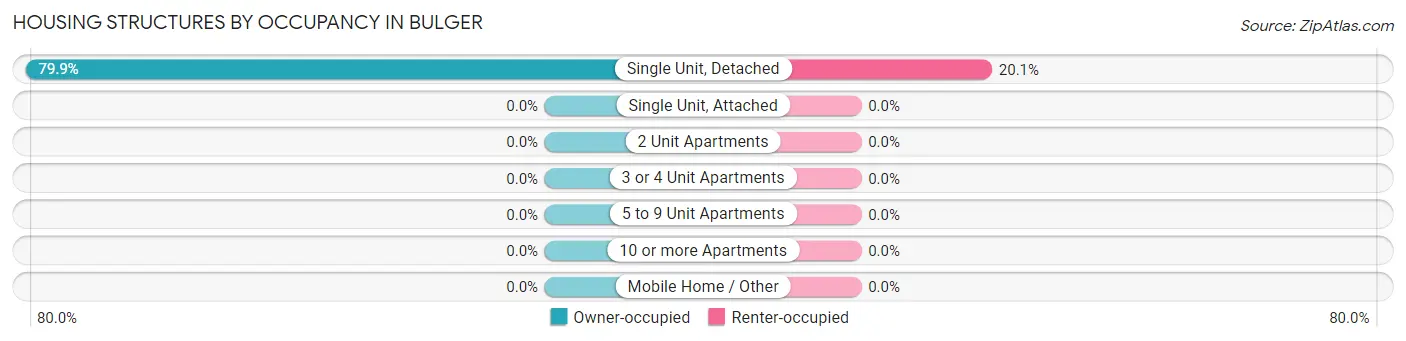
| Structure Type | Owner-occupied | Renter-occupied |
| Single Unit, Detached | 119 (79.9%) | 30 (20.1%) |
| Single Unit, Attached | 0 (0.0%) | 0 (0.0%) |
| 2 Unit Apartments | 0 (0.0%) | 0 (0.0%) |
| 3 or 4 Unit Apartments | 0 (0.0%) | 0 (0.0%) |
| 5 to 9 Unit Apartments | 0 (0.0%) | 0 (0.0%) |
| 10 or more Apartments | 0 (0.0%) | 0 (0.0%) |
| Mobile Home / Other | 0 (0.0%) | 0 (0.0%) |
| Total | 119 (79.9%) | 30 (20.1%) |
Housing Structures by Number of Rooms in Bulger
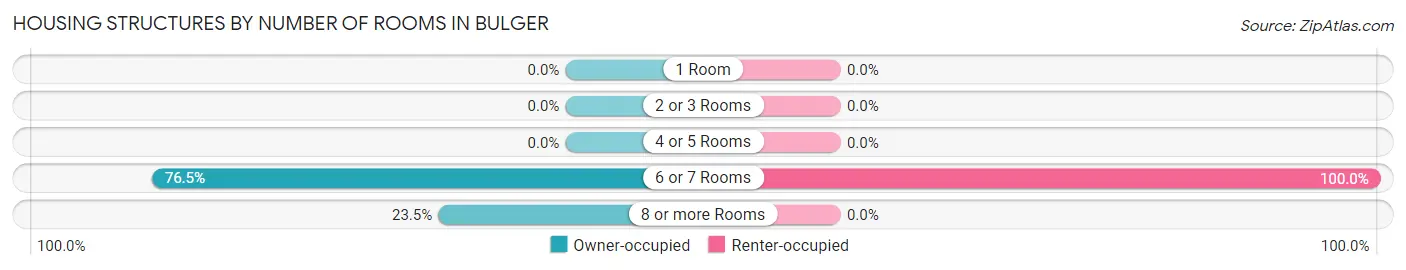
| Number of Rooms | Owner-occupied | Renter-occupied |
| 1 Room | 0 (0.0%) | 0 (0.0%) |
| 2 or 3 Rooms | 0 (0.0%) | 0 (0.0%) |
| 4 or 5 Rooms | 0 (0.0%) | 0 (0.0%) |
| 6 or 7 Rooms | 91 (76.5%) | 30 (100.0%) |
| 8 or more Rooms | 28 (23.5%) | 0 (0.0%) |
| Total | 119 (100.0%) | 30 (100.0%) |
Housing Structure by Heating Type in Bulger
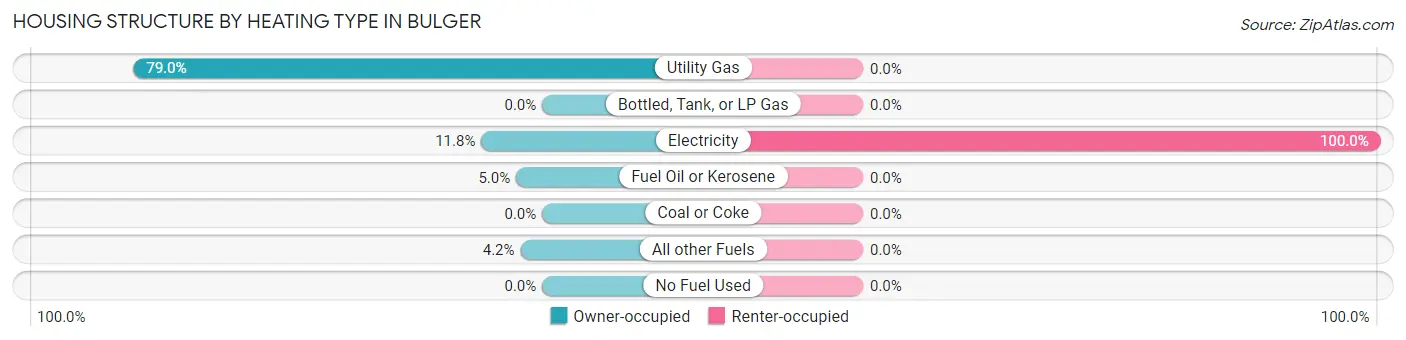
| Heating Type | Owner-occupied | Renter-occupied |
| Utility Gas | 94 (79.0%) | 0 (0.0%) |
| Bottled, Tank, or LP Gas | 0 (0.0%) | 0 (0.0%) |
| Electricity | 14 (11.8%) | 30 (100.0%) |
| Fuel Oil or Kerosene | 6 (5.0%) | 0 (0.0%) |
| Coal or Coke | 0 (0.0%) | 0 (0.0%) |
| All other Fuels | 5 (4.2%) | 0 (0.0%) |
| No Fuel Used | 0 (0.0%) | 0 (0.0%) |
| Total | 119 (100.0%) | 30 (100.0%) |
Household Vehicle Usage in Bulger
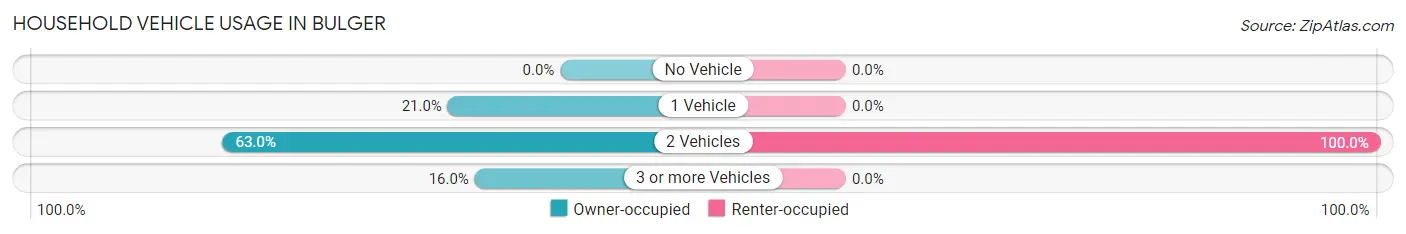
| Vehicles per Household | Owner-occupied | Renter-occupied |
| No Vehicle | 0 (0.0%) | 0 (0.0%) |
| 1 Vehicle | 25 (21.0%) | 0 (0.0%) |
| 2 Vehicles | 75 (63.0%) | 30 (100.0%) |
| 3 or more Vehicles | 19 (16.0%) | 0 (0.0%) |
| Total | 119 (100.0%) | 30 (100.0%) |
Real Estate & Mortgages in Bulger
Real Estate and Mortgage Overview in Bulger
| Characteristic | Without Mortgage | With Mortgage |
| Housing Units | 88 | 31 |
| Median Property Value | $140,400 | $260,400 |
| Median Household Income | $86,875 | $12 |
| Monthly Housing Costs | $518 | $0 |
| Real Estate Taxes | - | - |
Property Value by Mortgage Status in Bulger
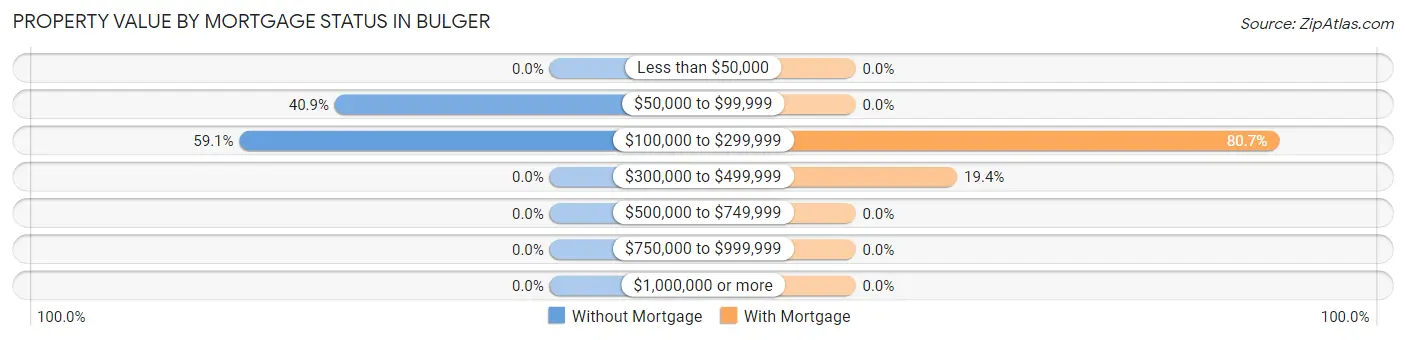
| Property Value | Without Mortgage | With Mortgage |
| Less than $50,000 | 0 (0.0%) | 0 (0.0%) |
| $50,000 to $99,999 | 36 (40.9%) | 0 (0.0%) |
| $100,000 to $299,999 | 52 (59.1%) | 25 (80.6%) |
| $300,000 to $499,999 | 0 (0.0%) | 6 (19.4%) |
| $500,000 to $749,999 | 0 (0.0%) | 0 (0.0%) |
| $750,000 to $999,999 | 0 (0.0%) | 0 (0.0%) |
| $1,000,000 or more | 0 (0.0%) | 0 (0.0%) |
| Total | 88 (100.0%) | 31 (100.0%) |
Household Income by Mortgage Status in Bulger
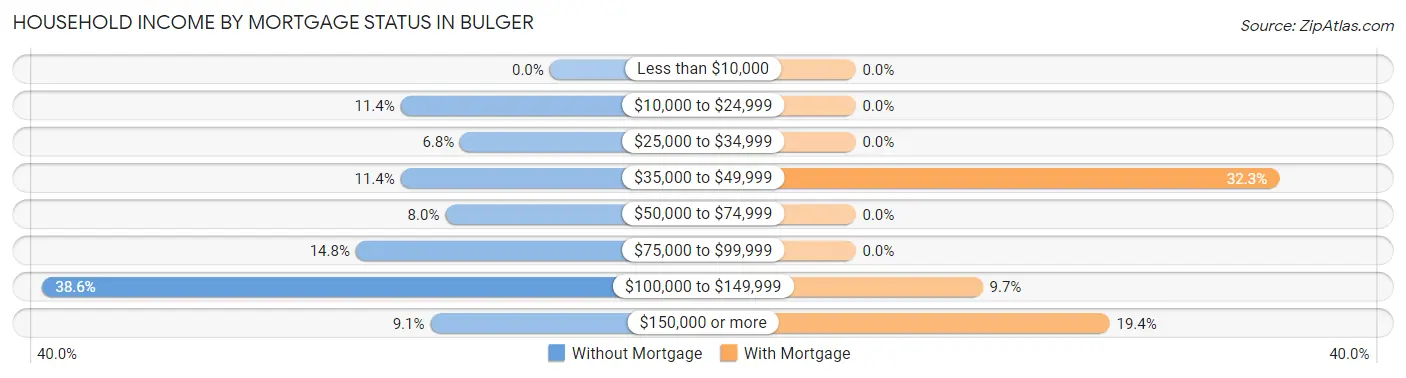
| Household Income | Without Mortgage | With Mortgage |
| Less than $10,000 | 0 (0.0%) | 0 (0.0%) |
| $10,000 to $24,999 | 10 (11.4%) | 0 (0.0%) |
| $25,000 to $34,999 | 6 (6.8%) | 0 (0.0%) |
| $35,000 to $49,999 | 10 (11.4%) | 10 (32.3%) |
| $50,000 to $74,999 | 7 (8.0%) | 0 (0.0%) |
| $75,000 to $99,999 | 13 (14.8%) | 0 (0.0%) |
| $100,000 to $149,999 | 34 (38.6%) | 3 (9.7%) |
| $150,000 or more | 8 (9.1%) | 6 (19.4%) |
| Total | 88 (100.0%) | 31 (100.0%) |
Property Value to Household Income Ratio in Bulger
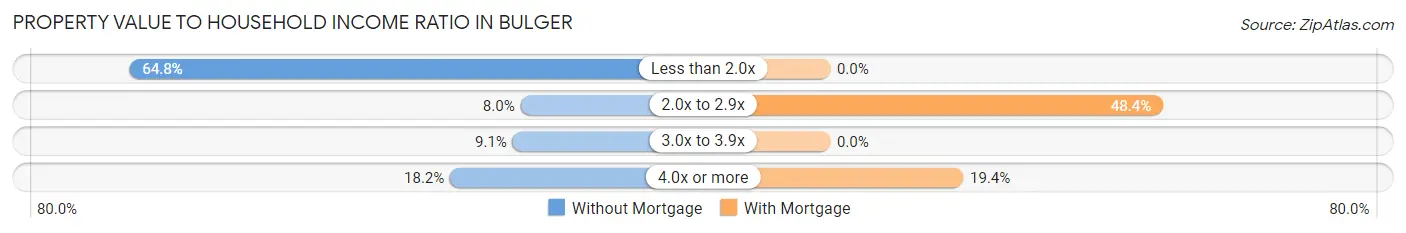
| Value-to-Income Ratio | Without Mortgage | With Mortgage |
| Less than 2.0x | 57 (64.8%) | 0 (0.0%) |
| 2.0x to 2.9x | 7 (8.0%) | 15 (48.4%) |
| 3.0x to 3.9x | 8 (9.1%) | 0 (0.0%) |
| 4.0x or more | 16 (18.2%) | 6 (19.4%) |
| Total | 88 (100.0%) | 31 (100.0%) |
Real Estate Taxes by Mortgage Status in Bulger
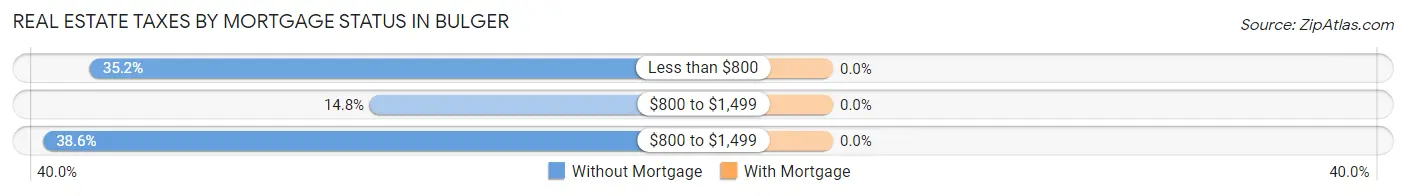
| Property Taxes | Without Mortgage | With Mortgage |
| Less than $800 | 31 (35.2%) | 0 (0.0%) |
| $800 to $1,499 | 13 (14.8%) | 0 (0.0%) |
| $800 to $1,499 | 34 (38.6%) | 0 (0.0%) |
| Total | 88 (100.0%) | 31 (100.0%) |
Health & Disability in Bulger
Health Insurance Coverage by Age in Bulger
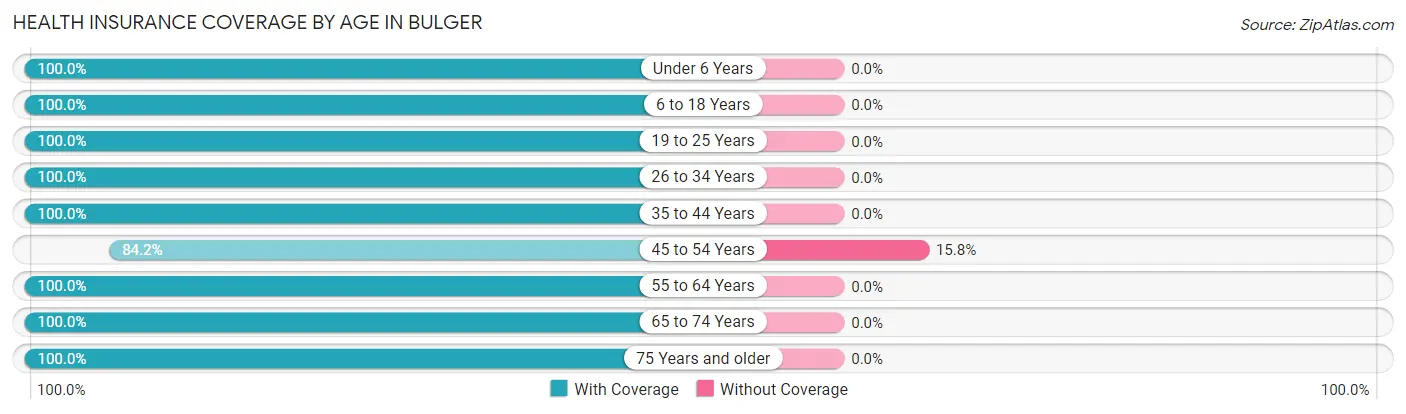
| Age Bracket | With Coverage | Without Coverage |
| Under 6 Years | 10 (100.0%) | 0 (0.0%) |
| 6 to 18 Years | 33 (100.0%) | 0 (0.0%) |
| 19 to 25 Years | 7 (100.0%) | 0 (0.0%) |
| 26 to 34 Years | 85 (100.0%) | 0 (0.0%) |
| 35 to 44 Years | 15 (100.0%) | 0 (0.0%) |
| 45 to 54 Years | 32 (84.2%) | 6 (15.8%) |
| 55 to 64 Years | 48 (100.0%) | 0 (0.0%) |
| 65 to 74 Years | 47 (100.0%) | 0 (0.0%) |
| 75 Years and older | 31 (100.0%) | 0 (0.0%) |
| Total | 308 (98.1%) | 6 (1.9%) |
Health Insurance Coverage by Citizenship Status in Bulger

| Citizenship Status | With Coverage | Without Coverage |
| Native Born | 10 (100.0%) | 0 (0.0%) |
| Foreign Born, Citizen | 33 (100.0%) | 0 (0.0%) |
| Foreign Born, not a Citizen | 7 (100.0%) | 0 (0.0%) |
Health Insurance Coverage by Household Income in Bulger
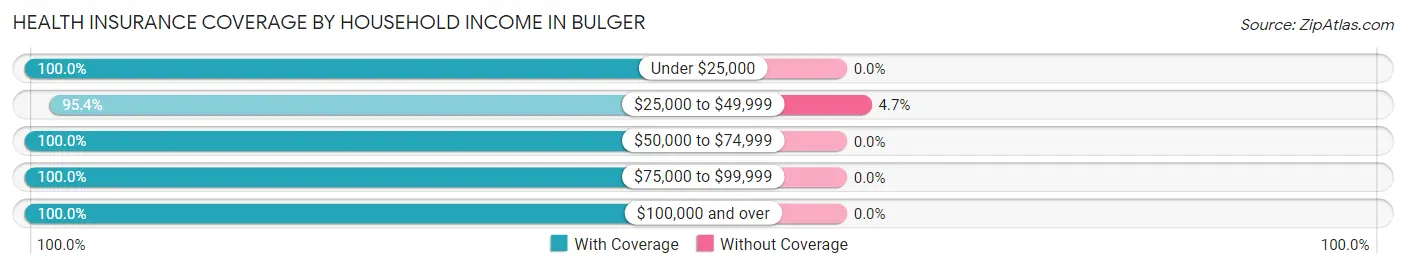
| Household Income | With Coverage | Without Coverage |
| Under $25,000 | 19 (100.0%) | 0 (0.0%) |
| $25,000 to $49,999 | 123 (95.4%) | 6 (4.6%) |
| $50,000 to $74,999 | 13 (100.0%) | 0 (0.0%) |
| $75,000 to $99,999 | 26 (100.0%) | 0 (0.0%) |
| $100,000 and over | 127 (100.0%) | 0 (0.0%) |
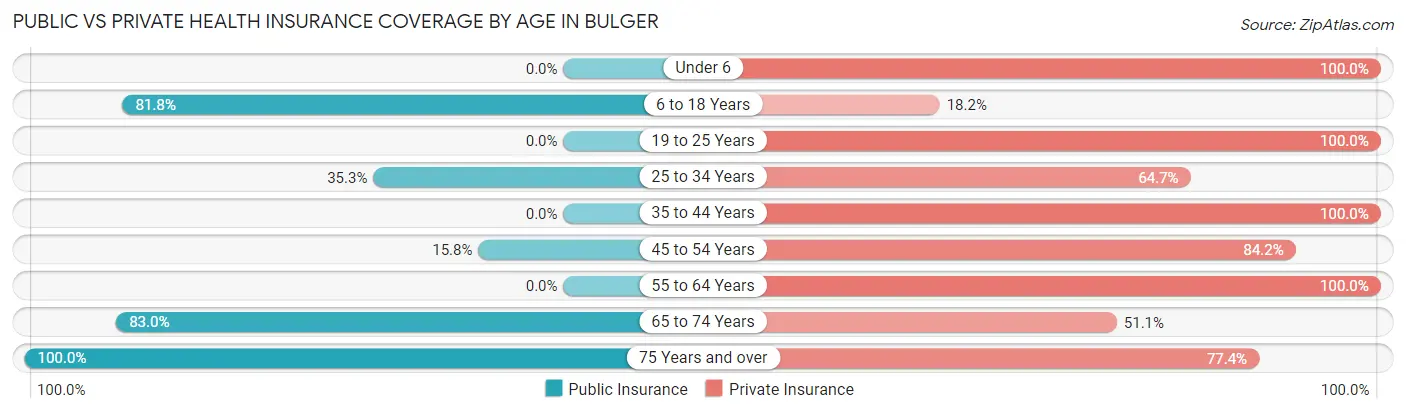
Public vs Private Health Insurance Coverage by Age in Bulger
| Age Bracket | Public Insurance | Private Insurance |
| Under 6 | 0 (0.0%) | 10 (100.0%) |
| 6 to 18 Years | 27 (81.8%) | 6 (18.2%) |
| 19 to 25 Years | 0 (0.0%) | 7 (100.0%) |
| 25 to 34 Years | 30 (35.3%) | 55 (64.7%) |
| 35 to 44 Years | 0 (0.0%) | 15 (100.0%) |
| 45 to 54 Years | 6 (15.8%) | 32 (84.2%) |
| 55 to 64 Years | 0 (0.0%) | 48 (100.0%) |
| 65 to 74 Years | 39 (83.0%) | 24 (51.1%) |
| 75 Years and over | 31 (100.0%) | 24 (77.4%) |
| Total | 133 (42.4%) | 221 (70.4%) |
Disability Status by Sex by Age in Bulger
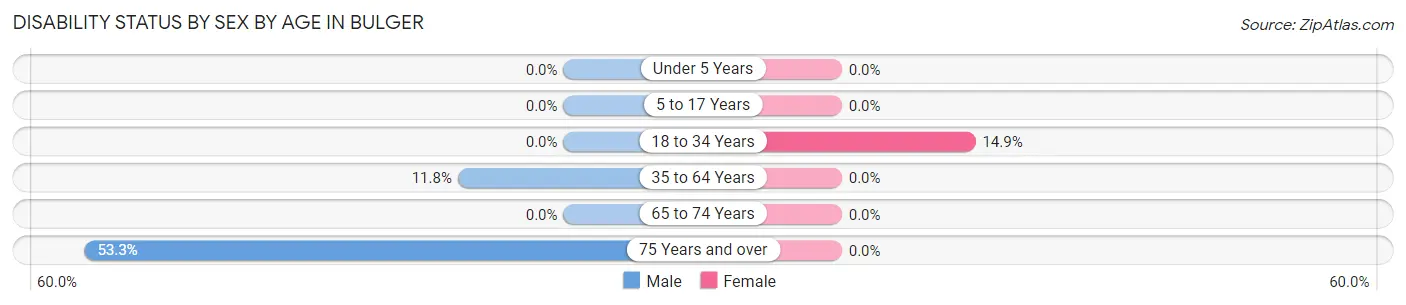
| Age Bracket | Male | Female |
| Under 5 Years | 0 (0.0%) | 0 (0.0%) |
| 5 to 17 Years | 0 (0.0%) | 0 (0.0%) |
| 18 to 34 Years | 0 (0.0%) | 7 (14.9%) |
| 35 to 64 Years | 6 (11.8%) | 0 (0.0%) |
| 65 to 74 Years | 0 (0.0%) | 0 (0.0%) |
| 75 Years and over | 8 (53.3%) | 0 (0.0%) |
Disability Class by Sex by Age in Bulger
Disability Class: Hearing Difficulty
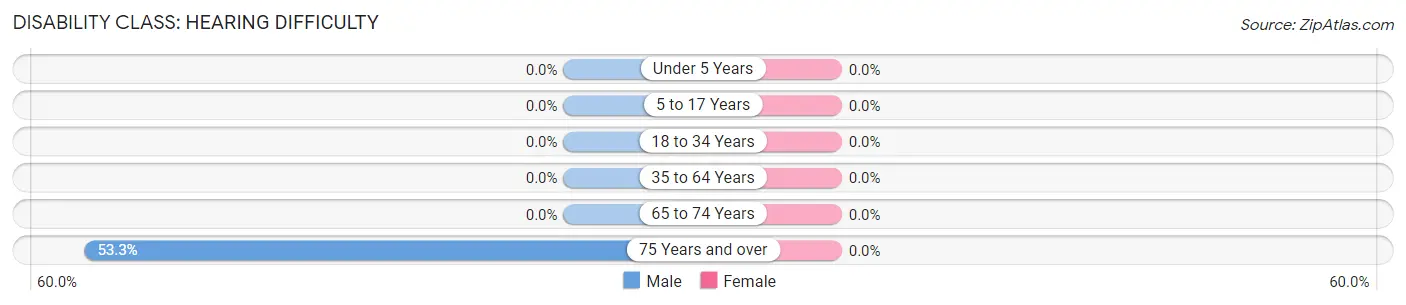
| Age Bracket | Male | Female |
| Under 5 Years | 0 (0.0%) | 0 (0.0%) |
| 5 to 17 Years | 0 (0.0%) | 0 (0.0%) |
| 18 to 34 Years | 0 (0.0%) | 0 (0.0%) |
| 35 to 64 Years | 0 (0.0%) | 0 (0.0%) |
| 65 to 74 Years | 0 (0.0%) | 0 (0.0%) |
| 75 Years and over | 8 (53.3%) | 0 (0.0%) |
Disability Class: Vision Difficulty
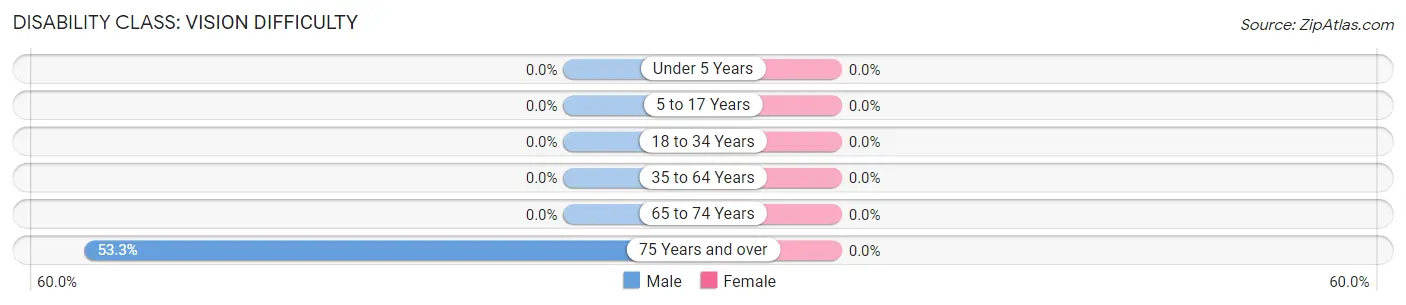
| Age Bracket | Male | Female |
| Under 5 Years | 0 (0.0%) | 0 (0.0%) |
| 5 to 17 Years | 0 (0.0%) | 0 (0.0%) |
| 18 to 34 Years | 0 (0.0%) | 0 (0.0%) |
| 35 to 64 Years | 0 (0.0%) | 0 (0.0%) |
| 65 to 74 Years | 0 (0.0%) | 0 (0.0%) |
| 75 Years and over | 8 (53.3%) | 0 (0.0%) |
Disability Class: Cognitive Difficulty
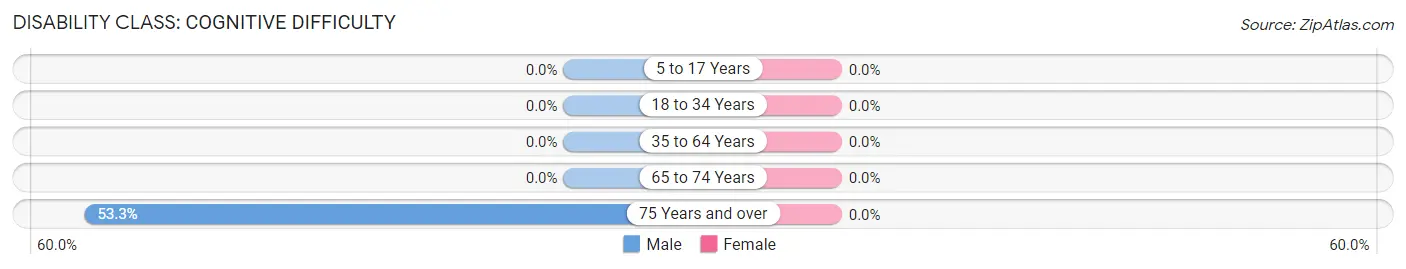
| Age Bracket | Male | Female |
| 5 to 17 Years | 0 (0.0%) | 0 (0.0%) |
| 18 to 34 Years | 0 (0.0%) | 0 (0.0%) |
| 35 to 64 Years | 0 (0.0%) | 0 (0.0%) |
| 65 to 74 Years | 0 (0.0%) | 0 (0.0%) |
| 75 Years and over | 8 (53.3%) | 0 (0.0%) |
Disability Class: Ambulatory Difficulty
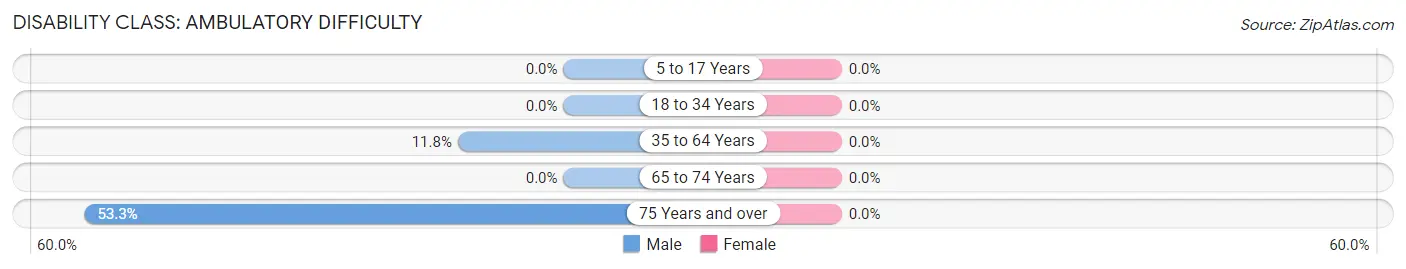
| Age Bracket | Male | Female |
| 5 to 17 Years | 0 (0.0%) | 0 (0.0%) |
| 18 to 34 Years | 0 (0.0%) | 0 (0.0%) |
| 35 to 64 Years | 6 (11.8%) | 0 (0.0%) |
| 65 to 74 Years | 0 (0.0%) | 0 (0.0%) |
| 75 Years and over | 8 (53.3%) | 0 (0.0%) |
Disability Class: Self-Care Difficulty
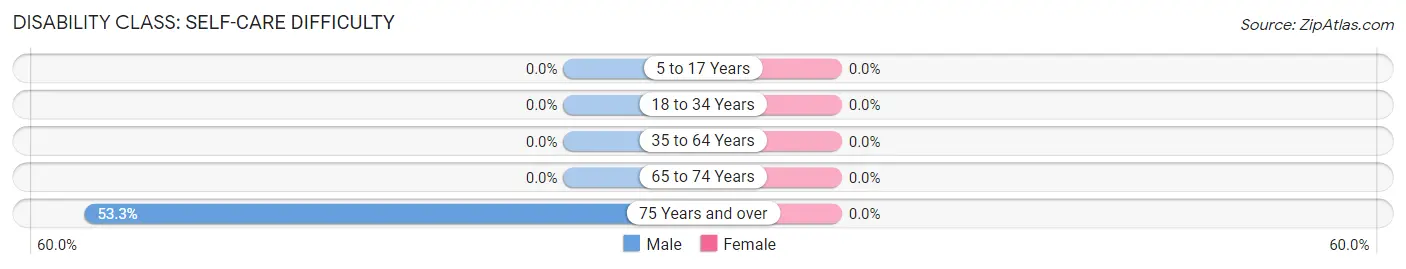
| Age Bracket | Male | Female |
| 5 to 17 Years | 0 (0.0%) | 0 (0.0%) |
| 18 to 34 Years | 0 (0.0%) | 0 (0.0%) |
| 35 to 64 Years | 0 (0.0%) | 0 (0.0%) |
| 65 to 74 Years | 0 (0.0%) | 0 (0.0%) |
| 75 Years and over | 8 (53.3%) | 0 (0.0%) |
Technology Access in Bulger
Computing Device Access in Bulger
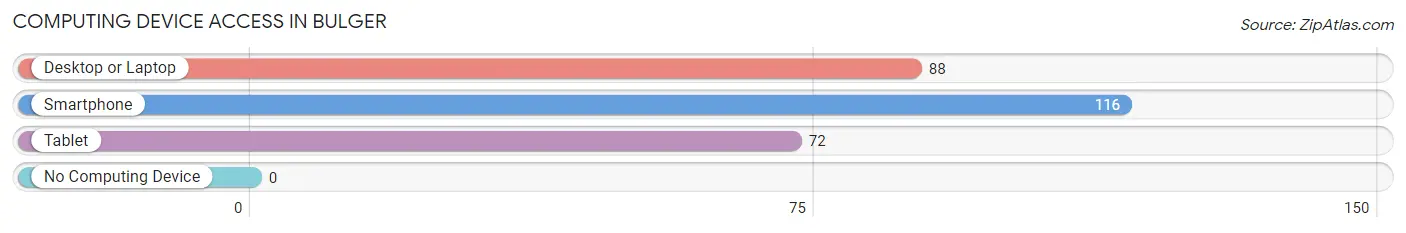
| Device Type | # Households | % Households |
| Desktop or Laptop | 88 | 59.1% |
| Smartphone | 116 | 77.8% |
| Tablet | 72 | 48.3% |
| No Computing Device | 0 | 0.0% |
| Total | 149 | 100.0% |
Internet Access in Bulger
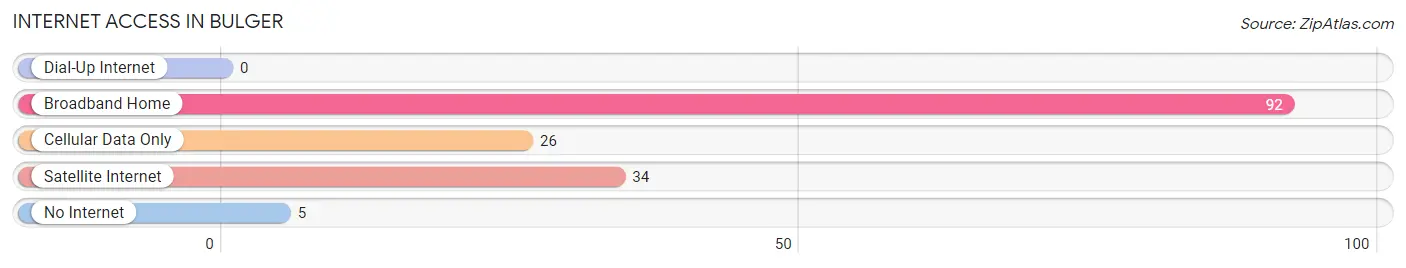
| Internet Type | # Households | % Households |
| Dial-Up Internet | 0 | 0.0% |
| Broadband Home | 92 | 61.7% |
| Cellular Data Only | 26 | 17.4% |
| Satellite Internet | 34 | 22.8% |
| No Internet | 5 | 3.4% |
| Total | 149 | 100.0% |
Bulger Summary
History
The small town of Bulger, Pennsylvania is located in the southwestern corner of the state, just north of the West Virginia border. It is part of Washington County, and is situated in the foothills of the Appalachian Mountains. The town was founded in 1820 by a group of settlers from the nearby town of Washington, Pennsylvania. The settlers were looking for a place to settle that was close to the river and had plenty of land for farming.
The town was named after the Bulger family, who were among the first settlers. The family had come from Ireland and had settled in Washington County in the late 1700s. The family was well-known in the area for their farming and timbering operations.
The town of Bulger grew slowly over the years, but it was not until the late 1800s that it began to really take off. This was due to the discovery of coal in the area. The coal industry brought jobs and money to the town, and it quickly became a bustling mining town. The coal industry also brought a large influx of immigrants to the area, mostly from Eastern Europe.
The town of Bulger continued to grow and prosper throughout the early 1900s. The coal industry was still the main source of income for the town, but other industries such as manufacturing and agriculture also began to take hold. The town also became a popular tourist destination, as it was close to the Allegheny Mountains and the Monongahela River.
The town of Bulger experienced a decline in the late 1900s, as the coal industry began to decline. The town was hit hard by the Great Depression, and many of the businesses and industries in the town closed down. The town was also affected by the decline of the steel industry in the area.
Today, the town of Bulger is a small, rural community. The coal industry is no longer the main source of income for the town, but it still plays a role in the local economy. The town is home to a few small businesses, and it is also a popular destination for outdoor recreation.
Geography
Bulger is located in the southwestern corner of Pennsylvania, just north of the West Virginia border. It is part of Washington County, and is situated in the foothills of the Appalachian Mountains. The town is located on the banks of the Monongahela River, and is surrounded by rolling hills and forests.
The town of Bulger is located at an elevation of 1,000 feet above sea level. The climate in the area is temperate, with hot summers and cold winters. The average annual temperature is around 50 degrees Fahrenheit.
Economy
The economy of Bulger is largely based on agriculture and tourism. The town is home to several small businesses, including a few restaurants, a grocery store, and a few other retail stores. The town is also home to a few small manufacturing companies.
The town is also a popular destination for outdoor recreation. The nearby Monongahela River is a popular spot for fishing, boating, and other water activities. The nearby Appalachian Mountains are also popular for hiking, camping, and other outdoor activities.
Demographics
As of the 2010 census, the population of Bulger was 1,845. The town is predominantly white, with a small African American population. The median household income in the town is $37,000, and the median age is 44. The town has a high rate of poverty, with nearly 20% of the population living below the poverty line.
Common Questions
What is Per Capita Income in Bulger?
Per Capita income in Bulger is $38,693.
What is the Median Family Income in Bulger?
Median Family Income in Bulger is $103,894.
What is the Median Household income in Bulger?
Median Household Income in Bulger is $83,250.
What is Income or Wage Gap in Bulger?
Income or Wage Gap in Bulger is 66.5%.
Women in Bulger earn 33.5 cents for every dollar earned by a man.
What is Inequality or Gini Index in Bulger?
Inequality or Gini Index in Bulger is 0.34.
What is the Total Population of Bulger?
Total Population of Bulger is 314.
What is the Total Male Population of Bulger?
Total Male Population of Bulger is 138.
What is the Total Female Population of Bulger?
Total Female Population of Bulger is 176.
What is the Ratio of Males per 100 Females in Bulger?
There are 78.41 Males per 100 Females in Bulger.
What is the Ratio of Females per 100 Males in Bulger?
There are 127.54 Females per 100 Males in Bulger.
What is the Median Population Age in Bulger?
Median Population Age in Bulger is 47.6 Years.
What is the Average Family Size in Bulger
Average Family Size in Bulger is 2.2 People.
What is the Average Household Size in Bulger
Average Household Size in Bulger is 2.1 People.
How Large is the Labor Force in Bulger?
There are 186 People in the Labor Forcein in Bulger.
What is the Percentage of People in the Labor Force in Bulger?
68.6% of People are in the Labor Force in Bulger.
What is the Unemployment Rate in Bulger?
Unemployment Rate in Bulger is 20.4%.