Fairhope, PA Map & Demographics
Fairhope Map
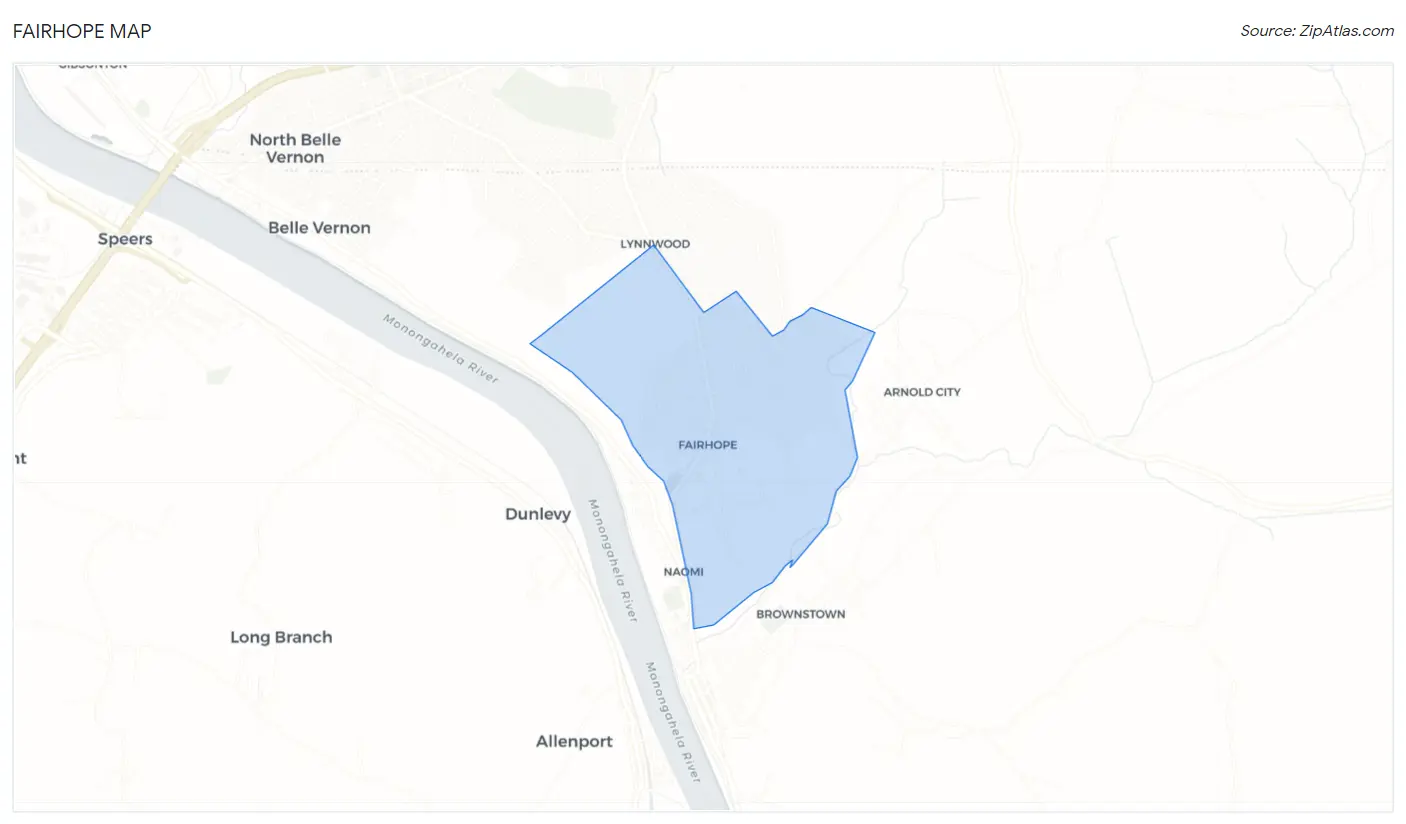
Fairhope Overview
$28,419
PER CAPITA INCOME
$45,388
AVG FAMILY INCOME
$34,363
AVG HOUSEHOLD INCOME
20.5%
WAGE / INCOME GAP [ % ]
79.5¢/ $1
WAGE / INCOME GAP [ $ ]
0.50
INEQUALITY / GINI INDEX
1,187
TOTAL POPULATION
531
MALE POPULATION
656
FEMALE POPULATION
80.95
MALES / 100 FEMALES
123.54
FEMALES / 100 MALES
51.8
MEDIAN AGE
2.6
AVG FAMILY SIZE
2.0
AVG HOUSEHOLD SIZE
437
LABOR FORCE [ PEOPLE ]
39.7%
PERCENT IN LABOR FORCE
4.8%
UNEMPLOYMENT RATE
Fairhope Zip Codes
Fairhope Area Codes
Income in Fairhope
Income Overview in Fairhope
Per Capita Income in Fairhope is $28,419, while median incomes of families and households are $45,388 and $34,363 respectively.
| Characteristic | Number | Measure |
| Per Capita Income | 1,187 | $28,419 |
| Median Family Income | 357 | $45,388 |
| Mean Family Income | 357 | $64,790 |
| Median Household Income | 590 | $34,363 |
| Mean Household Income | 590 | $57,008 |
| Income Deficit | 357 | $0 |
| Wage / Income Gap (%) | 1,187 | 20.48% |
| Wage / Income Gap ($) | 1,187 | 79.52¢ per $1 |
| Gini / Inequality Index | 1,187 | 0.50 |
Earnings by Sex in Fairhope
Average Earnings in Fairhope are $27,745, $28,859 for men and $22,950 for women, a difference of 20.5%.
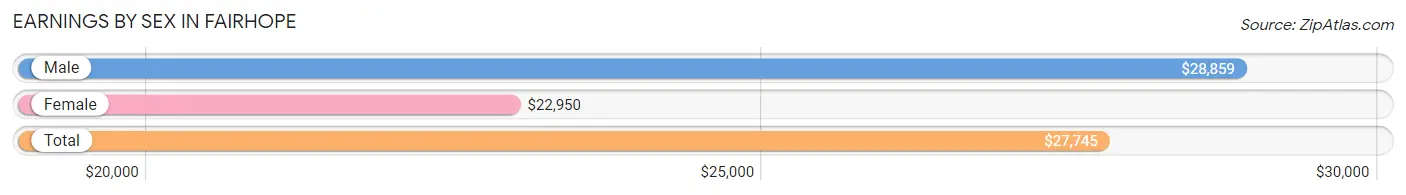
| Sex | Number | Average Earnings |
| Male | 236 (54.0%) | $28,859 |
| Female | 201 (46.0%) | $22,950 |
| Total | 437 (100.0%) | $27,745 |
Earnings by Sex by Income Bracket in Fairhope
The most common earnings brackets in Fairhope are $25,000 to $29,999 for men (63 | 26.7%) and $45,000 to $49,999 for women (53 | 26.4%).
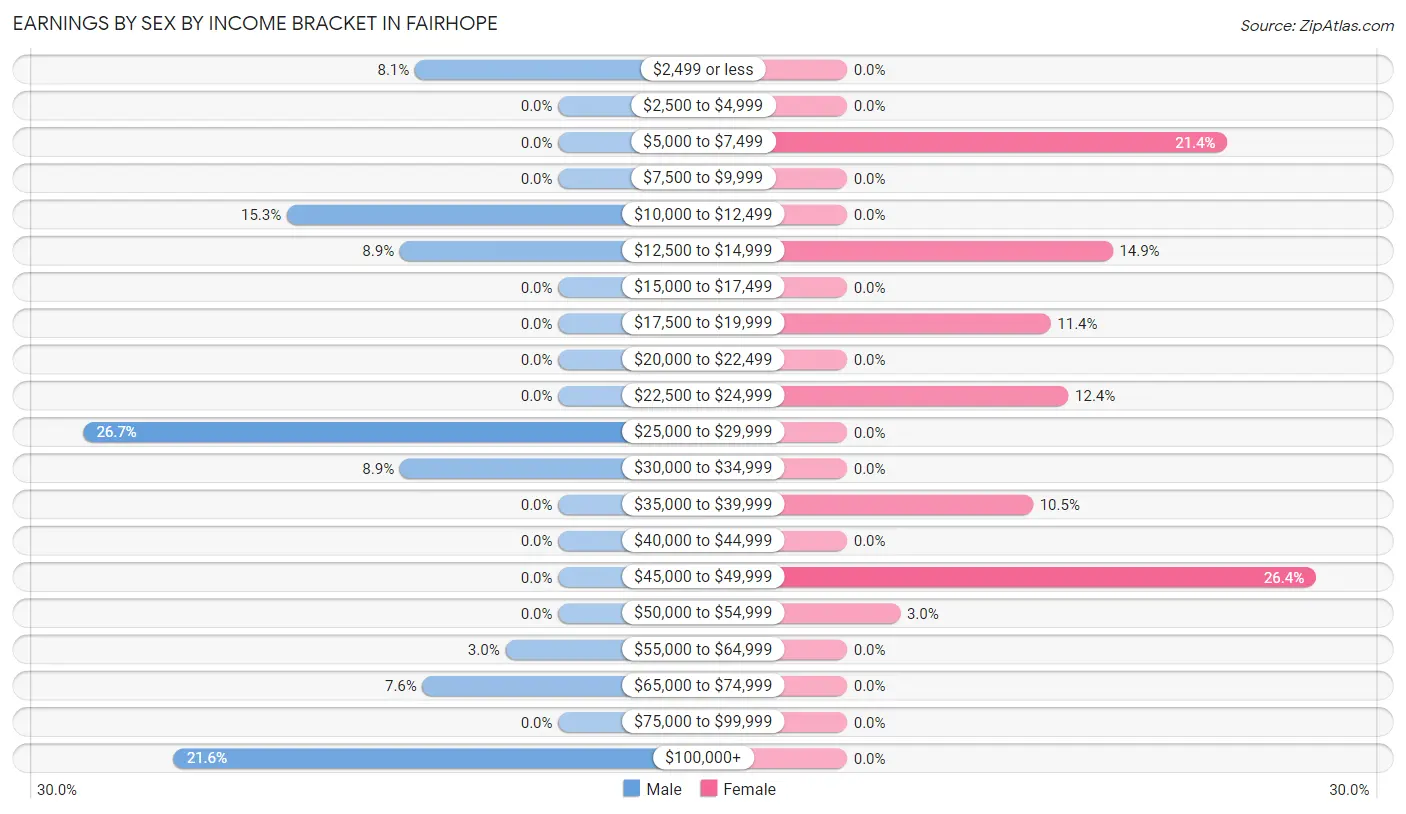
| Income | Male | Female |
| $2,499 or less | 19 (8.1%) | 0 (0.0%) |
| $2,500 to $4,999 | 0 (0.0%) | 0 (0.0%) |
| $5,000 to $7,499 | 0 (0.0%) | 43 (21.4%) |
| $7,500 to $9,999 | 0 (0.0%) | 0 (0.0%) |
| $10,000 to $12,499 | 36 (15.2%) | 0 (0.0%) |
| $12,500 to $14,999 | 21 (8.9%) | 30 (14.9%) |
| $15,000 to $17,499 | 0 (0.0%) | 0 (0.0%) |
| $17,500 to $19,999 | 0 (0.0%) | 23 (11.4%) |
| $20,000 to $22,499 | 0 (0.0%) | 0 (0.0%) |
| $22,500 to $24,999 | 0 (0.0%) | 25 (12.4%) |
| $25,000 to $29,999 | 63 (26.7%) | 0 (0.0%) |
| $30,000 to $34,999 | 21 (8.9%) | 0 (0.0%) |
| $35,000 to $39,999 | 0 (0.0%) | 21 (10.4%) |
| $40,000 to $44,999 | 0 (0.0%) | 0 (0.0%) |
| $45,000 to $49,999 | 0 (0.0%) | 53 (26.4%) |
| $50,000 to $54,999 | 0 (0.0%) | 6 (3.0%) |
| $55,000 to $64,999 | 7 (3.0%) | 0 (0.0%) |
| $65,000 to $74,999 | 18 (7.6%) | 0 (0.0%) |
| $75,000 to $99,999 | 0 (0.0%) | 0 (0.0%) |
| $100,000+ | 51 (21.6%) | 0 (0.0%) |
| Total | 236 (100.0%) | 201 (100.0%) |
Earnings by Sex by Educational Attainment in Fairhope
| Educational Attainment | Male Income | Female Income |
| Less than High School | - | - |
| High School Diploma | - | - |
| College or Associate's Degree | - | - |
| Bachelor's Degree | - | - |
| Graduate Degree | - | - |
| Total | - | - |
Family Income in Fairhope
Family Income Brackets in Fairhope
According to the Fairhope family income data, there are 121 families falling into the $25,000 to $34,999 income range, which is the most common income bracket and makes up 33.9% of all families.
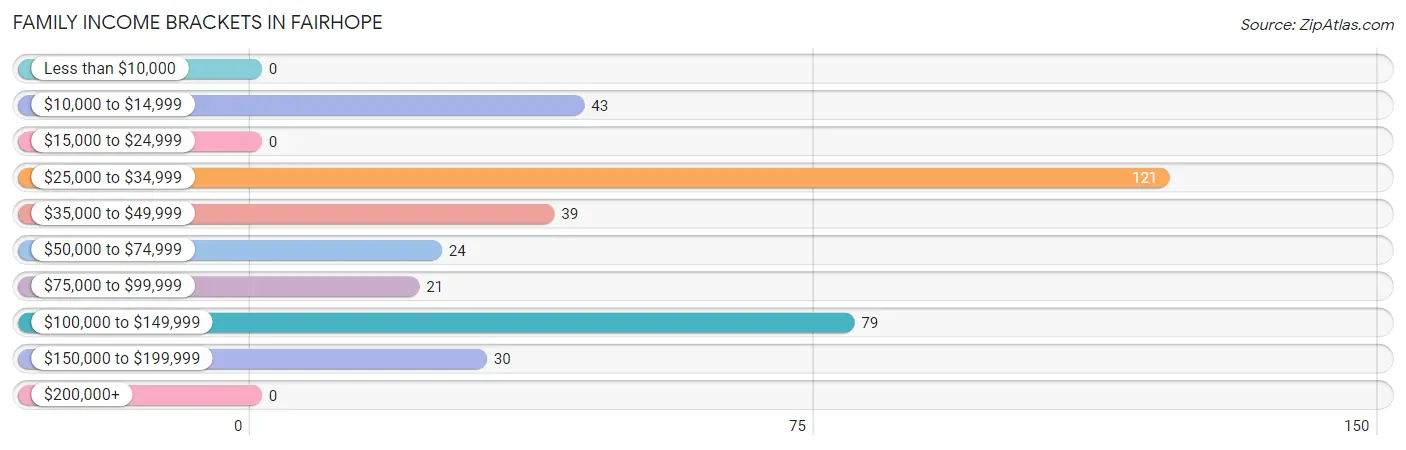
| Income Bracket | # Families | % Families |
| Less than $10,000 | 0 | 0.0% |
| $10,000 to $14,999 | 43 | 12.0% |
| $15,000 to $24,999 | 0 | 0.0% |
| $25,000 to $34,999 | 121 | 33.9% |
| $35,000 to $49,999 | 39 | 10.9% |
| $50,000 to $74,999 | 24 | 6.7% |
| $75,000 to $99,999 | 21 | 5.9% |
| $100,000 to $149,999 | 79 | 22.1% |
| $150,000 to $199,999 | 30 | 8.4% |
| $200,000+ | 0 | 0.0% |
Family Income by Famaliy Size in Fairhope
3-person families (71 | 19.9%) account for the highest median family income in Fairhope with $50,677 per family, while 2-person families (244 | 68.3%) have the highest median income of $16,986 per family member.
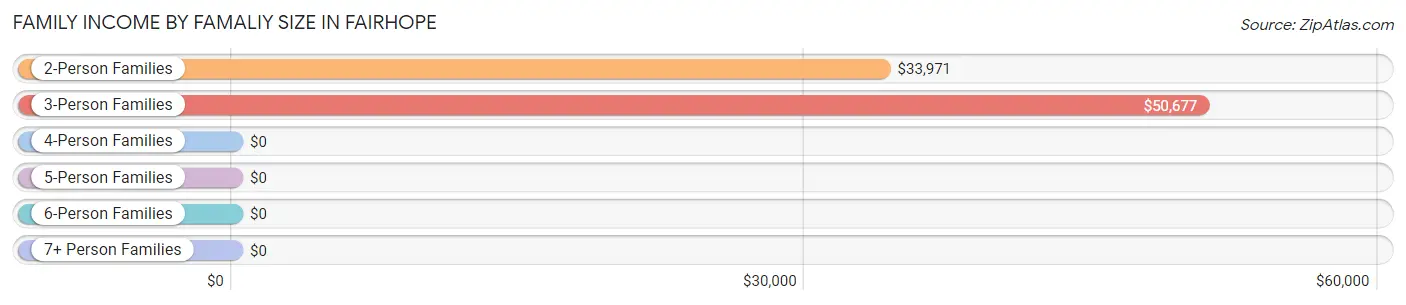
| Income Bracket | # Families | Median Income |
| 2-Person Families | 244 (68.3%) | $33,971 |
| 3-Person Families | 71 (19.9%) | $50,677 |
| 4-Person Families | 10 (2.8%) | $0 |
| 5-Person Families | 7 (2.0%) | $0 |
| 6-Person Families | 25 (7.0%) | $0 |
| 7+ Person Families | 0 (0.0%) | $0 |
| Total | 357 (100.0%) | $45,388 |
Family Income by Number of Earners in Fairhope
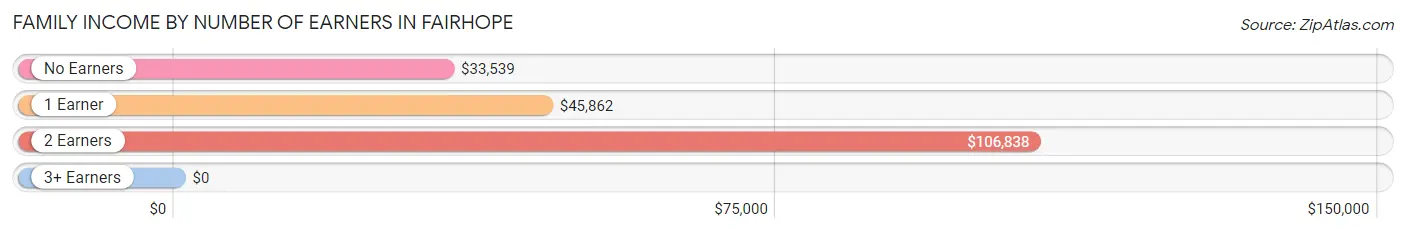
| Number of Earners | # Families | Median Income |
| No Earners | 139 (38.9%) | $33,539 |
| 1 Earner | 132 (37.0%) | $45,862 |
| 2 Earners | 61 (17.1%) | $106,838 |
| 3+ Earners | 25 (7.0%) | $0 |
| Total | 357 (100.0%) | $45,388 |
Household Income in Fairhope
Household Income Brackets in Fairhope
With 140 households falling in the category, the $25,000 to $34,999 income range is the most frequent in Fairhope, accounting for 23.7% of all households. In contrast, only 25 households (4.2%) fall into the $200,000+ income bracket, making it the least populous group.
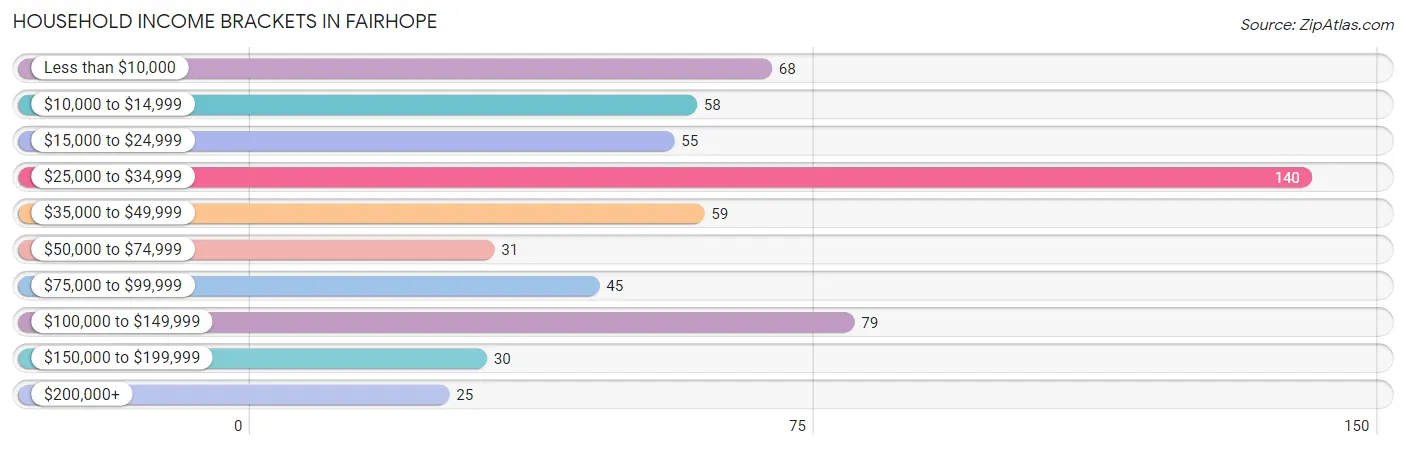
| Income Bracket | # Households | % Households |
| Less than $10,000 | 68 | 11.5% |
| $10,000 to $14,999 | 58 | 9.8% |
| $15,000 to $24,999 | 55 | 9.3% |
| $25,000 to $34,999 | 140 | 23.7% |
| $35,000 to $49,999 | 59 | 10.0% |
| $50,000 to $74,999 | 31 | 5.3% |
| $75,000 to $99,999 | 45 | 7.6% |
| $100,000 to $149,999 | 79 | 13.4% |
| $150,000 to $199,999 | 30 | 5.1% |
| $200,000+ | 25 | 4.2% |
Household Income by Householder Age in Fairhope
The median household income in Fairhope is $34,363, with the highest median household income of $100,436 found in the 25 to 44 years age bracket for the primary householder. A total of 121 households (20.5%) fall into this category. Meanwhile, the 15 to 24 years age bracket for the primary householder has the lowest median household income of $0, with 27 households (4.6%) in this group.
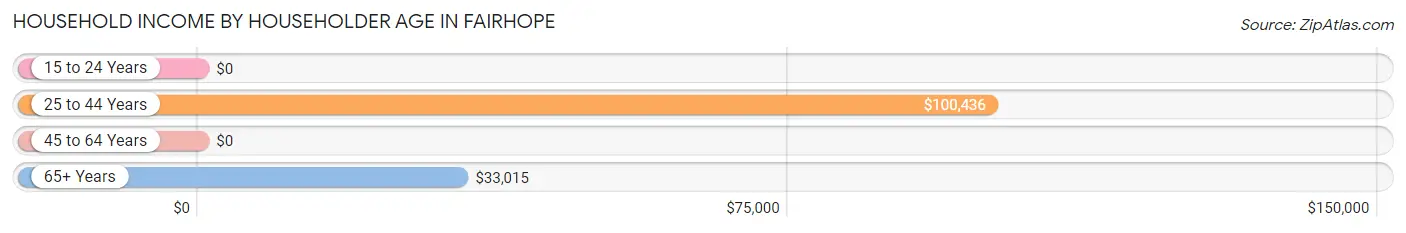
| Income Bracket | # Households | Median Income |
| 15 to 24 Years | 27 (4.6%) | $0 |
| 25 to 44 Years | 121 (20.5%) | $100,436 |
| 45 to 64 Years | 152 (25.8%) | $0 |
| 65+ Years | 290 (49.1%) | $33,015 |
| Total | 590 (100.0%) | $34,363 |
Poverty in Fairhope
Income Below Poverty by Sex and Age in Fairhope
With 12.0% poverty level for males and 14.8% for females among the residents of Fairhope, 18 to 24 year old males and 55 to 64 year old females are the most vulnerable to poverty, with 48 males (71.6%) and 68 females (77.3%) in their respective age groups living below the poverty level.
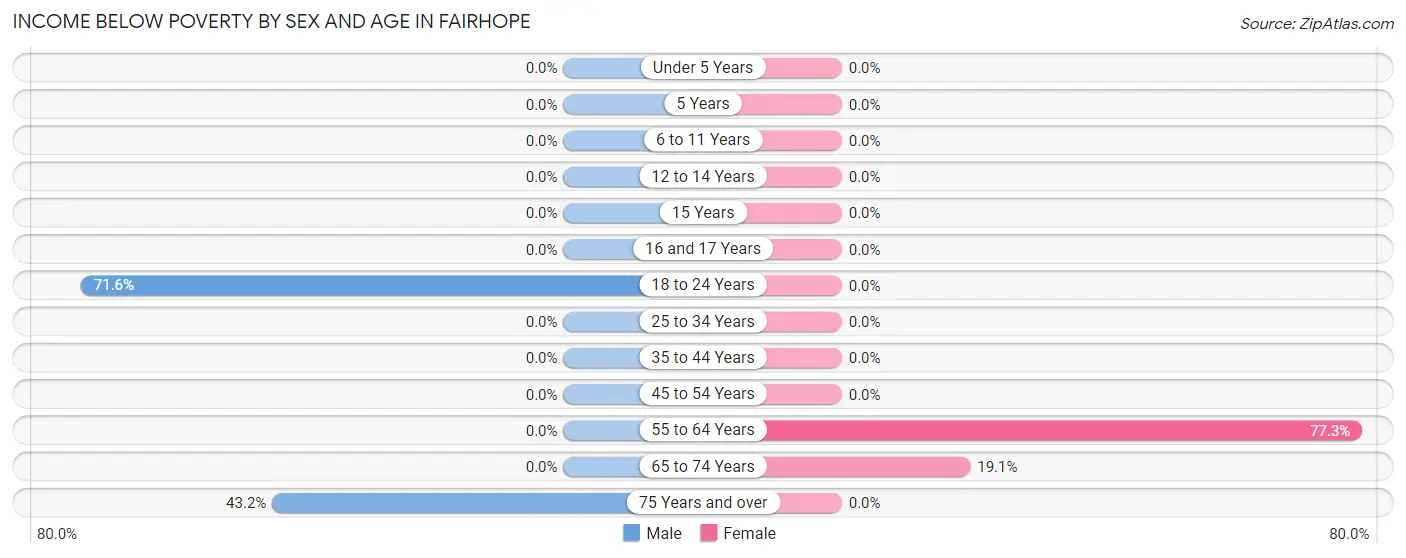
| Age Bracket | Male | Female |
| Under 5 Years | 0 (0.0%) | 0 (0.0%) |
| 5 Years | 0 (0.0%) | 0 (0.0%) |
| 6 to 11 Years | 0 (0.0%) | 0 (0.0%) |
| 12 to 14 Years | 0 (0.0%) | 0 (0.0%) |
| 15 Years | 0 (0.0%) | 0 (0.0%) |
| 16 and 17 Years | 0 (0.0%) | 0 (0.0%) |
| 18 to 24 Years | 48 (71.6%) | 0 (0.0%) |
| 25 to 34 Years | 0 (0.0%) | 0 (0.0%) |
| 35 to 44 Years | 0 (0.0%) | 0 (0.0%) |
| 45 to 54 Years | 0 (0.0%) | 0 (0.0%) |
| 55 to 64 Years | 0 (0.0%) | 68 (77.3%) |
| 65 to 74 Years | 0 (0.0%) | 29 (19.1%) |
| 75 Years and over | 16 (43.2%) | 0 (0.0%) |
| Total | 64 (12.0%) | 97 (14.8%) |
Income Above Poverty by Sex and Age in Fairhope
According to the poverty statistics in Fairhope, males aged 5 years and females aged under 5 years are the age groups that are most secure financially, with 100.0% of males and 100.0% of females in these age groups living above the poverty line.
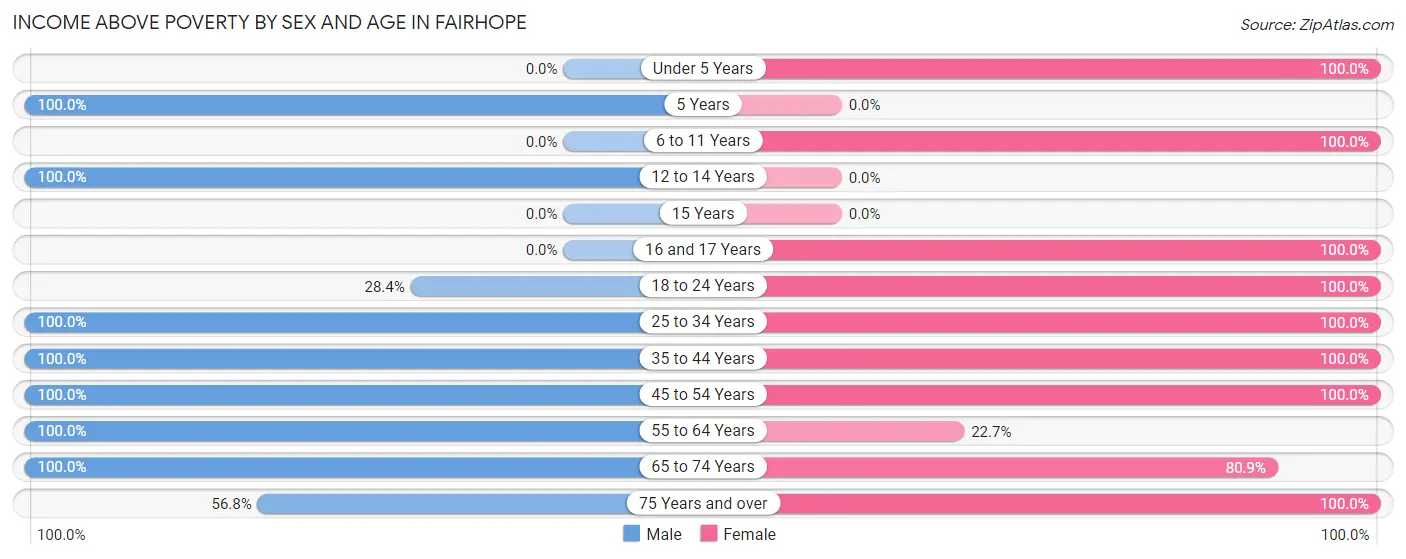
| Age Bracket | Male | Female |
| Under 5 Years | 0 (0.0%) | 38 (100.0%) |
| 5 Years | 17 (100.0%) | 0 (0.0%) |
| 6 to 11 Years | 0 (0.0%) | 20 (100.0%) |
| 12 to 14 Years | 12 (100.0%) | 0 (0.0%) |
| 15 Years | 0 (0.0%) | 0 (0.0%) |
| 16 and 17 Years | 0 (0.0%) | 38 (100.0%) |
| 18 to 24 Years | 19 (28.4%) | 23 (100.0%) |
| 25 to 34 Years | 41 (100.0%) | 99 (100.0%) |
| 35 to 44 Years | 46 (100.0%) | 31 (100.0%) |
| 45 to 54 Years | 148 (100.0%) | 30 (100.0%) |
| 55 to 64 Years | 67 (100.0%) | 20 (22.7%) |
| 65 to 74 Years | 96 (100.0%) | 123 (80.9%) |
| 75 Years and over | 21 (56.8%) | 137 (100.0%) |
| Total | 467 (87.9%) | 559 (85.2%) |
Income Below Poverty Among Married-Couple Families in Fairhope
The poverty statistics for married-couple families in Fairhope show that 8.0% or 16 of the total 201 families live below the poverty line. Families with no children have the highest poverty rate of 11.4%, comprising of 16 families. On the other hand, families with 1 or 2 children have the lowest poverty rate of 0.0%, which includes 0 families.
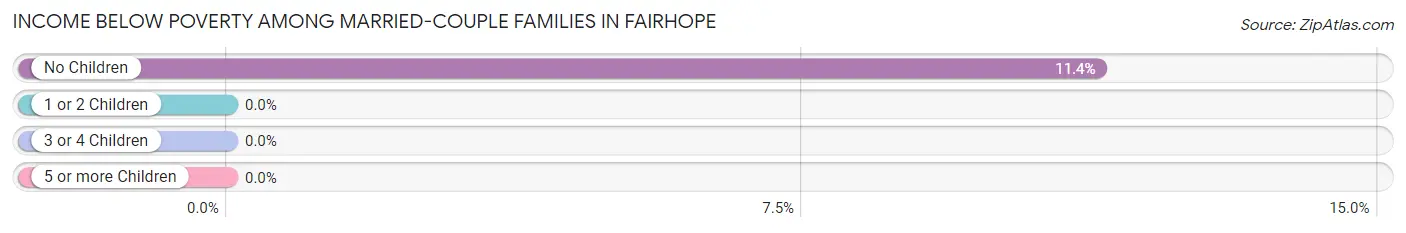
| Children | Above Poverty | Below Poverty |
| No Children | 125 (88.6%) | 16 (11.4%) |
| 1 or 2 Children | 53 (100.0%) | 0 (0.0%) |
| 3 or 4 Children | 7 (100.0%) | 0 (0.0%) |
| 5 or more Children | 0 (0.0%) | 0 (0.0%) |
| Total | 185 (92.0%) | 16 (8.0%) |
Income Below Poverty Among Single-Parent Households in Fairhope
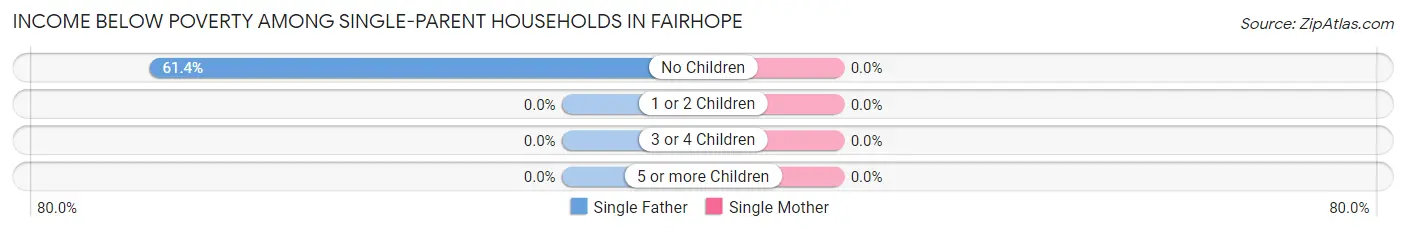
| Children | Single Father | Single Mother |
| No Children | 27 (61.4%) | 0 (0.0%) |
| 1 or 2 Children | 0 (0.0%) | 0 (0.0%) |
| 3 or 4 Children | 0 (0.0%) | 0 (0.0%) |
| 5 or more Children | 0 (0.0%) | 0 (0.0%) |
| Total | 27 (61.4%) | 0 (0.0%) |
Income Below Poverty Among Married-Couple vs Single-Parent Households in Fairhope
The poverty data for Fairhope shows that 16 of the married-couple family households (8.0%) and 27 of the single-parent households (17.3%) are living below the poverty level. Within the married-couple family households, those with no children have the highest poverty rate, with 16 households (11.4%) falling below the poverty line. Among the single-parent households, those with no children have the highest poverty rate, with 27 household (21.3%) living below poverty.
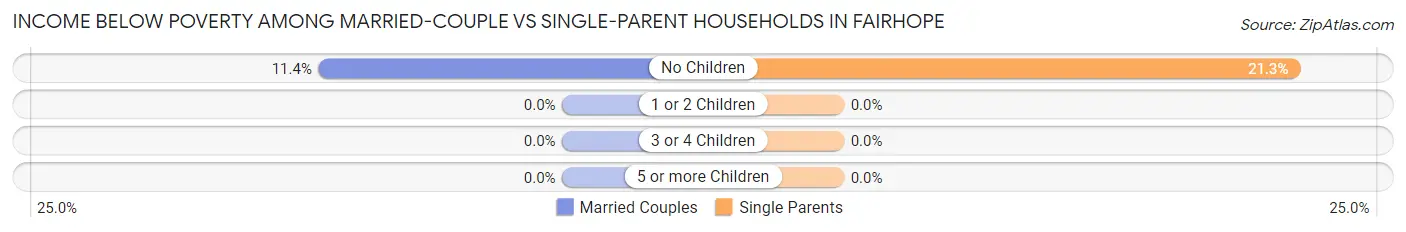
| Children | Married-Couple Families | Single-Parent Households |
| No Children | 16 (11.4%) | 27 (21.3%) |
| 1 or 2 Children | 0 (0.0%) | 0 (0.0%) |
| 3 or 4 Children | 0 (0.0%) | 0 (0.0%) |
| 5 or more Children | 0 (0.0%) | 0 (0.0%) |
| Total | 16 (8.0%) | 27 (17.3%) |
Race in Fairhope
The most populous races in Fairhope are White / Caucasian (1,054 | 88.8%), Hispanic or Latino (126 | 10.6%), and Some other Race (126 | 10.6%).
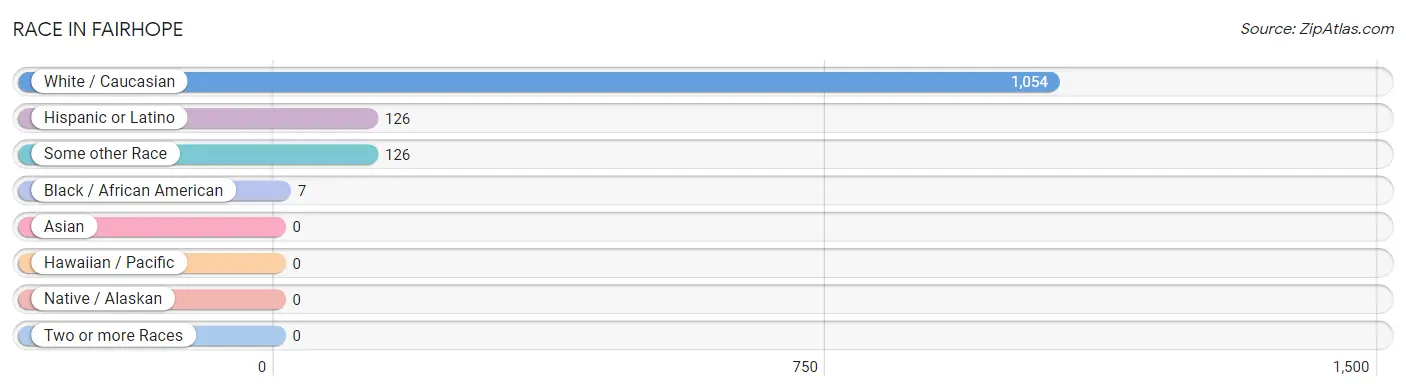
| Race | # Population | % Population |
| Asian | 0 | 0.0% |
| Black / African American | 7 | 0.6% |
| Hawaiian / Pacific | 0 | 0.0% |
| Hispanic or Latino | 126 | 10.6% |
| Native / Alaskan | 0 | 0.0% |
| White / Caucasian | 1,054 | 88.8% |
| Two or more Races | 0 | 0.0% |
| Some other Race | 126 | 10.6% |
| Total | 1,187 | 100.0% |
Ancestry in Fairhope
The most populous ancestries reported in Fairhope are English (448 | 37.7%), German (351 | 29.6%), Scottish (214 | 18.0%), Irish (143 | 12.0%), and Italian (143 | 12.0%), together accounting for 109.4% of all Fairhope residents.
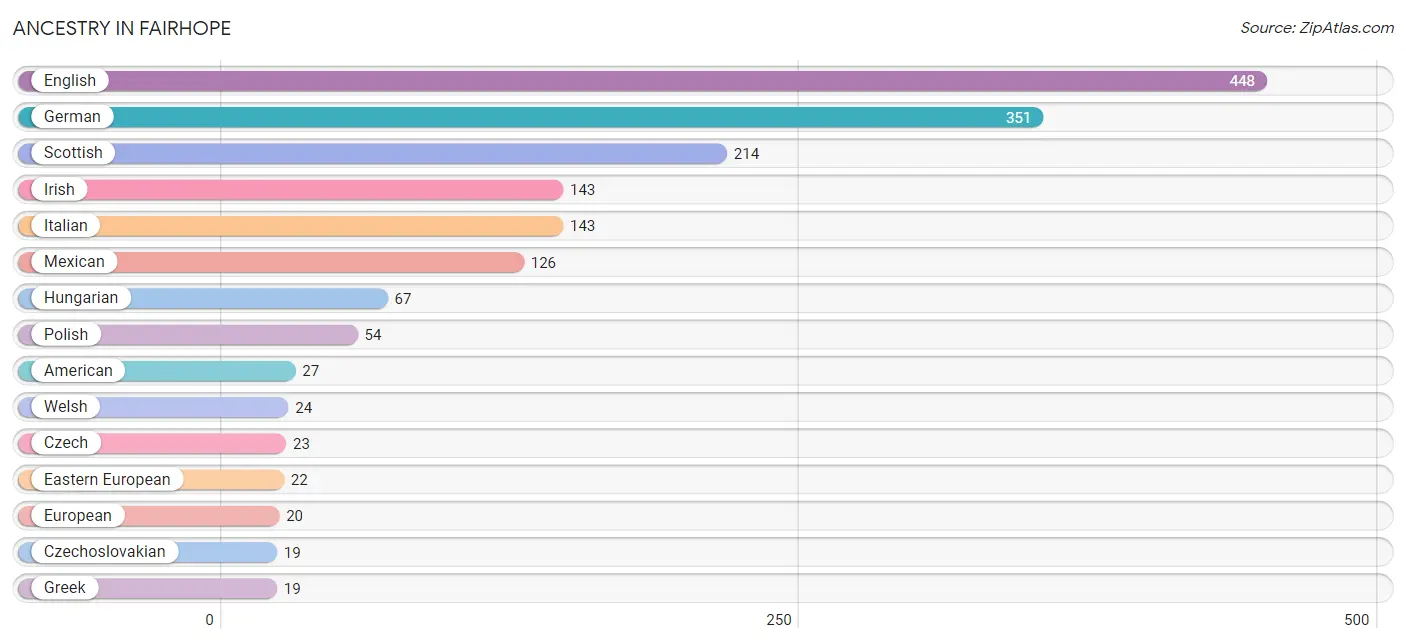
| Ancestry | # Population | % Population |
| American | 27 | 2.3% |
| Czech | 23 | 1.9% |
| Czechoslovakian | 19 | 1.6% |
| Eastern European | 22 | 1.8% |
| English | 448 | 37.7% |
| European | 20 | 1.7% |
| German | 351 | 29.6% |
| Greek | 19 | 1.6% |
| Hungarian | 67 | 5.6% |
| Irish | 143 | 12.0% |
| Italian | 143 | 12.0% |
| Mexican | 126 | 10.6% |
| Polish | 54 | 4.5% |
| Scottish | 214 | 18.0% |
| Welsh | 24 | 2.0% | View All 15 Rows |
Immigrants in Fairhope
The most numerous immigrant groups reported in Fairhope came from Central America (79 | 6.7%), Latin America (79 | 6.7%), and Mexico (79 | 6.7%), together accounting for 20.0% of all Fairhope residents.
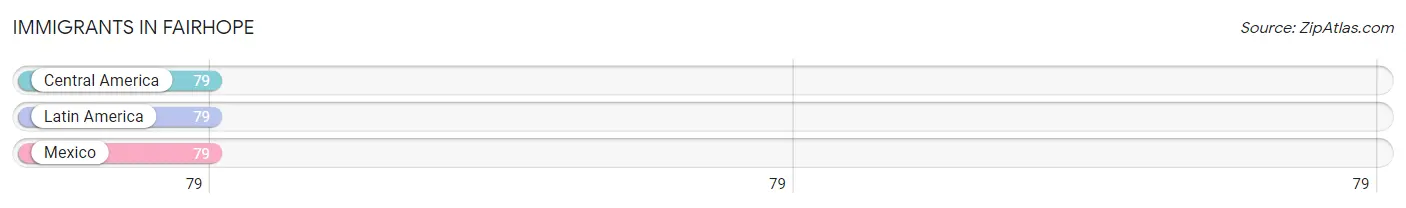
| Immigration Origin | # Population | % Population |
| Central America | 79 | 6.7% |
| Latin America | 79 | 6.7% |
| Mexico | 79 | 6.7% | View All 3 Rows |
Sex and Age in Fairhope
Sex and Age in Fairhope
The most populous age groups in Fairhope are 45 to 49 Years (138 | 26.0%) for men and 65 to 69 Years (104 | 15.9%) for women.
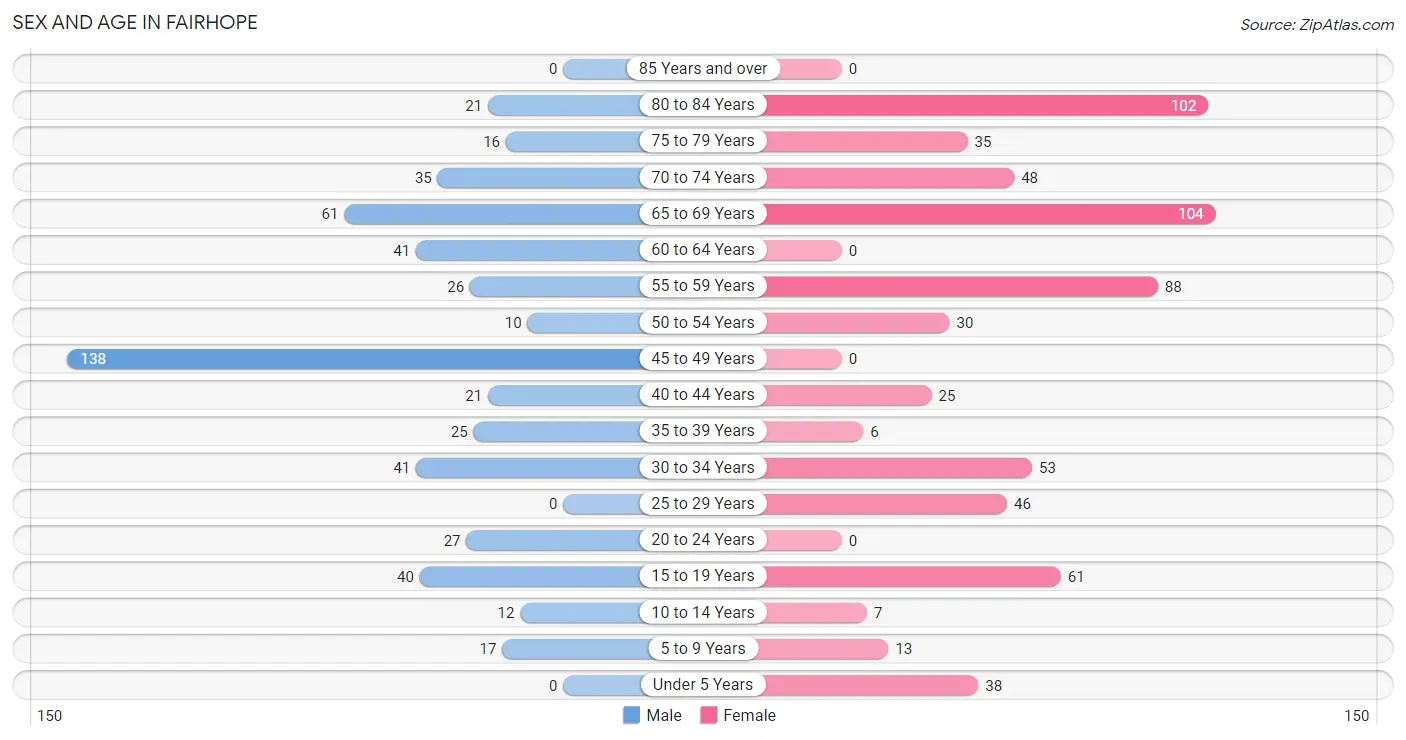
| Age Bracket | Male | Female |
| Under 5 Years | 0 (0.0%) | 38 (5.8%) |
| 5 to 9 Years | 17 (3.2%) | 13 (2.0%) |
| 10 to 14 Years | 12 (2.3%) | 7 (1.1%) |
| 15 to 19 Years | 40 (7.5%) | 61 (9.3%) |
| 20 to 24 Years | 27 (5.1%) | 0 (0.0%) |
| 25 to 29 Years | 0 (0.0%) | 46 (7.0%) |
| 30 to 34 Years | 41 (7.7%) | 53 (8.1%) |
| 35 to 39 Years | 25 (4.7%) | 6 (0.9%) |
| 40 to 44 Years | 21 (4.0%) | 25 (3.8%) |
| 45 to 49 Years | 138 (26.0%) | 0 (0.0%) |
| 50 to 54 Years | 10 (1.9%) | 30 (4.6%) |
| 55 to 59 Years | 26 (4.9%) | 88 (13.4%) |
| 60 to 64 Years | 41 (7.7%) | 0 (0.0%) |
| 65 to 69 Years | 61 (11.5%) | 104 (15.9%) |
| 70 to 74 Years | 35 (6.6%) | 48 (7.3%) |
| 75 to 79 Years | 16 (3.0%) | 35 (5.3%) |
| 80 to 84 Years | 21 (4.0%) | 102 (15.5%) |
| 85 Years and over | 0 (0.0%) | 0 (0.0%) |
| Total | 531 (100.0%) | 656 (100.0%) |
Families and Households in Fairhope
Median Family Size in Fairhope
The median family size in Fairhope is 2.61 persons per family, with married-couple families (201 | 56.3%) accounting for the largest median family size of 2.82 persons per family. On the other hand, single male/father families (44 | 12.3%) represent the smallest median family size with 1.91 persons per family.
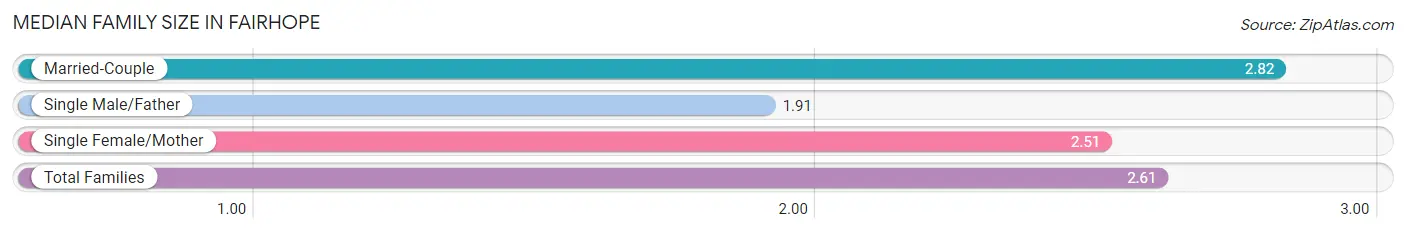
| Family Type | # Families | Family Size |
| Married-Couple | 201 (56.3%) | 2.82 |
| Single Male/Father | 44 (12.3%) | 1.91 |
| Single Female/Mother | 112 (31.4%) | 2.51 |
| Total Families | 357 (100.0%) | 2.61 |
Median Household Size in Fairhope
The median household size in Fairhope is 2.01 persons per household, with married-couple households (201 | 34.1%) accounting for the largest median household size of 2.82 persons per household. non-family households (233 | 39.5%) represent the smallest median household size with 1.10 persons per household.
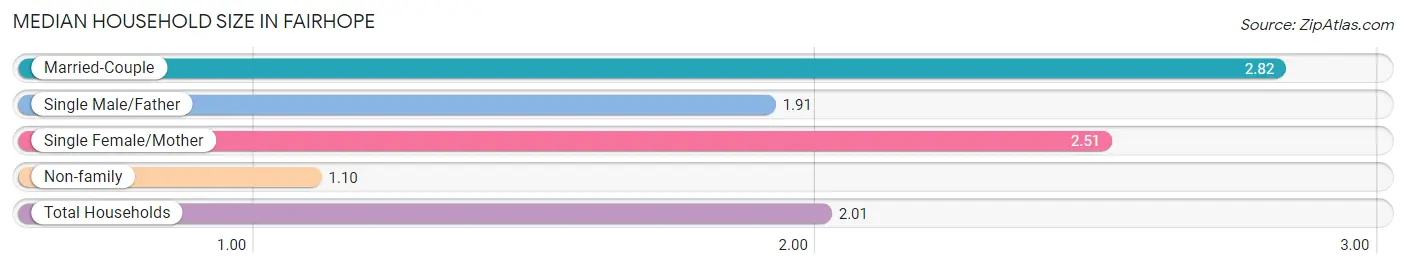
| Household Type | # Households | Household Size |
| Married-Couple | 201 (34.1%) | 2.82 |
| Single Male/Father | 44 (7.5%) | 1.91 |
| Single Female/Mother | 112 (19.0%) | 2.51 |
| Non-family | 233 (39.5%) | 1.10 |
| Total Households | 590 (100.0%) | 2.01 |
Household Size by Marriage Status in Fairhope
Out of a total of 590 households in Fairhope, 357 (60.5%) are family households, while 233 (39.5%) are nonfamily households. The most numerous type of family households are 2-person households, comprising 244, and the most common type of nonfamily households are 1-person households, comprising 209.
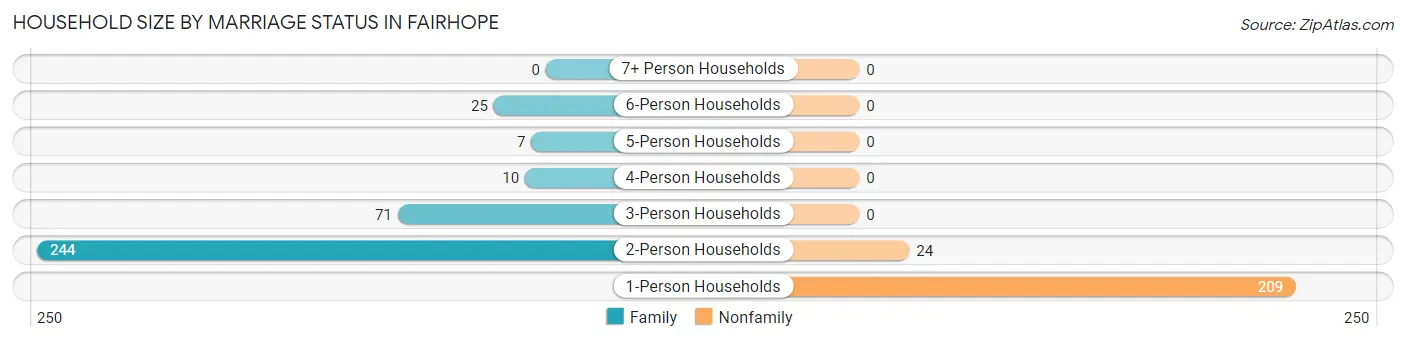
| Household Size | Family Households | Nonfamily Households |
| 1-Person Households | - | 209 (35.4%) |
| 2-Person Households | 244 (41.4%) | 24 (4.1%) |
| 3-Person Households | 71 (12.0%) | 0 (0.0%) |
| 4-Person Households | 10 (1.7%) | 0 (0.0%) |
| 5-Person Households | 7 (1.2%) | 0 (0.0%) |
| 6-Person Households | 25 (4.2%) | 0 (0.0%) |
| 7+ Person Households | 0 (0.0%) | 0 (0.0%) |
| Total | 357 (60.5%) | 233 (39.5%) |
Female Fertility in Fairhope
Fertility by Age in Fairhope
Average fertility rate in Fairhope is 110.0 births per 1,000 women. Women in the age bracket of 20 to 34 years have the highest fertility rate with 212.0 births per 1,000 women. Women in the age bracket of 20 to 34 years acount for 100.0% of all women with births.
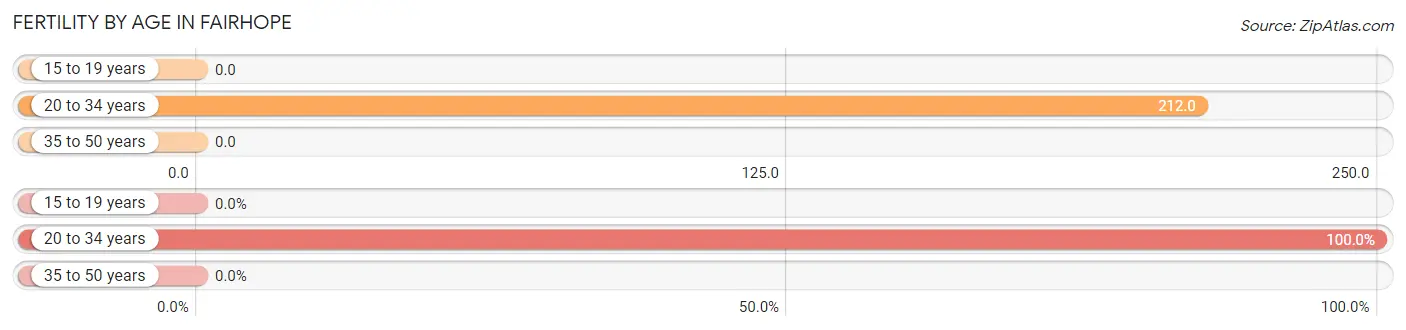
| Age Bracket | Women with Births | Births / 1,000 Women |
| 15 to 19 years | 0 (0.0%) | 0.0 |
| 20 to 34 years | 21 (100.0%) | 212.0 |
| 35 to 50 years | 0 (0.0%) | 0.0 |
| Total | 21 (100.0%) | 110.0 |
Fertility by Age by Marriage Status in Fairhope
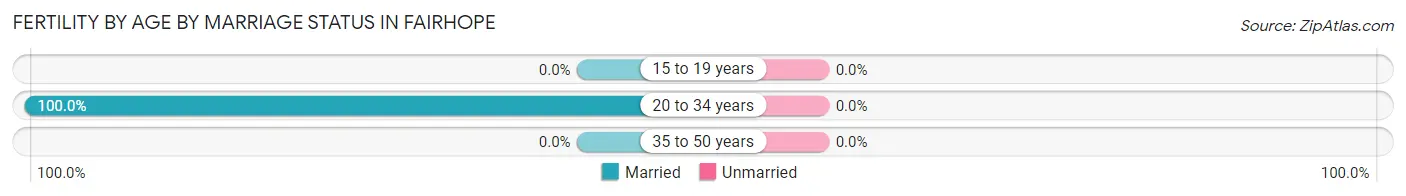
| Age Bracket | Married | Unmarried |
| 15 to 19 years | 0 (0.0%) | 0 (0.0%) |
| 20 to 34 years | 21 (100.0%) | 0 (0.0%) |
| 35 to 50 years | 0 (0.0%) | 0 (0.0%) |
| Total | 21 (100.0%) | 0 (0.0%) |
Fertility by Education in Fairhope
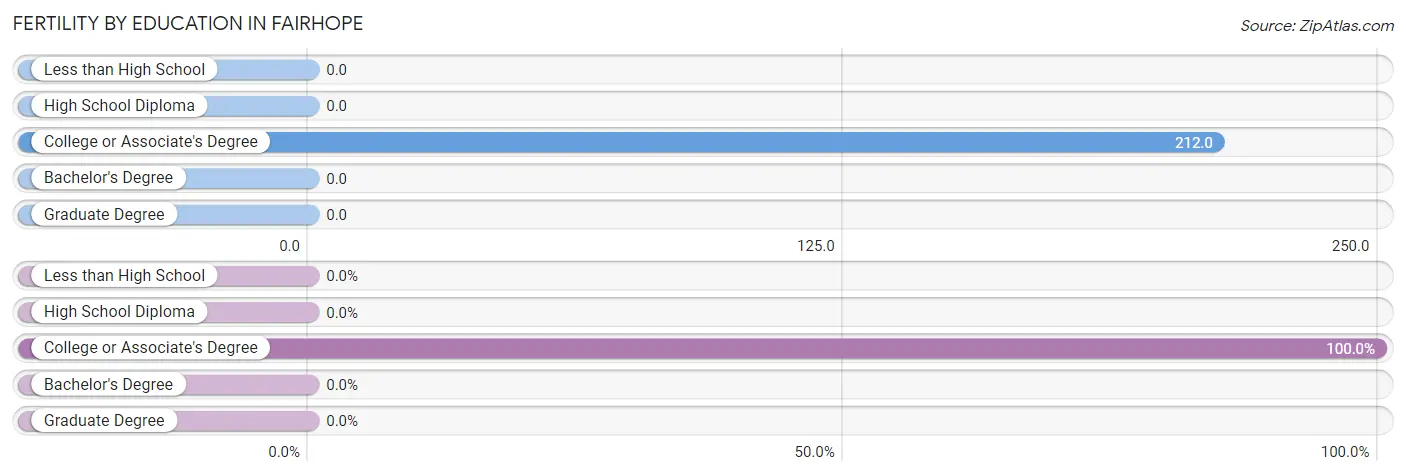
| Educational Attainment | Women with Births | Births / 1,000 Women |
| Less than High School | 0 (0.0%) | 0.0 |
| High School Diploma | 0 (0.0%) | 0.0 |
| College or Associate's Degree | 21 (100.0%) | 212.0 |
| Bachelor's Degree | 0 (0.0%) | 0.0 |
| Graduate Degree | 0 (0.0%) | 0.0 |
| Total | 21 (100.0%) | 110.0 |
Fertility by Education by Marriage Status in Fairhope
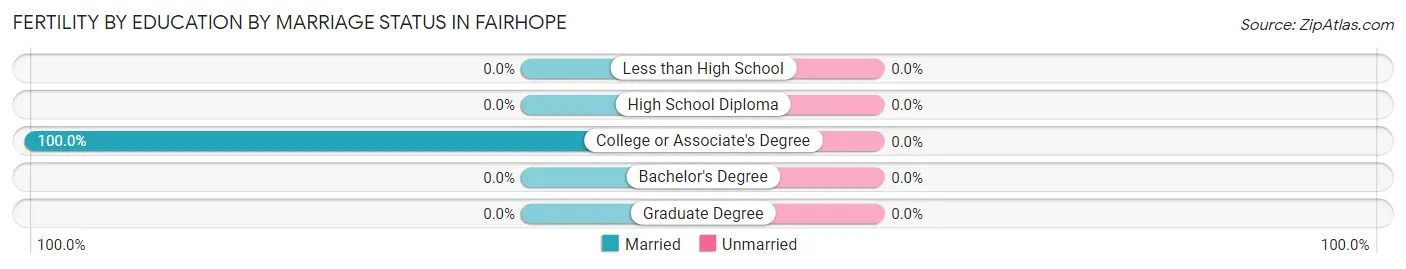
| Educational Attainment | Married | Unmarried |
| Less than High School | 0 (0.0%) | 0 (0.0%) |
| High School Diploma | 0 (0.0%) | 0 (0.0%) |
| College or Associate's Degree | 21 (100.0%) | 0 (0.0%) |
| Bachelor's Degree | 0 (0.0%) | 0 (0.0%) |
| Graduate Degree | 0 (0.0%) | 0 (0.0%) |
| Total | 21 (100.0%) | 0 (0.0%) |
Employment Characteristics in Fairhope
Employment by Class of Employer in Fairhope
Among the 416 employed individuals in Fairhope, private company employees (360 | 86.5%), self-employed (not incorporated) (36 | 8.6%), and local government employees (20 | 4.8%) make up the most common classes of employment.
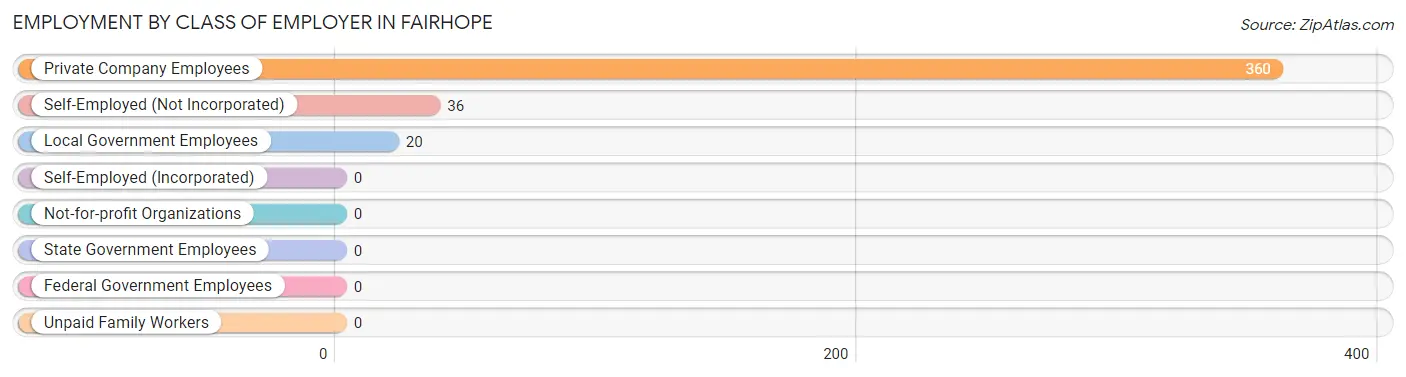
| Employer Class | # Employees | % Employees |
| Private Company Employees | 360 | 86.5% |
| Self-Employed (Incorporated) | 0 | 0.0% |
| Self-Employed (Not Incorporated) | 36 | 8.6% |
| Not-for-profit Organizations | 0 | 0.0% |
| Local Government Employees | 20 | 4.8% |
| State Government Employees | 0 | 0.0% |
| Federal Government Employees | 0 | 0.0% |
| Unpaid Family Workers | 0 | 0.0% |
| Total | 416 | 100.0% |
Employment Status by Age in Fairhope
According to the labor force statistics for Fairhope, out of the total population over 16 years of age (1,100), 39.7% or 437 individuals are in the labor force, with 4.8% or 21 of them unemployed. The age group with the highest labor force participation rate is 30 to 34 years, with 100.0% or 94 individuals in the labor force. Within the labor force, the 16 to 19 years age range has the highest percentage of unemployed individuals, with 33.3% or 21 of them being unemployed.
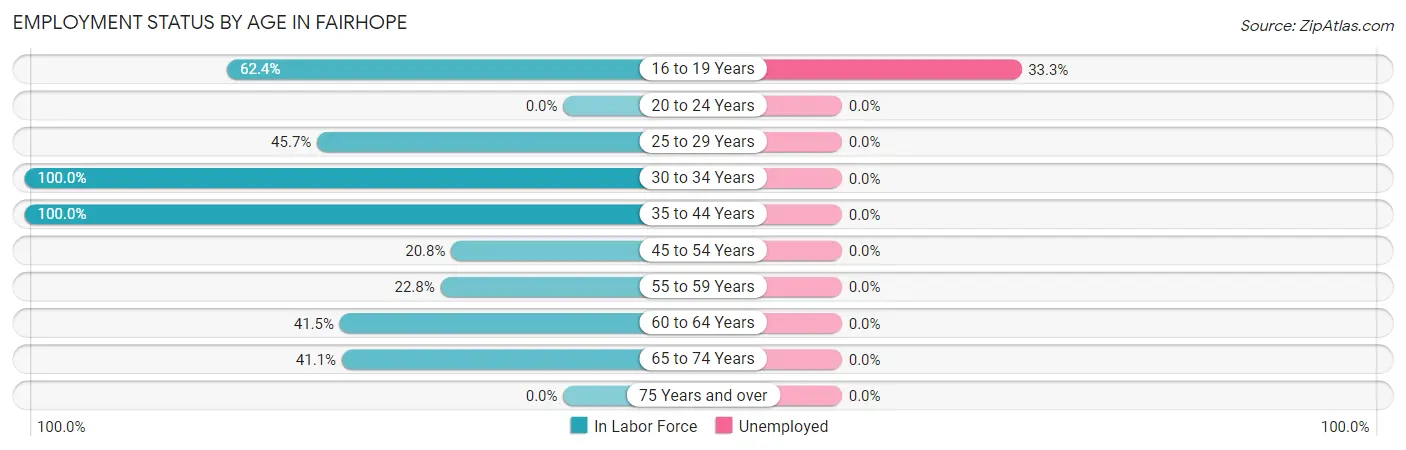
| Age Bracket | In Labor Force | Unemployed |
| 16 to 19 Years | 63 (62.4%) | 21 (33.3%) |
| 20 to 24 Years | 0 (0.0%) | 0 (0.0%) |
| 25 to 29 Years | 21 (45.7%) | 0 (0.0%) |
| 30 to 34 Years | 94 (100.0%) | 0 (0.0%) |
| 35 to 44 Years | 77 (100.0%) | 0 (0.0%) |
| 45 to 54 Years | 37 (20.8%) | 0 (0.0%) |
| 55 to 59 Years | 26 (22.8%) | 0 (0.0%) |
| 60 to 64 Years | 17 (41.5%) | 0 (0.0%) |
| 65 to 74 Years | 102 (41.1%) | 0 (0.0%) |
| 75 Years and over | 0 (0.0%) | 0 (0.0%) |
| Total | 437 (39.7%) | 21 (4.8%) |
Employment Status by Educational Attainment in Fairhope
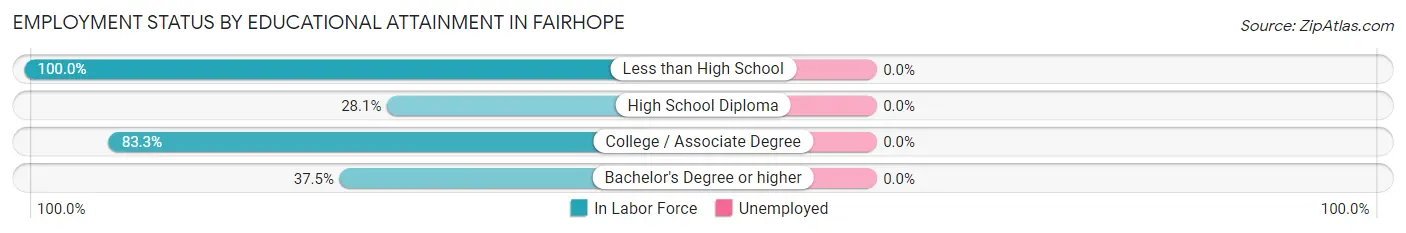
| Educational Attainment | In Labor Force | Unemployed |
| Less than High School | 46 (100.0%) | 0 (0.0%) |
| High School Diploma | 95 (28.1%) | 0 (0.0%) |
| College / Associate Degree | 125 (83.3%) | 0 (0.0%) |
| Bachelor's Degree or higher | 6 (37.5%) | 0 (0.0%) |
| Total | 272 (49.5%) | 0 (0.0%) |
Employment Occupations by Sex in Fairhope
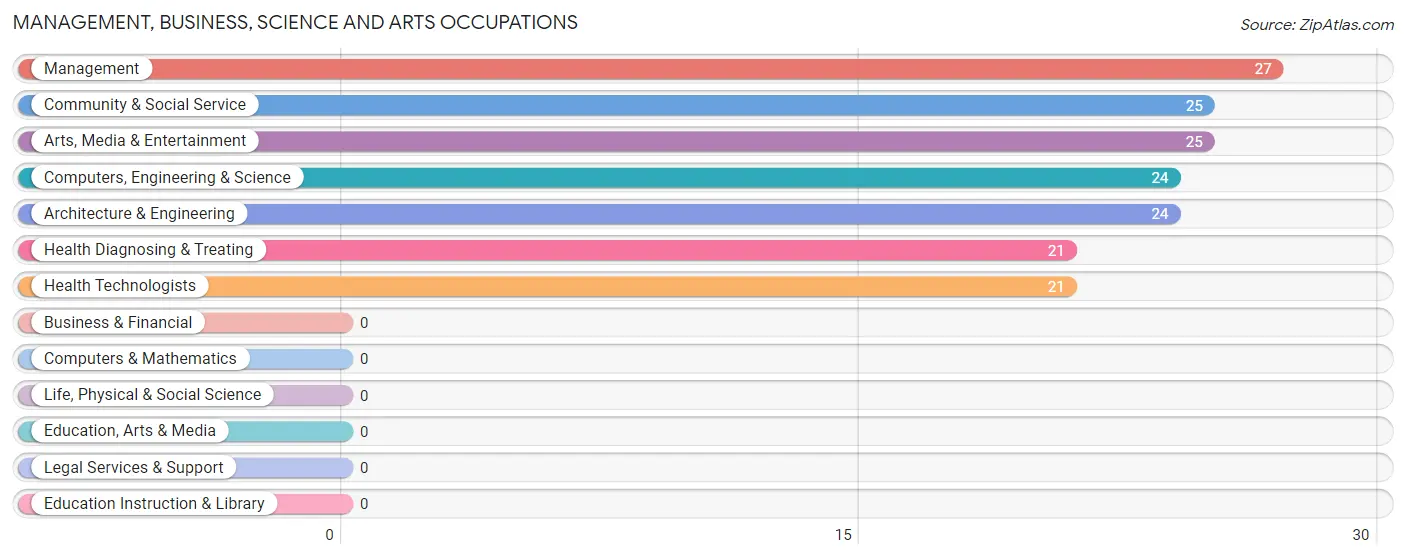
Management, Business, Science and Arts Occupations
The most common Management, Business, Science and Arts occupations in Fairhope are Management (27 | 6.5%), Community & Social Service (25 | 6.0%), Arts, Media & Entertainment (25 | 6.0%), Computers, Engineering & Science (24 | 5.8%), and Architecture & Engineering (24 | 5.8%).
Management, Business, Science and Arts Occupations by Sex
Within the Management, Business, Science and Arts occupations in Fairhope, the most male-oriented occupations are Community & Social Service (100.0%), Arts, Media & Entertainment (100.0%), and Computers, Engineering & Science (75.0%), while the most female-oriented occupations are Health Diagnosing & Treating (100.0%), Health Technologists (100.0%), and Management (74.1%).
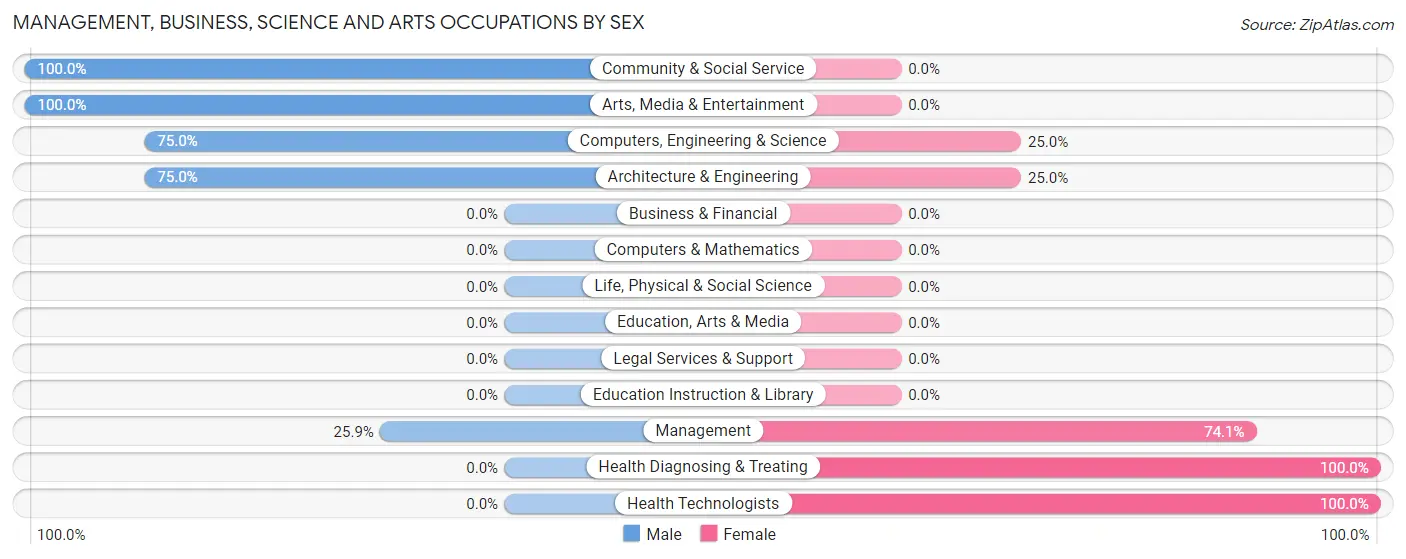
| Occupation | Male | Female |
| Management | 7 (25.9%) | 20 (74.1%) |
| Business & Financial | 0 (0.0%) | 0 (0.0%) |
| Computers, Engineering & Science | 18 (75.0%) | 6 (25.0%) |
| Computers & Mathematics | 0 (0.0%) | 0 (0.0%) |
| Architecture & Engineering | 18 (75.0%) | 6 (25.0%) |
| Life, Physical & Social Science | 0 (0.0%) | 0 (0.0%) |
| Community & Social Service | 25 (100.0%) | 0 (0.0%) |
| Education, Arts & Media | 0 (0.0%) | 0 (0.0%) |
| Legal Services & Support | 0 (0.0%) | 0 (0.0%) |
| Education Instruction & Library | 0 (0.0%) | 0 (0.0%) |
| Arts, Media & Entertainment | 25 (100.0%) | 0 (0.0%) |
| Health Diagnosing & Treating | 0 (0.0%) | 21 (100.0%) |
| Health Technologists | 0 (0.0%) | 21 (100.0%) |
| Total (Category) | 50 (51.5%) | 47 (48.4%) |
| Total (Overall) | 215 (51.7%) | 201 (48.3%) |
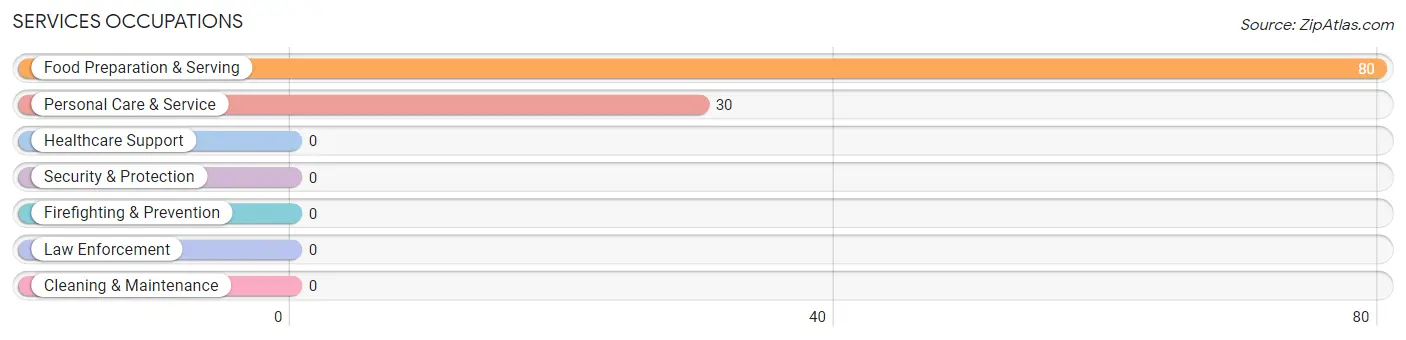
Services Occupations
The most common Services occupations in Fairhope are Food Preparation & Serving (80 | 19.2%), and Personal Care & Service (30 | 7.2%).
Services Occupations by Sex
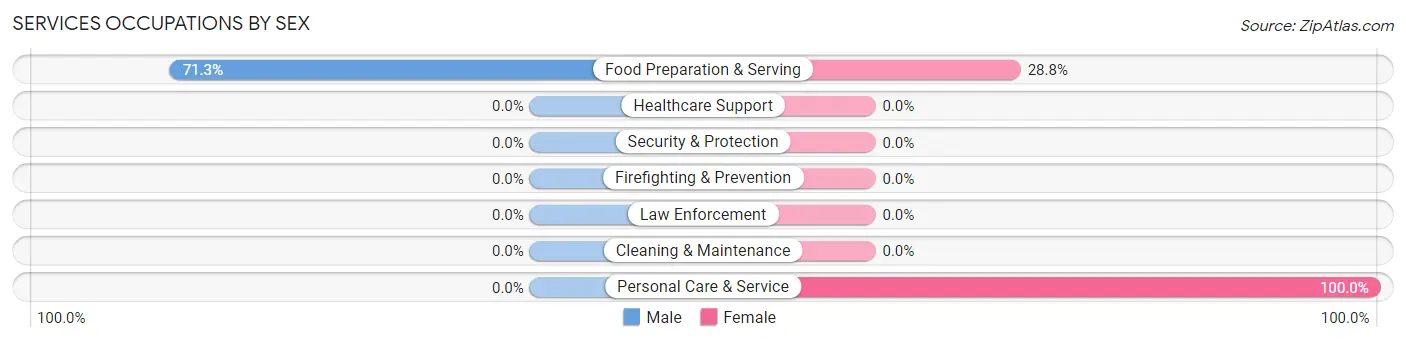
| Occupation | Male | Female |
| Healthcare Support | 0 (0.0%) | 0 (0.0%) |
| Security & Protection | 0 (0.0%) | 0 (0.0%) |
| Firefighting & Prevention | 0 (0.0%) | 0 (0.0%) |
| Law Enforcement | 0 (0.0%) | 0 (0.0%) |
| Food Preparation & Serving | 57 (71.3%) | 23 (28.7%) |
| Cleaning & Maintenance | 0 (0.0%) | 0 (0.0%) |
| Personal Care & Service | 0 (0.0%) | 30 (100.0%) |
| Total (Category) | 57 (51.8%) | 53 (48.2%) |
| Total (Overall) | 215 (51.7%) | 201 (48.3%) |
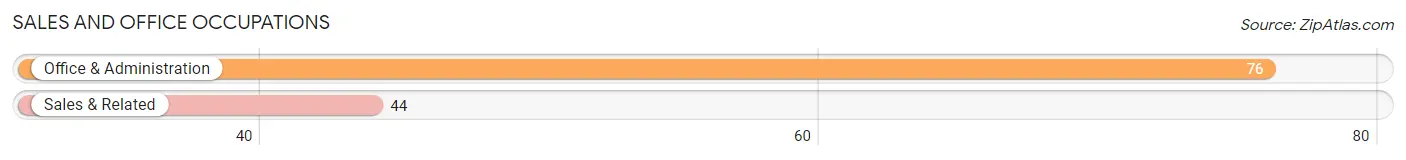
Sales and Office Occupations
The most common Sales and Office occupations in Fairhope are Office & Administration (76 | 18.3%), and Sales & Related (44 | 10.6%).
Sales and Office Occupations by Sex
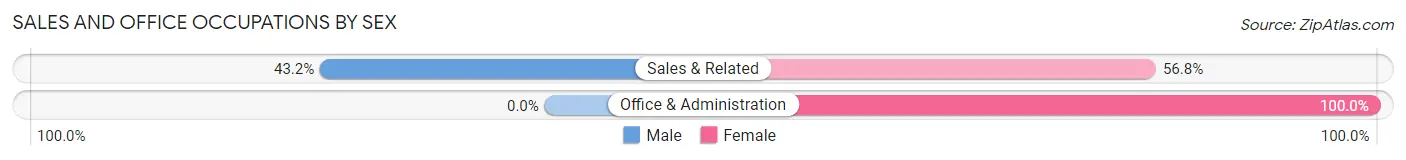
| Occupation | Male | Female |
| Sales & Related | 19 (43.2%) | 25 (56.8%) |
| Office & Administration | 0 (0.0%) | 76 (100.0%) |
| Total (Category) | 19 (15.8%) | 101 (84.2%) |
| Total (Overall) | 215 (51.7%) | 201 (48.3%) |
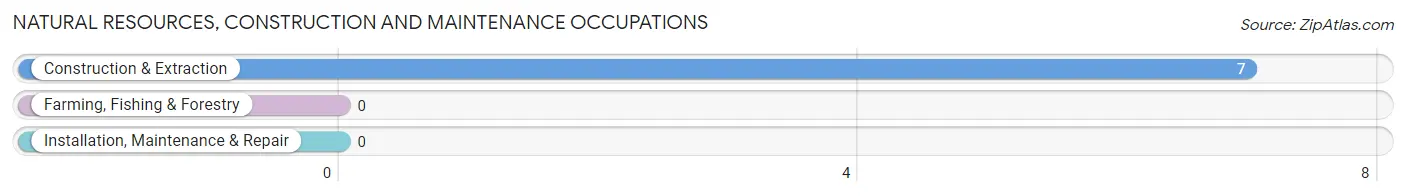
Natural Resources, Construction and Maintenance Occupations
The most common Natural Resources, Construction and Maintenance occupations in Fairhope are , and Construction & Extraction (7 | 1.7%).
Natural Resources, Construction and Maintenance Occupations by Sex
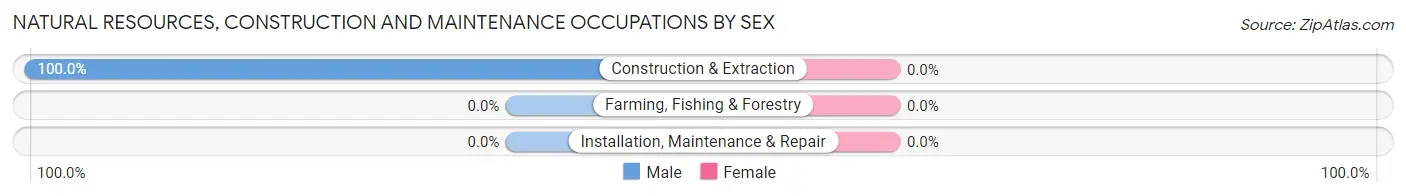
| Occupation | Male | Female |
| Farming, Fishing & Forestry | 0 (0.0%) | 0 (0.0%) |
| Construction & Extraction | 7 (100.0%) | 0 (0.0%) |
| Installation, Maintenance & Repair | 0 (0.0%) | 0 (0.0%) |
| Total (Category) | 7 (100.0%) | 0 (0.0%) |
| Total (Overall) | 215 (51.7%) | 201 (48.3%) |
Production, Transportation and Moving Occupations
The most common Production, Transportation and Moving occupations in Fairhope are Production (40 | 9.6%), Material Moving (23 | 5.5%), and Transportation (19 | 4.6%).
Production, Transportation and Moving Occupations by Sex
| Occupation | Male | Female |
| Production | 40 (100.0%) | 0 (0.0%) |
| Transportation | 19 (100.0%) | 0 (0.0%) |
| Material Moving | 23 (100.0%) | 0 (0.0%) |
| Total (Category) | 82 (100.0%) | 0 (0.0%) |
| Total (Overall) | 215 (51.7%) | 201 (48.3%) |
Employment Industries by Sex in Fairhope
Employment Industries in Fairhope
The major employment industries in Fairhope include Accommodation & Food Services (105 | 25.2%), Retail Trade (94 | 22.6%), Manufacturing (64 | 15.4%), Arts, Entertainment & Recreation (25 | 6.0%), and Health Care & Social Assistance (21 | 5.1%).
Employment Industries by Sex in Fairhope
The Fairhope industries that see more men than women are Mining, Quarrying, & Extraction (100.0%), Transportation & Warehousing (100.0%), and Administrative & Support (100.0%), whereas the industries that tend to have a higher number of women are Educational Services (100.0%), Health Care & Social Assistance (100.0%), and Retail Trade (55.3%).
| Industry | Male | Female |
| Agriculture, Fishing & Hunting | 0 (0.0%) | 0 (0.0%) |
| Mining, Quarrying, & Extraction | 7 (100.0%) | 0 (0.0%) |
| Construction | 0 (0.0%) | 0 (0.0%) |
| Manufacturing | 58 (90.6%) | 6 (9.4%) |
| Wholesale Trade | 0 (0.0%) | 0 (0.0%) |
| Retail Trade | 42 (44.7%) | 52 (55.3%) |
| Transportation & Warehousing | 19 (100.0%) | 0 (0.0%) |
| Utilities | 0 (0.0%) | 0 (0.0%) |
| Information | 0 (0.0%) | 0 (0.0%) |
| Finance & Insurance | 0 (0.0%) | 0 (0.0%) |
| Real Estate, Rental & Leasing | 0 (0.0%) | 0 (0.0%) |
| Professional & Scientific | 0 (0.0%) | 0 (0.0%) |
| Enterprise Management | 0 (0.0%) | 0 (0.0%) |
| Administrative & Support | 7 (100.0%) | 0 (0.0%) |
| Educational Services | 0 (0.0%) | 20 (100.0%) |
| Health Care & Social Assistance | 0 (0.0%) | 21 (100.0%) |
| Arts, Entertainment & Recreation | 25 (100.0%) | 0 (0.0%) |
| Accommodation & Food Services | 57 (54.3%) | 48 (45.7%) |
| Public Administration | 0 (0.0%) | 0 (0.0%) |
| Total | 215 (51.7%) | 201 (48.3%) |
Education in Fairhope
School Enrollment in Fairhope
The most common levels of schooling among the 177 students in Fairhope are college / undergraduate (71 | 40.1%), high school (57 | 32.2%), and elementary school (20 | 11.3%).
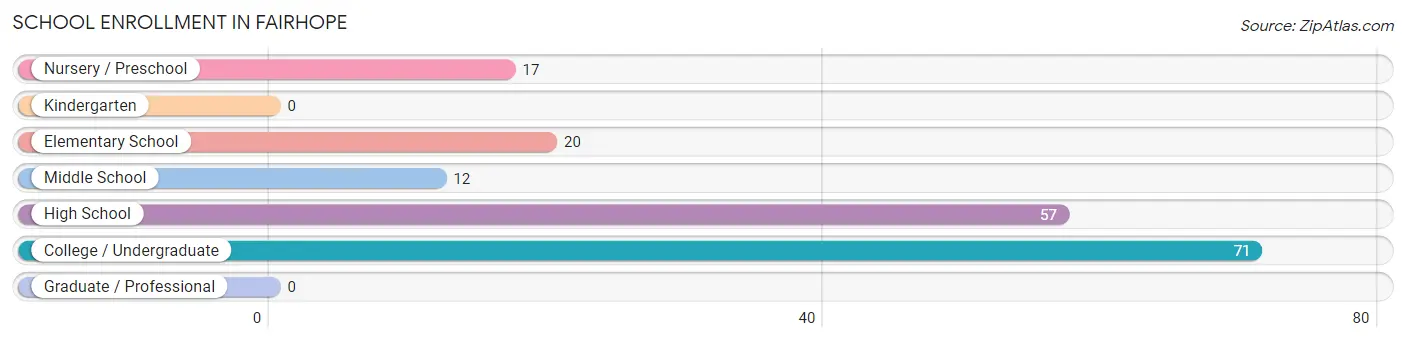
| School Level | # Students | % Students |
| Nursery / Preschool | 17 | 9.6% |
| Kindergarten | 0 | 0.0% |
| Elementary School | 20 | 11.3% |
| Middle School | 12 | 6.8% |
| High School | 57 | 32.2% |
| College / Undergraduate | 71 | 40.1% |
| Graduate / Professional | 0 | 0.0% |
| Total | 177 | 100.0% |
School Enrollment by Age by Funding Source in Fairhope
Out of a total of 177 students who are enrolled in schools in Fairhope, 17 (9.6%) attend a private institution, while the remaining 160 (90.4%) are enrolled in public schools. The age group of 5 to 9 year old has the highest likelihood of being enrolled in private schools, with 17 (56.7% in the age bracket) enrolled. Conversely, the age group of 10 to 14 year olds has the lowest likelihood of being enrolled in a private school, with 19 (100.0% in the age bracket) attending a public institution.
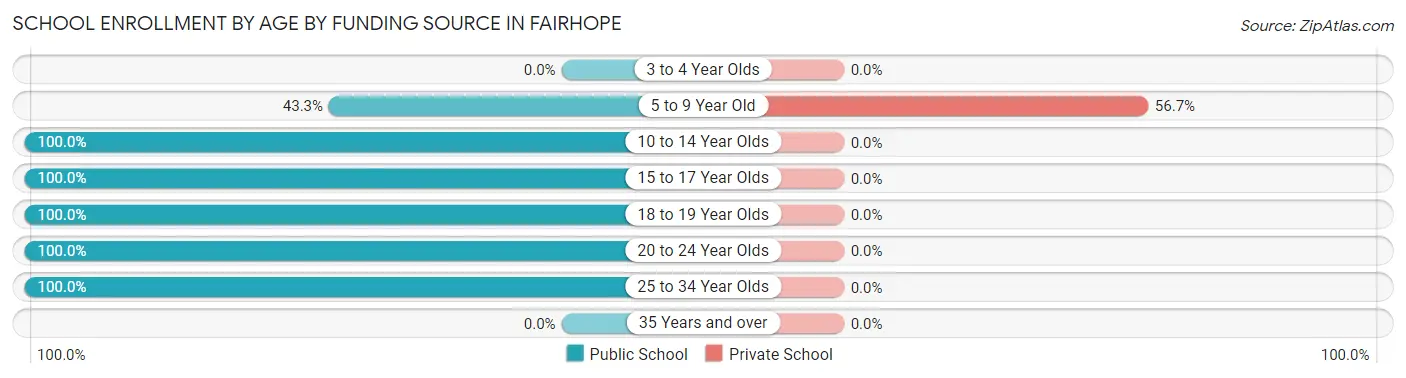
| Age Bracket | Public School | Private School |
| 3 to 4 Year Olds | 0 (0.0%) | 0 (0.0%) |
| 5 to 9 Year Old | 13 (43.3%) | 17 (56.7%) |
| 10 to 14 Year Olds | 19 (100.0%) | 0 (0.0%) |
| 15 to 17 Year Olds | 38 (100.0%) | 0 (0.0%) |
| 18 to 19 Year Olds | 42 (100.0%) | 0 (0.0%) |
| 20 to 24 Year Olds | 27 (100.0%) | 0 (0.0%) |
| 25 to 34 Year Olds | 21 (100.0%) | 0 (0.0%) |
| 35 Years and over | 0 (0.0%) | 0 (0.0%) |
| Total | 160 (90.4%) | 17 (9.6%) |
Educational Attainment by Field of Study in Fairhope
Education (46 | 74.2%), business (10 | 16.1%), and physical & health sciences (6 | 9.7%) are the most common fields of study among 62 individuals in Fairhope who have obtained a bachelor's degree or higher.
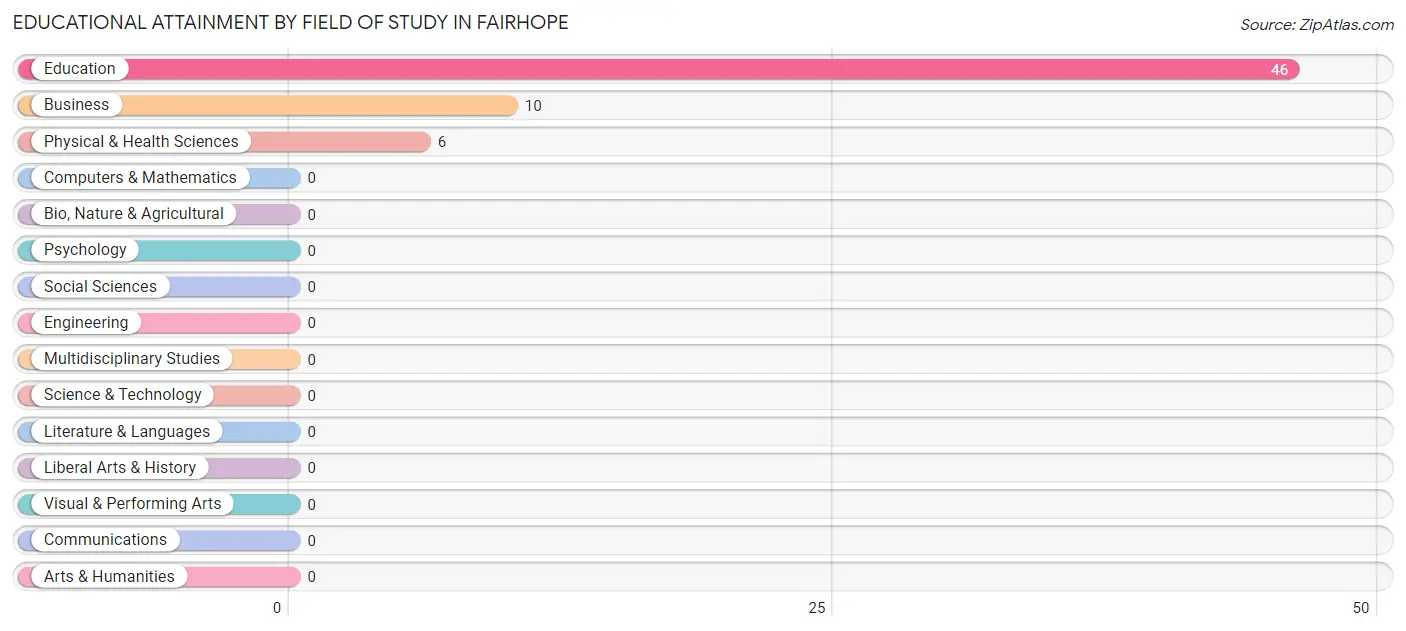
| Field of Study | # Graduates | % Graduates |
| Computers & Mathematics | 0 | 0.0% |
| Bio, Nature & Agricultural | 0 | 0.0% |
| Physical & Health Sciences | 6 | 9.7% |
| Psychology | 0 | 0.0% |
| Social Sciences | 0 | 0.0% |
| Engineering | 0 | 0.0% |
| Multidisciplinary Studies | 0 | 0.0% |
| Science & Technology | 0 | 0.0% |
| Business | 10 | 16.1% |
| Education | 46 | 74.2% |
| Literature & Languages | 0 | 0.0% |
| Liberal Arts & History | 0 | 0.0% |
| Visual & Performing Arts | 0 | 0.0% |
| Communications | 0 | 0.0% |
| Arts & Humanities | 0 | 0.0% |
| Total | 62 | 100.0% |
Transportation & Commute in Fairhope
Vehicle Availability by Sex in Fairhope
The most prevalent vehicle ownership categories in Fairhope are males with 2 vehicles (83, accounting for 38.6%) and females with 2 vehicles (98, making up 41.3%).
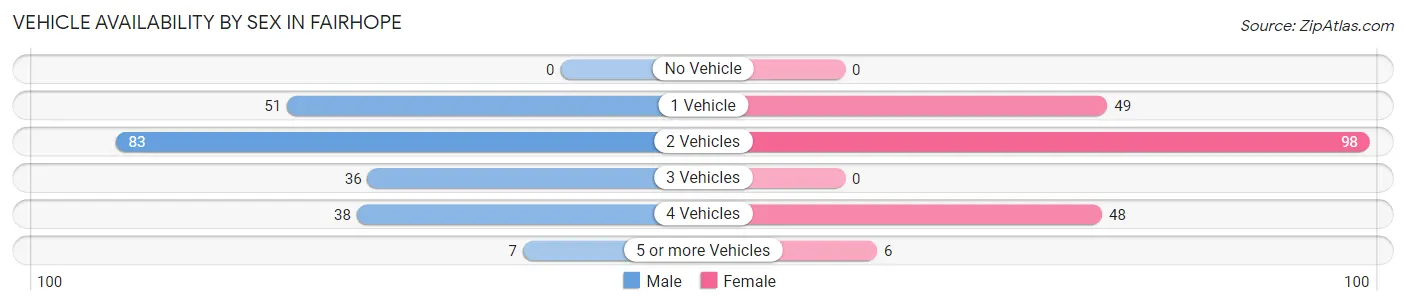
| Vehicles Available | Male | Female |
| No Vehicle | 0 (0.0%) | 0 (0.0%) |
| 1 Vehicle | 51 (23.7%) | 49 (24.4%) |
| 2 Vehicles | 83 (38.6%) | 98 (48.8%) |
| 3 Vehicles | 36 (16.7%) | 0 (0.0%) |
| 4 Vehicles | 38 (17.7%) | 48 (23.9%) |
| 5 or more Vehicles | 7 (3.3%) | 6 (3.0%) |
| Total | 215 (100.0%) | 201 (100.0%) |
Commute Time in Fairhope
The most frequently occuring commute durations in Fairhope are 5 to 9 minutes (124 commuters, 33.4%), 15 to 19 minutes (88 commuters, 23.7%), and 30 to 34 minutes (53 commuters, 14.3%).
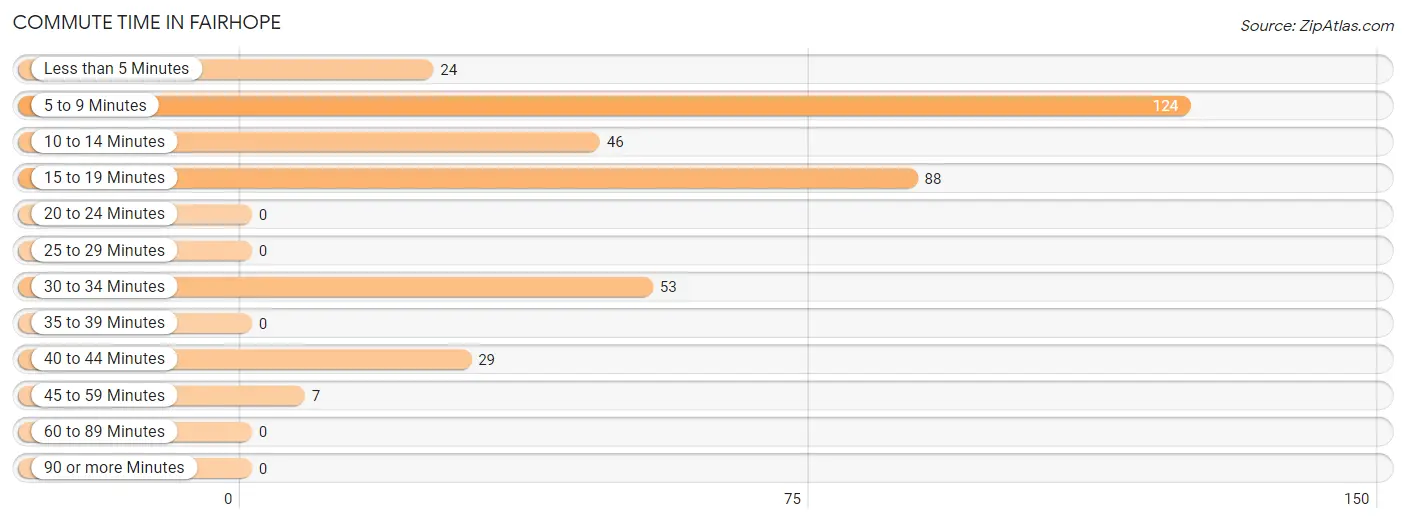
| Commute Time | # Commuters | % Commuters |
| Less than 5 Minutes | 24 | 6.5% |
| 5 to 9 Minutes | 124 | 33.4% |
| 10 to 14 Minutes | 46 | 12.4% |
| 15 to 19 Minutes | 88 | 23.7% |
| 20 to 24 Minutes | 0 | 0.0% |
| 25 to 29 Minutes | 0 | 0.0% |
| 30 to 34 Minutes | 53 | 14.3% |
| 35 to 39 Minutes | 0 | 0.0% |
| 40 to 44 Minutes | 29 | 7.8% |
| 45 to 59 Minutes | 7 | 1.9% |
| 60 to 89 Minutes | 0 | 0.0% |
| 90 or more Minutes | 0 | 0.0% |
Commute Time by Sex in Fairhope
The most common commute times in Fairhope are 5 to 9 minutes (57 commuters, 30.0%) for males and 5 to 9 minutes (67 commuters, 37.0%) for females.
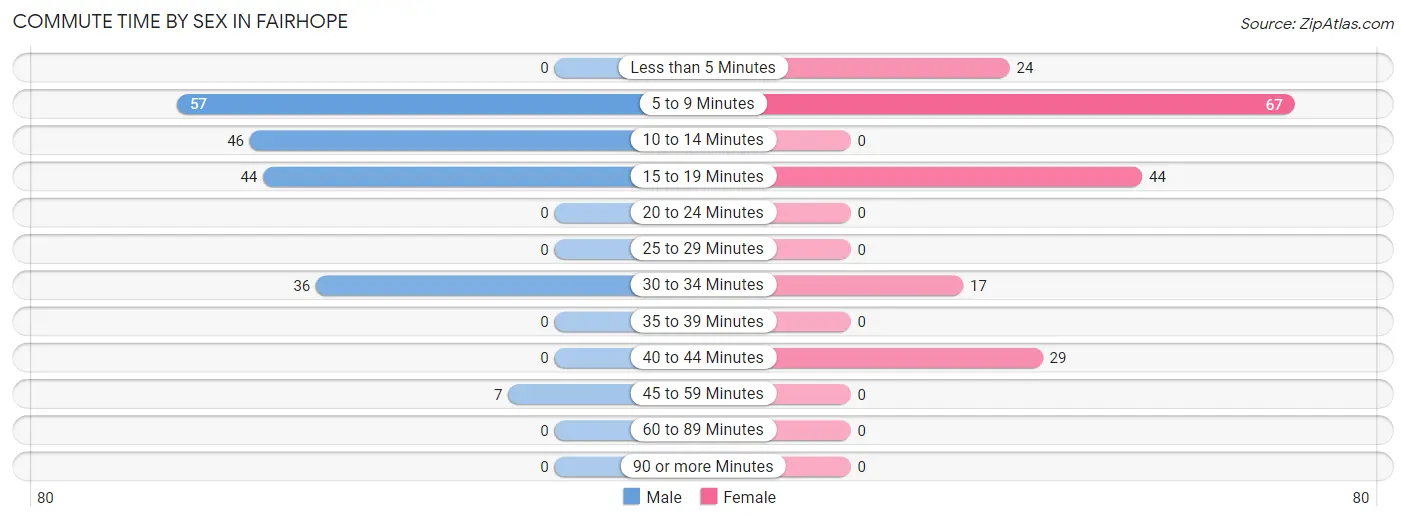
| Commute Time | Male | Female |
| Less than 5 Minutes | 0 (0.0%) | 24 (13.3%) |
| 5 to 9 Minutes | 57 (30.0%) | 67 (37.0%) |
| 10 to 14 Minutes | 46 (24.2%) | 0 (0.0%) |
| 15 to 19 Minutes | 44 (23.2%) | 44 (24.3%) |
| 20 to 24 Minutes | 0 (0.0%) | 0 (0.0%) |
| 25 to 29 Minutes | 0 (0.0%) | 0 (0.0%) |
| 30 to 34 Minutes | 36 (19.0%) | 17 (9.4%) |
| 35 to 39 Minutes | 0 (0.0%) | 0 (0.0%) |
| 40 to 44 Minutes | 0 (0.0%) | 29 (16.0%) |
| 45 to 59 Minutes | 7 (3.7%) | 0 (0.0%) |
| 60 to 89 Minutes | 0 (0.0%) | 0 (0.0%) |
| 90 or more Minutes | 0 (0.0%) | 0 (0.0%) |
Time of Departure to Work by Sex in Fairhope
The most frequent times of departure to work in Fairhope are 4:00 PM to 11:59 PM (61, 32.1%) for males and 10:00 AM to 10:59 AM (59, 32.6%) for females.
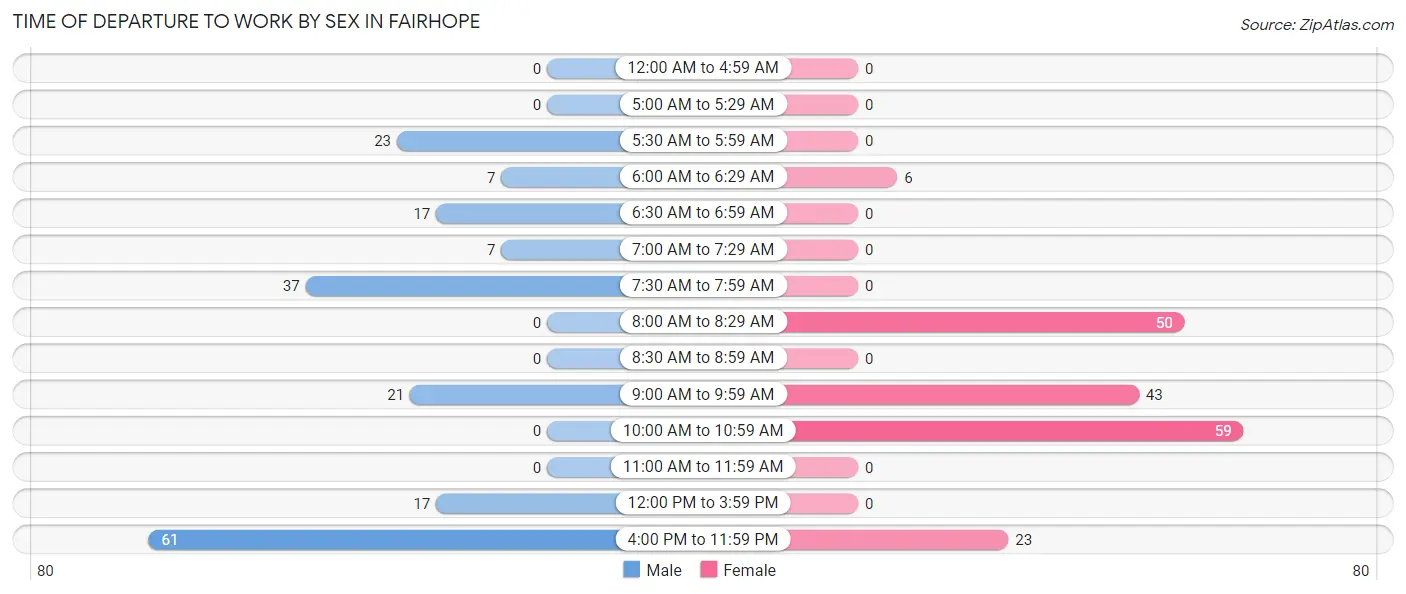
| Time of Departure | Male | Female |
| 12:00 AM to 4:59 AM | 0 (0.0%) | 0 (0.0%) |
| 5:00 AM to 5:29 AM | 0 (0.0%) | 0 (0.0%) |
| 5:30 AM to 5:59 AM | 23 (12.1%) | 0 (0.0%) |
| 6:00 AM to 6:29 AM | 7 (3.7%) | 6 (3.3%) |
| 6:30 AM to 6:59 AM | 17 (8.9%) | 0 (0.0%) |
| 7:00 AM to 7:29 AM | 7 (3.7%) | 0 (0.0%) |
| 7:30 AM to 7:59 AM | 37 (19.5%) | 0 (0.0%) |
| 8:00 AM to 8:29 AM | 0 (0.0%) | 50 (27.6%) |
| 8:30 AM to 8:59 AM | 0 (0.0%) | 0 (0.0%) |
| 9:00 AM to 9:59 AM | 21 (11.1%) | 43 (23.8%) |
| 10:00 AM to 10:59 AM | 0 (0.0%) | 59 (32.6%) |
| 11:00 AM to 11:59 AM | 0 (0.0%) | 0 (0.0%) |
| 12:00 PM to 3:59 PM | 17 (8.9%) | 0 (0.0%) |
| 4:00 PM to 11:59 PM | 61 (32.1%) | 23 (12.7%) |
| Total | 190 (100.0%) | 181 (100.0%) |
Housing Occupancy in Fairhope
Occupancy by Ownership in Fairhope
Of the total 590 dwellings in Fairhope, owner-occupied units account for 440 (74.6%), while renter-occupied units make up 150 (25.4%).
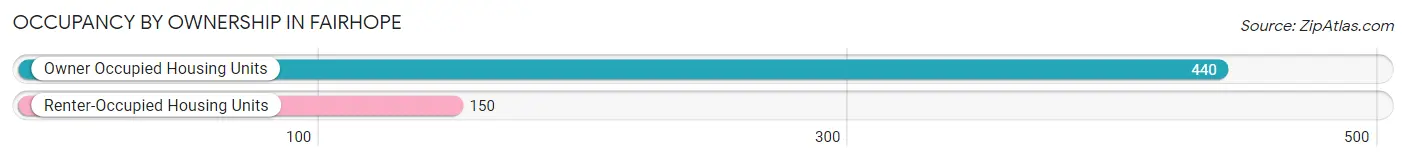
| Occupancy | # Housing Units | % Housing Units |
| Owner Occupied Housing Units | 440 | 74.6% |
| Renter-Occupied Housing Units | 150 | 25.4% |
| Total Occupied Housing Units | 590 | 100.0% |
Occupancy by Household Size in Fairhope
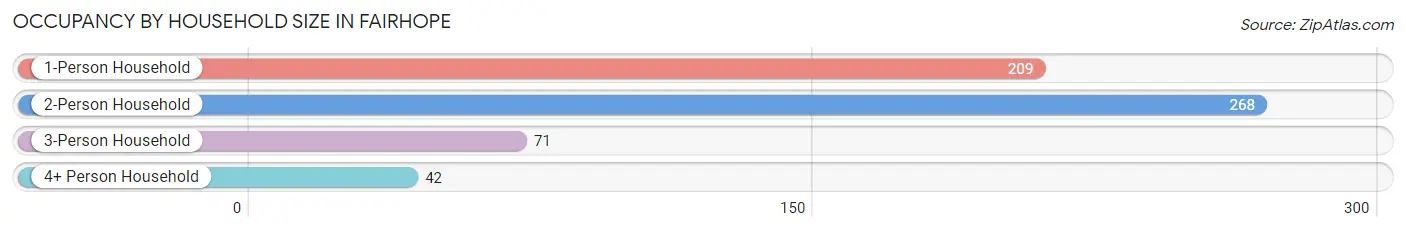
| Household Size | # Housing Units | % Housing Units |
| 1-Person Household | 209 | 35.4% |
| 2-Person Household | 268 | 45.4% |
| 3-Person Household | 71 | 12.0% |
| 4+ Person Household | 42 | 7.1% |
| Total Housing Units | 590 | 100.0% |
Occupancy by Ownership by Household Size in Fairhope
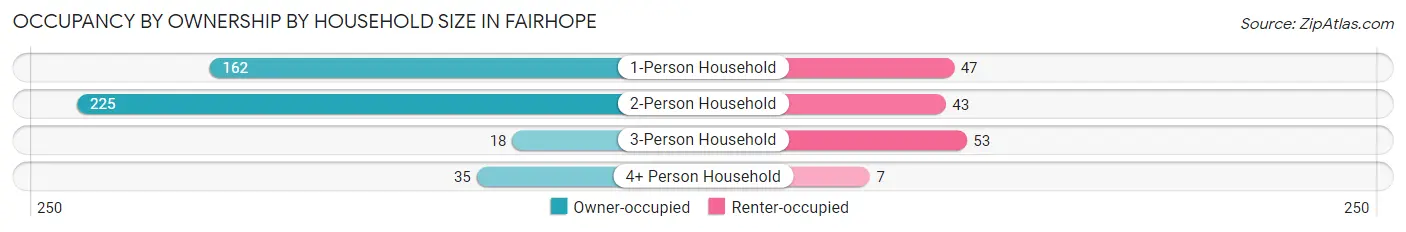
| Household Size | Owner-occupied | Renter-occupied |
| 1-Person Household | 162 (77.5%) | 47 (22.5%) |
| 2-Person Household | 225 (84.0%) | 43 (16.0%) |
| 3-Person Household | 18 (25.4%) | 53 (74.7%) |
| 4+ Person Household | 35 (83.3%) | 7 (16.7%) |
| Total Housing Units | 440 (74.6%) | 150 (25.4%) |
Occupancy by Educational Attainment in Fairhope
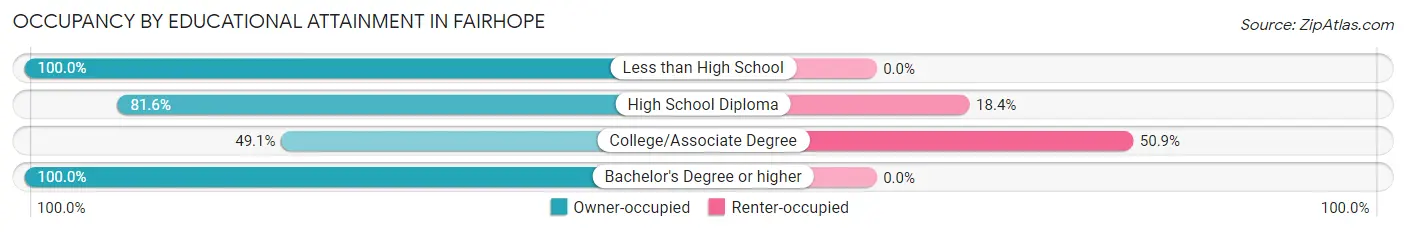
| Household Size | Owner-occupied | Renter-occupied |
| Less than High School | 41 (100.0%) | 0 (0.0%) |
| High School Diploma | 283 (81.6%) | 64 (18.4%) |
| College/Associate Degree | 83 (49.1%) | 86 (50.9%) |
| Bachelor's Degree or higher | 33 (100.0%) | 0 (0.0%) |
Occupancy by Age of Householder in Fairhope
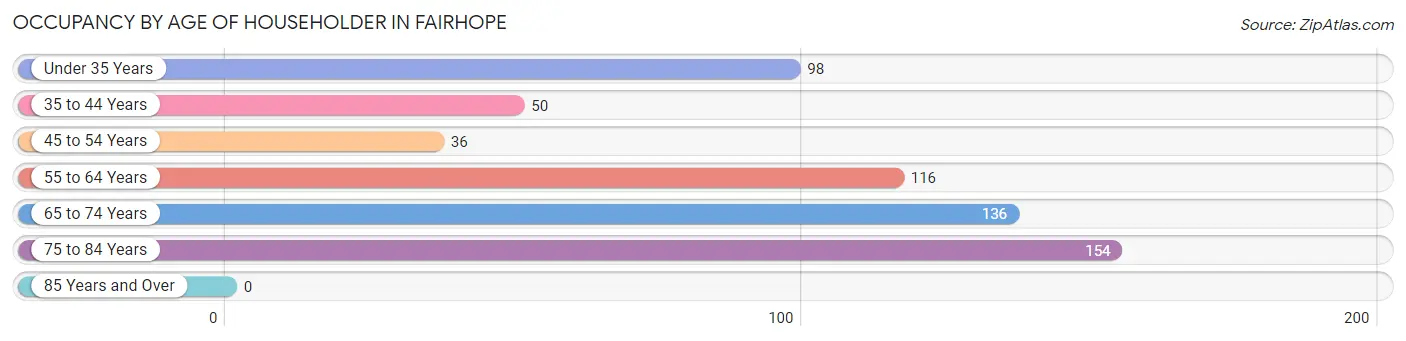
| Age Bracket | # Households | % Households |
| Under 35 Years | 98 | 16.6% |
| 35 to 44 Years | 50 | 8.5% |
| 45 to 54 Years | 36 | 6.1% |
| 55 to 64 Years | 116 | 19.7% |
| 65 to 74 Years | 136 | 23.1% |
| 75 to 84 Years | 154 | 26.1% |
| 85 Years and Over | 0 | 0.0% |
| Total | 590 | 100.0% |
Housing Finances in Fairhope
Median Income by Occupancy in Fairhope
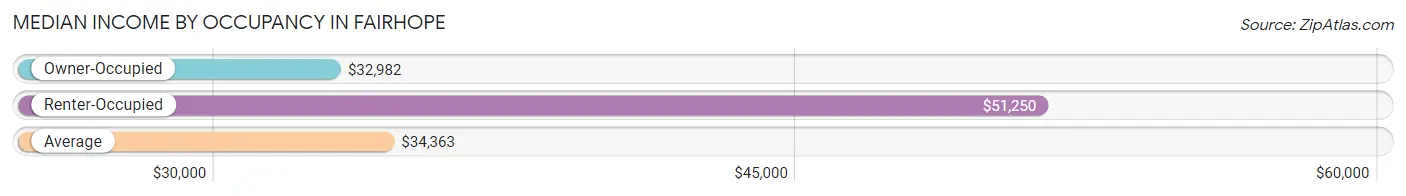
| Occupancy Type | # Households | Median Income |
| Owner-Occupied | 440 (74.6%) | $32,982 |
| Renter-Occupied | 150 (25.4%) | $51,250 |
| Average | 590 (100.0%) | $34,363 |
Occupancy by Householder Income Bracket in Fairhope
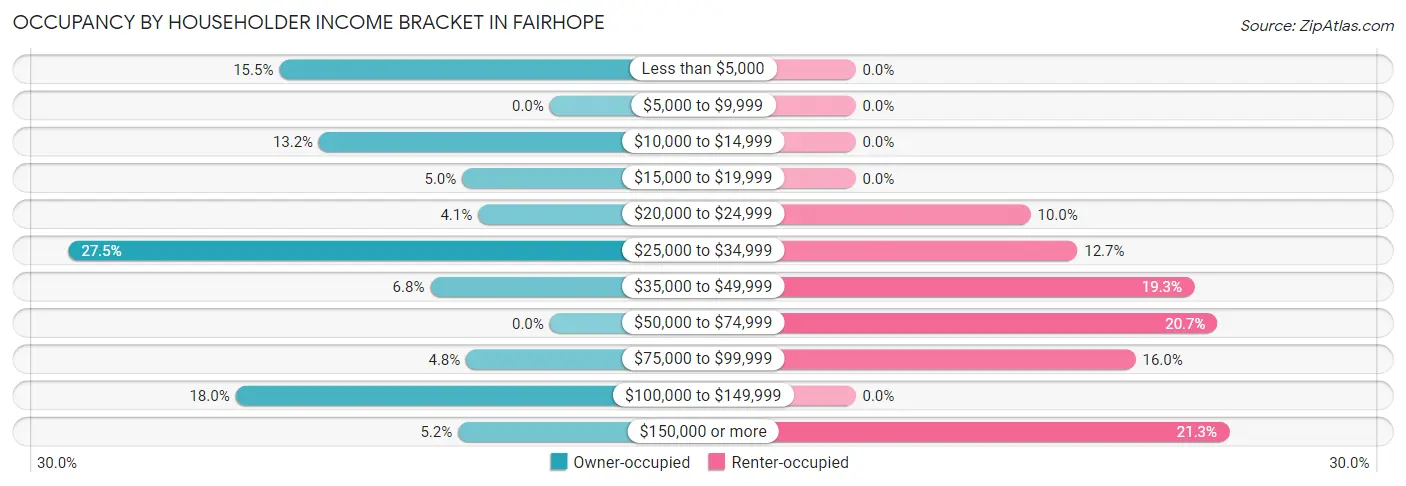
| Income Bracket | Owner-occupied | Renter-occupied |
| Less than $5,000 | 68 (15.4%) | 0 (0.0%) |
| $5,000 to $9,999 | 0 (0.0%) | 0 (0.0%) |
| $10,000 to $14,999 | 58 (13.2%) | 0 (0.0%) |
| $15,000 to $19,999 | 22 (5.0%) | 0 (0.0%) |
| $20,000 to $24,999 | 18 (4.1%) | 15 (10.0%) |
| $25,000 to $34,999 | 121 (27.5%) | 19 (12.7%) |
| $35,000 to $49,999 | 30 (6.8%) | 29 (19.3%) |
| $50,000 to $74,999 | 0 (0.0%) | 31 (20.7%) |
| $75,000 to $99,999 | 21 (4.8%) | 24 (16.0%) |
| $100,000 to $149,999 | 79 (17.9%) | 0 (0.0%) |
| $150,000 or more | 23 (5.2%) | 32 (21.3%) |
| Total | 440 (100.0%) | 150 (100.0%) |
Monthly Housing Cost Tiers in Fairhope
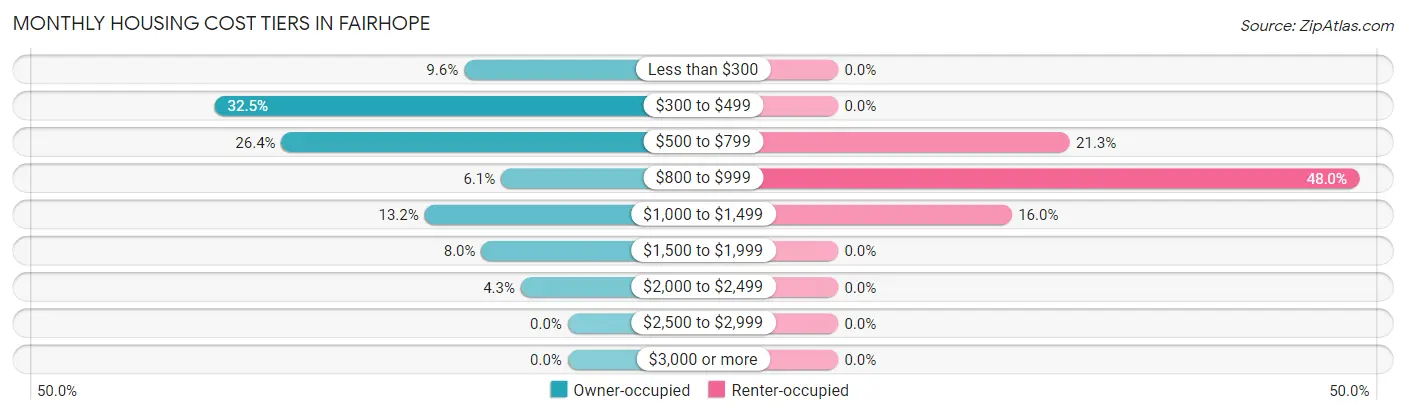
| Monthly Cost | Owner-occupied | Renter-occupied |
| Less than $300 | 42 (9.6%) | 0 (0.0%) |
| $300 to $499 | 143 (32.5%) | 0 (0.0%) |
| $500 to $799 | 116 (26.4%) | 32 (21.3%) |
| $800 to $999 | 27 (6.1%) | 72 (48.0%) |
| $1,000 to $1,499 | 58 (13.2%) | 24 (16.0%) |
| $1,500 to $1,999 | 35 (8.0%) | 0 (0.0%) |
| $2,000 to $2,499 | 19 (4.3%) | 0 (0.0%) |
| $2,500 to $2,999 | 0 (0.0%) | 0 (0.0%) |
| $3,000 or more | 0 (0.0%) | 0 (0.0%) |
| Total | 440 (100.0%) | 150 (100.0%) |
Physical Housing Characteristics in Fairhope
Housing Structures in Fairhope
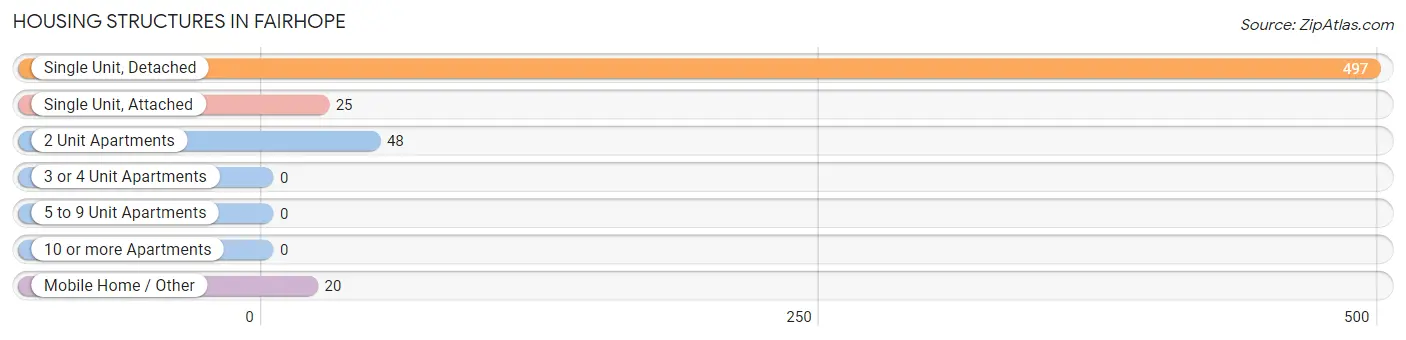
| Structure Type | # Housing Units | % Housing Units |
| Single Unit, Detached | 497 | 84.2% |
| Single Unit, Attached | 25 | 4.2% |
| 2 Unit Apartments | 48 | 8.1% |
| 3 or 4 Unit Apartments | 0 | 0.0% |
| 5 to 9 Unit Apartments | 0 | 0.0% |
| 10 or more Apartments | 0 | 0.0% |
| Mobile Home / Other | 20 | 3.4% |
| Total | 590 | 100.0% |
Housing Structures by Occupancy in Fairhope
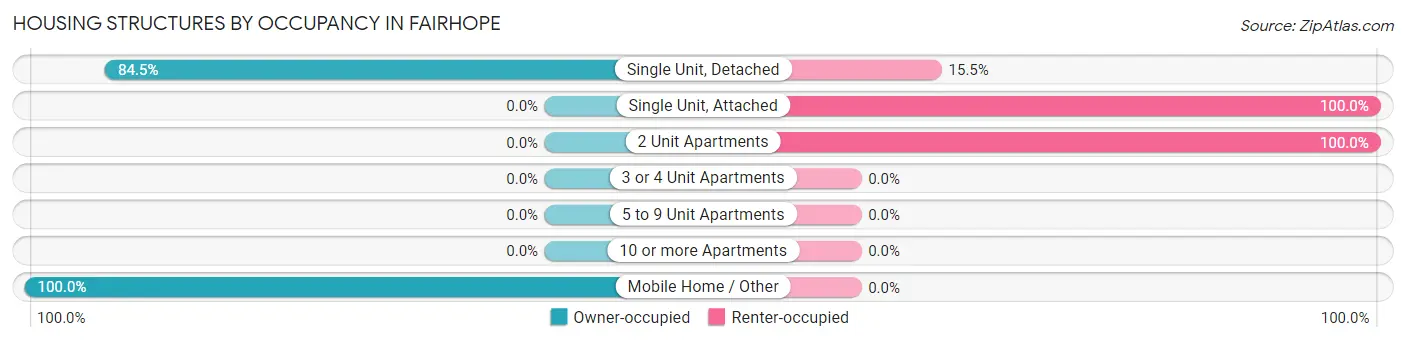
| Structure Type | Owner-occupied | Renter-occupied |
| Single Unit, Detached | 420 (84.5%) | 77 (15.5%) |
| Single Unit, Attached | 0 (0.0%) | 25 (100.0%) |
| 2 Unit Apartments | 0 (0.0%) | 48 (100.0%) |
| 3 or 4 Unit Apartments | 0 (0.0%) | 0 (0.0%) |
| 5 to 9 Unit Apartments | 0 (0.0%) | 0 (0.0%) |
| 10 or more Apartments | 0 (0.0%) | 0 (0.0%) |
| Mobile Home / Other | 20 (100.0%) | 0 (0.0%) |
| Total | 440 (74.6%) | 150 (25.4%) |
Housing Structures by Number of Rooms in Fairhope
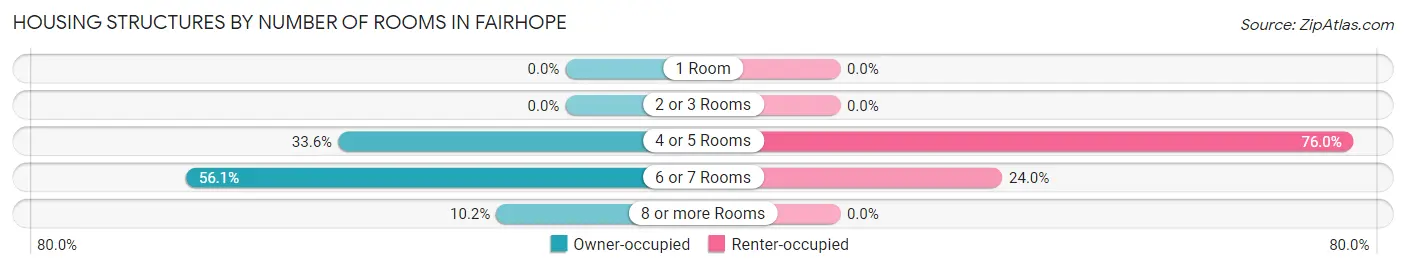
| Number of Rooms | Owner-occupied | Renter-occupied |
| 1 Room | 0 (0.0%) | 0 (0.0%) |
| 2 or 3 Rooms | 0 (0.0%) | 0 (0.0%) |
| 4 or 5 Rooms | 148 (33.6%) | 114 (76.0%) |
| 6 or 7 Rooms | 247 (56.1%) | 36 (24.0%) |
| 8 or more Rooms | 45 (10.2%) | 0 (0.0%) |
| Total | 440 (100.0%) | 150 (100.0%) |
Housing Structure by Heating Type in Fairhope
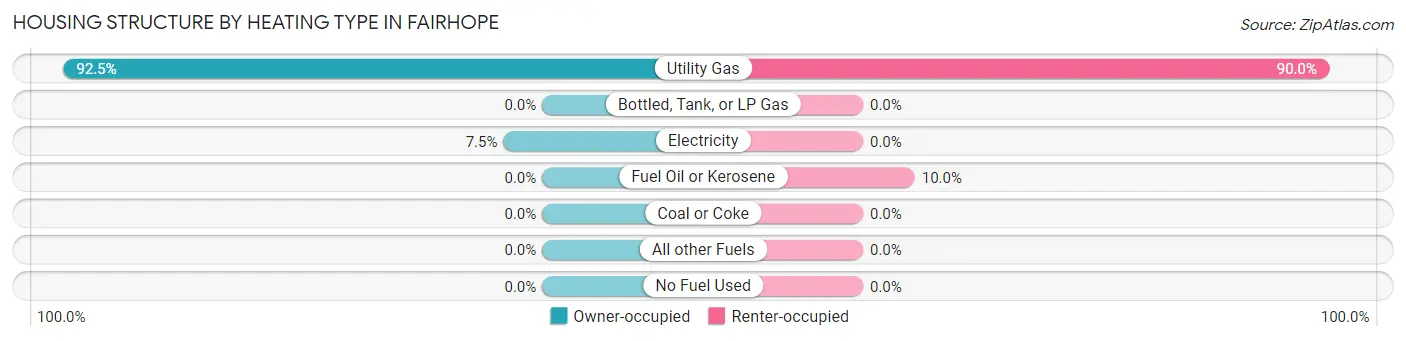
| Heating Type | Owner-occupied | Renter-occupied |
| Utility Gas | 407 (92.5%) | 135 (90.0%) |
| Bottled, Tank, or LP Gas | 0 (0.0%) | 0 (0.0%) |
| Electricity | 33 (7.5%) | 0 (0.0%) |
| Fuel Oil or Kerosene | 0 (0.0%) | 15 (10.0%) |
| Coal or Coke | 0 (0.0%) | 0 (0.0%) |
| All other Fuels | 0 (0.0%) | 0 (0.0%) |
| No Fuel Used | 0 (0.0%) | 0 (0.0%) |
| Total | 440 (100.0%) | 150 (100.0%) |
Household Vehicle Usage in Fairhope
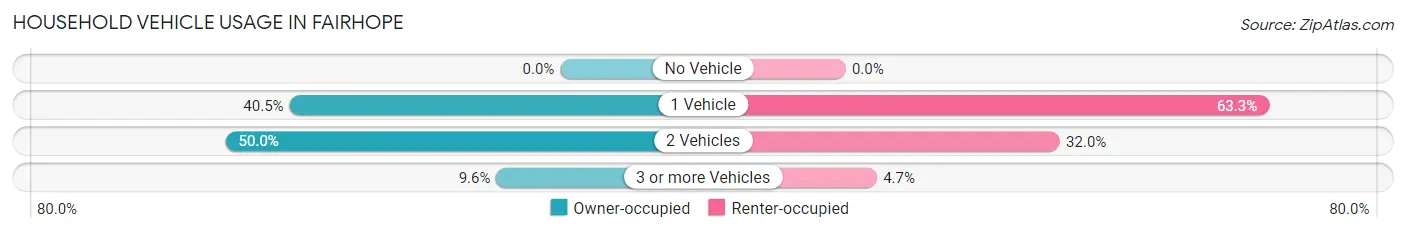
| Vehicles per Household | Owner-occupied | Renter-occupied |
| No Vehicle | 0 (0.0%) | 0 (0.0%) |
| 1 Vehicle | 178 (40.5%) | 95 (63.3%) |
| 2 Vehicles | 220 (50.0%) | 48 (32.0%) |
| 3 or more Vehicles | 42 (9.6%) | 7 (4.7%) |
| Total | 440 (100.0%) | 150 (100.0%) |
Real Estate & Mortgages in Fairhope
Real Estate and Mortgage Overview in Fairhope
| Characteristic | Without Mortgage | With Mortgage |
| Housing Units | 286 | 154 |
| Median Property Value | $109,700 | $124,400 |
| Median Household Income | $28,750 | $23 |
| Monthly Housing Costs | $399 | $0 |
| Real Estate Taxes | $2,159 | $0 |
Property Value by Mortgage Status in Fairhope
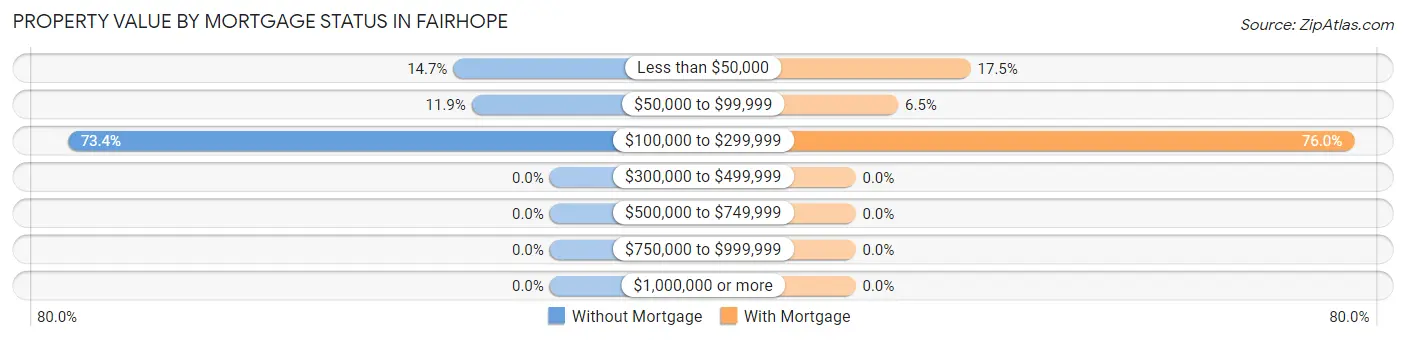
| Property Value | Without Mortgage | With Mortgage |
| Less than $50,000 | 42 (14.7%) | 27 (17.5%) |
| $50,000 to $99,999 | 34 (11.9%) | 10 (6.5%) |
| $100,000 to $299,999 | 210 (73.4%) | 117 (76.0%) |
| $300,000 to $499,999 | 0 (0.0%) | 0 (0.0%) |
| $500,000 to $749,999 | 0 (0.0%) | 0 (0.0%) |
| $750,000 to $999,999 | 0 (0.0%) | 0 (0.0%) |
| $1,000,000 or more | 0 (0.0%) | 0 (0.0%) |
| Total | 286 (100.0%) | 154 (100.0%) |
Household Income by Mortgage Status in Fairhope
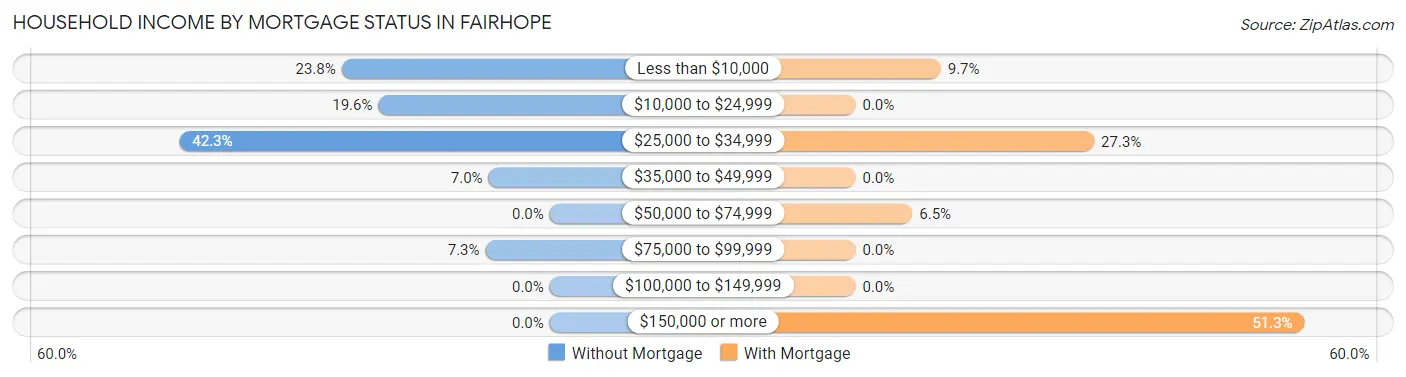
| Household Income | Without Mortgage | With Mortgage |
| Less than $10,000 | 68 (23.8%) | 15 (9.7%) |
| $10,000 to $24,999 | 56 (19.6%) | 0 (0.0%) |
| $25,000 to $34,999 | 121 (42.3%) | 42 (27.3%) |
| $35,000 to $49,999 | 20 (7.0%) | 0 (0.0%) |
| $50,000 to $74,999 | 0 (0.0%) | 10 (6.5%) |
| $75,000 to $99,999 | 21 (7.3%) | 0 (0.0%) |
| $100,000 to $149,999 | 0 (0.0%) | 0 (0.0%) |
| $150,000 or more | 0 (0.0%) | 79 (51.3%) |
| Total | 286 (100.0%) | 154 (100.0%) |
Property Value to Household Income Ratio in Fairhope
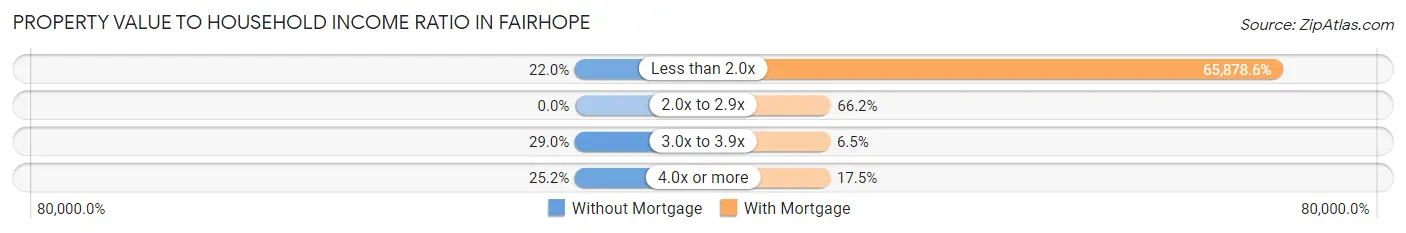
| Value-to-Income Ratio | Without Mortgage | With Mortgage |
| Less than 2.0x | 63 (22.0%) | 101,453 (65,878.6%) |
| 2.0x to 2.9x | 0 (0.0%) | 102 (66.2%) |
| 3.0x to 3.9x | 83 (29.0%) | 10 (6.5%) |
| 4.0x or more | 72 (25.2%) | 27 (17.5%) |
| Total | 286 (100.0%) | 154 (100.0%) |
Real Estate Taxes by Mortgage Status in Fairhope
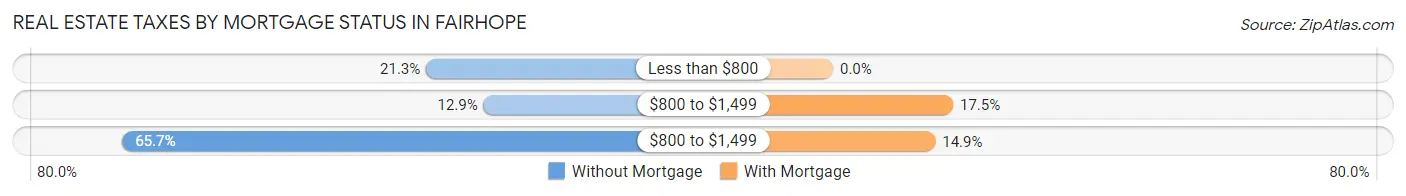
| Property Taxes | Without Mortgage | With Mortgage |
| Less than $800 | 61 (21.3%) | 0 (0.0%) |
| $800 to $1,499 | 37 (12.9%) | 27 (17.5%) |
| $800 to $1,499 | 188 (65.7%) | 23 (14.9%) |
| Total | 286 (100.0%) | 154 (100.0%) |
Health & Disability in Fairhope
Health Insurance Coverage by Age in Fairhope
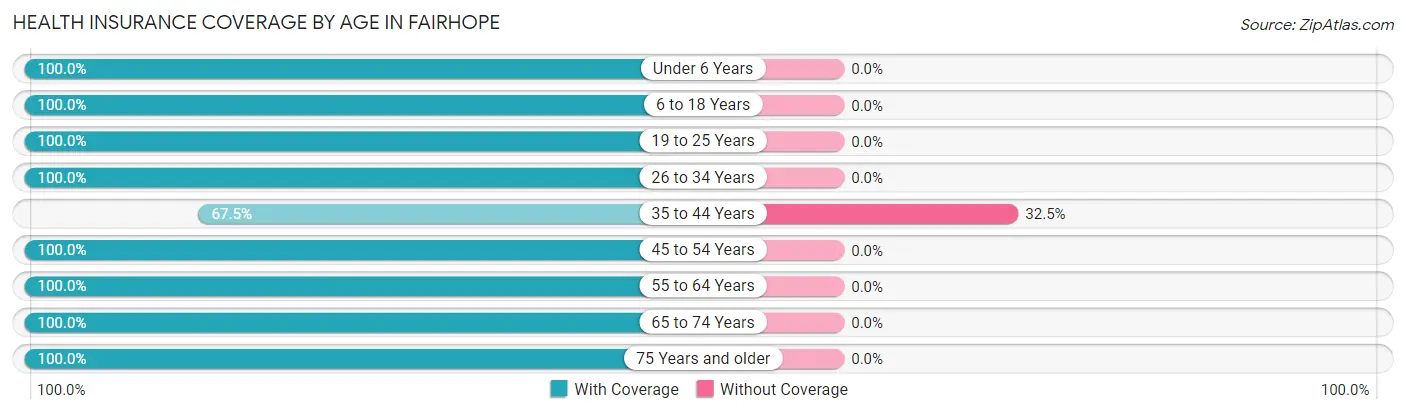
| Age Bracket | With Coverage | Without Coverage |
| Under 6 Years | 55 (100.0%) | 0 (0.0%) |
| 6 to 18 Years | 110 (100.0%) | 0 (0.0%) |
| 19 to 25 Years | 50 (100.0%) | 0 (0.0%) |
| 26 to 34 Years | 140 (100.0%) | 0 (0.0%) |
| 35 to 44 Years | 52 (67.5%) | 25 (32.5%) |
| 45 to 54 Years | 178 (100.0%) | 0 (0.0%) |
| 55 to 64 Years | 155 (100.0%) | 0 (0.0%) |
| 65 to 74 Years | 248 (100.0%) | 0 (0.0%) |
| 75 Years and older | 174 (100.0%) | 0 (0.0%) |
| Total | 1,162 (97.9%) | 25 (2.1%) |
Health Insurance Coverage by Citizenship Status in Fairhope
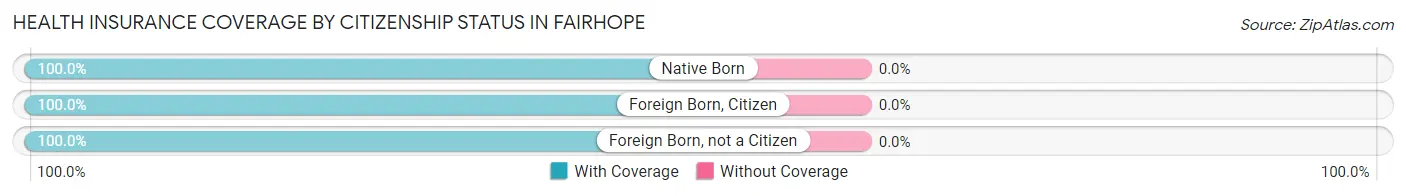
| Citizenship Status | With Coverage | Without Coverage |
| Native Born | 55 (100.0%) | 0 (0.0%) |
| Foreign Born, Citizen | 110 (100.0%) | 0 (0.0%) |
| Foreign Born, not a Citizen | 50 (100.0%) | 0 (0.0%) |
Health Insurance Coverage by Household Income in Fairhope
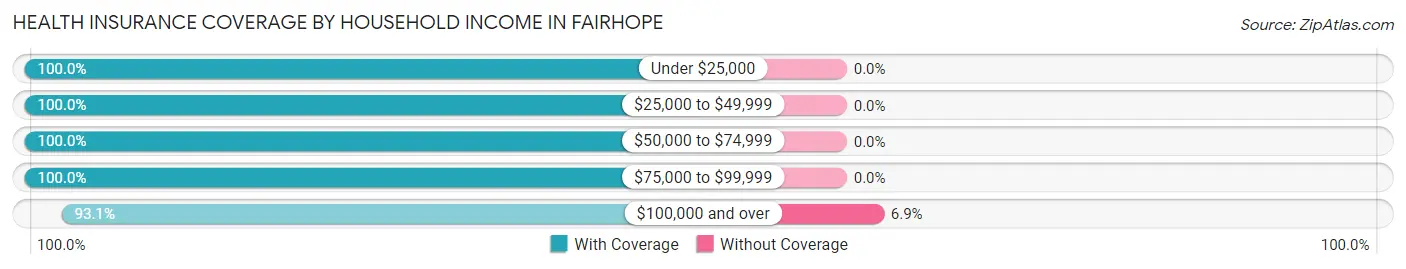
| Household Income | With Coverage | Without Coverage |
| Under $25,000 | 216 (100.0%) | 0 (0.0%) |
| $25,000 to $49,999 | 444 (100.0%) | 0 (0.0%) |
| $50,000 to $74,999 | 79 (100.0%) | 0 (0.0%) |
| $75,000 to $99,999 | 88 (100.0%) | 0 (0.0%) |
| $100,000 and over | 335 (93.1%) | 25 (6.9%) |
Public vs Private Health Insurance Coverage by Age in Fairhope
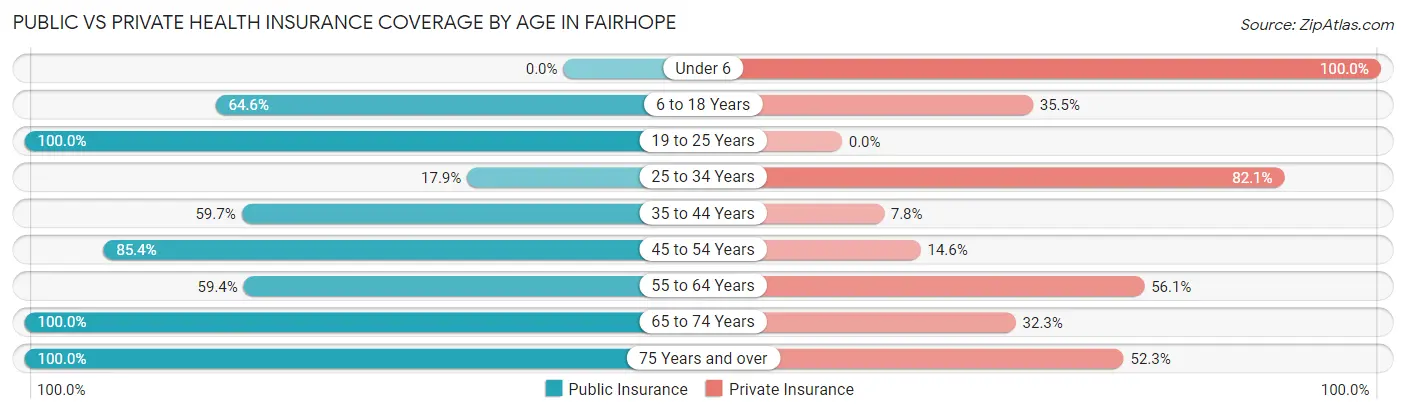
| Age Bracket | Public Insurance | Private Insurance |
| Under 6 | 0 (0.0%) | 55 (100.0%) |
| 6 to 18 Years | 71 (64.5%) | 39 (35.4%) |
| 19 to 25 Years | 50 (100.0%) | 0 (0.0%) |
| 25 to 34 Years | 25 (17.9%) | 115 (82.1%) |
| 35 to 44 Years | 46 (59.7%) | 6 (7.8%) |
| 45 to 54 Years | 152 (85.4%) | 26 (14.6%) |
| 55 to 64 Years | 92 (59.4%) | 87 (56.1%) |
| 65 to 74 Years | 248 (100.0%) | 80 (32.3%) |
| 75 Years and over | 174 (100.0%) | 91 (52.3%) |
| Total | 858 (72.3%) | 499 (42.0%) |
Disability Status by Sex by Age in Fairhope
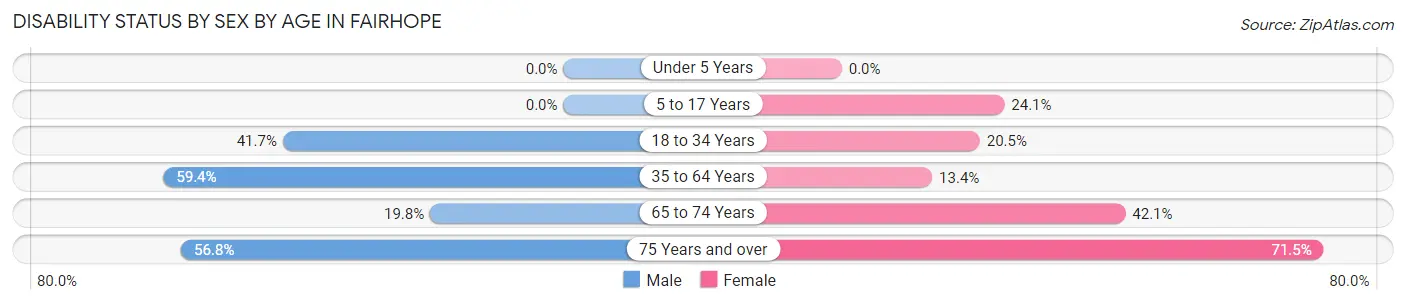
| Age Bracket | Male | Female |
| Under 5 Years | 0 (0.0%) | 0 (0.0%) |
| 5 to 17 Years | 0 (0.0%) | 14 (24.1%) |
| 18 to 34 Years | 45 (41.7%) | 25 (20.5%) |
| 35 to 64 Years | 155 (59.4%) | 20 (13.4%) |
| 65 to 74 Years | 19 (19.8%) | 64 (42.1%) |
| 75 Years and over | 21 (56.8%) | 98 (71.5%) |
Disability Class by Sex by Age in Fairhope
Disability Class: Hearing Difficulty
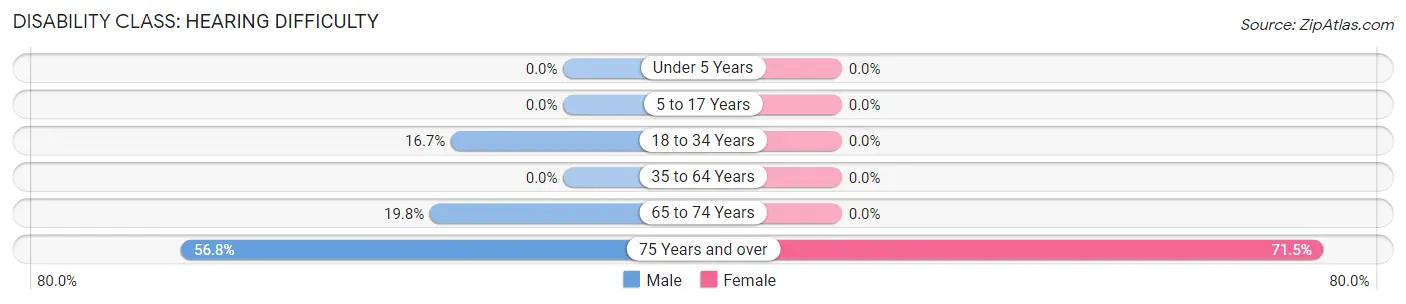
| Age Bracket | Male | Female |
| Under 5 Years | 0 (0.0%) | 0 (0.0%) |
| 5 to 17 Years | 0 (0.0%) | 0 (0.0%) |
| 18 to 34 Years | 18 (16.7%) | 0 (0.0%) |
| 35 to 64 Years | 0 (0.0%) | 0 (0.0%) |
| 65 to 74 Years | 19 (19.8%) | 0 (0.0%) |
| 75 Years and over | 21 (56.8%) | 98 (71.5%) |
Disability Class: Vision Difficulty
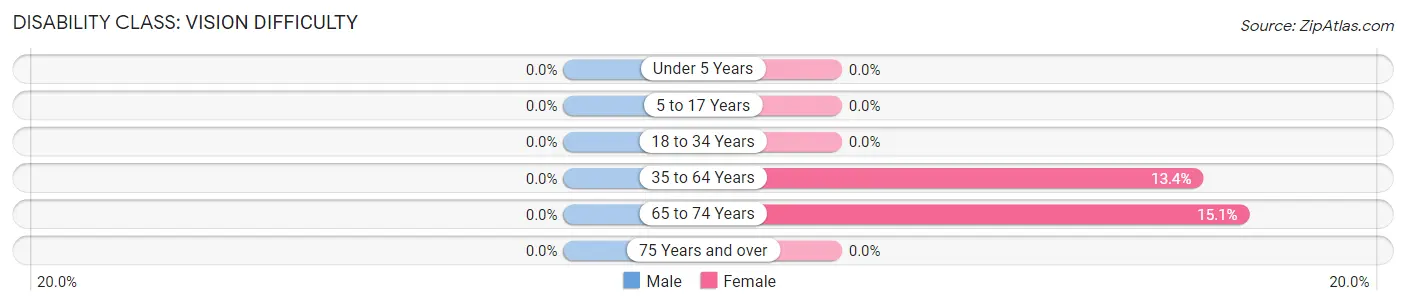
| Age Bracket | Male | Female |
| Under 5 Years | 0 (0.0%) | 0 (0.0%) |
| 5 to 17 Years | 0 (0.0%) | 0 (0.0%) |
| 18 to 34 Years | 0 (0.0%) | 0 (0.0%) |
| 35 to 64 Years | 0 (0.0%) | 20 (13.4%) |
| 65 to 74 Years | 0 (0.0%) | 23 (15.1%) |
| 75 Years and over | 0 (0.0%) | 0 (0.0%) |
Disability Class: Cognitive Difficulty
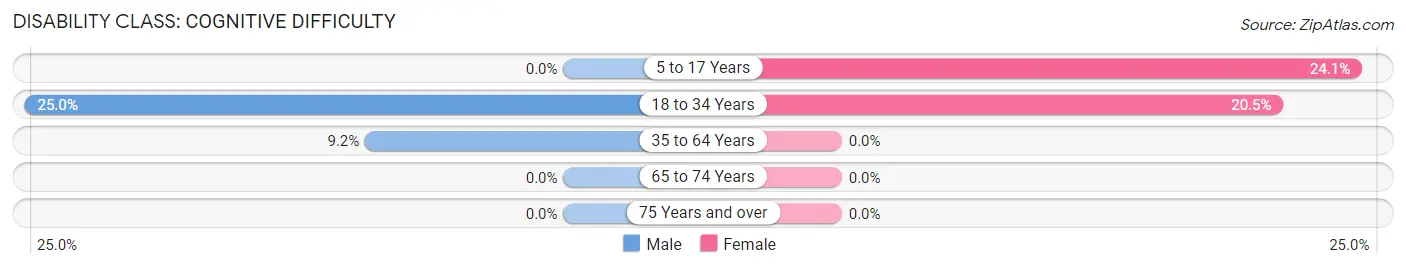
| Age Bracket | Male | Female |
| 5 to 17 Years | 0 (0.0%) | 14 (24.1%) |
| 18 to 34 Years | 27 (25.0%) | 25 (20.5%) |
| 35 to 64 Years | 24 (9.2%) | 0 (0.0%) |
| 65 to 74 Years | 0 (0.0%) | 0 (0.0%) |
| 75 Years and over | 0 (0.0%) | 0 (0.0%) |
Disability Class: Ambulatory Difficulty
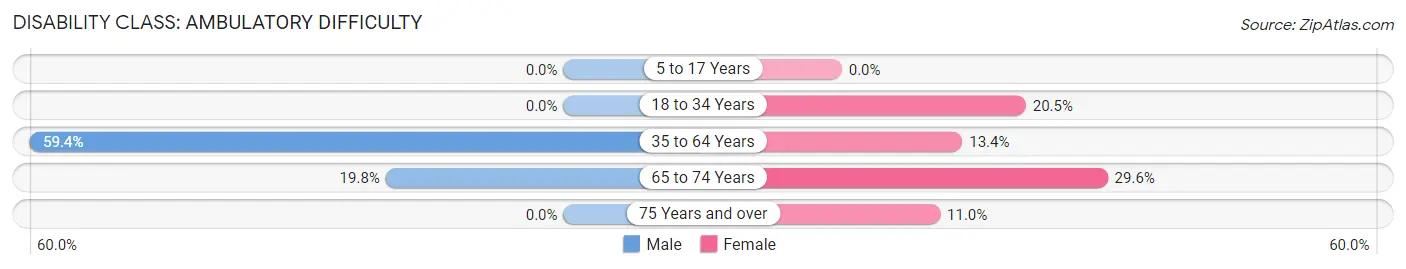
| Age Bracket | Male | Female |
| 5 to 17 Years | 0 (0.0%) | 0 (0.0%) |
| 18 to 34 Years | 0 (0.0%) | 25 (20.5%) |
| 35 to 64 Years | 155 (59.4%) | 20 (13.4%) |
| 65 to 74 Years | 19 (19.8%) | 45 (29.6%) |
| 75 Years and over | 0 (0.0%) | 15 (11.0%) |
Disability Class: Self-Care Difficulty
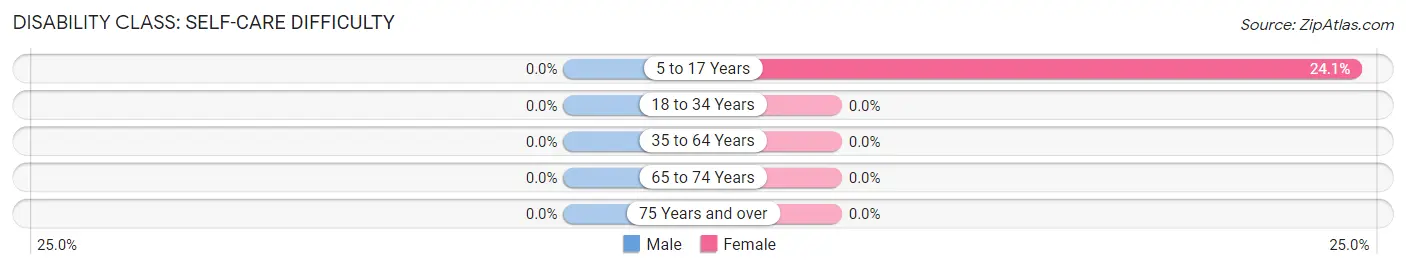
| Age Bracket | Male | Female |
| 5 to 17 Years | 0 (0.0%) | 14 (24.1%) |
| 18 to 34 Years | 0 (0.0%) | 0 (0.0%) |
| 35 to 64 Years | 0 (0.0%) | 0 (0.0%) |
| 65 to 74 Years | 0 (0.0%) | 0 (0.0%) |
| 75 Years and over | 0 (0.0%) | 0 (0.0%) |
Technology Access in Fairhope
Computing Device Access in Fairhope
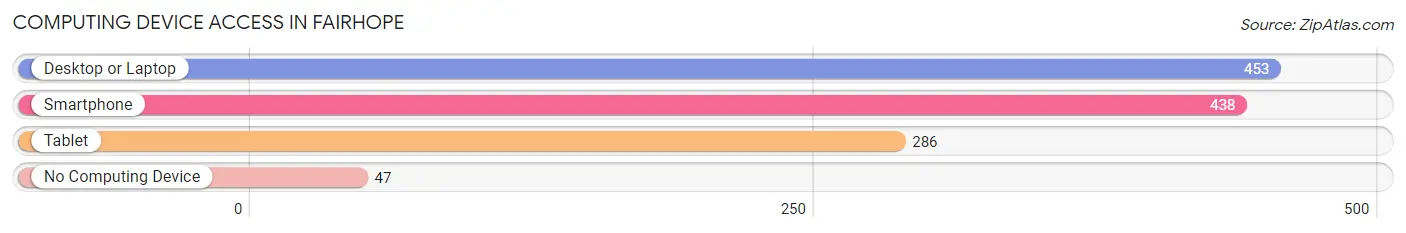
| Device Type | # Households | % Households |
| Desktop or Laptop | 453 | 76.8% |
| Smartphone | 438 | 74.2% |
| Tablet | 286 | 48.5% |
| No Computing Device | 47 | 8.0% |
| Total | 590 | 100.0% |
Internet Access in Fairhope
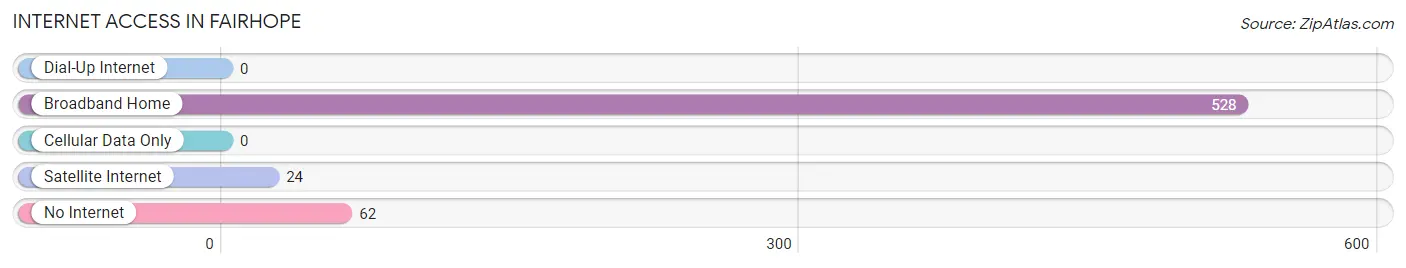
| Internet Type | # Households | % Households |
| Dial-Up Internet | 0 | 0.0% |
| Broadband Home | 528 | 89.5% |
| Cellular Data Only | 0 | 0.0% |
| Satellite Internet | 24 | 4.1% |
| No Internet | 62 | 10.5% |
| Total | 590 | 100.0% |
Fairhope Summary
Fairhope, Pennsylvania is a small borough located in the heart of Bucks County, Pennsylvania. It is situated on the banks of the Delaware River, just north of Philadelphia. The borough is home to a population of just over 1,000 people, making it one of the smallest boroughs in the state.
History
Fairhope was first settled in the late 1700s by a group of Quakers from England. The Quakers were attracted to the area due to its fertile soil and abundant natural resources. The Quakers named the area Fairhope, which means “good hope” in their native language.
The Quakers established a small farming community in the area and built a meetinghouse in 1790. The meetinghouse served as a place of worship and a center of community life. The Quakers also built a school and a store in the area.
In the early 1800s, the Quakers began to move away from the area, and the population of Fairhope began to decline. In 1854, the borough was officially incorporated.
Geography
Fairhope is located in the southeastern corner of Bucks County, Pennsylvania. It is situated on the banks of the Delaware River, just north of Philadelphia. The borough is bordered by the boroughs of Bristol and Morrisville to the north, and by the townships of Falls and Middletown to the south.
The borough covers an area of 0.7 square miles, all of which is land. The terrain is mostly flat, with some rolling hills in the northern part of the borough. The climate is humid continental, with hot summers and cold winters.
Economy
The economy of Fairhope is largely based on agriculture and tourism. The borough is home to several farms, which produce a variety of crops, including corn, soybeans, and hay. The farms also raise livestock, such as cows, pigs, and chickens.
The borough is also home to several small businesses, including restaurants, shops, and a bed and breakfast. The borough is also home to a small airport, which serves as a hub for private and corporate aircraft.
Demographics
As of the 2010 census, the population of Fairhope was 1,072. The racial makeup of the borough was 94.3% White, 2.2% African American, 0.3% Native American, 0.7% Asian, 0.1% Pacific Islander, and 2.4% from other races. Hispanic or Latino of any race were 3.2% of the population.
The median household income in Fairhope was $50,938, and the median family income was $60,938. The per capita income was $25,938. About 8.3% of families and 10.2% of the population were below the poverty line, including 14.3% of those under age 18 and 5.2% of those age 65 or over.
The population of Fairhope is largely made up of families, with the majority of households consisting of married couples with children. The borough is also home to a large number of retirees, as well as a growing number of young professionals. The borough is served by the Pennridge School District.
Common Questions
What is Per Capita Income in Fairhope?
Per Capita income in Fairhope is $28,419.
What is the Median Family Income in Fairhope?
Median Family Income in Fairhope is $45,388.
What is the Median Household income in Fairhope?
Median Household Income in Fairhope is $34,363.
What is Income or Wage Gap in Fairhope?
Income or Wage Gap in Fairhope is 20.5%.
Women in Fairhope earn 79.5 cents for every dollar earned by a man.
What is Inequality or Gini Index in Fairhope?
Inequality or Gini Index in Fairhope is 0.50.
What is the Total Population of Fairhope?
Total Population of Fairhope is 1,187.
What is the Total Male Population of Fairhope?
Total Male Population of Fairhope is 531.
What is the Total Female Population of Fairhope?
Total Female Population of Fairhope is 656.
What is the Ratio of Males per 100 Females in Fairhope?
There are 80.95 Males per 100 Females in Fairhope.
What is the Ratio of Females per 100 Males in Fairhope?
There are 123.54 Females per 100 Males in Fairhope.
What is the Median Population Age in Fairhope?
Median Population Age in Fairhope is 51.8 Years.
What is the Average Family Size in Fairhope
Average Family Size in Fairhope is 2.6 People.
What is the Average Household Size in Fairhope
Average Household Size in Fairhope is 2.0 People.
How Large is the Labor Force in Fairhope?
There are 437 People in the Labor Forcein in Fairhope.
What is the Percentage of People in the Labor Force in Fairhope?
39.7% of People are in the Labor Force in Fairhope.
What is the Unemployment Rate in Fairhope?
Unemployment Rate in Fairhope is 4.8%.