Fredericksburg CDP Crawford County, PA Map & Demographics
Fredericksburg CDP Crawford County Overview
$27,270
PER CAPITA INCOME
$47,083
AVG FAMILY INCOME
$47,113
AVG HOUSEHOLD INCOME
11.8%
WAGE / INCOME GAP [ % ]
88.2¢/ $1
WAGE / INCOME GAP [ $ ]
0.41
INEQUALITY / GINI INDEX
1,035
TOTAL POPULATION
515
MALE POPULATION
520
FEMALE POPULATION
99.04
MALES / 100 FEMALES
100.97
FEMALES / 100 MALES
40.1
MEDIAN AGE
3.4
AVG FAMILY SIZE
2.7
AVG HOUSEHOLD SIZE
449
LABOR FORCE [ PEOPLE ]
59.6%
PERCENT IN LABOR FORCE
Income in Fredericksburg CDP Crawford County
Income Overview in Fredericksburg CDP Crawford County
Per Capita Income in Fredericksburg CDP Crawford County is $27,270, while median incomes of families and households are $47,083 and $47,113 respectively.
| Characteristic | Number | Measure |
| Per Capita Income | 1,035 | $27,270 |
| Median Family Income | 240 | $47,083 |
| Mean Family Income | 240 | $57,530 |
| Median Household Income | 387 | $47,113 |
| Mean Household Income | 387 | $63,253 |
| Income Deficit | 240 | $0 |
| Wage / Income Gap (%) | 1,035 | 11.79% |
| Wage / Income Gap ($) | 1,035 | 88.21¢ per $1 |
| Gini / Inequality Index | 1,035 | 0.41 |
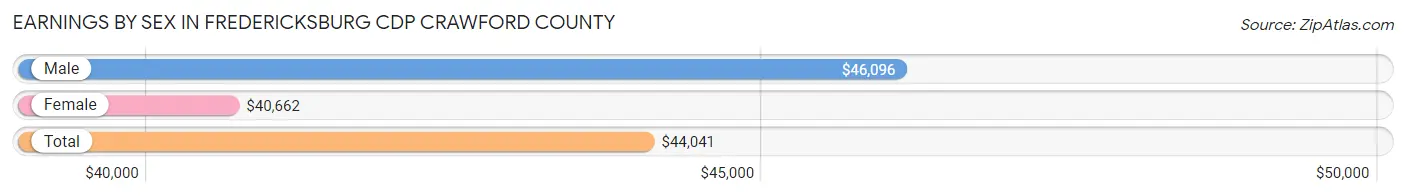
Earnings by Sex in Fredericksburg CDP Crawford County
Average Earnings in Fredericksburg CDP Crawford County are $44,041, $46,096 for men and $40,662 for women, a difference of 11.8%.
| Sex | Number | Average Earnings |
| Male | 270 (55.2%) | $46,096 |
| Female | 219 (44.8%) | $40,662 |
| Total | 489 (100.0%) | $44,041 |
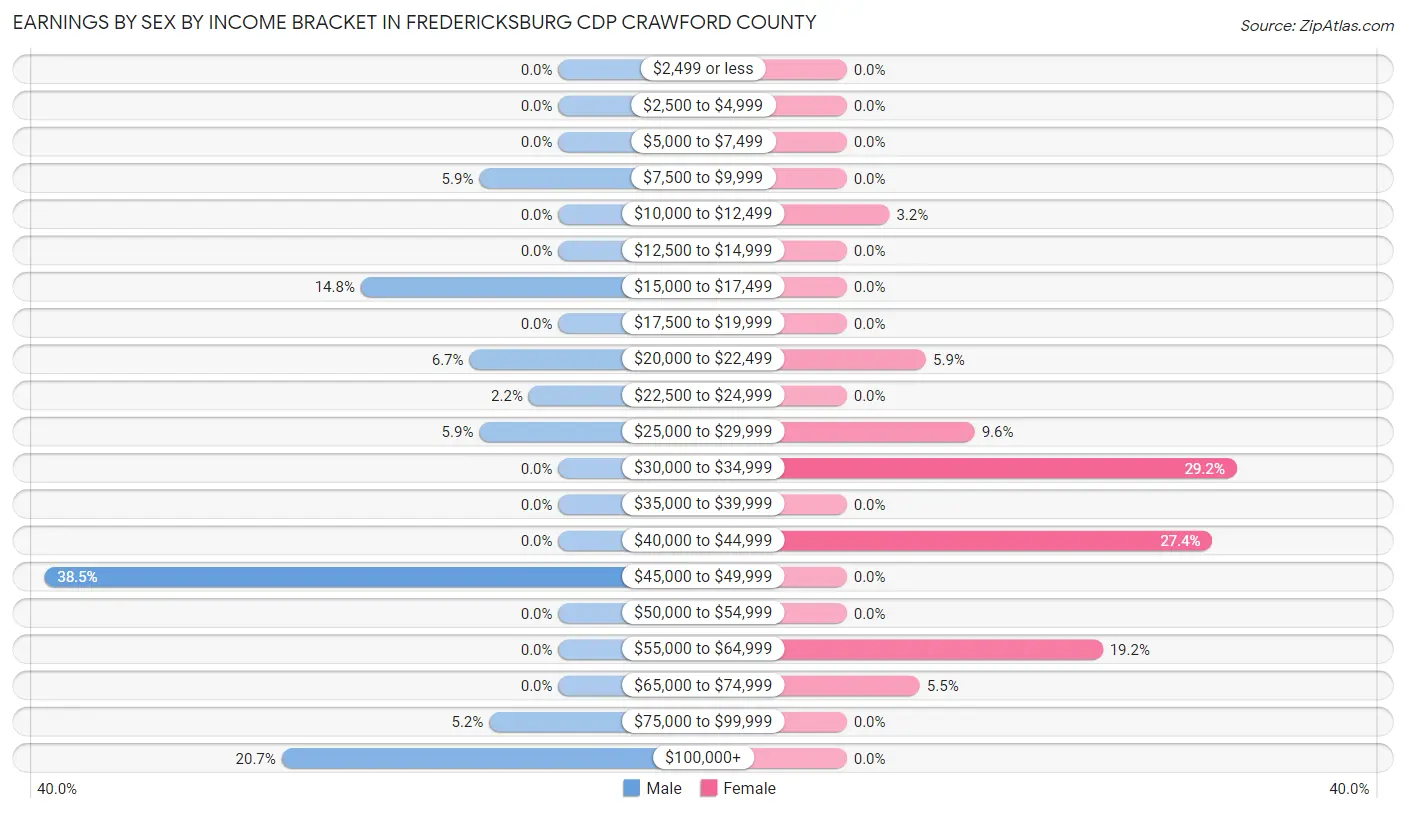
Earnings by Sex by Income Bracket in Fredericksburg CDP Crawford County
The most common earnings brackets in Fredericksburg CDP Crawford County are $45,000 to $49,999 for men (104 | 38.5%) and $30,000 to $34,999 for women (64 | 29.2%).
| Income | Male | Female |
| $2,499 or less | 0 (0.0%) | 0 (0.0%) |
| $2,500 to $4,999 | 0 (0.0%) | 0 (0.0%) |
| $5,000 to $7,499 | 0 (0.0%) | 0 (0.0%) |
| $7,500 to $9,999 | 16 (5.9%) | 0 (0.0%) |
| $10,000 to $12,499 | 0 (0.0%) | 7 (3.2%) |
| $12,500 to $14,999 | 0 (0.0%) | 0 (0.0%) |
| $15,000 to $17,499 | 40 (14.8%) | 0 (0.0%) |
| $17,500 to $19,999 | 0 (0.0%) | 0 (0.0%) |
| $20,000 to $22,499 | 18 (6.7%) | 13 (5.9%) |
| $22,500 to $24,999 | 6 (2.2%) | 0 (0.0%) |
| $25,000 to $29,999 | 16 (5.9%) | 21 (9.6%) |
| $30,000 to $34,999 | 0 (0.0%) | 64 (29.2%) |
| $35,000 to $39,999 | 0 (0.0%) | 0 (0.0%) |
| $40,000 to $44,999 | 0 (0.0%) | 60 (27.4%) |
| $45,000 to $49,999 | 104 (38.5%) | 0 (0.0%) |
| $50,000 to $54,999 | 0 (0.0%) | 0 (0.0%) |
| $55,000 to $64,999 | 0 (0.0%) | 42 (19.2%) |
| $65,000 to $74,999 | 0 (0.0%) | 12 (5.5%) |
| $75,000 to $99,999 | 14 (5.2%) | 0 (0.0%) |
| $100,000+ | 56 (20.7%) | 0 (0.0%) |
| Total | 270 (100.0%) | 219 (100.0%) |
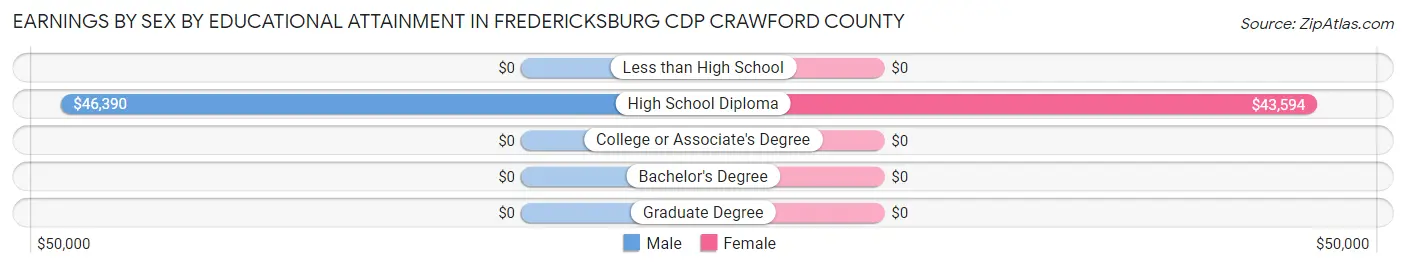
Earnings by Sex by Educational Attainment in Fredericksburg CDP Crawford County
Average earnings in Fredericksburg CDP Crawford County are $46,573 for men and $40,662 for women, a difference of 12.7%. Men with an educational attainment of high school diploma enjoy the highest average annual earnings of $46,390, while those with high school diploma education earn the least with $46,390. Women with an educational attainment of high school diploma earn the most with the average annual earnings of $43,594, while those with high school diploma education have the smallest earnings of $43,594.
| Educational Attainment | Male Income | Female Income |
| Less than High School | - | - |
| High School Diploma | $46,390 | $43,594 |
| College or Associate's Degree | - | - |
| Bachelor's Degree | - | - |
| Graduate Degree | - | - |
| Total | $46,573 | $40,662 |
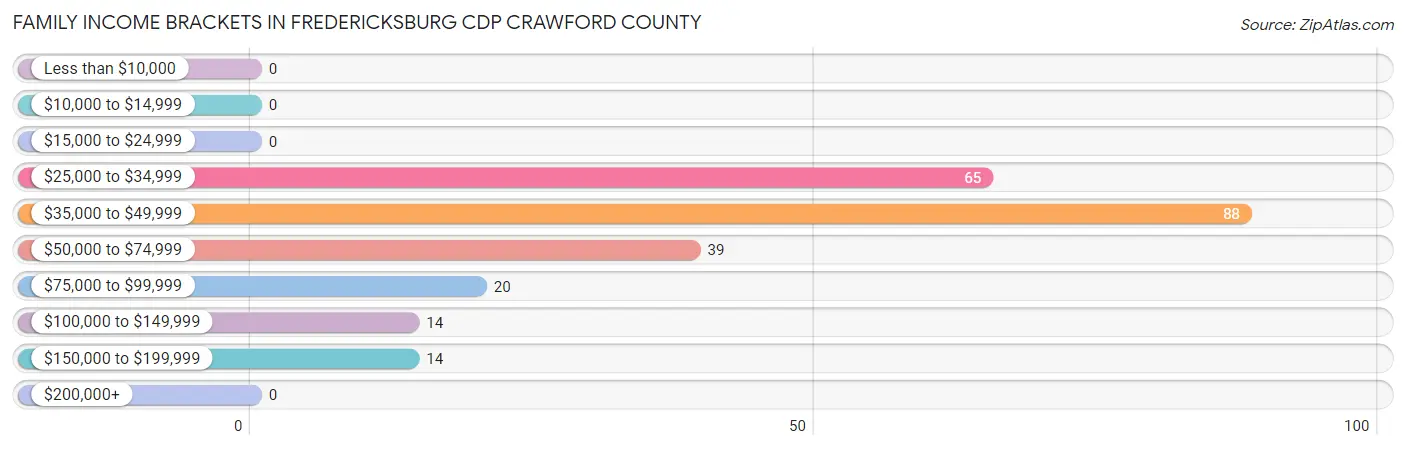
Family Income in Fredericksburg CDP Crawford County
Family Income Brackets in Fredericksburg CDP Crawford County
According to the Fredericksburg CDP Crawford County family income data, there are 88 families falling into the $35,000 to $49,999 income range, which is the most common income bracket and makes up 36.7% of all families.
| Income Bracket | # Families | % Families |
| Less than $10,000 | 0 | 0.0% |
| $10,000 to $14,999 | 0 | 0.0% |
| $15,000 to $24,999 | 0 | 0.0% |
| $25,000 to $34,999 | 65 | 27.1% |
| $35,000 to $49,999 | 88 | 36.7% |
| $50,000 to $74,999 | 39 | 16.3% |
| $75,000 to $99,999 | 20 | 8.3% |
| $100,000 to $149,999 | 14 | 5.8% |
| $150,000 to $199,999 | 14 | 5.8% |
| $200,000+ | 0 | 0.0% |
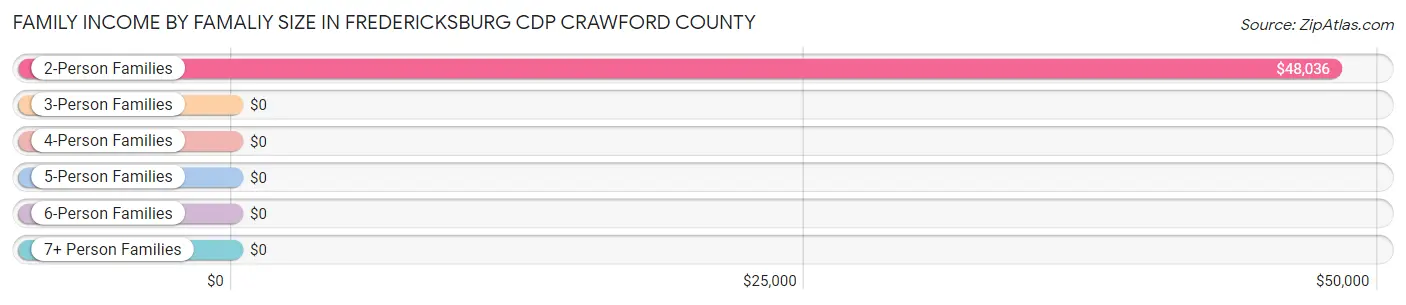
Family Income by Famaliy Size in Fredericksburg CDP Crawford County
2-person families (85 | 35.4%) account for the highest median family income in Fredericksburg CDP Crawford County with $48,036 per family, while 2-person families (85 | 35.4%) have the highest median income of $24,018 per family member.
| Income Bracket | # Families | Median Income |
| 2-Person Families | 85 (35.4%) | $48,036 |
| 3-Person Families | 72 (30.0%) | $0 |
| 4-Person Families | 22 (9.2%) | $0 |
| 5-Person Families | 61 (25.4%) | $0 |
| 6-Person Families | 0 (0.0%) | $0 |
| 7+ Person Families | 0 (0.0%) | $0 |
| Total | 240 (100.0%) | $47,083 |
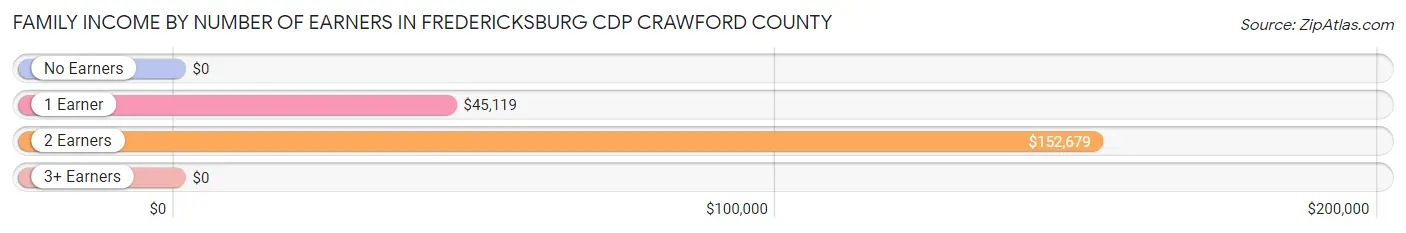
Family Income by Number of Earners in Fredericksburg CDP Crawford County
| Number of Earners | # Families | Median Income |
| No Earners | 26 (10.8%) | $0 |
| 1 Earner | 174 (72.5%) | $45,119 |
| 2 Earners | 26 (10.8%) | $152,679 |
| 3+ Earners | 14 (5.8%) | $0 |
| Total | 240 (100.0%) | $47,083 |
Household Income in Fredericksburg CDP Crawford County
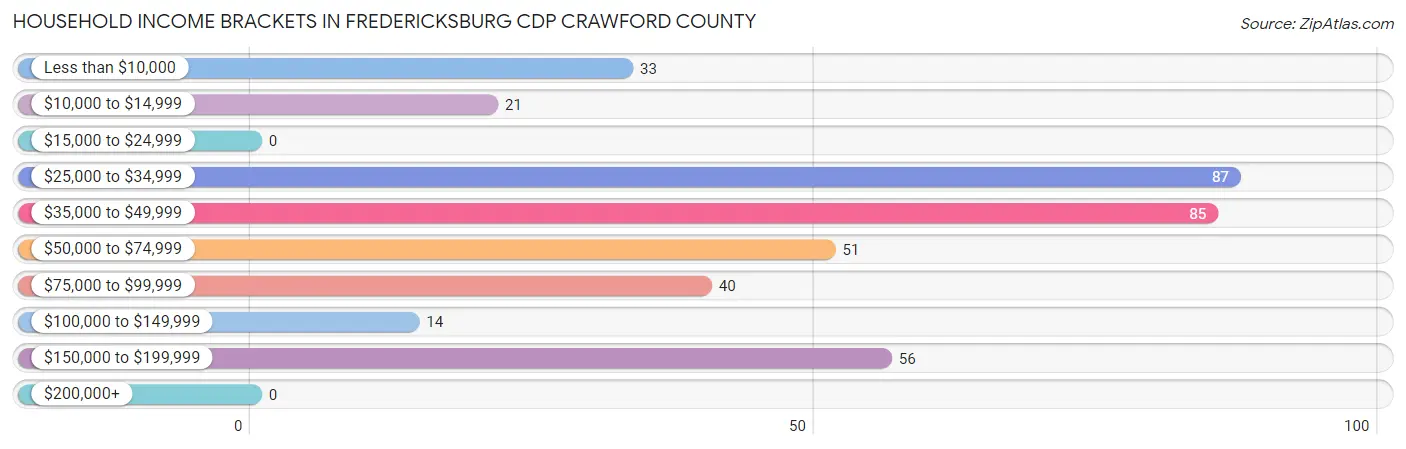
Household Income Brackets in Fredericksburg CDP Crawford County
With 87 households falling in the category, the $25,000 to $34,999 income range is the most frequent in Fredericksburg CDP Crawford County, accounting for 22.5% of all households.
| Income Bracket | # Households | % Households |
| Less than $10,000 | 33 | 8.5% |
| $10,000 to $14,999 | 21 | 5.4% |
| $15,000 to $24,999 | 0 | 0.0% |
| $25,000 to $34,999 | 87 | 22.5% |
| $35,000 to $49,999 | 85 | 22.0% |
| $50,000 to $74,999 | 51 | 13.2% |
| $75,000 to $99,999 | 40 | 10.3% |
| $100,000 to $149,999 | 14 | 3.6% |
| $150,000 to $199,999 | 56 | 14.5% |
| $200,000+ | 0 | 0.0% |
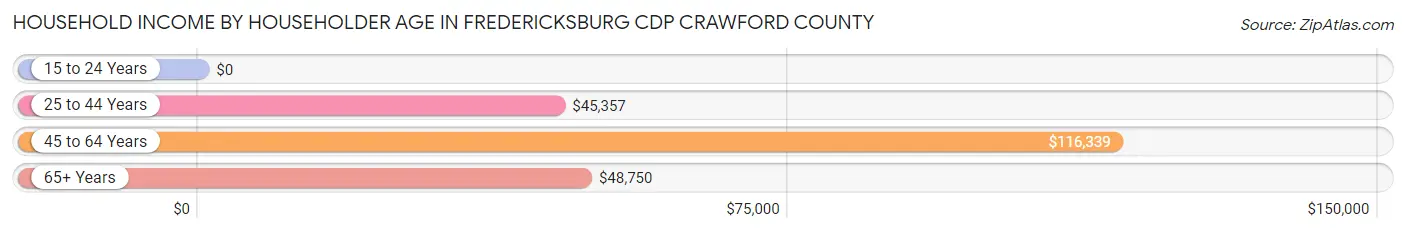
Household Income by Householder Age in Fredericksburg CDP Crawford County
The median household income in Fredericksburg CDP Crawford County is $47,113, with the highest median household income of $116,339 found in the 45 to 64 years age bracket for the primary householder. A total of 125 households (32.3%) fall into this category. Meanwhile, the 15 to 24 years age bracket for the primary householder has the lowest median household income of $0, with 16 households (4.1%) in this group.
| Income Bracket | # Households | Median Income |
| 15 to 24 Years | 16 (4.1%) | $0 |
| 25 to 44 Years | 142 (36.7%) | $45,357 |
| 45 to 64 Years | 125 (32.3%) | $116,339 |
| 65+ Years | 104 (26.9%) | $48,750 |
| Total | 387 (100.0%) | $47,113 |
Poverty in Fredericksburg CDP Crawford County
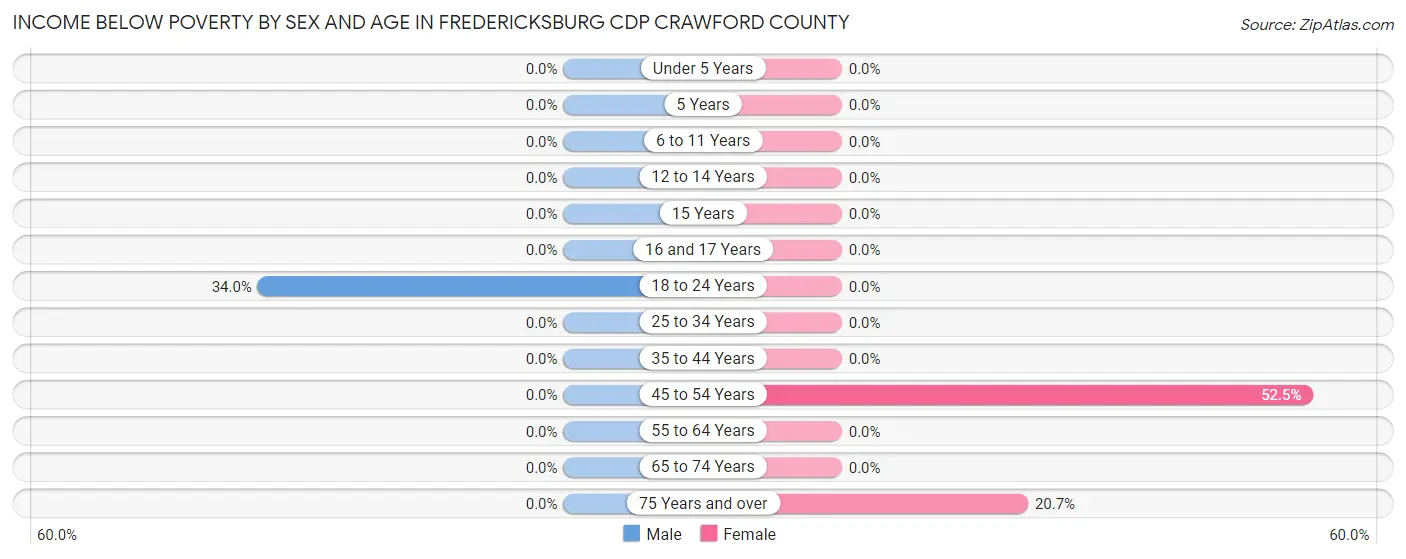
Income Below Poverty by Sex and Age in Fredericksburg CDP Crawford County
With 3.1% poverty level for males and 7.3% for females among the residents of Fredericksburg CDP Crawford County, 18 to 24 year old males and 45 to 54 year old females are the most vulnerable to poverty, with 16 males (34.0%) and 21 females (52.5%) in their respective age groups living below the poverty level.
| Age Bracket | Male | Female |
| Under 5 Years | 0 (0.0%) | 0 (0.0%) |
| 5 Years | 0 (0.0%) | 0 (0.0%) |
| 6 to 11 Years | 0 (0.0%) | 0 (0.0%) |
| 12 to 14 Years | 0 (0.0%) | 0 (0.0%) |
| 15 Years | 0 (0.0%) | 0 (0.0%) |
| 16 and 17 Years | 0 (0.0%) | 0 (0.0%) |
| 18 to 24 Years | 16 (34.0%) | 0 (0.0%) |
| 25 to 34 Years | 0 (0.0%) | 0 (0.0%) |
| 35 to 44 Years | 0 (0.0%) | 0 (0.0%) |
| 45 to 54 Years | 0 (0.0%) | 21 (52.5%) |
| 55 to 64 Years | 0 (0.0%) | 0 (0.0%) |
| 65 to 74 Years | 0 (0.0%) | 0 (0.0%) |
| 75 Years and over | 0 (0.0%) | 17 (20.7%) |
| Total | 16 (3.1%) | 38 (7.3%) |
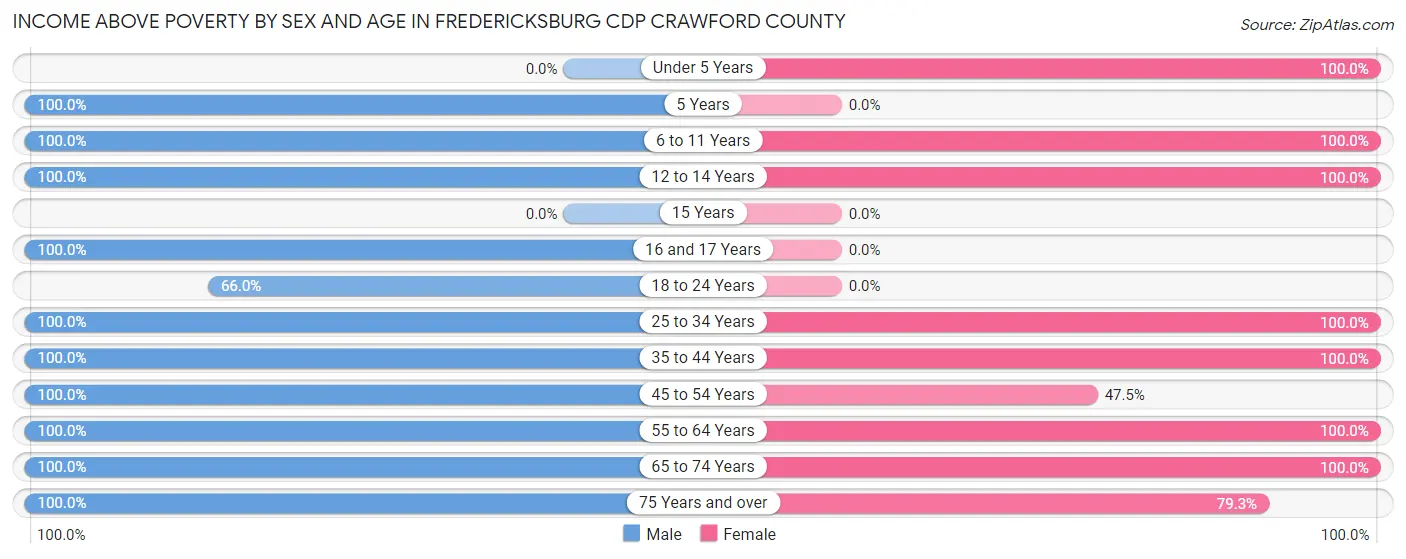
Income Above Poverty by Sex and Age in Fredericksburg CDP Crawford County
According to the poverty statistics in Fredericksburg CDP Crawford County, males aged 5 years and females aged under 5 years are the age groups that are most secure financially, with 100.0% of males and 100.0% of females in these age groups living above the poverty line.
| Age Bracket | Male | Female |
| Under 5 Years | 0 (0.0%) | 37 (100.0%) |
| 5 Years | 15 (100.0%) | 0 (0.0%) |
| 6 to 11 Years | 114 (100.0%) | 72 (100.0%) |
| 12 to 14 Years | 37 (100.0%) | 7 (100.0%) |
| 15 Years | 0 (0.0%) | 0 (0.0%) |
| 16 and 17 Years | 24 (100.0%) | 0 (0.0%) |
| 18 to 24 Years | 31 (66.0%) | 0 (0.0%) |
| 25 to 34 Years | 16 (100.0%) | 45 (100.0%) |
| 35 to 44 Years | 42 (100.0%) | 116 (100.0%) |
| 45 to 54 Years | 61 (100.0%) | 19 (47.5%) |
| 55 to 64 Years | 56 (100.0%) | 85 (100.0%) |
| 65 to 74 Years | 21 (100.0%) | 36 (100.0%) |
| 75 Years and over | 82 (100.0%) | 65 (79.3%) |
| Total | 499 (96.9%) | 482 (92.7%) |
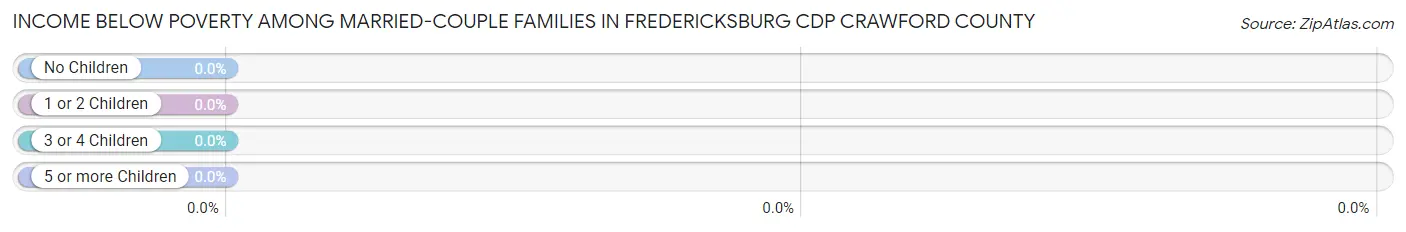
Income Below Poverty Among Married-Couple Families in Fredericksburg CDP Crawford County
| Children | Above Poverty | Below Poverty |
| No Children | 72 (100.0%) | 0 (0.0%) |
| 1 or 2 Children | 22 (100.0%) | 0 (0.0%) |
| 3 or 4 Children | 42 (100.0%) | 0 (0.0%) |
| 5 or more Children | 0 (0.0%) | 0 (0.0%) |
| Total | 136 (100.0%) | 0 (0.0%) |
Income Below Poverty Among Single-Parent Households in Fredericksburg CDP Crawford County
| Children | Single Father | Single Mother |
| No Children | 0 (0.0%) | 0 (0.0%) |
| 1 or 2 Children | 0 (0.0%) | 0 (0.0%) |
| 3 or 4 Children | 0 (0.0%) | 0 (0.0%) |
| 5 or more Children | 0 (0.0%) | 0 (0.0%) |
| Total | 0 (0.0%) | 0 (0.0%) |
Income Below Poverty Among Married-Couple vs Single-Parent Households in Fredericksburg CDP Crawford County
| Children | Married-Couple Families | Single-Parent Households |
| No Children | 0 (0.0%) | 0 (0.0%) |
| 1 or 2 Children | 0 (0.0%) | 0 (0.0%) |
| 3 or 4 Children | 0 (0.0%) | 0 (0.0%) |
| 5 or more Children | 0 (0.0%) | 0 (0.0%) |
| Total | 0 (0.0%) | 0 (0.0%) |
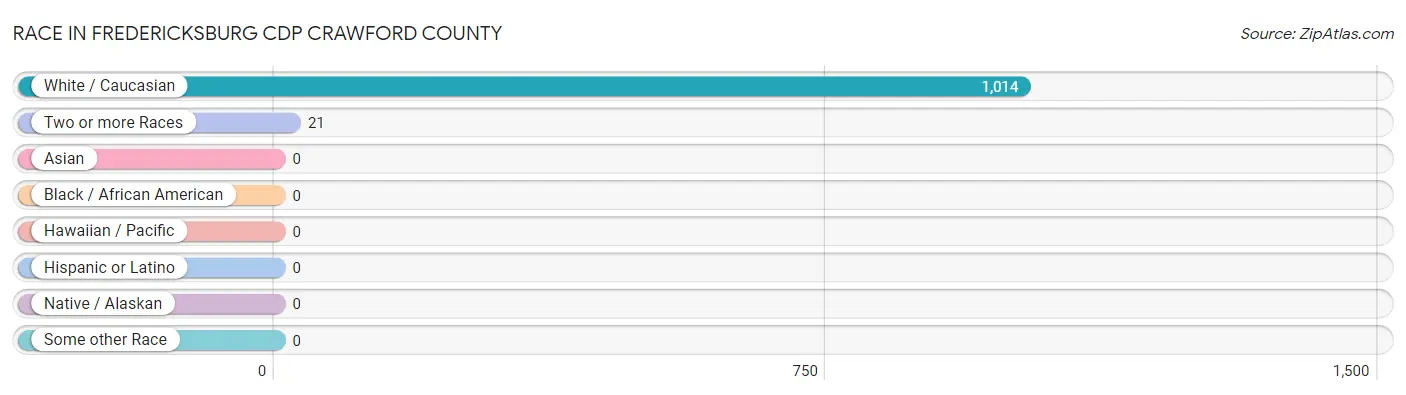
Race in Fredericksburg CDP Crawford County
The most populous races in Fredericksburg CDP Crawford County are White / Caucasian (1,014 | 98.0%), and Two or more Races (21 | 2.0%).
| Race | # Population | % Population |
| Asian | 0 | 0.0% |
| Black / African American | 0 | 0.0% |
| Hawaiian / Pacific | 0 | 0.0% |
| Hispanic or Latino | 0 | 0.0% |
| Native / Alaskan | 0 | 0.0% |
| White / Caucasian | 1,014 | 98.0% |
| Two or more Races | 21 | 2.0% |
| Some other Race | 0 | 0.0% |
| Total | 1,035 | 100.0% |
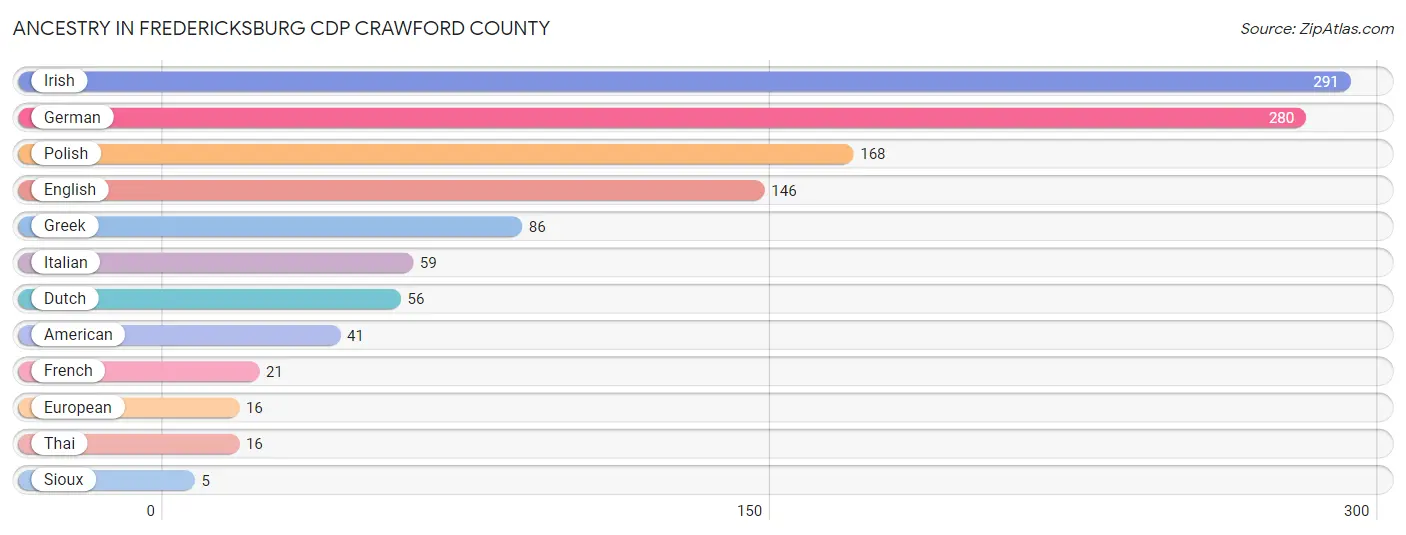
Ancestry in Fredericksburg CDP Crawford County
The most populous ancestries reported in Fredericksburg CDP Crawford County are Irish (291 | 28.1%), German (280 | 27.1%), Polish (168 | 16.2%), English (146 | 14.1%), and Greek (86 | 8.3%), together accounting for 93.8% of all Fredericksburg CDP Crawford County residents.
| Ancestry | # Population | % Population |
| American | 41 | 4.0% |
| Dutch | 56 | 5.4% |
| English | 146 | 14.1% |
| European | 16 | 1.5% |
| French | 21 | 2.0% |
| German | 280 | 27.1% |
| Greek | 86 | 8.3% |
| Irish | 291 | 28.1% |
| Italian | 59 | 5.7% |
| Polish | 168 | 16.2% |
| Sioux | 5 | 0.5% |
| Thai | 16 | 1.5% | View All 12 Rows |
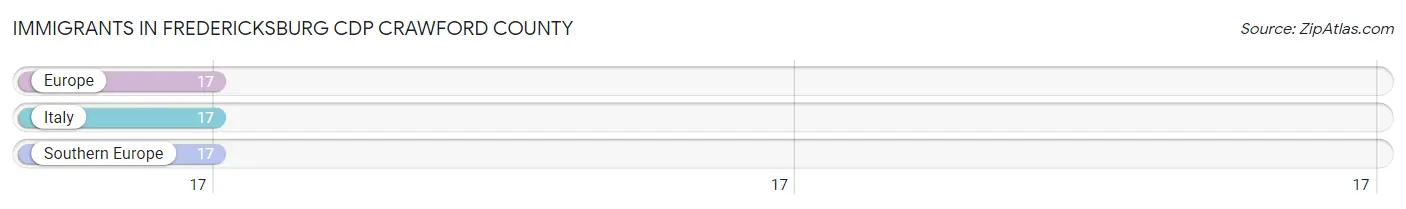
Immigrants in Fredericksburg CDP Crawford County
The most numerous immigrant groups reported in Fredericksburg CDP Crawford County came from Europe (17 | 1.6%), Italy (17 | 1.6%), and Southern Europe (17 | 1.6%), together accounting for 4.9% of all Fredericksburg CDP Crawford County residents.
| Immigration Origin | # Population | % Population |
| Europe | 17 | 1.6% |
| Italy | 17 | 1.6% |
| Southern Europe | 17 | 1.6% | View All 3 Rows |
Sex and Age in Fredericksburg CDP Crawford County
Sex and Age in Fredericksburg CDP Crawford County
The most populous age groups in Fredericksburg CDP Crawford County are 10 to 14 Years (115 | 22.3%) for men and 60 to 64 Years (68 | 13.1%) for women.
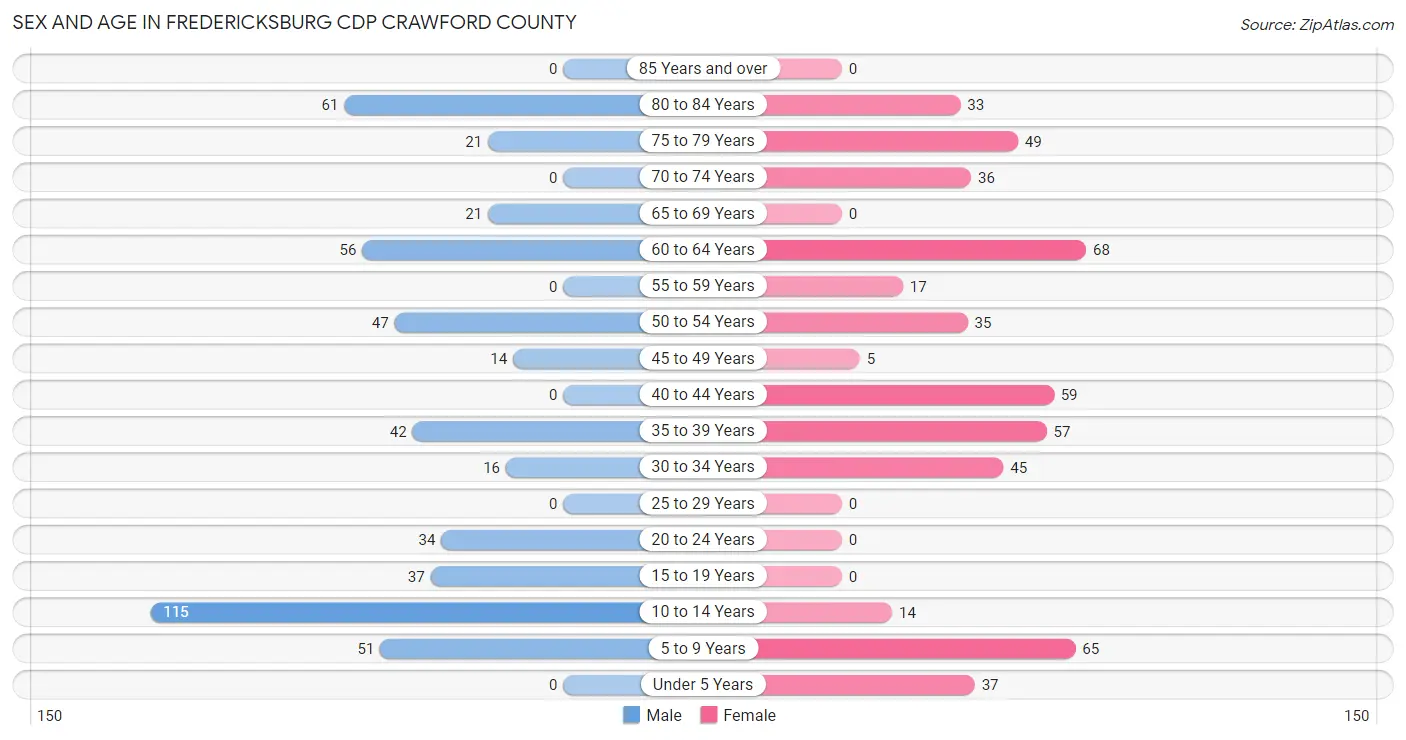
| Age Bracket | Male | Female |
| Under 5 Years | 0 (0.0%) | 37 (7.1%) |
| 5 to 9 Years | 51 (9.9%) | 65 (12.5%) |
| 10 to 14 Years | 115 (22.3%) | 14 (2.7%) |
| 15 to 19 Years | 37 (7.2%) | 0 (0.0%) |
| 20 to 24 Years | 34 (6.6%) | 0 (0.0%) |
| 25 to 29 Years | 0 (0.0%) | 0 (0.0%) |
| 30 to 34 Years | 16 (3.1%) | 45 (8.6%) |
| 35 to 39 Years | 42 (8.2%) | 57 (11.0%) |
| 40 to 44 Years | 0 (0.0%) | 59 (11.4%) |
| 45 to 49 Years | 14 (2.7%) | 5 (1.0%) |
| 50 to 54 Years | 47 (9.1%) | 35 (6.7%) |
| 55 to 59 Years | 0 (0.0%) | 17 (3.3%) |
| 60 to 64 Years | 56 (10.9%) | 68 (13.1%) |
| 65 to 69 Years | 21 (4.1%) | 0 (0.0%) |
| 70 to 74 Years | 0 (0.0%) | 36 (6.9%) |
| 75 to 79 Years | 21 (4.1%) | 49 (9.4%) |
| 80 to 84 Years | 61 (11.8%) | 33 (6.4%) |
| 85 Years and over | 0 (0.0%) | 0 (0.0%) |
| Total | 515 (100.0%) | 520 (100.0%) |
Families and Households in Fredericksburg CDP Crawford County
Median Family Size in Fredericksburg CDP Crawford County
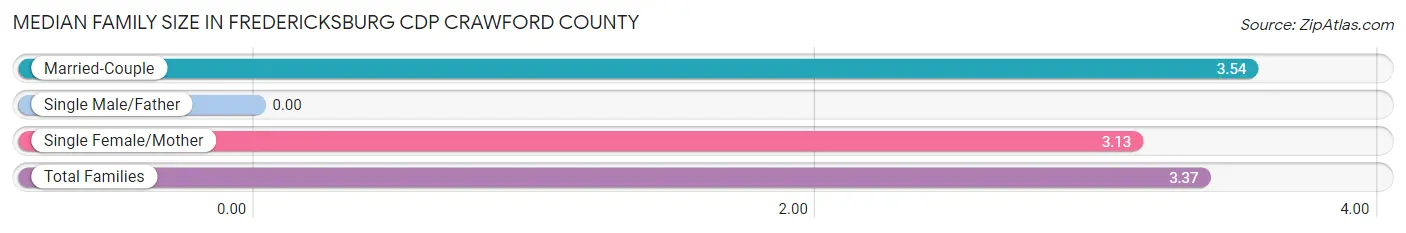
| Family Type | # Families | Family Size |
| Married-Couple | 136 (56.7%) | 3.54 |
| Single Male/Father | 0 (0.0%) | - |
| Single Female/Mother | 104 (43.3%) | 3.13 |
| Total Families | 240 (100.0%) | 3.37 |
Median Household Size in Fredericksburg CDP Crawford County
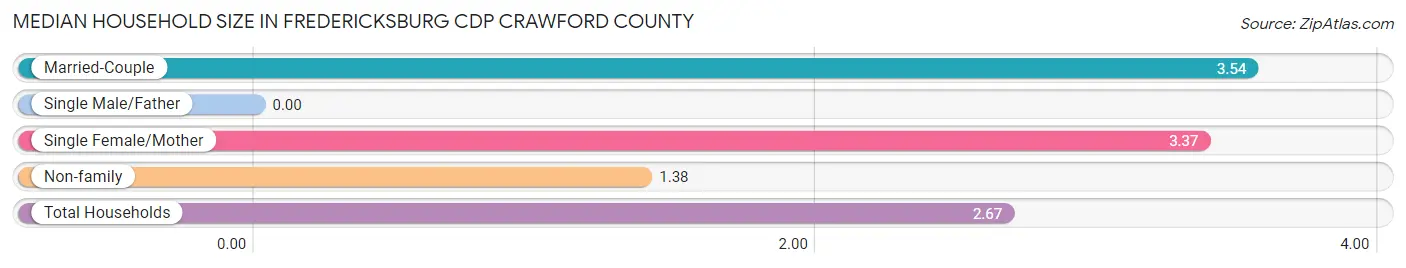
| Household Type | # Households | Household Size |
| Married-Couple | 136 (35.1%) | 3.54 |
| Single Male/Father | 0 (0.0%) | - |
| Single Female/Mother | 104 (26.9%) | 3.37 |
| Non-family | 147 (38.0%) | 1.38 |
| Total Households | 387 (100.0%) | 2.67 |
Household Size by Marriage Status in Fredericksburg CDP Crawford County
Out of a total of 387 households in Fredericksburg CDP Crawford County, 240 (62.0%) are family households, while 147 (38.0%) are nonfamily households. The most numerous type of family households are 3-person households, comprising 92, and the most common type of nonfamily households are 1-person households, comprising 105.
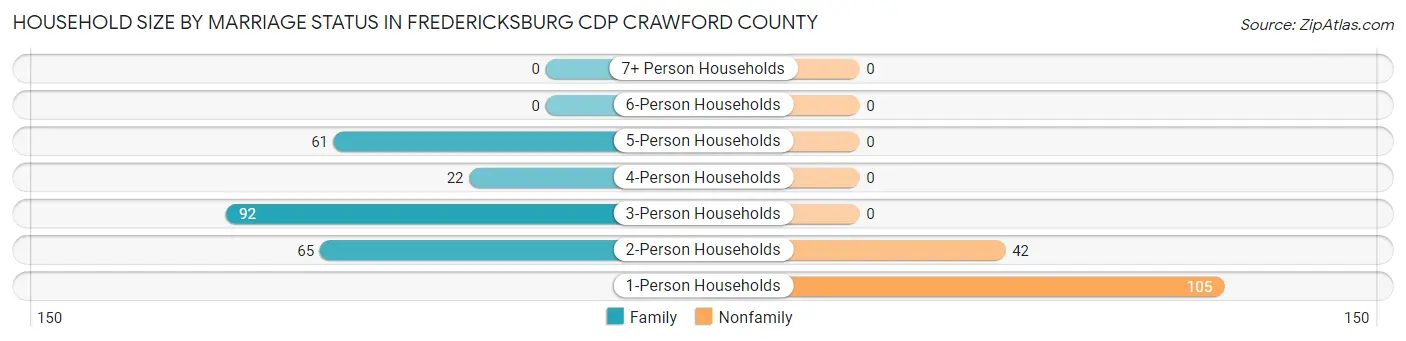
| Household Size | Family Households | Nonfamily Households |
| 1-Person Households | - | 105 (27.1%) |
| 2-Person Households | 65 (16.8%) | 42 (10.8%) |
| 3-Person Households | 92 (23.8%) | 0 (0.0%) |
| 4-Person Households | 22 (5.7%) | 0 (0.0%) |
| 5-Person Households | 61 (15.8%) | 0 (0.0%) |
| 6-Person Households | 0 (0.0%) | 0 (0.0%) |
| 7+ Person Households | 0 (0.0%) | 0 (0.0%) |
| Total | 240 (62.0%) | 147 (38.0%) |
Female Fertility in Fredericksburg CDP Crawford County
Fertility by Age in Fredericksburg CDP Crawford County
| Age Bracket | Women with Births | Births / 1,000 Women |
| 15 to 19 years | 0 (0.0%) | 0.0 |
| 20 to 34 years | 0 (0.0%) | 0.0 |
| 35 to 50 years | 0 (0.0%) | 0.0 |
| Total | 0 (0.0%) | 0.0 |
Fertility by Age by Marriage Status in Fredericksburg CDP Crawford County
| Age Bracket | Married | Unmarried |
| 15 to 19 years | 0 (0.0%) | 0 (0.0%) |
| 20 to 34 years | 0 (0.0%) | 0 (0.0%) |
| 35 to 50 years | 0 (0.0%) | 0 (0.0%) |
| Total | 0 (0.0%) | 0 (0.0%) |
Fertility by Education in Fredericksburg CDP Crawford County
| Educational Attainment | Women with Births | Births / 1,000 Women |
| Less than High School | 0 (0.0%) | 0.0 |
| High School Diploma | 0 (0.0%) | 0.0 |
| College or Associate's Degree | 0 (0.0%) | 0.0 |
| Bachelor's Degree | 0 (0.0%) | 0.0 |
| Graduate Degree | 0 (0.0%) | 0.0 |
| Total | 0 (0.0%) | 0.0 |
Fertility by Education by Marriage Status in Fredericksburg CDP Crawford County
| Educational Attainment | Married | Unmarried |
| Less than High School | 0 (0.0%) | 0 (0.0%) |
| High School Diploma | 0 (0.0%) | 0 (0.0%) |
| College or Associate's Degree | 0 (0.0%) | 0 (0.0%) |
| Bachelor's Degree | 0 (0.0%) | 0 (0.0%) |
| Graduate Degree | 0 (0.0%) | 0 (0.0%) |
| Total | 0 (0.0%) | 0 (0.0%) |
Employment Characteristics in Fredericksburg CDP Crawford County
Employment by Class of Employer in Fredericksburg CDP Crawford County
Among the 417 employed individuals in Fredericksburg CDP Crawford County, private company employees (363 | 87.1%), local government employees (24 | 5.8%), and not-for-profit organizations (16 | 3.8%) make up the most common classes of employment.
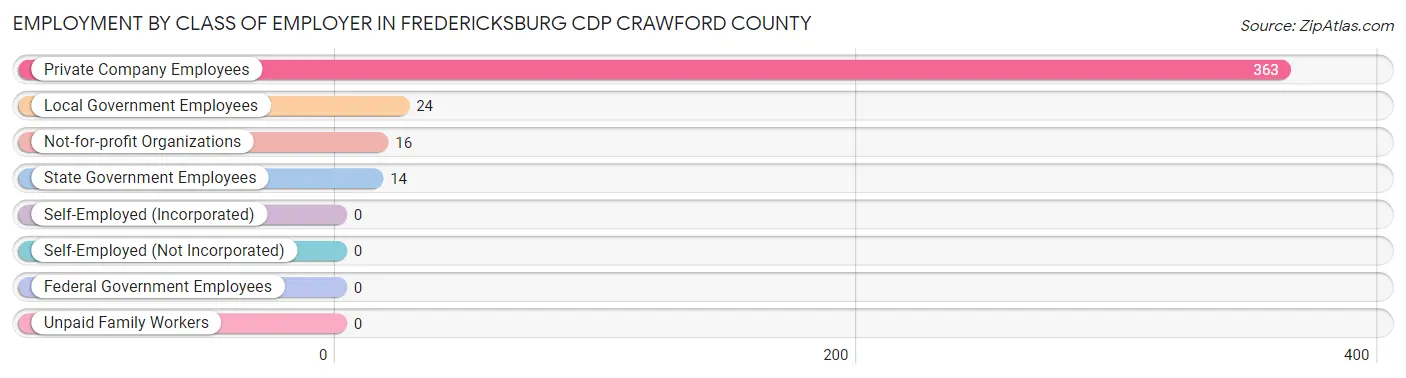
| Employer Class | # Employees | % Employees |
| Private Company Employees | 363 | 87.1% |
| Self-Employed (Incorporated) | 0 | 0.0% |
| Self-Employed (Not Incorporated) | 0 | 0.0% |
| Not-for-profit Organizations | 16 | 3.8% |
| Local Government Employees | 24 | 5.8% |
| State Government Employees | 14 | 3.4% |
| Federal Government Employees | 0 | 0.0% |
| Unpaid Family Workers | 0 | 0.0% |
| Total | 417 | 100.0% |
Employment Status by Age in Fredericksburg CDP Crawford County
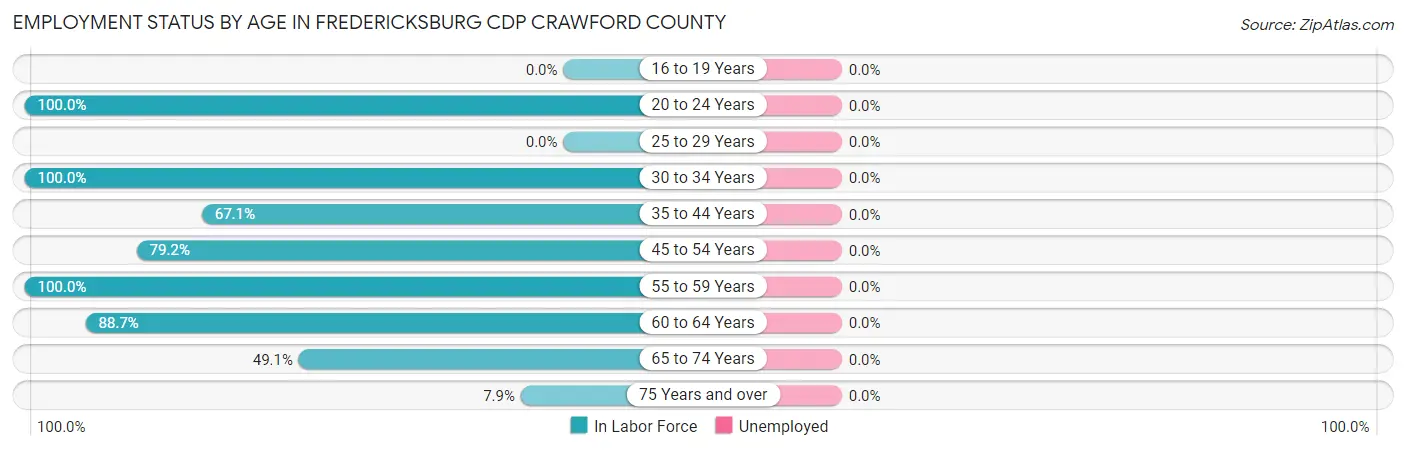
| Age Bracket | In Labor Force | Unemployed |
| 16 to 19 Years | 0 (0.0%) | 0 (0.0%) |
| 20 to 24 Years | 34 (100.0%) | 0 (0.0%) |
| 25 to 29 Years | 0 (0.0%) | 0 (0.0%) |
| 30 to 34 Years | 61 (100.0%) | 0 (0.0%) |
| 35 to 44 Years | 106 (67.1%) | 0 (0.0%) |
| 45 to 54 Years | 80 (79.2%) | 0 (0.0%) |
| 55 to 59 Years | 17 (100.0%) | 0 (0.0%) |
| 60 to 64 Years | 110 (88.7%) | 0 (0.0%) |
| 65 to 74 Years | 28 (49.1%) | 0 (0.0%) |
| 75 Years and over | 13 (7.9%) | 0 (0.0%) |
| Total | 449 (59.6%) | 0 (0.0%) |
Employment Status by Educational Attainment in Fredericksburg CDP Crawford County
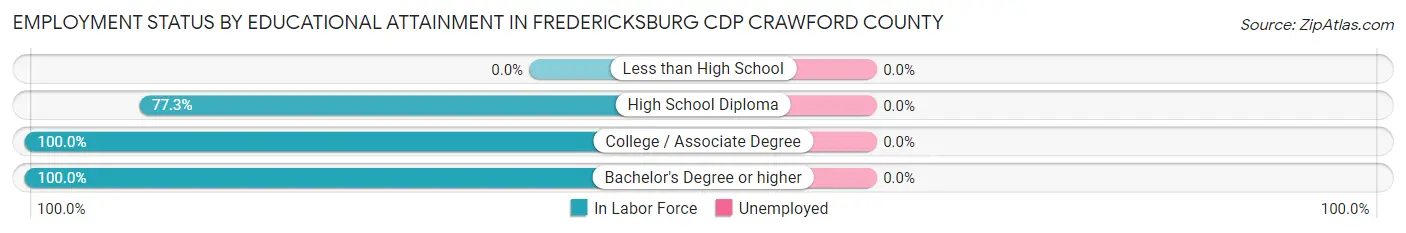
| Educational Attainment | In Labor Force | Unemployed |
| Less than High School | 0 (0.0%) | 0 (0.0%) |
| High School Diploma | 245 (77.3%) | 0 (0.0%) |
| College / Associate Degree | 34 (100.0%) | 0 (0.0%) |
| Bachelor's Degree or higher | 95 (100.0%) | 0 (0.0%) |
| Total | 374 (81.1%) | 0 (0.0%) |
Employment Occupations by Sex in Fredericksburg CDP Crawford County
Management, Business, Science and Arts Occupations
The most common Management, Business, Science and Arts occupations in Fredericksburg CDP Crawford County are Business & Financial (86 | 19.2%), Community & Social Service (16 | 3.6%), and Education, Arts & Media (16 | 3.6%).
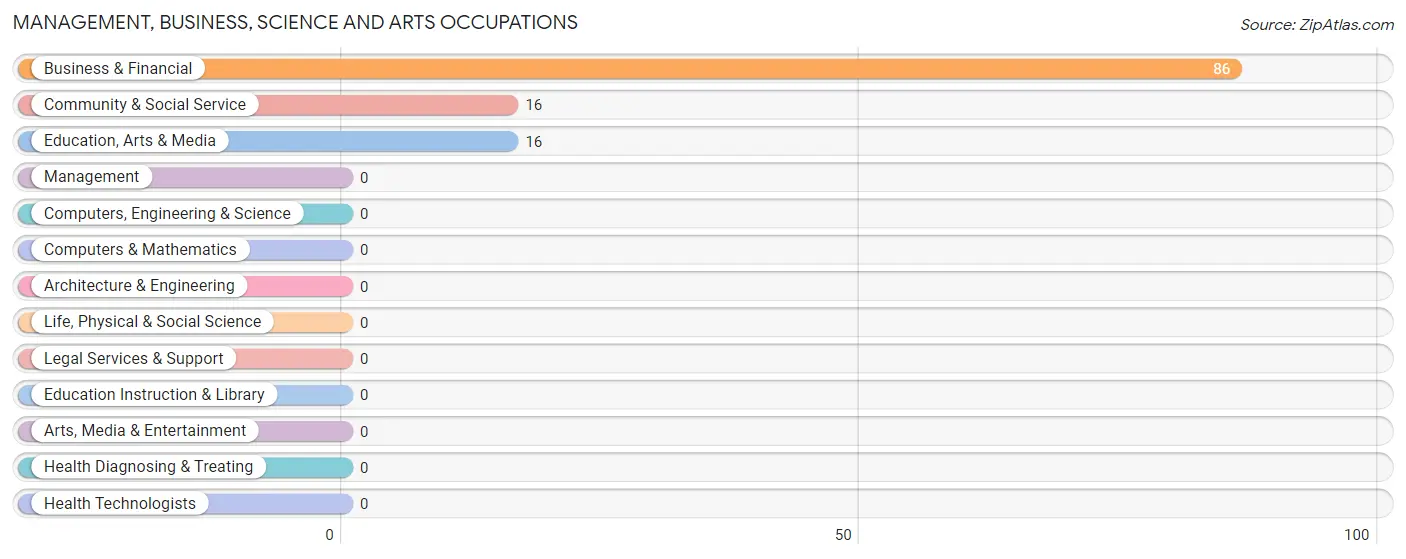
Management, Business, Science and Arts Occupations by Sex
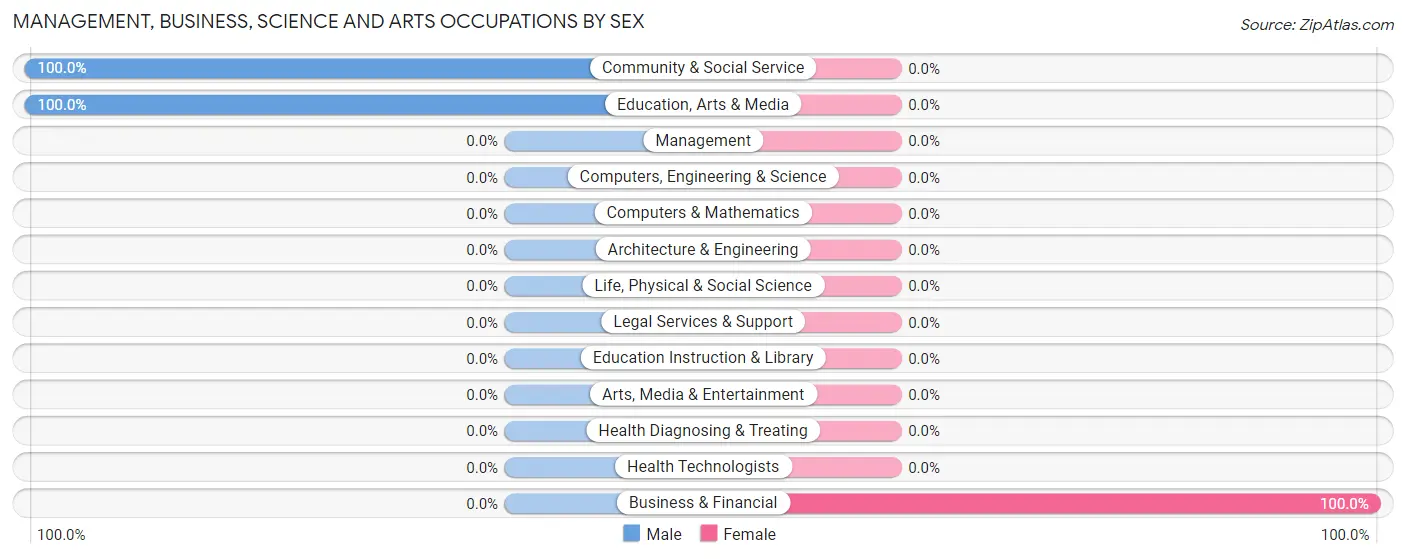
| Occupation | Male | Female |
| Management | 0 (0.0%) | 0 (0.0%) |
| Business & Financial | 0 (0.0%) | 86 (100.0%) |
| Computers, Engineering & Science | 0 (0.0%) | 0 (0.0%) |
| Computers & Mathematics | 0 (0.0%) | 0 (0.0%) |
| Architecture & Engineering | 0 (0.0%) | 0 (0.0%) |
| Life, Physical & Social Science | 0 (0.0%) | 0 (0.0%) |
| Community & Social Service | 16 (100.0%) | 0 (0.0%) |
| Education, Arts & Media | 16 (100.0%) | 0 (0.0%) |
| Legal Services & Support | 0 (0.0%) | 0 (0.0%) |
| Education Instruction & Library | 0 (0.0%) | 0 (0.0%) |
| Arts, Media & Entertainment | 0 (0.0%) | 0 (0.0%) |
| Health Diagnosing & Treating | 0 (0.0%) | 0 (0.0%) |
| Health Technologists | 0 (0.0%) | 0 (0.0%) |
| Total (Category) | 16 (15.7%) | 86 (84.3%) |
| Total (Overall) | 230 (51.2%) | 219 (48.8%) |
Services Occupations
The most common Services occupations in Fredericksburg CDP Crawford County are Security & Protection (24 | 5.3%), Law Enforcement (24 | 5.3%), and Healthcare Support (5 | 1.1%).
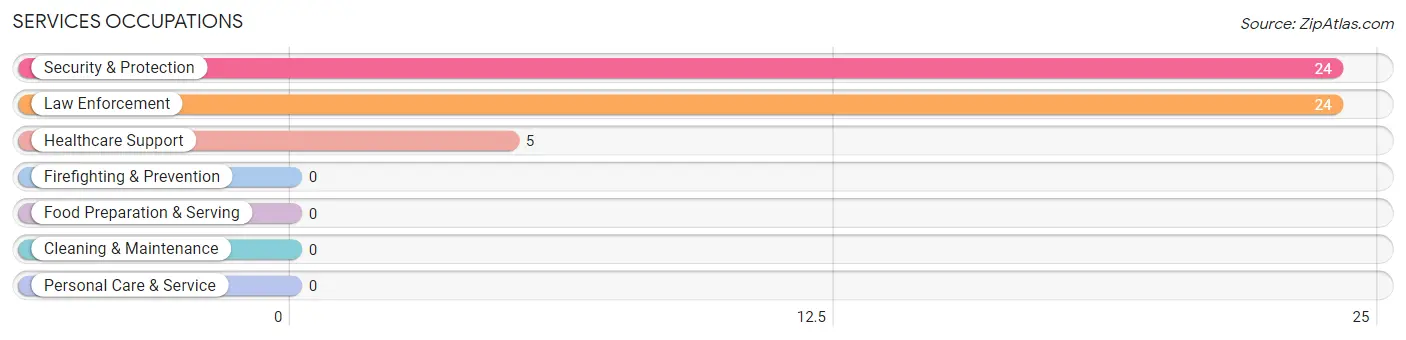
Services Occupations by Sex
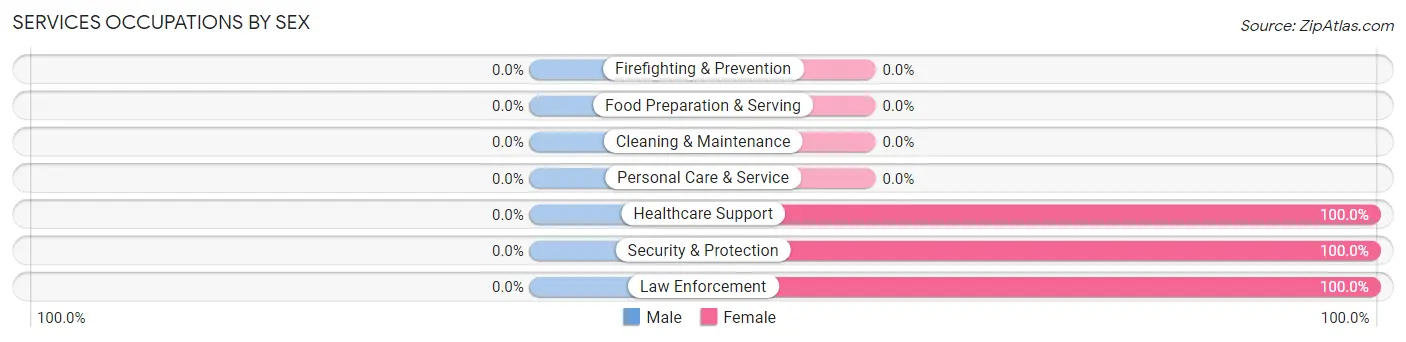
| Occupation | Male | Female |
| Healthcare Support | 0 (0.0%) | 5 (100.0%) |
| Security & Protection | 0 (0.0%) | 24 (100.0%) |
| Firefighting & Prevention | 0 (0.0%) | 0 (0.0%) |
| Law Enforcement | 0 (0.0%) | 24 (100.0%) |
| Food Preparation & Serving | 0 (0.0%) | 0 (0.0%) |
| Cleaning & Maintenance | 0 (0.0%) | 0 (0.0%) |
| Personal Care & Service | 0 (0.0%) | 0 (0.0%) |
| Total (Category) | 0 (0.0%) | 29 (100.0%) |
| Total (Overall) | 230 (51.2%) | 219 (48.8%) |
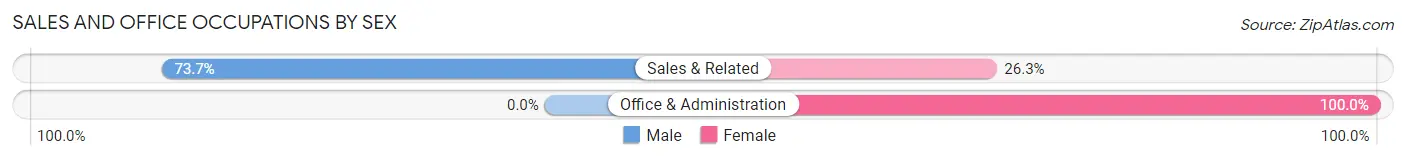
Sales and Office Occupations
The most common Sales and Office occupations in Fredericksburg CDP Crawford County are Office & Administration (77 | 17.2%), and Sales & Related (76 | 16.9%).
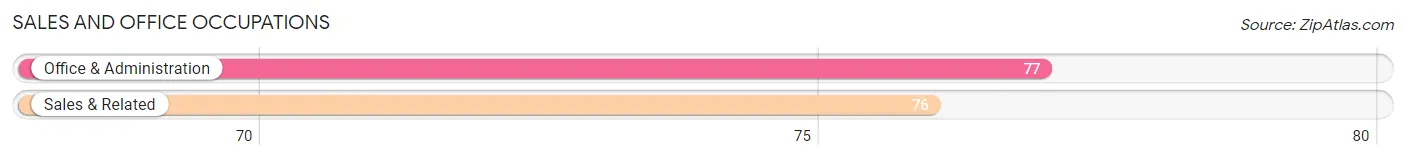
Sales and Office Occupations by Sex
| Occupation | Male | Female |
| Sales & Related | 56 (73.7%) | 20 (26.3%) |
| Office & Administration | 0 (0.0%) | 77 (100.0%) |
| Total (Category) | 56 (36.6%) | 97 (63.4%) |
| Total (Overall) | 230 (51.2%) | 219 (48.8%) |
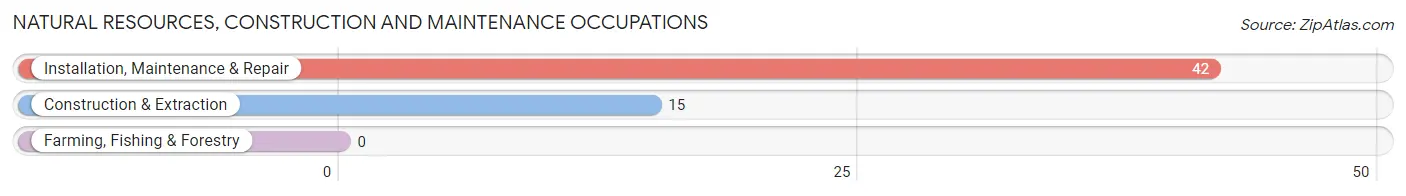
Natural Resources, Construction and Maintenance Occupations
The most common Natural Resources, Construction and Maintenance occupations in Fredericksburg CDP Crawford County are Installation, Maintenance & Repair (42 | 9.3%), and Construction & Extraction (15 | 3.3%).
Natural Resources, Construction and Maintenance Occupations by Sex
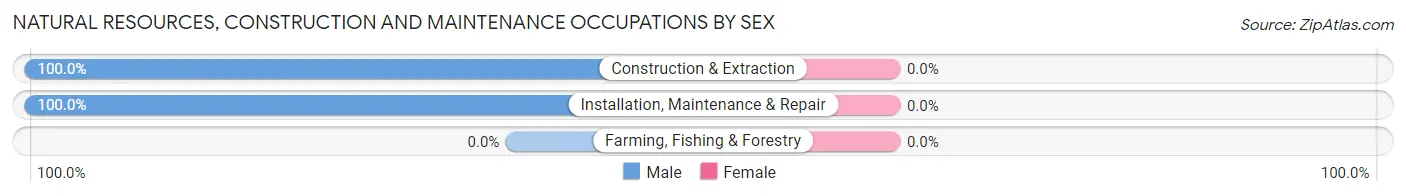
| Occupation | Male | Female |
| Farming, Fishing & Forestry | 0 (0.0%) | 0 (0.0%) |
| Construction & Extraction | 15 (100.0%) | 0 (0.0%) |
| Installation, Maintenance & Repair | 42 (100.0%) | 0 (0.0%) |
| Total (Category) | 57 (100.0%) | 0 (0.0%) |
| Total (Overall) | 230 (51.2%) | 219 (48.8%) |
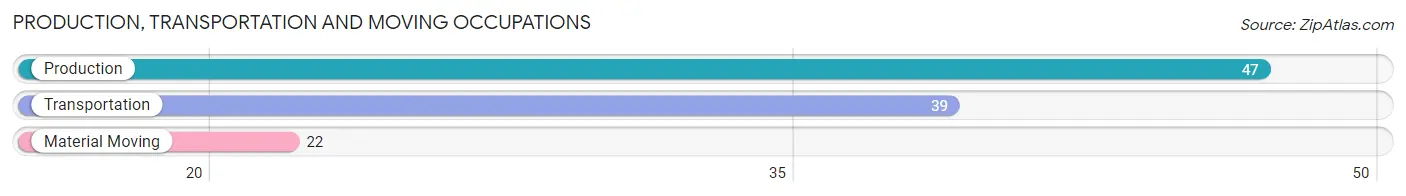
Production, Transportation and Moving Occupations
The most common Production, Transportation and Moving occupations in Fredericksburg CDP Crawford County are Production (47 | 10.5%), Transportation (39 | 8.7%), and Material Moving (22 | 4.9%).
Production, Transportation and Moving Occupations by Sex
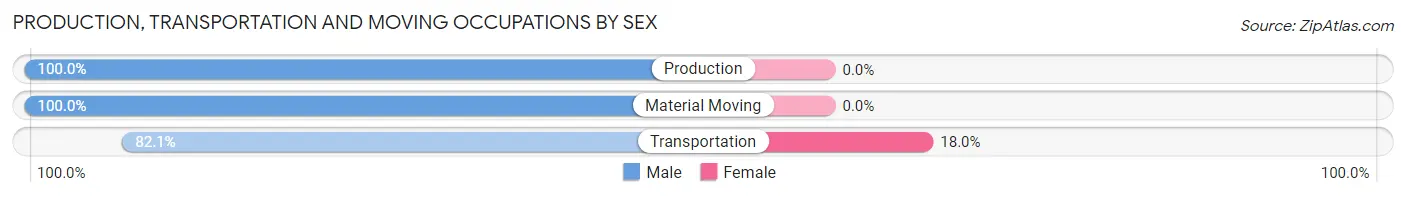
| Occupation | Male | Female |
| Production | 47 (100.0%) | 0 (0.0%) |
| Transportation | 32 (82.1%) | 7 (17.9%) |
| Material Moving | 22 (100.0%) | 0 (0.0%) |
| Total (Category) | 101 (93.5%) | 7 (6.5%) |
| Total (Overall) | 230 (51.2%) | 219 (48.8%) |
Employment Industries by Sex in Fredericksburg CDP Crawford County
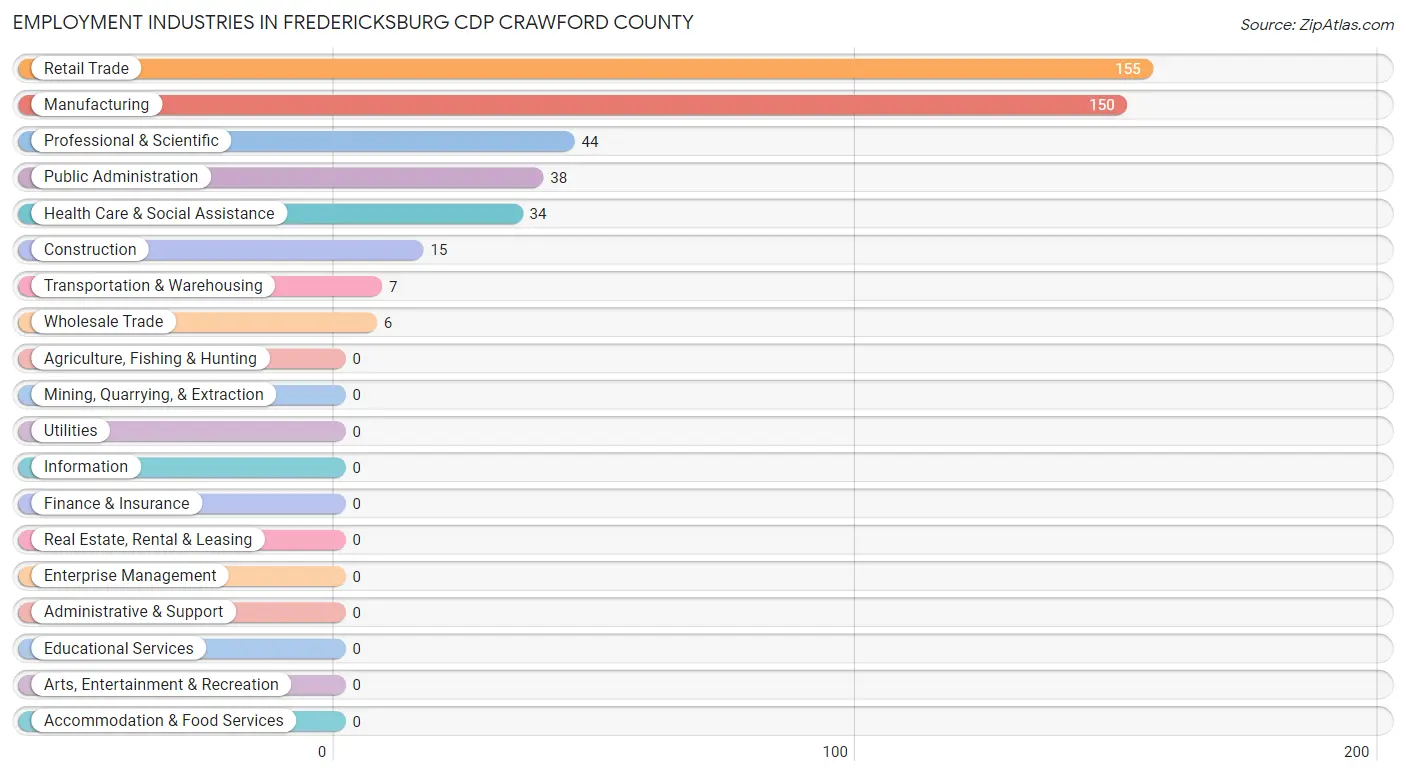
Employment Industries in Fredericksburg CDP Crawford County
The major employment industries in Fredericksburg CDP Crawford County include Retail Trade (155 | 34.5%), Manufacturing (150 | 33.4%), Professional & Scientific (44 | 9.8%), Public Administration (38 | 8.5%), and Health Care & Social Assistance (34 | 7.6%).
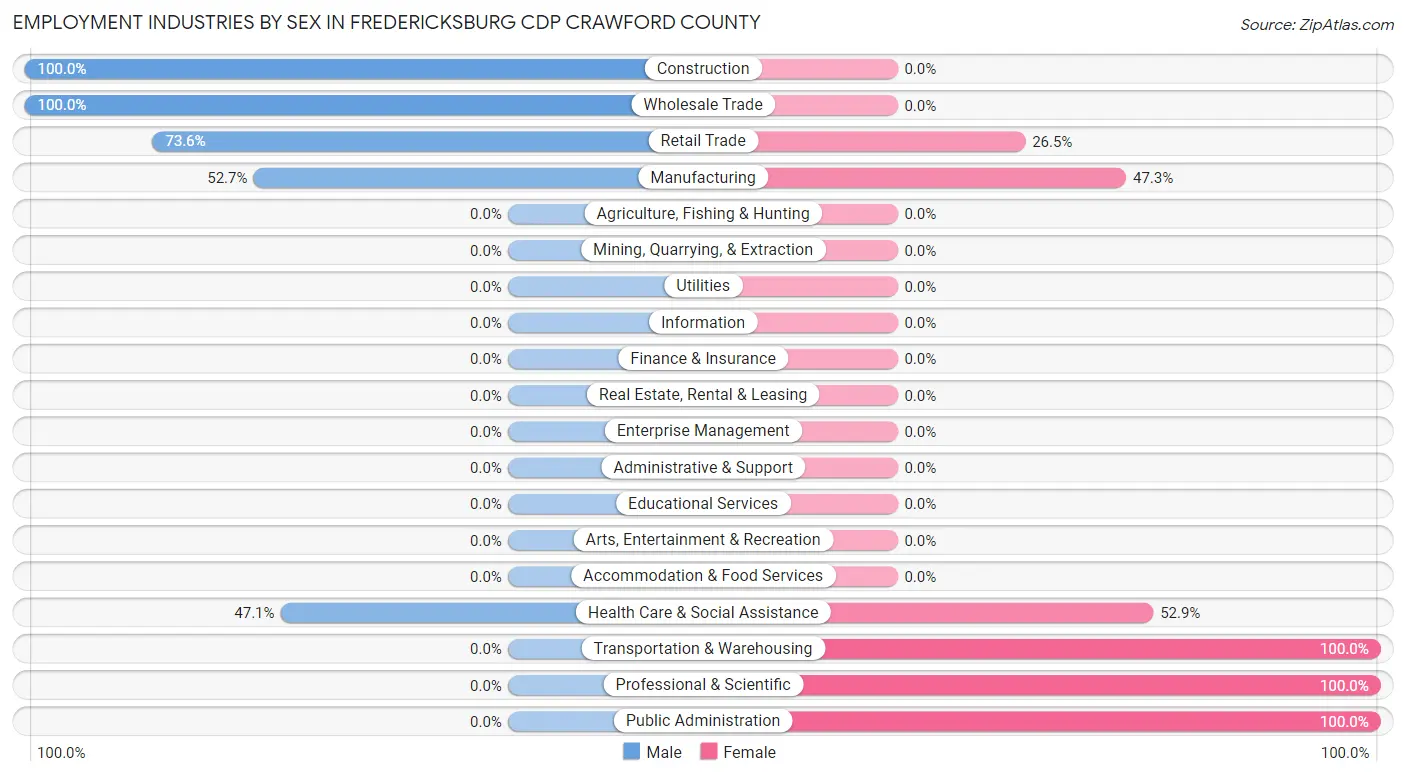
Employment Industries by Sex in Fredericksburg CDP Crawford County
The Fredericksburg CDP Crawford County industries that see more men than women are Construction (100.0%), Wholesale Trade (100.0%), and Retail Trade (73.6%), whereas the industries that tend to have a higher number of women are Transportation & Warehousing (100.0%), Professional & Scientific (100.0%), and Public Administration (100.0%).
| Industry | Male | Female |
| Agriculture, Fishing & Hunting | 0 (0.0%) | 0 (0.0%) |
| Mining, Quarrying, & Extraction | 0 (0.0%) | 0 (0.0%) |
| Construction | 15 (100.0%) | 0 (0.0%) |
| Manufacturing | 79 (52.7%) | 71 (47.3%) |
| Wholesale Trade | 6 (100.0%) | 0 (0.0%) |
| Retail Trade | 114 (73.6%) | 41 (26.5%) |
| Transportation & Warehousing | 0 (0.0%) | 7 (100.0%) |
| Utilities | 0 (0.0%) | 0 (0.0%) |
| Information | 0 (0.0%) | 0 (0.0%) |
| Finance & Insurance | 0 (0.0%) | 0 (0.0%) |
| Real Estate, Rental & Leasing | 0 (0.0%) | 0 (0.0%) |
| Professional & Scientific | 0 (0.0%) | 44 (100.0%) |
| Enterprise Management | 0 (0.0%) | 0 (0.0%) |
| Administrative & Support | 0 (0.0%) | 0 (0.0%) |
| Educational Services | 0 (0.0%) | 0 (0.0%) |
| Health Care & Social Assistance | 16 (47.1%) | 18 (52.9%) |
| Arts, Entertainment & Recreation | 0 (0.0%) | 0 (0.0%) |
| Accommodation & Food Services | 0 (0.0%) | 0 (0.0%) |
| Public Administration | 0 (0.0%) | 38 (100.0%) |
| Total | 230 (51.2%) | 219 (48.8%) |
Education in Fredericksburg CDP Crawford County
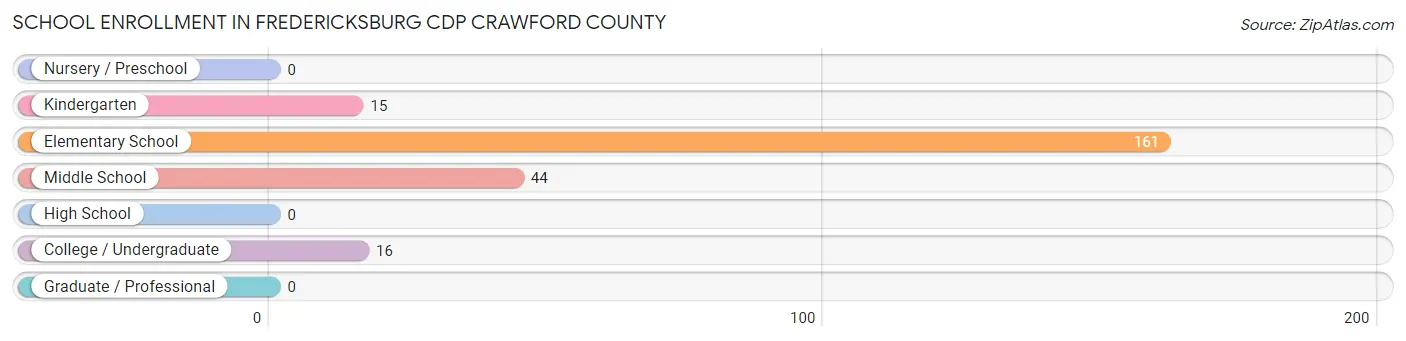
School Enrollment in Fredericksburg CDP Crawford County
The most common levels of schooling among the 236 students in Fredericksburg CDP Crawford County are elementary school (161 | 68.2%), middle school (44 | 18.6%), and college / undergraduate (16 | 6.8%).
| School Level | # Students | % Students |
| Nursery / Preschool | 0 | 0.0% |
| Kindergarten | 15 | 6.4% |
| Elementary School | 161 | 68.2% |
| Middle School | 44 | 18.6% |
| High School | 0 | 0.0% |
| College / Undergraduate | 16 | 6.8% |
| Graduate / Professional | 0 | 0.0% |
| Total | 236 | 100.0% |
School Enrollment by Age by Funding Source in Fredericksburg CDP Crawford County
Out of a total of 236 students who are enrolled in schools in Fredericksburg CDP Crawford County, 31 (13.1%) attend a private institution, while the remaining 205 (86.9%) are enrolled in public schools. The age group of 20 to 24 year olds has the highest likelihood of being enrolled in private schools, with 16 (100.0% in the age bracket) enrolled. Conversely, the age group of 10 to 14 year olds has the lowest likelihood of being enrolled in a private school, with 129 (100.0% in the age bracket) attending a public institution.
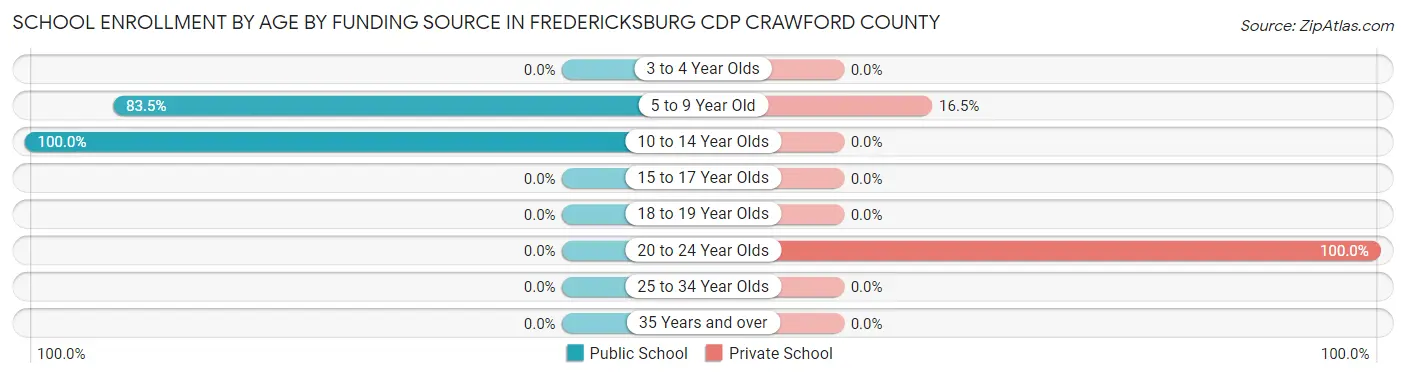
| Age Bracket | Public School | Private School |
| 3 to 4 Year Olds | 0 (0.0%) | 0 (0.0%) |
| 5 to 9 Year Old | 76 (83.5%) | 15 (16.5%) |
| 10 to 14 Year Olds | 129 (100.0%) | 0 (0.0%) |
| 15 to 17 Year Olds | 0 (0.0%) | 0 (0.0%) |
| 18 to 19 Year Olds | 0 (0.0%) | 0 (0.0%) |
| 20 to 24 Year Olds | 0 (0.0%) | 16 (100.0%) |
| 25 to 34 Year Olds | 0 (0.0%) | 0 (0.0%) |
| 35 Years and over | 0 (0.0%) | 0 (0.0%) |
| Total | 205 (86.9%) | 31 (13.1%) |
Educational Attainment by Field of Study in Fredericksburg CDP Crawford County
Business (44 | 35.5%), education (43 | 34.7%), physical & health sciences (21 | 16.9%), and arts & humanities (16 | 12.9%) are the most common fields of study among 124 individuals in Fredericksburg CDP Crawford County who have obtained a bachelor's degree or higher.
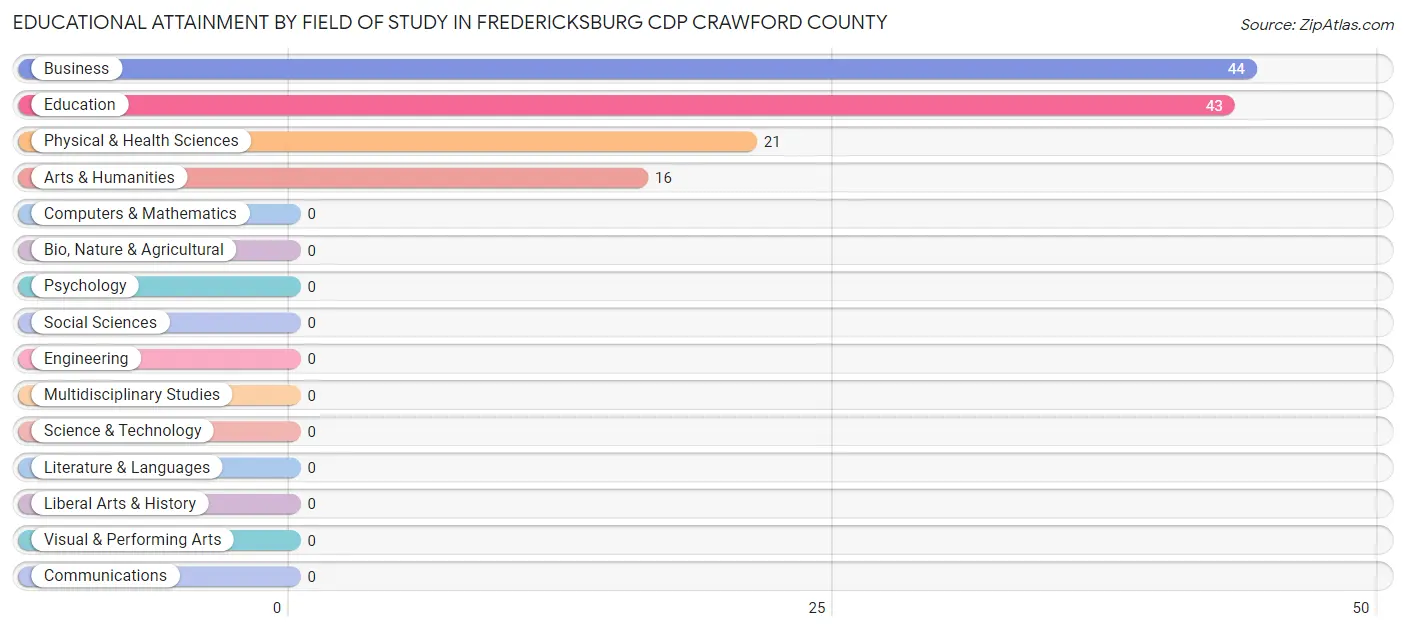
| Field of Study | # Graduates | % Graduates |
| Computers & Mathematics | 0 | 0.0% |
| Bio, Nature & Agricultural | 0 | 0.0% |
| Physical & Health Sciences | 21 | 16.9% |
| Psychology | 0 | 0.0% |
| Social Sciences | 0 | 0.0% |
| Engineering | 0 | 0.0% |
| Multidisciplinary Studies | 0 | 0.0% |
| Science & Technology | 0 | 0.0% |
| Business | 44 | 35.5% |
| Education | 43 | 34.7% |
| Literature & Languages | 0 | 0.0% |
| Liberal Arts & History | 0 | 0.0% |
| Visual & Performing Arts | 0 | 0.0% |
| Communications | 0 | 0.0% |
| Arts & Humanities | 16 | 12.9% |
| Total | 124 | 100.0% |
Transportation & Commute in Fredericksburg CDP Crawford County
Vehicle Availability by Sex in Fredericksburg CDP Crawford County
The most prevalent vehicle ownership categories in Fredericksburg CDP Crawford County are males with 1 vehicle (72, accounting for 36.4%) and females with 1 vehicle (94, making up 32.9%).
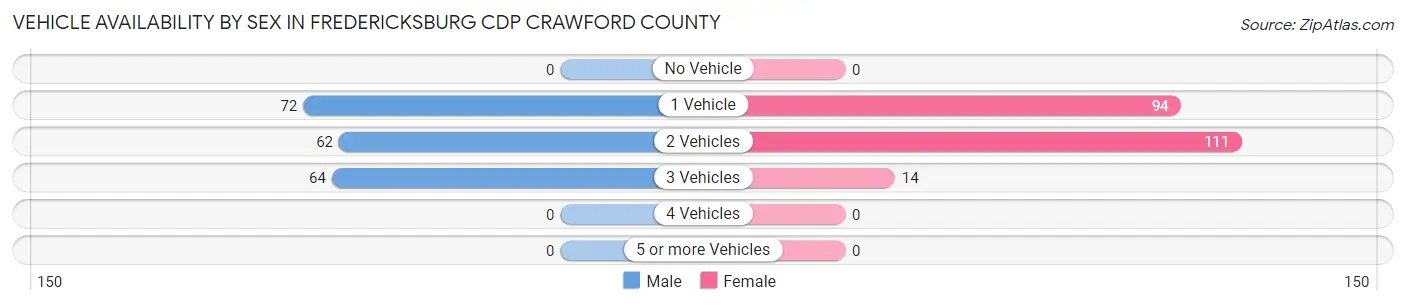
| Vehicles Available | Male | Female |
| No Vehicle | 0 (0.0%) | 0 (0.0%) |
| 1 Vehicle | 72 (36.4%) | 94 (42.9%) |
| 2 Vehicles | 62 (31.3%) | 111 (50.7%) |
| 3 Vehicles | 64 (32.3%) | 14 (6.4%) |
| 4 Vehicles | 0 (0.0%) | 0 (0.0%) |
| 5 or more Vehicles | 0 (0.0%) | 0 (0.0%) |
| Total | 198 (100.0%) | 219 (100.0%) |
Commute Time in Fredericksburg CDP Crawford County
The most frequently occuring commute durations in Fredericksburg CDP Crawford County are 5 to 9 minutes (210 commuters, 50.4%), 25 to 29 minutes (66 commuters, 15.8%), and 15 to 19 minutes (55 commuters, 13.2%).
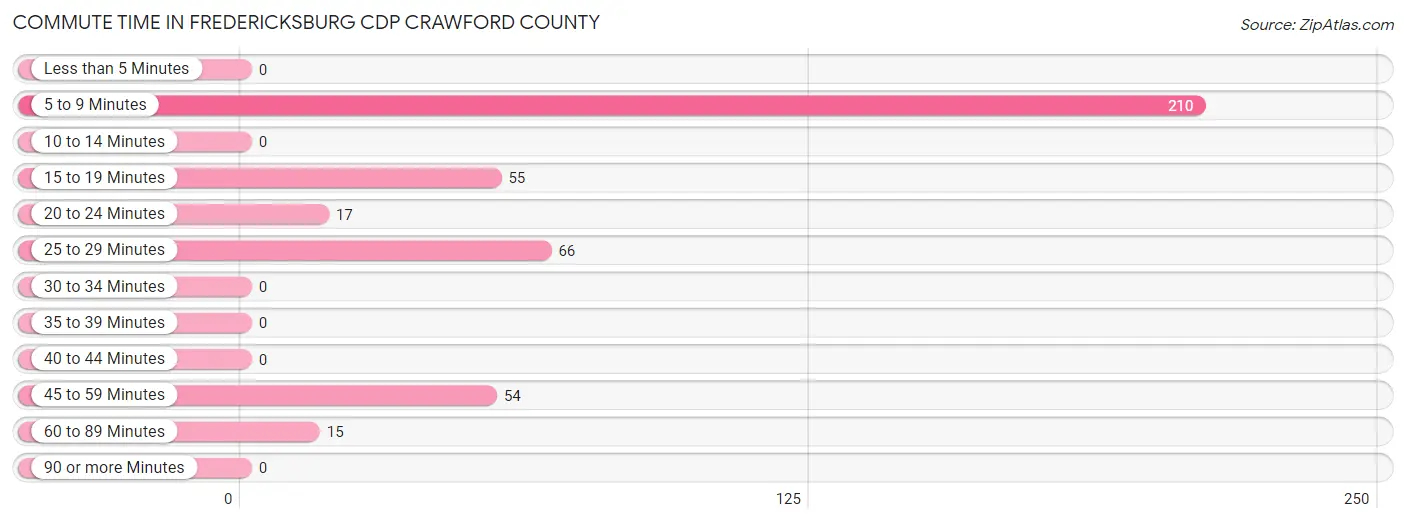
| Commute Time | # Commuters | % Commuters |
| Less than 5 Minutes | 0 | 0.0% |
| 5 to 9 Minutes | 210 | 50.4% |
| 10 to 14 Minutes | 0 | 0.0% |
| 15 to 19 Minutes | 55 | 13.2% |
| 20 to 24 Minutes | 17 | 4.1% |
| 25 to 29 Minutes | 66 | 15.8% |
| 30 to 34 Minutes | 0 | 0.0% |
| 35 to 39 Minutes | 0 | 0.0% |
| 40 to 44 Minutes | 0 | 0.0% |
| 45 to 59 Minutes | 54 | 13.0% |
| 60 to 89 Minutes | 15 | 3.6% |
| 90 or more Minutes | 0 | 0.0% |
Commute Time by Sex in Fredericksburg CDP Crawford County
The most common commute times in Fredericksburg CDP Crawford County are 5 to 9 minutes (127 commuters, 64.1%) for males and 5 to 9 minutes (83 commuters, 37.9%) for females.
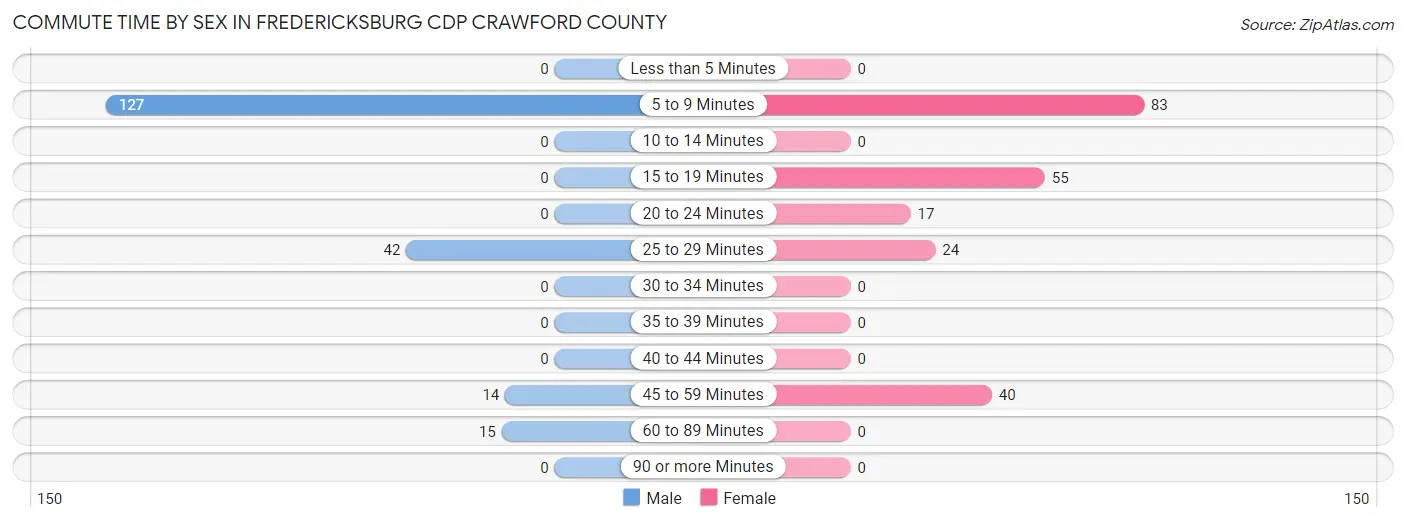
| Commute Time | Male | Female |
| Less than 5 Minutes | 0 (0.0%) | 0 (0.0%) |
| 5 to 9 Minutes | 127 (64.1%) | 83 (37.9%) |
| 10 to 14 Minutes | 0 (0.0%) | 0 (0.0%) |
| 15 to 19 Minutes | 0 (0.0%) | 55 (25.1%) |
| 20 to 24 Minutes | 0 (0.0%) | 17 (7.8%) |
| 25 to 29 Minutes | 42 (21.2%) | 24 (11.0%) |
| 30 to 34 Minutes | 0 (0.0%) | 0 (0.0%) |
| 35 to 39 Minutes | 0 (0.0%) | 0 (0.0%) |
| 40 to 44 Minutes | 0 (0.0%) | 0 (0.0%) |
| 45 to 59 Minutes | 14 (7.1%) | 40 (18.3%) |
| 60 to 89 Minutes | 15 (7.6%) | 0 (0.0%) |
| 90 or more Minutes | 0 (0.0%) | 0 (0.0%) |
Time of Departure to Work by Sex in Fredericksburg CDP Crawford County
The most frequent times of departure to work in Fredericksburg CDP Crawford County are 6:30 AM to 6:59 AM (60, 30.3%) for males and 7:30 AM to 7:59 AM (66, 30.1%) for females.
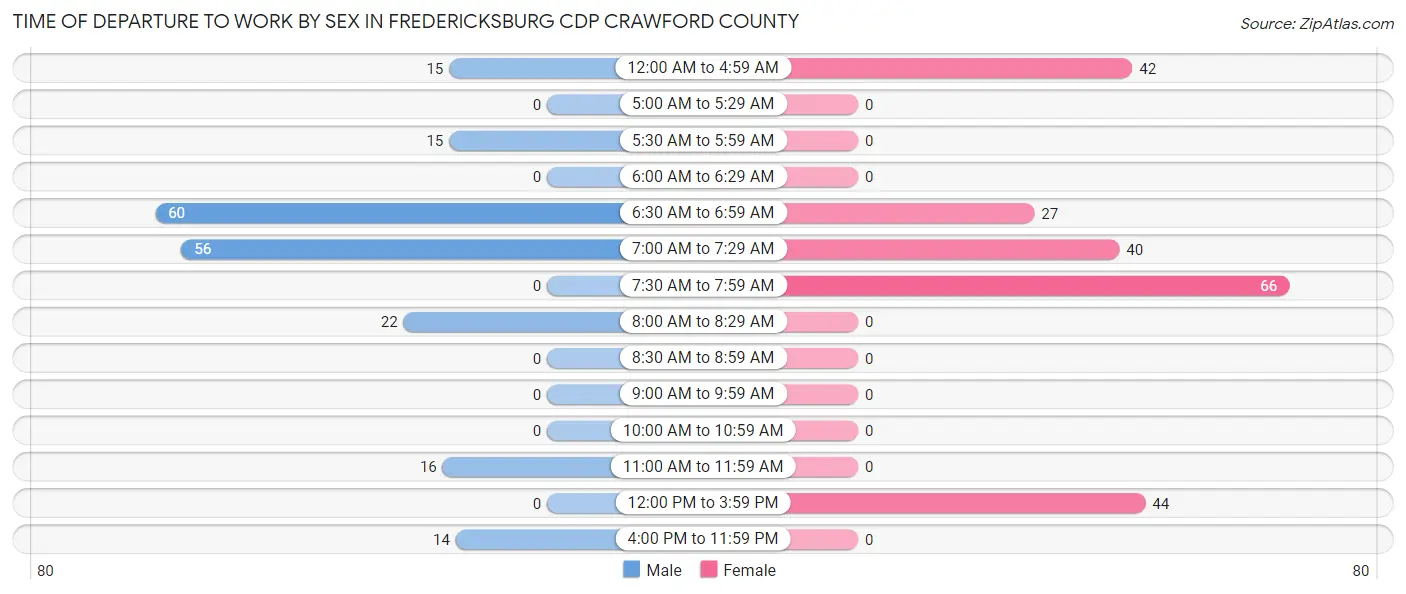
| Time of Departure | Male | Female |
| 12:00 AM to 4:59 AM | 15 (7.6%) | 42 (19.2%) |
| 5:00 AM to 5:29 AM | 0 (0.0%) | 0 (0.0%) |
| 5:30 AM to 5:59 AM | 15 (7.6%) | 0 (0.0%) |
| 6:00 AM to 6:29 AM | 0 (0.0%) | 0 (0.0%) |
| 6:30 AM to 6:59 AM | 60 (30.3%) | 27 (12.3%) |
| 7:00 AM to 7:29 AM | 56 (28.3%) | 40 (18.3%) |
| 7:30 AM to 7:59 AM | 0 (0.0%) | 66 (30.1%) |
| 8:00 AM to 8:29 AM | 22 (11.1%) | 0 (0.0%) |
| 8:30 AM to 8:59 AM | 0 (0.0%) | 0 (0.0%) |
| 9:00 AM to 9:59 AM | 0 (0.0%) | 0 (0.0%) |
| 10:00 AM to 10:59 AM | 0 (0.0%) | 0 (0.0%) |
| 11:00 AM to 11:59 AM | 16 (8.1%) | 0 (0.0%) |
| 12:00 PM to 3:59 PM | 0 (0.0%) | 44 (20.1%) |
| 4:00 PM to 11:59 PM | 14 (7.1%) | 0 (0.0%) |
| Total | 198 (100.0%) | 219 (100.0%) |
Housing Occupancy in Fredericksburg CDP Crawford County
Occupancy by Ownership in Fredericksburg CDP Crawford County
Of the total 387 dwellings in Fredericksburg CDP Crawford County, owner-occupied units account for 330 (85.3%), while renter-occupied units make up 57 (14.7%).
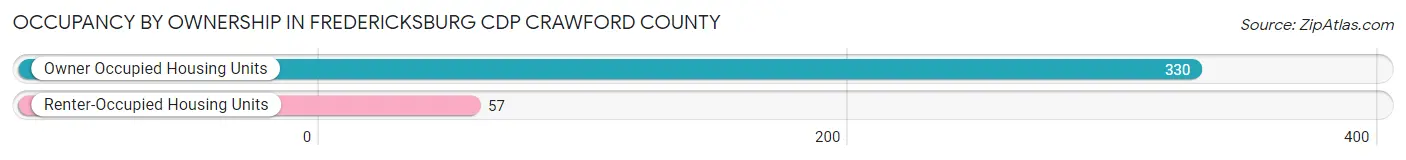
| Occupancy | # Housing Units | % Housing Units |
| Owner Occupied Housing Units | 330 | 85.3% |
| Renter-Occupied Housing Units | 57 | 14.7% |
| Total Occupied Housing Units | 387 | 100.0% |
Occupancy by Household Size in Fredericksburg CDP Crawford County
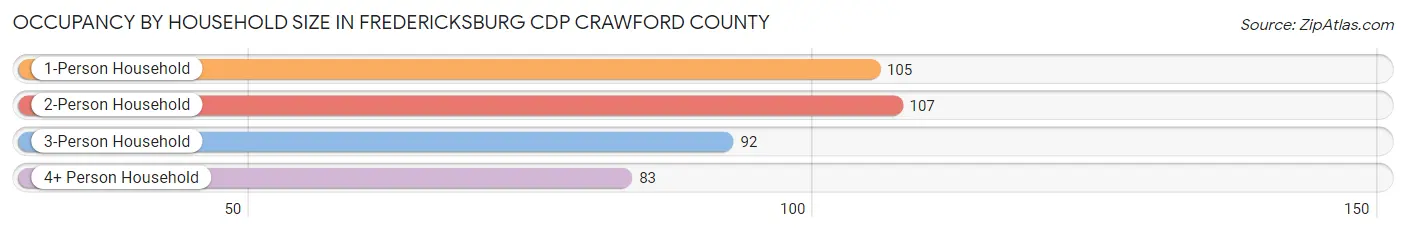
| Household Size | # Housing Units | % Housing Units |
| 1-Person Household | 105 | 27.1% |
| 2-Person Household | 107 | 27.7% |
| 3-Person Household | 92 | 23.8% |
| 4+ Person Household | 83 | 21.4% |
| Total Housing Units | 387 | 100.0% |
Occupancy by Ownership by Household Size in Fredericksburg CDP Crawford County
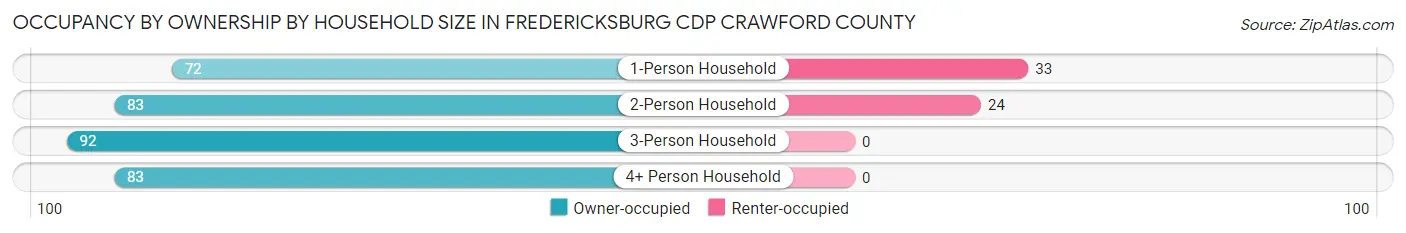
| Household Size | Owner-occupied | Renter-occupied |
| 1-Person Household | 72 (68.6%) | 33 (31.4%) |
| 2-Person Household | 83 (77.6%) | 24 (22.4%) |
| 3-Person Household | 92 (100.0%) | 0 (0.0%) |
| 4+ Person Household | 83 (100.0%) | 0 (0.0%) |
| Total Housing Units | 330 (85.3%) | 57 (14.7%) |
Occupancy by Educational Attainment in Fredericksburg CDP Crawford County
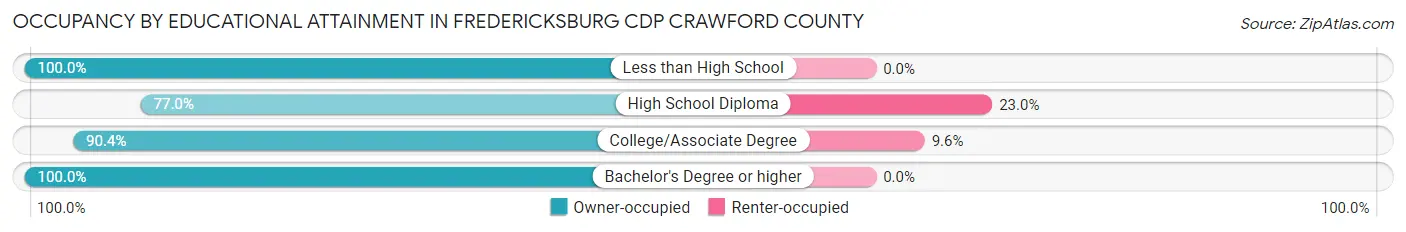
| Household Size | Owner-occupied | Renter-occupied |
| Less than High School | 15 (100.0%) | 0 (0.0%) |
| High School Diploma | 174 (77.0%) | 52 (23.0%) |
| College/Associate Degree | 47 (90.4%) | 5 (9.6%) |
| Bachelor's Degree or higher | 94 (100.0%) | 0 (0.0%) |
Occupancy by Age of Householder in Fredericksburg CDP Crawford County
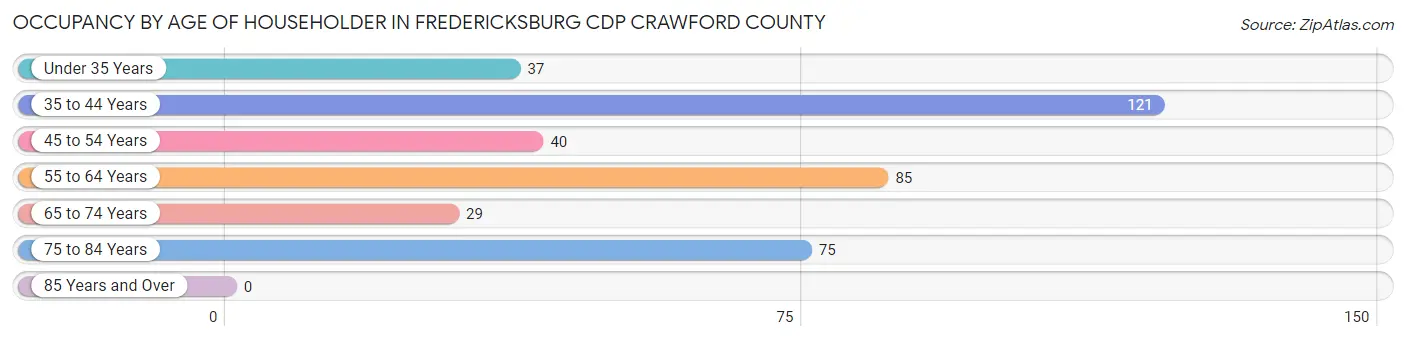
| Age Bracket | # Households | % Households |
| Under 35 Years | 37 | 9.6% |
| 35 to 44 Years | 121 | 31.3% |
| 45 to 54 Years | 40 | 10.3% |
| 55 to 64 Years | 85 | 22.0% |
| 65 to 74 Years | 29 | 7.5% |
| 75 to 84 Years | 75 | 19.4% |
| 85 Years and Over | 0 | 0.0% |
| Total | 387 | 100.0% |
Housing Finances in Fredericksburg CDP Crawford County
Median Income by Occupancy in Fredericksburg CDP Crawford County
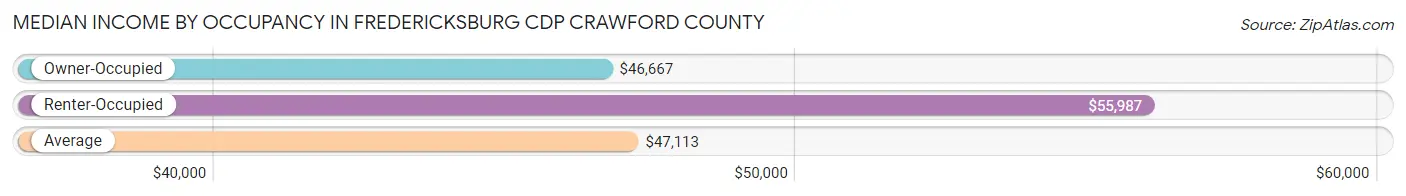
| Occupancy Type | # Households | Median Income |
| Owner-Occupied | 330 (85.3%) | $46,667 |
| Renter-Occupied | 57 (14.7%) | $55,987 |
| Average | 387 (100.0%) | $47,113 |
Occupancy by Householder Income Bracket in Fredericksburg CDP Crawford County
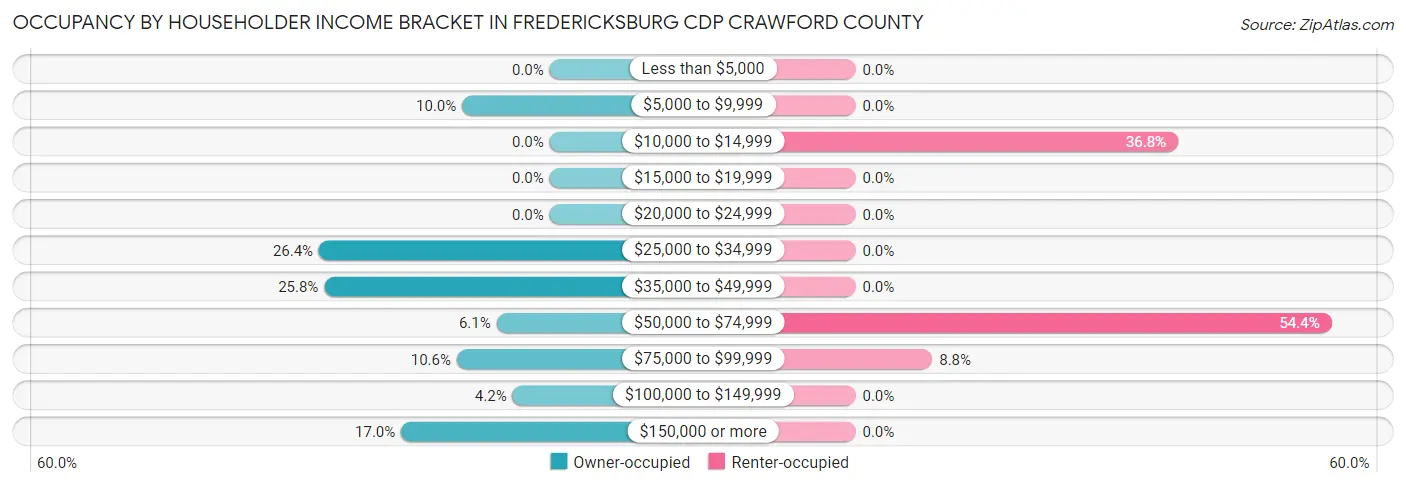
| Income Bracket | Owner-occupied | Renter-occupied |
| Less than $5,000 | 0 (0.0%) | 0 (0.0%) |
| $5,000 to $9,999 | 33 (10.0%) | 0 (0.0%) |
| $10,000 to $14,999 | 0 (0.0%) | 21 (36.8%) |
| $15,000 to $19,999 | 0 (0.0%) | 0 (0.0%) |
| $20,000 to $24,999 | 0 (0.0%) | 0 (0.0%) |
| $25,000 to $34,999 | 87 (26.4%) | 0 (0.0%) |
| $35,000 to $49,999 | 85 (25.8%) | 0 (0.0%) |
| $50,000 to $74,999 | 20 (6.1%) | 31 (54.4%) |
| $75,000 to $99,999 | 35 (10.6%) | 5 (8.8%) |
| $100,000 to $149,999 | 14 (4.2%) | 0 (0.0%) |
| $150,000 or more | 56 (17.0%) | 0 (0.0%) |
| Total | 330 (100.0%) | 57 (100.0%) |
Monthly Housing Cost Tiers in Fredericksburg CDP Crawford County
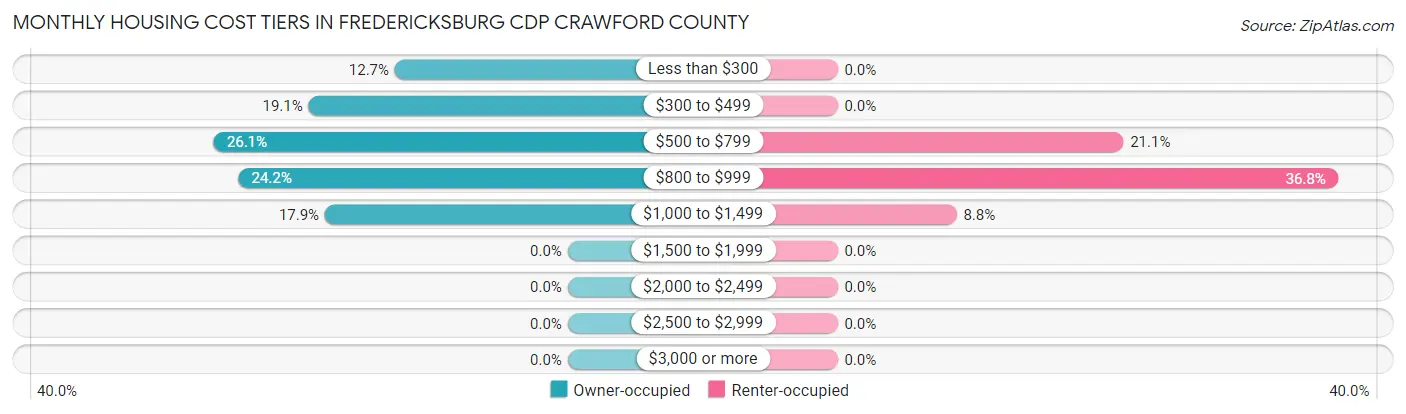
| Monthly Cost | Owner-occupied | Renter-occupied |
| Less than $300 | 42 (12.7%) | 0 (0.0%) |
| $300 to $499 | 63 (19.1%) | 0 (0.0%) |
| $500 to $799 | 86 (26.1%) | 12 (21.0%) |
| $800 to $999 | 80 (24.2%) | 21 (36.8%) |
| $1,000 to $1,499 | 59 (17.9%) | 5 (8.8%) |
| $1,500 to $1,999 | 0 (0.0%) | 0 (0.0%) |
| $2,000 to $2,499 | 0 (0.0%) | 0 (0.0%) |
| $2,500 to $2,999 | 0 (0.0%) | 0 (0.0%) |
| $3,000 or more | 0 (0.0%) | 0 (0.0%) |
| Total | 330 (100.0%) | 57 (100.0%) |
Physical Housing Characteristics in Fredericksburg CDP Crawford County
Housing Structures in Fredericksburg CDP Crawford County
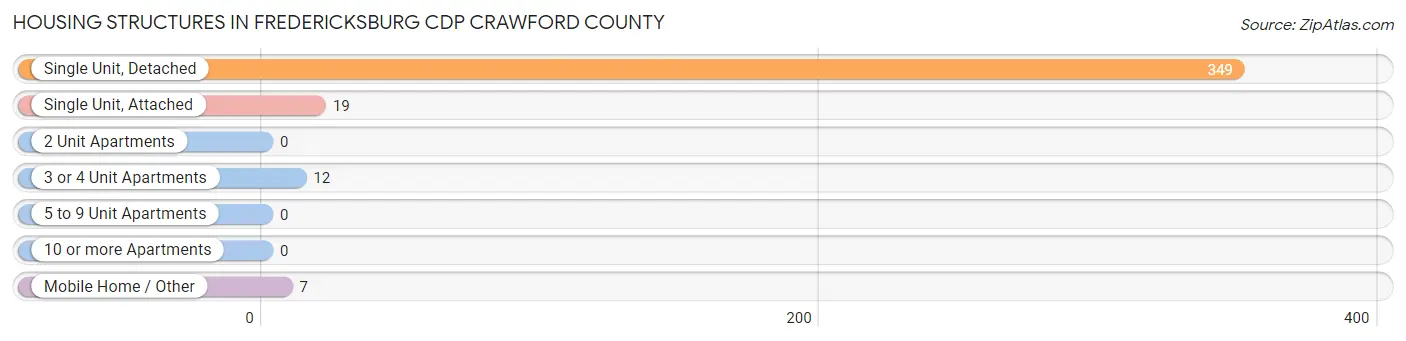
| Structure Type | # Housing Units | % Housing Units |
| Single Unit, Detached | 349 | 90.2% |
| Single Unit, Attached | 19 | 4.9% |
| 2 Unit Apartments | 0 | 0.0% |
| 3 or 4 Unit Apartments | 12 | 3.1% |
| 5 to 9 Unit Apartments | 0 | 0.0% |
| 10 or more Apartments | 0 | 0.0% |
| Mobile Home / Other | 7 | 1.8% |
| Total | 387 | 100.0% |
Housing Structures by Occupancy in Fredericksburg CDP Crawford County
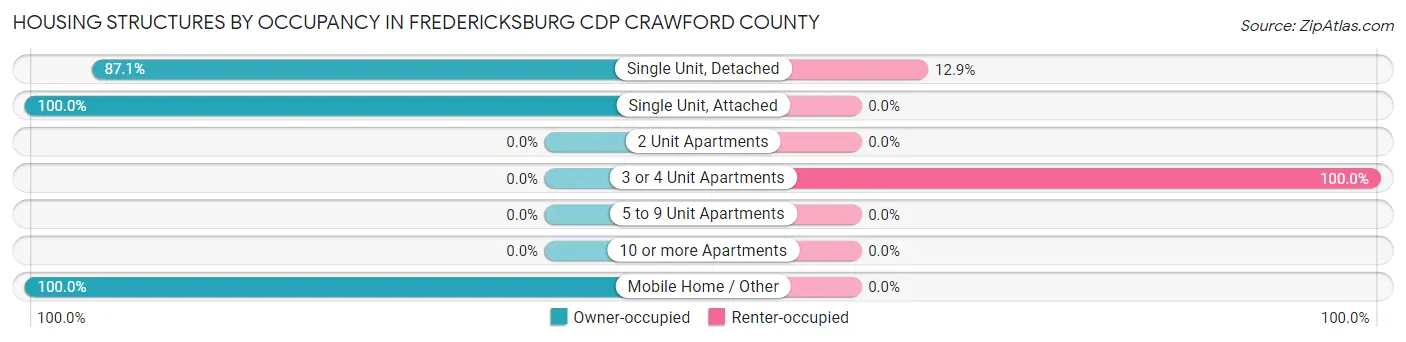
| Structure Type | Owner-occupied | Renter-occupied |
| Single Unit, Detached | 304 (87.1%) | 45 (12.9%) |
| Single Unit, Attached | 19 (100.0%) | 0 (0.0%) |
| 2 Unit Apartments | 0 (0.0%) | 0 (0.0%) |
| 3 or 4 Unit Apartments | 0 (0.0%) | 12 (100.0%) |
| 5 to 9 Unit Apartments | 0 (0.0%) | 0 (0.0%) |
| 10 or more Apartments | 0 (0.0%) | 0 (0.0%) |
| Mobile Home / Other | 7 (100.0%) | 0 (0.0%) |
| Total | 330 (85.3%) | 57 (14.7%) |
Housing Structures by Number of Rooms in Fredericksburg CDP Crawford County
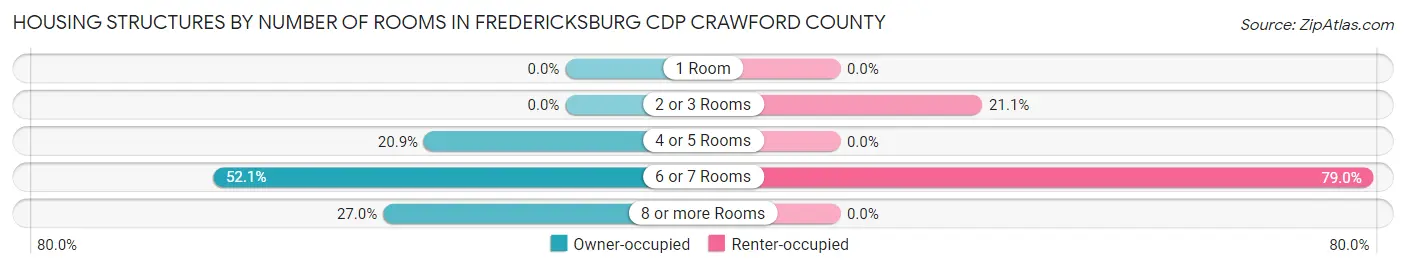
| Number of Rooms | Owner-occupied | Renter-occupied |
| 1 Room | 0 (0.0%) | 0 (0.0%) |
| 2 or 3 Rooms | 0 (0.0%) | 12 (21.0%) |
| 4 or 5 Rooms | 69 (20.9%) | 0 (0.0%) |
| 6 or 7 Rooms | 172 (52.1%) | 45 (78.9%) |
| 8 or more Rooms | 89 (27.0%) | 0 (0.0%) |
| Total | 330 (100.0%) | 57 (100.0%) |
Housing Structure by Heating Type in Fredericksburg CDP Crawford County
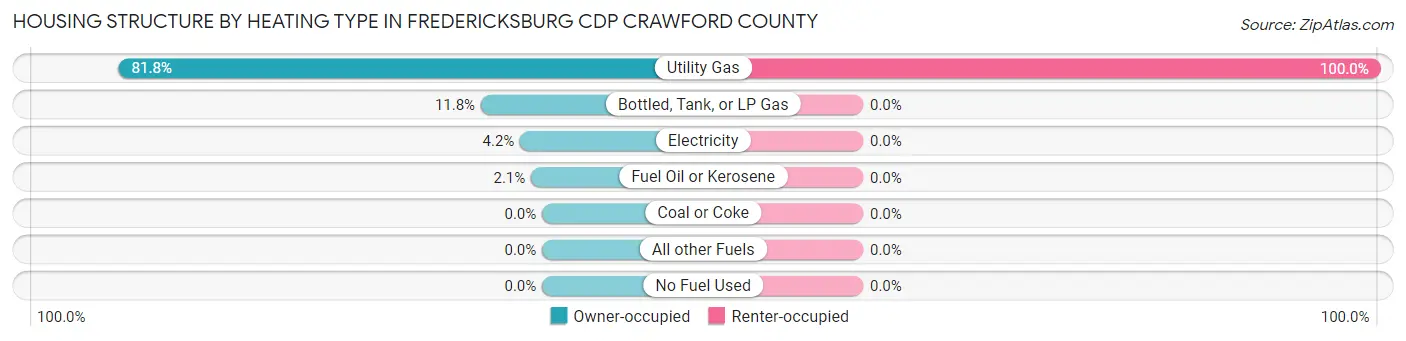
| Heating Type | Owner-occupied | Renter-occupied |
| Utility Gas | 270 (81.8%) | 57 (100.0%) |
| Bottled, Tank, or LP Gas | 39 (11.8%) | 0 (0.0%) |
| Electricity | 14 (4.2%) | 0 (0.0%) |
| Fuel Oil or Kerosene | 7 (2.1%) | 0 (0.0%) |
| Coal or Coke | 0 (0.0%) | 0 (0.0%) |
| All other Fuels | 0 (0.0%) | 0 (0.0%) |
| No Fuel Used | 0 (0.0%) | 0 (0.0%) |
| Total | 330 (100.0%) | 57 (100.0%) |
Household Vehicle Usage in Fredericksburg CDP Crawford County
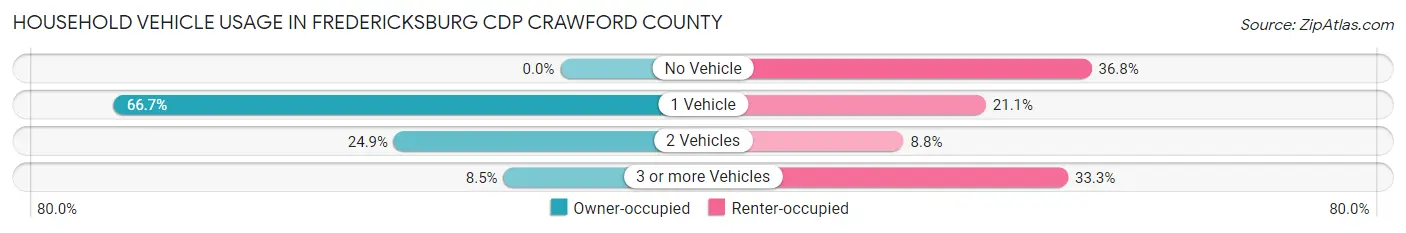
| Vehicles per Household | Owner-occupied | Renter-occupied |
| No Vehicle | 0 (0.0%) | 21 (36.8%) |
| 1 Vehicle | 220 (66.7%) | 12 (21.0%) |
| 2 Vehicles | 82 (24.8%) | 5 (8.8%) |
| 3 or more Vehicles | 28 (8.5%) | 19 (33.3%) |
| Total | 330 (100.0%) | 57 (100.0%) |
Real Estate & Mortgages in Fredericksburg CDP Crawford County
Real Estate and Mortgage Overview in Fredericksburg CDP Crawford County
| Characteristic | Without Mortgage | With Mortgage |
| Housing Units | 113 | 217 |
| Median Property Value | $96,000 | $93,500 |
| Median Household Income | $73,365 | $42 |
| Monthly Housing Costs | $349 | $0 |
| Real Estate Taxes | $1,344 | $0 |
Property Value by Mortgage Status in Fredericksburg CDP Crawford County
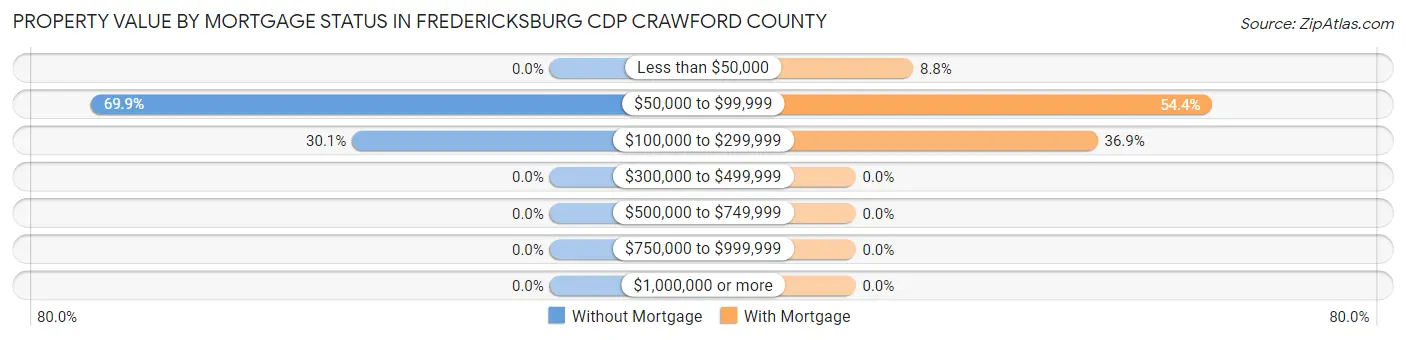
| Property Value | Without Mortgage | With Mortgage |
| Less than $50,000 | 0 (0.0%) | 19 (8.8%) |
| $50,000 to $99,999 | 79 (69.9%) | 118 (54.4%) |
| $100,000 to $299,999 | 34 (30.1%) | 80 (36.9%) |
| $300,000 to $499,999 | 0 (0.0%) | 0 (0.0%) |
| $500,000 to $749,999 | 0 (0.0%) | 0 (0.0%) |
| $750,000 to $999,999 | 0 (0.0%) | 0 (0.0%) |
| $1,000,000 or more | 0 (0.0%) | 0 (0.0%) |
| Total | 113 (100.0%) | 217 (100.0%) |
Household Income by Mortgage Status in Fredericksburg CDP Crawford County
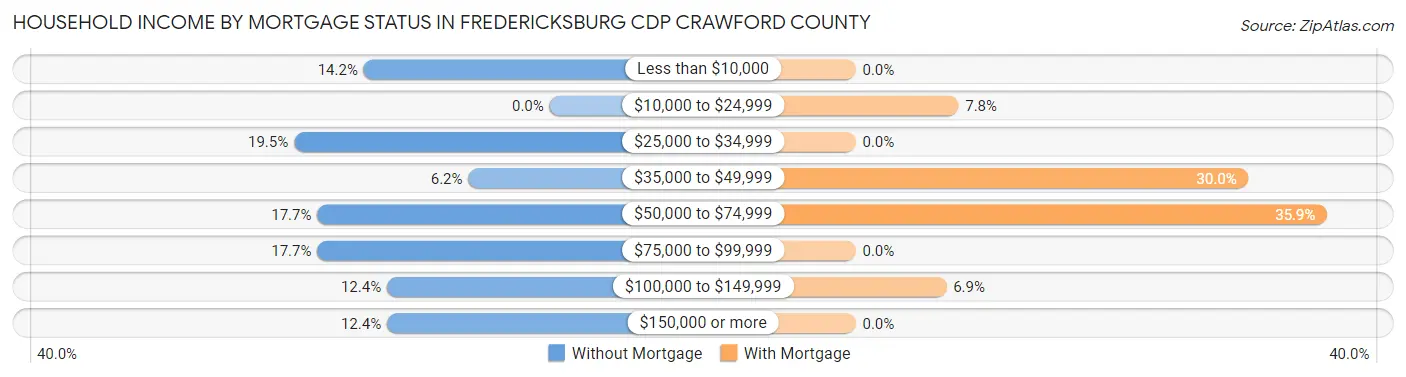
| Household Income | Without Mortgage | With Mortgage |
| Less than $10,000 | 16 (14.2%) | 0 (0.0%) |
| $10,000 to $24,999 | 0 (0.0%) | 17 (7.8%) |
| $25,000 to $34,999 | 22 (19.5%) | 0 (0.0%) |
| $35,000 to $49,999 | 7 (6.2%) | 65 (29.9%) |
| $50,000 to $74,999 | 20 (17.7%) | 78 (35.9%) |
| $75,000 to $99,999 | 20 (17.7%) | 0 (0.0%) |
| $100,000 to $149,999 | 14 (12.4%) | 15 (6.9%) |
| $150,000 or more | 14 (12.4%) | 0 (0.0%) |
| Total | 113 (100.0%) | 217 (100.0%) |
Property Value to Household Income Ratio in Fredericksburg CDP Crawford County
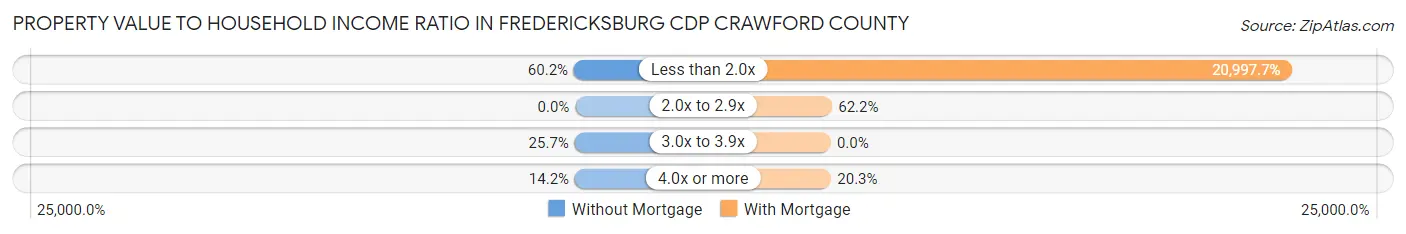
| Value-to-Income Ratio | Without Mortgage | With Mortgage |
| Less than 2.0x | 68 (60.2%) | 45,565 (20,997.7%) |
| 2.0x to 2.9x | 0 (0.0%) | 135 (62.2%) |
| 3.0x to 3.9x | 29 (25.7%) | 0 (0.0%) |
| 4.0x or more | 16 (14.2%) | 44 (20.3%) |
| Total | 113 (100.0%) | 217 (100.0%) |
Real Estate Taxes by Mortgage Status in Fredericksburg CDP Crawford County
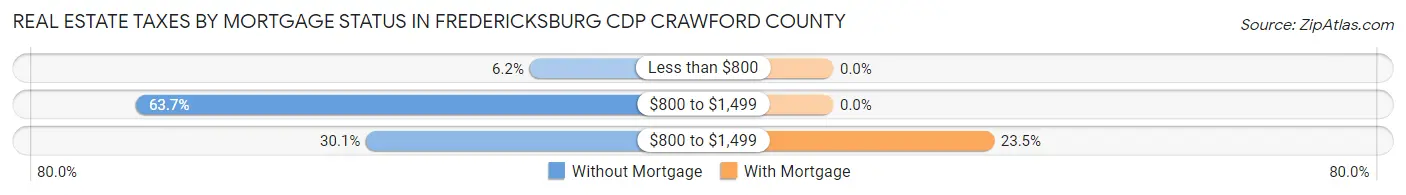
| Property Taxes | Without Mortgage | With Mortgage |
| Less than $800 | 7 (6.2%) | 0 (0.0%) |
| $800 to $1,499 | 72 (63.7%) | 0 (0.0%) |
| $800 to $1,499 | 34 (30.1%) | 51 (23.5%) |
| Total | 113 (100.0%) | 217 (100.0%) |
Health & Disability in Fredericksburg CDP Crawford County
Health Insurance Coverage by Age in Fredericksburg CDP Crawford County
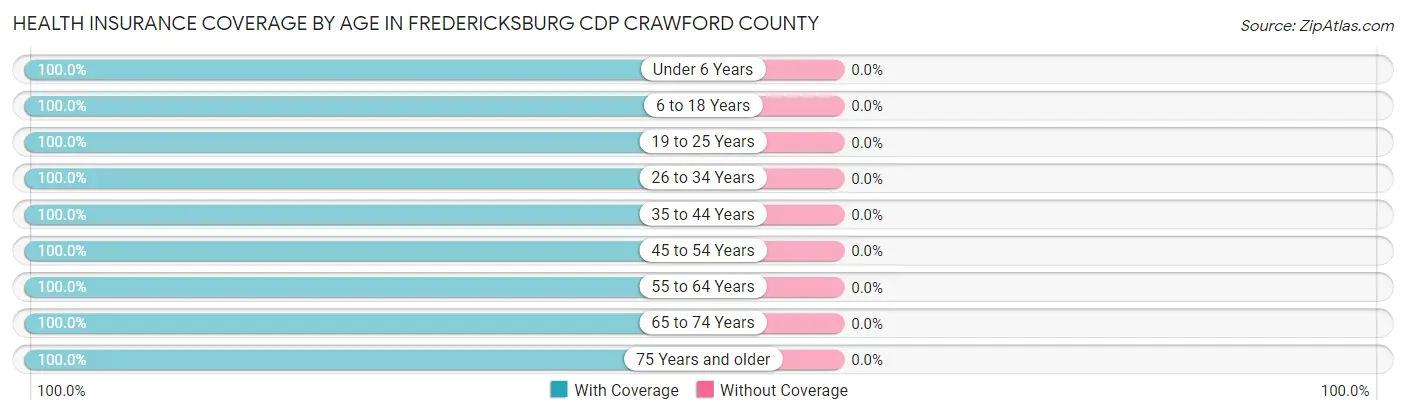
| Age Bracket | With Coverage | Without Coverage |
| Under 6 Years | 52 (100.0%) | 0 (0.0%) |
| 6 to 18 Years | 254 (100.0%) | 0 (0.0%) |
| 19 to 25 Years | 47 (100.0%) | 0 (0.0%) |
| 26 to 34 Years | 61 (100.0%) | 0 (0.0%) |
| 35 to 44 Years | 158 (100.0%) | 0 (0.0%) |
| 45 to 54 Years | 101 (100.0%) | 0 (0.0%) |
| 55 to 64 Years | 141 (100.0%) | 0 (0.0%) |
| 65 to 74 Years | 57 (100.0%) | 0 (0.0%) |
| 75 Years and older | 164 (100.0%) | 0 (0.0%) |
| Total | 1,035 (100.0%) | 0 (0.0%) |
Health Insurance Coverage by Citizenship Status in Fredericksburg CDP Crawford County
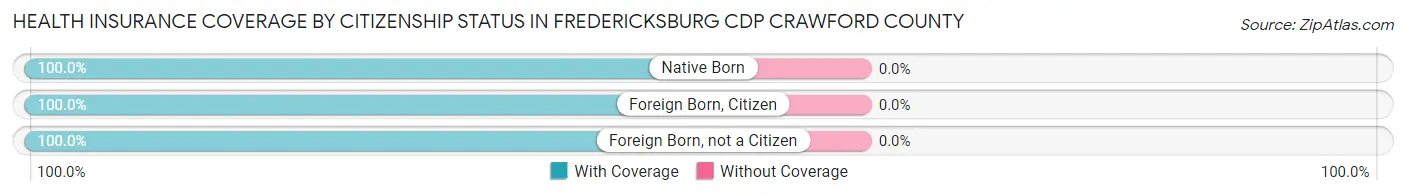
| Citizenship Status | With Coverage | Without Coverage |
| Native Born | 52 (100.0%) | 0 (0.0%) |
| Foreign Born, Citizen | 254 (100.0%) | 0 (0.0%) |
| Foreign Born, not a Citizen | 47 (100.0%) | 0 (0.0%) |
Health Insurance Coverage by Household Income in Fredericksburg CDP Crawford County
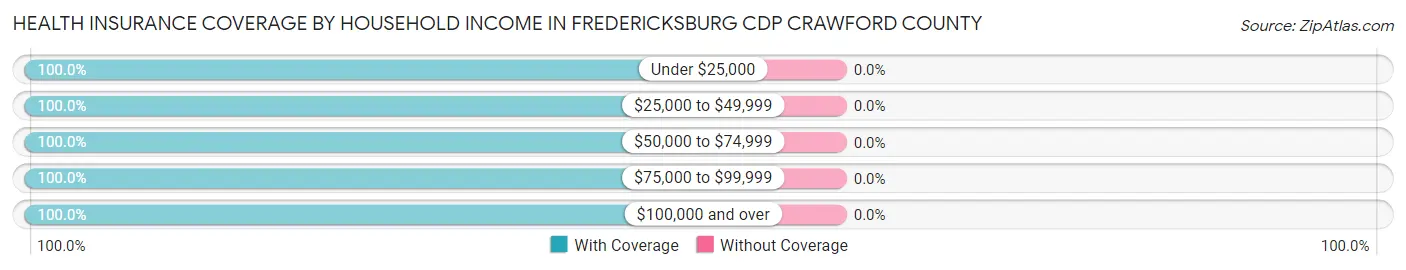
| Household Income | With Coverage | Without Coverage |
| Under $25,000 | 54 (100.0%) | 0 (0.0%) |
| $25,000 to $49,999 | 529 (100.0%) | 0 (0.0%) |
| $50,000 to $74,999 | 106 (100.0%) | 0 (0.0%) |
| $75,000 to $99,999 | 156 (100.0%) | 0 (0.0%) |
| $100,000 and over | 190 (100.0%) | 0 (0.0%) |
Public vs Private Health Insurance Coverage by Age in Fredericksburg CDP Crawford County
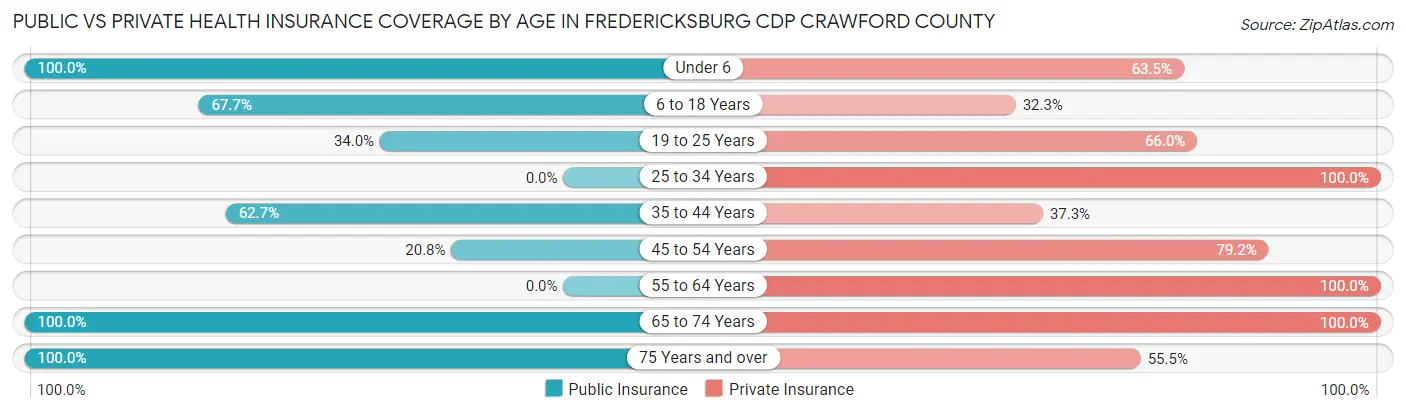
| Age Bracket | Public Insurance | Private Insurance |
| Under 6 | 52 (100.0%) | 33 (63.5%) |
| 6 to 18 Years | 172 (67.7%) | 82 (32.3%) |
| 19 to 25 Years | 16 (34.0%) | 31 (66.0%) |
| 25 to 34 Years | 0 (0.0%) | 61 (100.0%) |
| 35 to 44 Years | 99 (62.7%) | 59 (37.3%) |
| 45 to 54 Years | 21 (20.8%) | 80 (79.2%) |
| 55 to 64 Years | 0 (0.0%) | 141 (100.0%) |
| 65 to 74 Years | 57 (100.0%) | 57 (100.0%) |
| 75 Years and over | 164 (100.0%) | 91 (55.5%) |
| Total | 581 (56.1%) | 635 (61.4%) |
Disability Status by Sex by Age in Fredericksburg CDP Crawford County
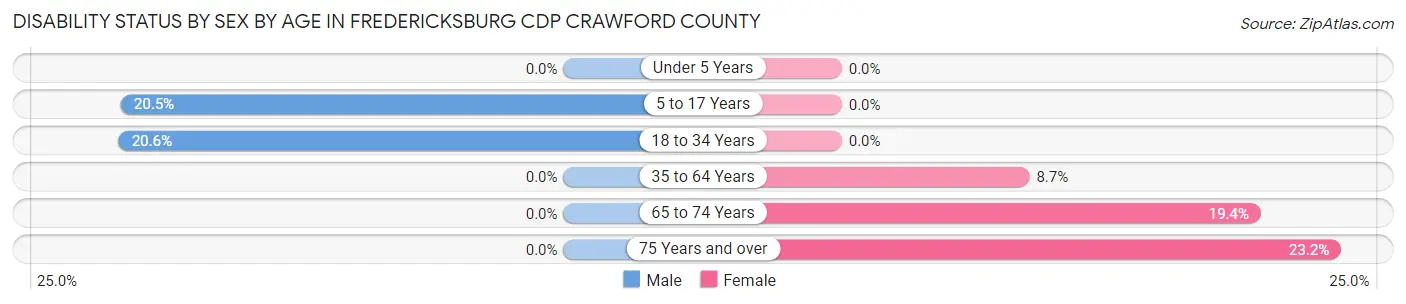
| Age Bracket | Male | Female |
| Under 5 Years | 0 (0.0%) | 0 (0.0%) |
| 5 to 17 Years | 39 (20.5%) | 0 (0.0%) |
| 18 to 34 Years | 13 (20.6%) | 0 (0.0%) |
| 35 to 64 Years | 0 (0.0%) | 21 (8.7%) |
| 65 to 74 Years | 0 (0.0%) | 7 (19.4%) |
| 75 Years and over | 0 (0.0%) | 19 (23.2%) |
Disability Class by Sex by Age in Fredericksburg CDP Crawford County
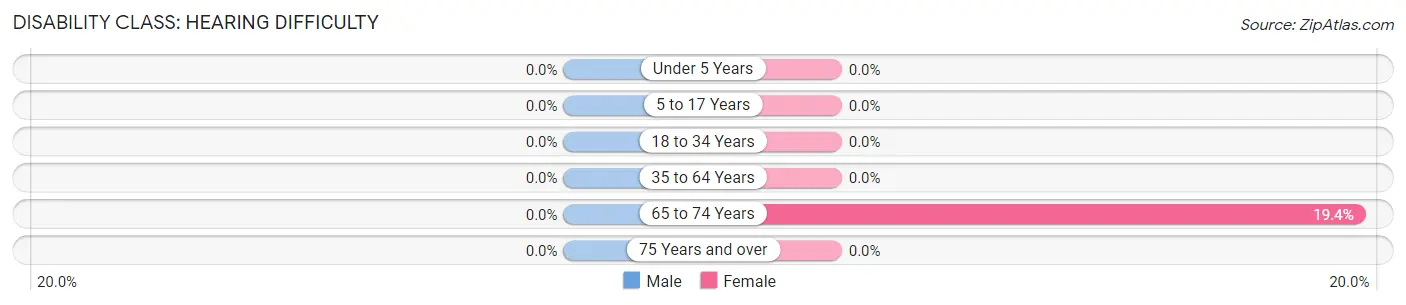
Disability Class: Hearing Difficulty
| Age Bracket | Male | Female |
| Under 5 Years | 0 (0.0%) | 0 (0.0%) |
| 5 to 17 Years | 0 (0.0%) | 0 (0.0%) |
| 18 to 34 Years | 0 (0.0%) | 0 (0.0%) |
| 35 to 64 Years | 0 (0.0%) | 0 (0.0%) |
| 65 to 74 Years | 0 (0.0%) | 7 (19.4%) |
| 75 Years and over | 0 (0.0%) | 0 (0.0%) |
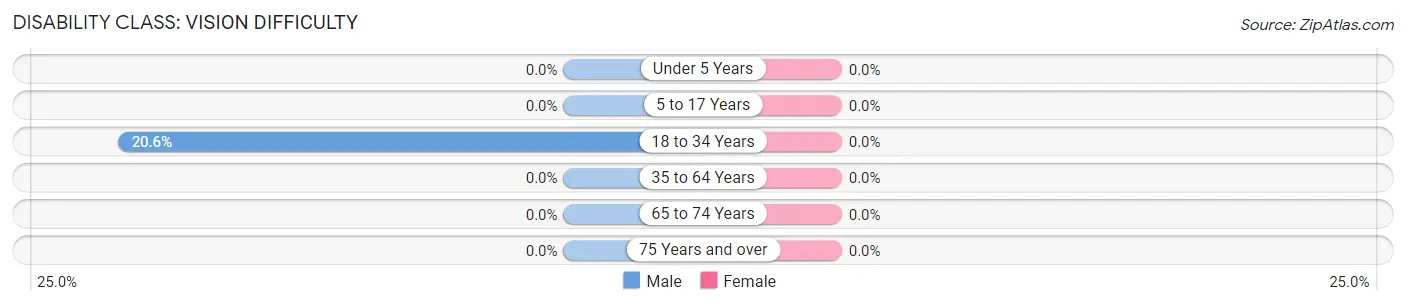
Disability Class: Vision Difficulty
| Age Bracket | Male | Female |
| Under 5 Years | 0 (0.0%) | 0 (0.0%) |
| 5 to 17 Years | 0 (0.0%) | 0 (0.0%) |
| 18 to 34 Years | 13 (20.6%) | 0 (0.0%) |
| 35 to 64 Years | 0 (0.0%) | 0 (0.0%) |
| 65 to 74 Years | 0 (0.0%) | 0 (0.0%) |
| 75 Years and over | 0 (0.0%) | 0 (0.0%) |
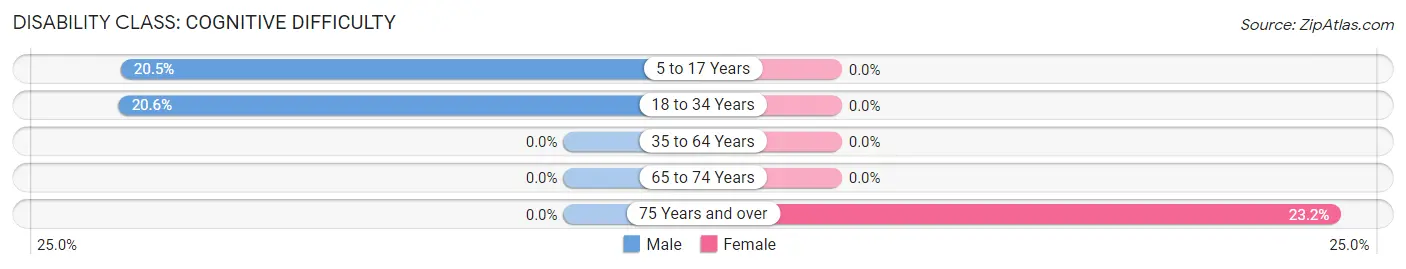
Disability Class: Cognitive Difficulty
| Age Bracket | Male | Female |
| 5 to 17 Years | 39 (20.5%) | 0 (0.0%) |
| 18 to 34 Years | 13 (20.6%) | 0 (0.0%) |
| 35 to 64 Years | 0 (0.0%) | 0 (0.0%) |
| 65 to 74 Years | 0 (0.0%) | 0 (0.0%) |
| 75 Years and over | 0 (0.0%) | 19 (23.2%) |
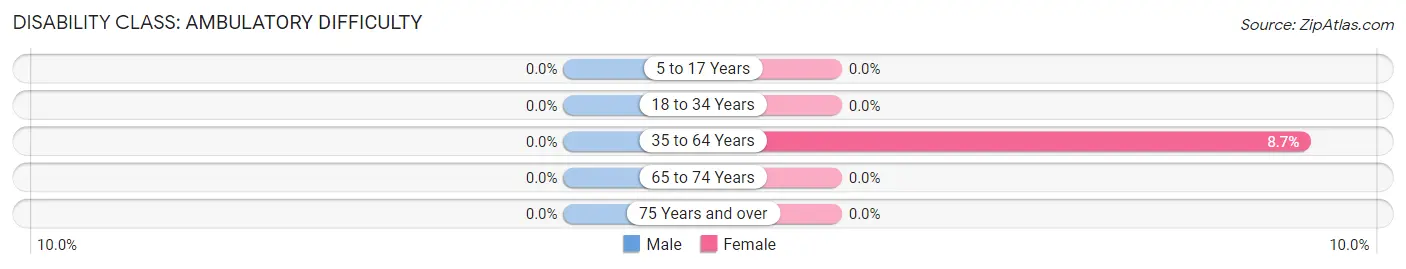
Disability Class: Ambulatory Difficulty
| Age Bracket | Male | Female |
| 5 to 17 Years | 0 (0.0%) | 0 (0.0%) |
| 18 to 34 Years | 0 (0.0%) | 0 (0.0%) |
| 35 to 64 Years | 0 (0.0%) | 21 (8.7%) |
| 65 to 74 Years | 0 (0.0%) | 0 (0.0%) |
| 75 Years and over | 0 (0.0%) | 0 (0.0%) |
Disability Class: Self-Care Difficulty
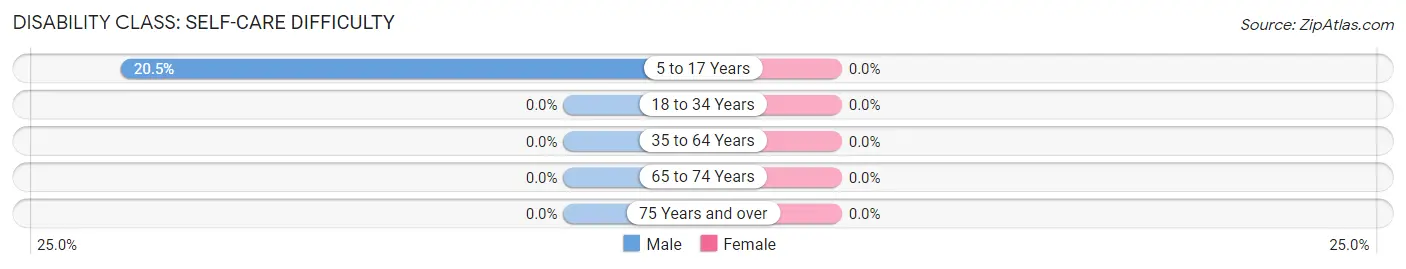
| Age Bracket | Male | Female |
| 5 to 17 Years | 39 (20.5%) | 0 (0.0%) |
| 18 to 34 Years | 0 (0.0%) | 0 (0.0%) |
| 35 to 64 Years | 0 (0.0%) | 0 (0.0%) |
| 65 to 74 Years | 0 (0.0%) | 0 (0.0%) |
| 75 Years and over | 0 (0.0%) | 0 (0.0%) |
Technology Access in Fredericksburg CDP Crawford County
Computing Device Access in Fredericksburg CDP Crawford County
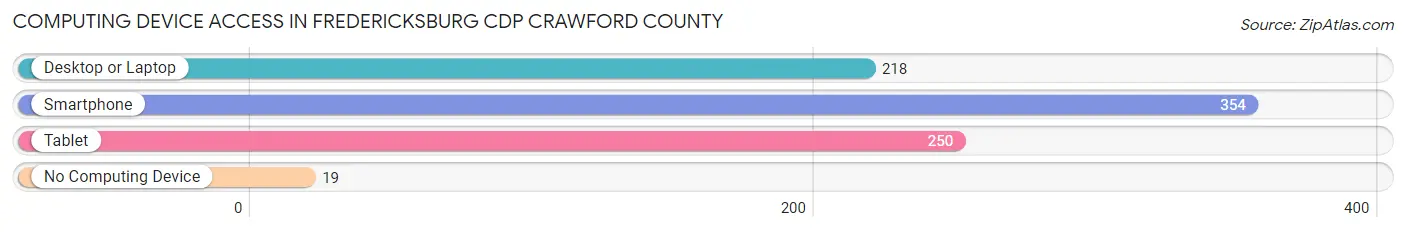
| Device Type | # Households | % Households |
| Desktop or Laptop | 218 | 56.3% |
| Smartphone | 354 | 91.5% |
| Tablet | 250 | 64.6% |
| No Computing Device | 19 | 4.9% |
| Total | 387 | 100.0% |
Internet Access in Fredericksburg CDP Crawford County
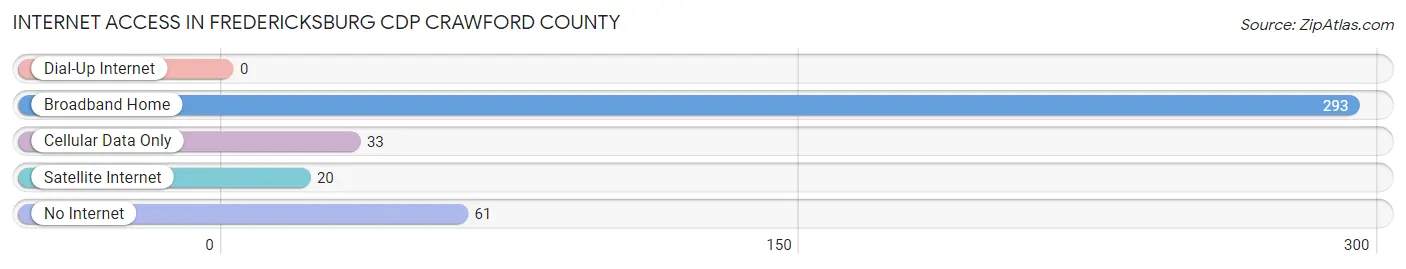
| Internet Type | # Households | % Households |
| Dial-Up Internet | 0 | 0.0% |
| Broadband Home | 293 | 75.7% |
| Cellular Data Only | 33 | 8.5% |
| Satellite Internet | 20 | 5.2% |
| No Internet | 61 | 15.8% |
| Total | 387 | 100.0% |
Fredericksburg CDP Crawford County Summary
Fredericksburg Cdp is a census-designated place (CDP) located in Crawford County, Pennsylvania. It is situated in the northwestern corner of the county, near the border with Erie County. The population of Fredericksburg Cdp was 1,845 at the 2010 census.
History
The area that is now Fredericksburg Cdp was first settled in the early 1800s by German immigrants. The town was originally known as “Friedrichsburg”, after the German word for “Frederick”. The town was officially incorporated in 1845, and the name was changed to Fredericksburg.
The town grew steadily throughout the 19th century, and by the early 20th century, it had become a thriving community. The town was home to several businesses, including a sawmill, a grist mill, a tannery, and a brickyard.
In the late 19th century, the town was connected to the rest of the county by the Erie and Pittsburgh Railroad. This allowed for the transportation of goods and people to and from the town.
Geography
Fredericksburg Cdp is located at 41°25'25"N 79°59'45"W (41.423, -79.996). It is situated in the northwestern corner of Crawford County, near the border with Erie County.
The town is located in a rural area, with rolling hills and forests. The nearest major city is Erie, which is located about 25 miles to the north.
The total area of Fredericksburg Cdp is 4 2 square miles all of which is land
Demographics
As of the 2010 census, there were 1,845 people, 745 households, and 517 families residing in Fredericksburg Cdp. The population density was 439.2 people per square mile.
The racial makeup of the town was 97.2% White, 0.7% African American, 0.2% Native American, 0.2% Asian, 0.1% Pacific Islander, 0.4% from other races, and 1.2% from two or more races. Hispanic or Latino of any race were 1.2% of the population.
There were 745 households, out of which 28.2% had children under the age of 18 living with them, 51.2% were married couples living together, 11.2% had a female householder with no husband present, and 32.2% were non-families. 27.2% of all households were made up of individuals, and 13.2% had someone living alone who was 65 years of age or older. The average household size was 2.47 and the average family size was 2.97.
The median age in the town was 43.2 years. 22.2% of residents were under the age of 18; 7.2% were between the ages of 18 and 24; 23.2% were from 25 to 44; 29.2% were from 45 to 64; and 18.2% were 65 years of age or older. The gender makeup of the town was 48.2% male and 51.8% female.
Economy
The economy of Fredericksburg Cdp is largely based on agriculture. The town is home to several farms, which produce a variety of crops, including corn, soybeans, hay, and wheat.
The town is also home to several small businesses, including a grocery store, a hardware store, and a few restaurants.
The nearest major city is Erie, which is located about 25 miles to the north. The city is home to several large employers, including GE Transportation, UPMC Hamot, and Saint Vincent Hospital.
Conclusion
Fredericksburg Cdp is a small, rural town located in Crawford County, Pennsylvania. The town has a long history, dating back to the early 1800s. The town is largely agricultural, with several farms producing a variety of crops. The town is also home to several small businesses, and is located near the larger city of Erie. The population of Fredericksburg Cdp was 1,845 at the 2010 census.
Common Questions
What is Per Capita Income in Fredericksburg CDP Crawford County?
Per Capita income in Fredericksburg CDP Crawford County is $27,270.
What is the Median Family Income in Fredericksburg CDP Crawford County?
Median Family Income in Fredericksburg CDP Crawford County is $47,083.
What is the Median Household income in Fredericksburg CDP Crawford County?
Median Household Income in Fredericksburg CDP Crawford County is $47,113.
What is Income or Wage Gap in Fredericksburg CDP Crawford County?
Income or Wage Gap in Fredericksburg CDP Crawford County is 11.8%.
Women in Fredericksburg CDP Crawford County earn 88.2 cents for every dollar earned by a man.
What is Inequality or Gini Index in Fredericksburg CDP Crawford County?
Inequality or Gini Index in Fredericksburg CDP Crawford County is 0.41.
What is the Total Population of Fredericksburg CDP Crawford County?
Total Population of Fredericksburg CDP Crawford County is 1,035.
What is the Total Male Population of Fredericksburg CDP Crawford County?
Total Male Population of Fredericksburg CDP Crawford County is 515.
What is the Total Female Population of Fredericksburg CDP Crawford County?
Total Female Population of Fredericksburg CDP Crawford County is 520.
What is the Ratio of Males per 100 Females in Fredericksburg CDP Crawford County?
There are 99.04 Males per 100 Females in Fredericksburg CDP Crawford County.
What is the Ratio of Females per 100 Males in Fredericksburg CDP Crawford County?
There are 100.97 Females per 100 Males in Fredericksburg CDP Crawford County.
What is the Median Population Age in Fredericksburg CDP Crawford County?
Median Population Age in Fredericksburg CDP Crawford County is 40.1 Years.
What is the Average Family Size in Fredericksburg CDP Crawford County
Average Family Size in Fredericksburg CDP Crawford County is 3.4 People.
What is the Average Household Size in Fredericksburg CDP Crawford County
Average Household Size in Fredericksburg CDP Crawford County is 2.7 People.
How Large is the Labor Force in Fredericksburg CDP Crawford County?
There are 449 People in the Labor Forcein in Fredericksburg CDP Crawford County.
What is the Percentage of People in the Labor Force in Fredericksburg CDP Crawford County?
59.6% of People are in the Labor Force in Fredericksburg CDP Crawford County.