Republic, PA Map & Demographics
Republic Map
Republic Overview
$25,437
PER CAPITA INCOME
$52,583
AVG FAMILY INCOME
$52,610
AVG HOUSEHOLD INCOME
10.5%
WAGE / INCOME GAP [ % ]
89.5¢/ $1
WAGE / INCOME GAP [ $ ]
0.42
INEQUALITY / GINI INDEX
1,324
TOTAL POPULATION
693
MALE POPULATION
631
FEMALE POPULATION
109.83
MALES / 100 FEMALES
91.05
FEMALES / 100 MALES
34.3
MEDIAN AGE
3.1
AVG FAMILY SIZE
2.4
AVG HOUSEHOLD SIZE
602
LABOR FORCE [ PEOPLE ]
55.5%
PERCENT IN LABOR FORCE
14.5%
UNEMPLOYMENT RATE
Republic Zip Codes
Republic Area Codes
Income in Republic
Income Overview in Republic
Per Capita Income in Republic is $25,437, while median incomes of families and households are $52,583 and $52,610 respectively.
| Characteristic | Number | Measure |
| Per Capita Income | 1,324 | $25,437 |
| Median Family Income | 323 | $52,583 |
| Mean Family Income | 323 | $68,309 |
| Median Household Income | 557 | $52,610 |
| Mean Household Income | 557 | $59,819 |
| Income Deficit | 323 | $0 |
| Wage / Income Gap (%) | 1,324 | 10.47% |
| Wage / Income Gap ($) | 1,324 | 89.53¢ per $1 |
| Gini / Inequality Index | 1,324 | 0.42 |
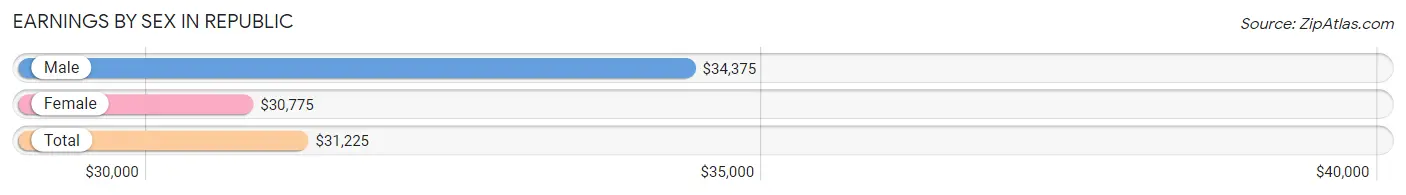
Earnings by Sex in Republic
Average Earnings in Republic are $31,225, $34,375 for men and $30,775 for women, a difference of 10.5%.
| Sex | Number | Average Earnings |
| Male | 308 (50.7%) | $34,375 |
| Female | 299 (49.3%) | $30,775 |
| Total | 607 (100.0%) | $31,225 |
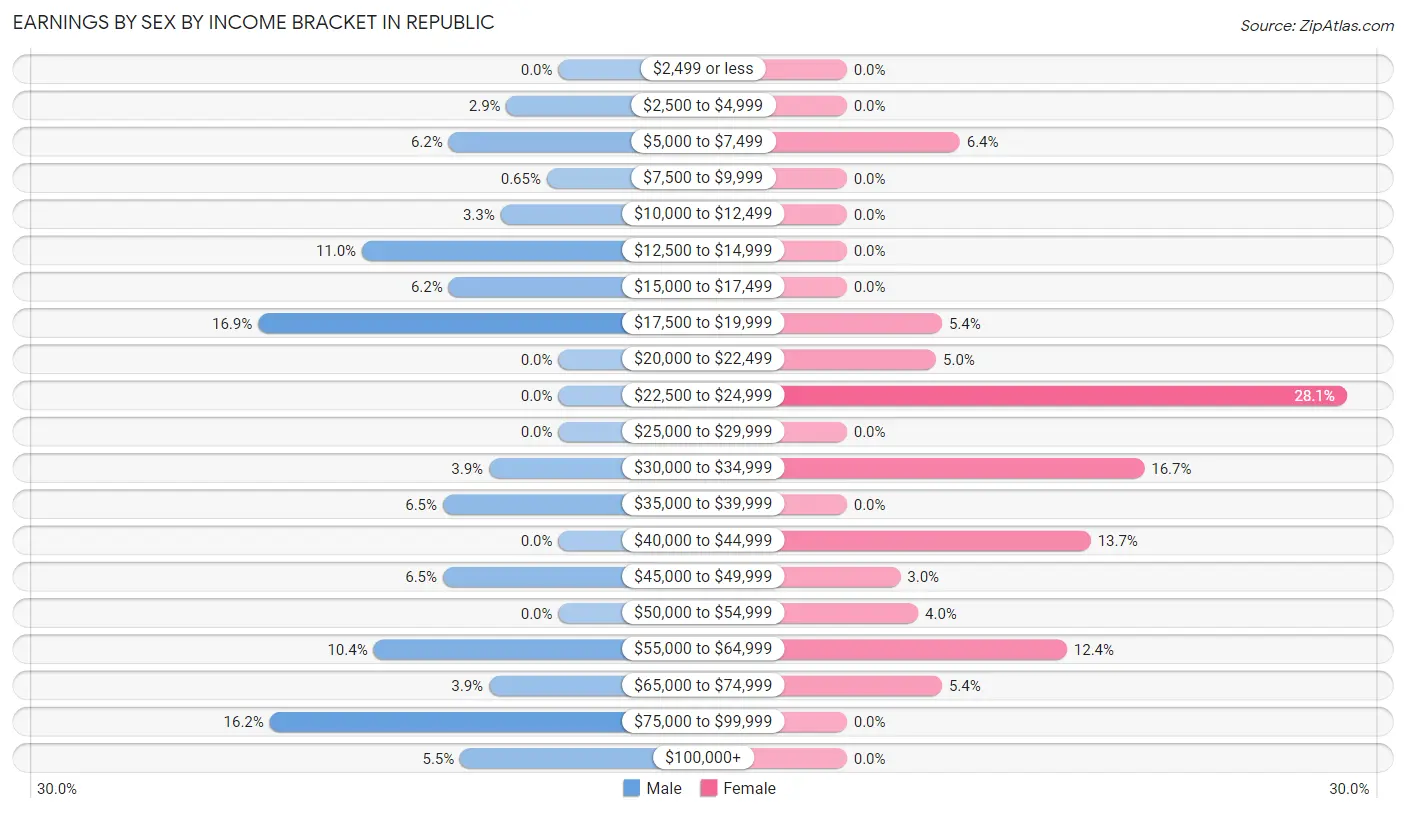
Earnings by Sex by Income Bracket in Republic
The most common earnings brackets in Republic are $17,500 to $19,999 for men (52 | 16.9%) and $22,500 to $24,999 for women (84 | 28.1%).
| Income | Male | Female |
| $2,499 or less | 0 (0.0%) | 0 (0.0%) |
| $2,500 to $4,999 | 9 (2.9%) | 0 (0.0%) |
| $5,000 to $7,499 | 19 (6.2%) | 19 (6.4%) |
| $7,500 to $9,999 | 2 (0.6%) | 0 (0.0%) |
| $10,000 to $12,499 | 10 (3.3%) | 0 (0.0%) |
| $12,500 to $14,999 | 34 (11.0%) | 0 (0.0%) |
| $15,000 to $17,499 | 19 (6.2%) | 0 (0.0%) |
| $17,500 to $19,999 | 52 (16.9%) | 16 (5.3%) |
| $20,000 to $22,499 | 0 (0.0%) | 15 (5.0%) |
| $22,500 to $24,999 | 0 (0.0%) | 84 (28.1%) |
| $25,000 to $29,999 | 0 (0.0%) | 0 (0.0%) |
| $30,000 to $34,999 | 12 (3.9%) | 50 (16.7%) |
| $35,000 to $39,999 | 20 (6.5%) | 0 (0.0%) |
| $40,000 to $44,999 | 0 (0.0%) | 41 (13.7%) |
| $45,000 to $49,999 | 20 (6.5%) | 9 (3.0%) |
| $50,000 to $54,999 | 0 (0.0%) | 12 (4.0%) |
| $55,000 to $64,999 | 32 (10.4%) | 37 (12.4%) |
| $65,000 to $74,999 | 12 (3.9%) | 16 (5.3%) |
| $75,000 to $99,999 | 50 (16.2%) | 0 (0.0%) |
| $100,000+ | 17 (5.5%) | 0 (0.0%) |
| Total | 308 (100.0%) | 299 (100.0%) |
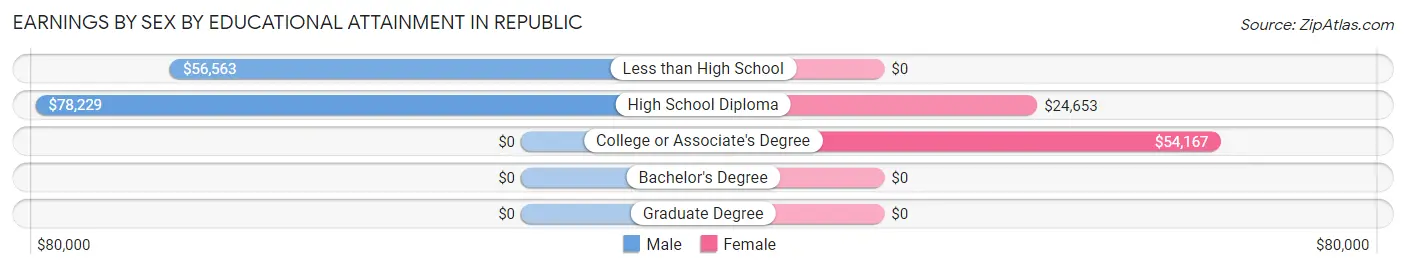
Earnings by Sex by Educational Attainment in Republic
Average earnings in Republic are $58,750 for men and $31,061 for women, a difference of 47.1%. Men with an educational attainment of high school diploma enjoy the highest average annual earnings of $78,229, while those with less than high school education earn the least with $56,563. Women with an educational attainment of college or associate's degree earn the most with the average annual earnings of $54,167, while those with high school diploma education have the smallest earnings of $24,653.
| Educational Attainment | Male Income | Female Income |
| Less than High School | $56,563 | $0 |
| High School Diploma | $78,229 | $24,653 |
| College or Associate's Degree | - | - |
| Bachelor's Degree | - | - |
| Graduate Degree | - | - |
| Total | $58,750 | $31,061 |
Family Income in Republic
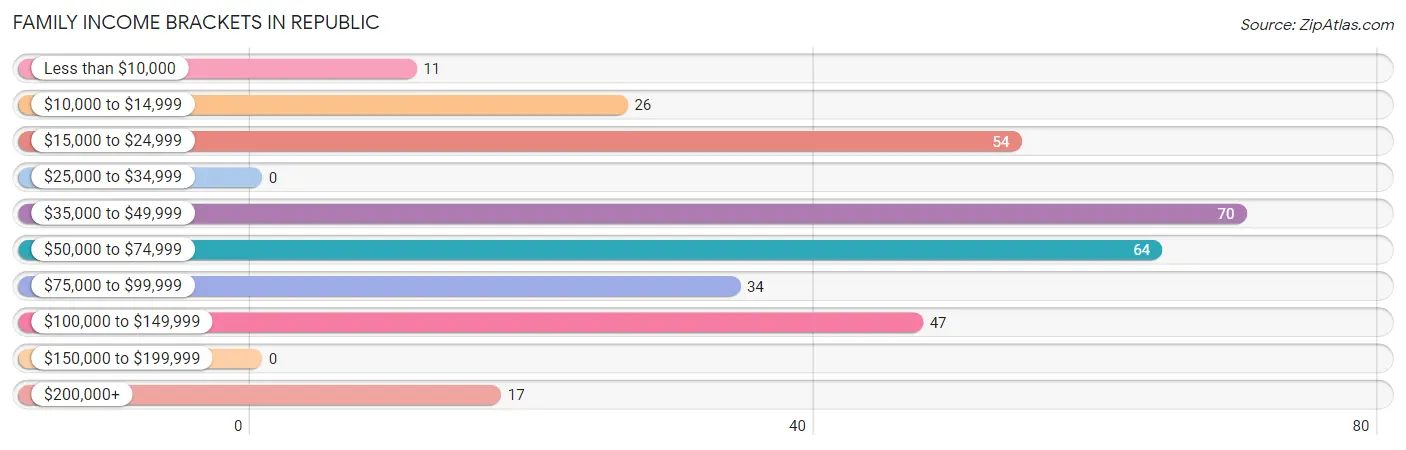
Family Income Brackets in Republic
According to the Republic family income data, there are 70 families falling into the $35,000 to $49,999 income range, which is the most common income bracket and makes up 21.7% of all families.
| Income Bracket | # Families | % Families |
| Less than $10,000 | 11 | 3.4% |
| $10,000 to $14,999 | 26 | 8.0% |
| $15,000 to $24,999 | 54 | 16.7% |
| $25,000 to $34,999 | 0 | 0.0% |
| $35,000 to $49,999 | 70 | 21.7% |
| $50,000 to $74,999 | 64 | 19.8% |
| $75,000 to $99,999 | 34 | 10.5% |
| $100,000 to $149,999 | 47 | 14.6% |
| $150,000 to $199,999 | 0 | 0.0% |
| $200,000+ | 17 | 5.3% |
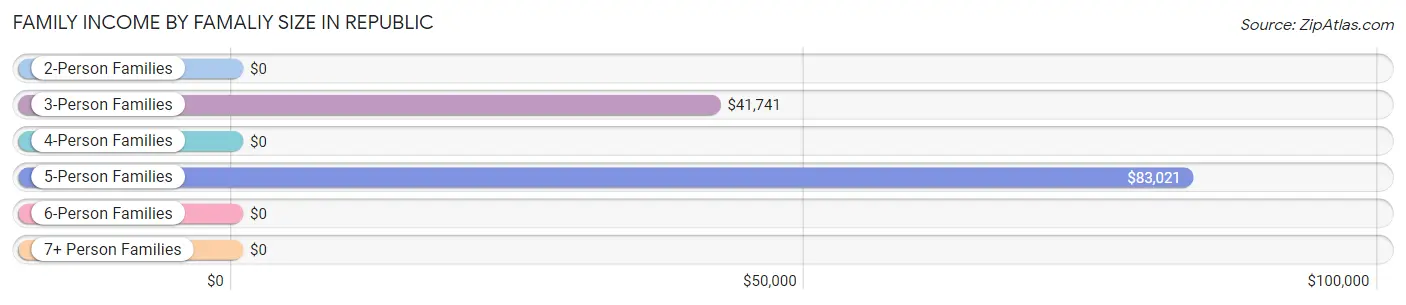
Family Income by Famaliy Size in Republic
5-person families (74 | 22.9%) account for the highest median family income in Republic with $83,021 per family, while 5-person families (74 | 22.9%) have the highest median income of $16,604 per family member.
| Income Bracket | # Families | Median Income |
| 2-Person Families | 123 (38.1%) | $0 |
| 3-Person Families | 89 (27.6%) | $41,741 |
| 4-Person Families | 37 (11.5%) | $0 |
| 5-Person Families | 74 (22.9%) | $83,021 |
| 6-Person Families | 0 (0.0%) | $0 |
| 7+ Person Families | 0 (0.0%) | $0 |
| Total | 323 (100.0%) | $52,583 |
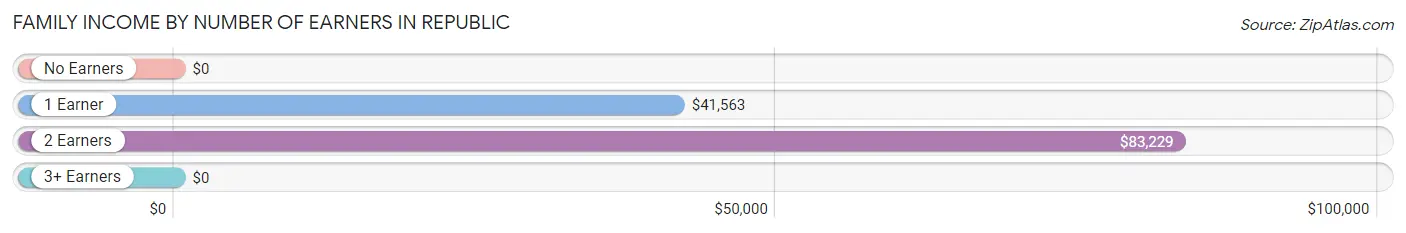
Family Income by Number of Earners in Republic
| Number of Earners | # Families | Median Income |
| No Earners | 73 (22.6%) | $0 |
| 1 Earner | 109 (33.8%) | $41,563 |
| 2 Earners | 100 (31.0%) | $83,229 |
| 3+ Earners | 41 (12.7%) | $0 |
| Total | 323 (100.0%) | $52,583 |
Household Income in Republic
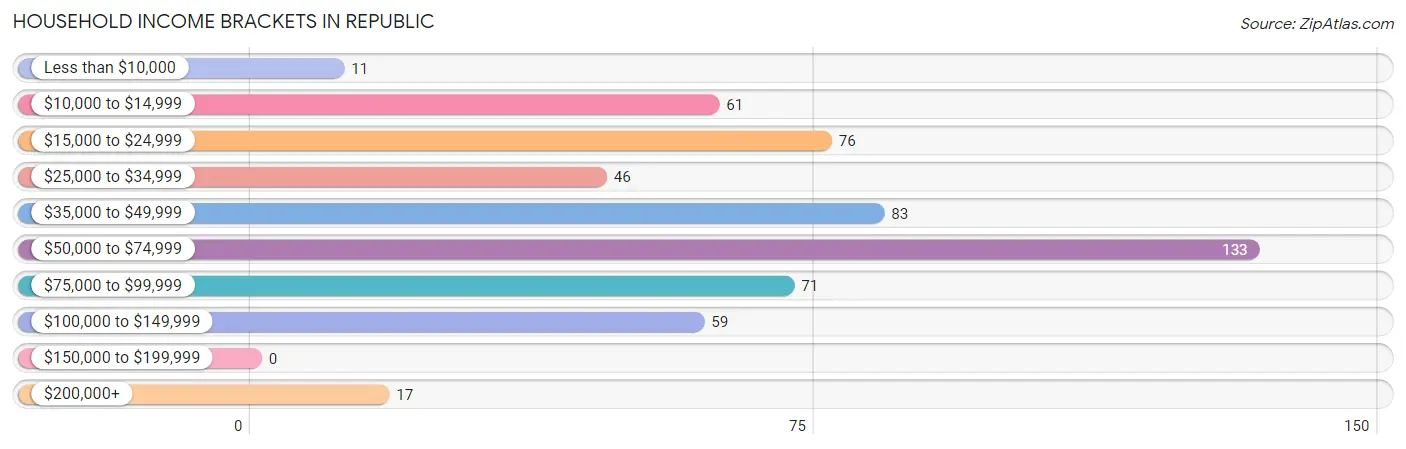
Household Income Brackets in Republic
With 133 households falling in the category, the $50,000 to $74,999 income range is the most frequent in Republic, accounting for 23.9% of all households.
| Income Bracket | # Households | % Households |
| Less than $10,000 | 11 | 2.0% |
| $10,000 to $14,999 | 61 | 11.0% |
| $15,000 to $24,999 | 76 | 13.6% |
| $25,000 to $34,999 | 46 | 8.3% |
| $35,000 to $49,999 | 83 | 14.9% |
| $50,000 to $74,999 | 133 | 23.9% |
| $75,000 to $99,999 | 71 | 12.7% |
| $100,000 to $149,999 | 59 | 10.6% |
| $150,000 to $199,999 | 0 | 0.0% |
| $200,000+ | 17 | 3.1% |
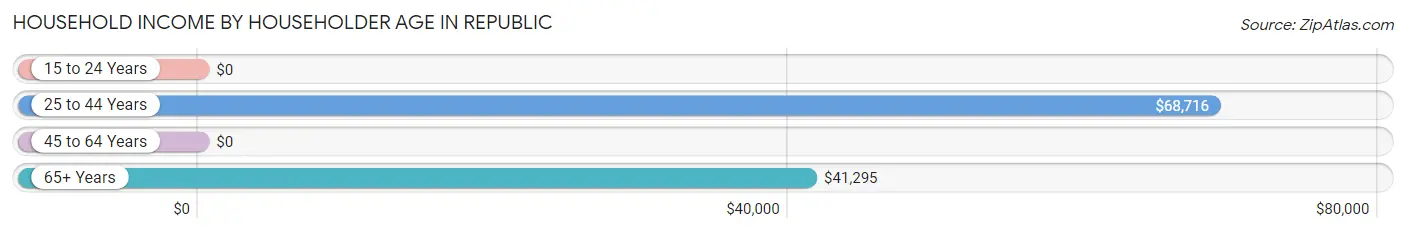
Household Income by Householder Age in Republic
The median household income in Republic is $52,610, with the highest median household income of $68,716 found in the 25 to 44 years age bracket for the primary householder. A total of 174 households (31.2%) fall into this category. Meanwhile, the 15 to 24 years age bracket for the primary householder has the lowest median household income of $0, with 30 households (5.4%) in this group.
| Income Bracket | # Households | Median Income |
| 15 to 24 Years | 30 (5.4%) | $0 |
| 25 to 44 Years | 174 (31.2%) | $68,716 |
| 45 to 64 Years | 160 (28.7%) | $0 |
| 65+ Years | 193 (34.6%) | $41,295 |
| Total | 557 (100.0%) | $52,610 |
Poverty in Republic
Income Below Poverty by Sex and Age in Republic
With 10.4% poverty level for males and 21.4% for females among the residents of Republic, 45 to 54 year old males and 16 and 17 year old females are the most vulnerable to poverty, with 18 males (69.2%) and 18 females (100.0%) in their respective age groups living below the poverty level.
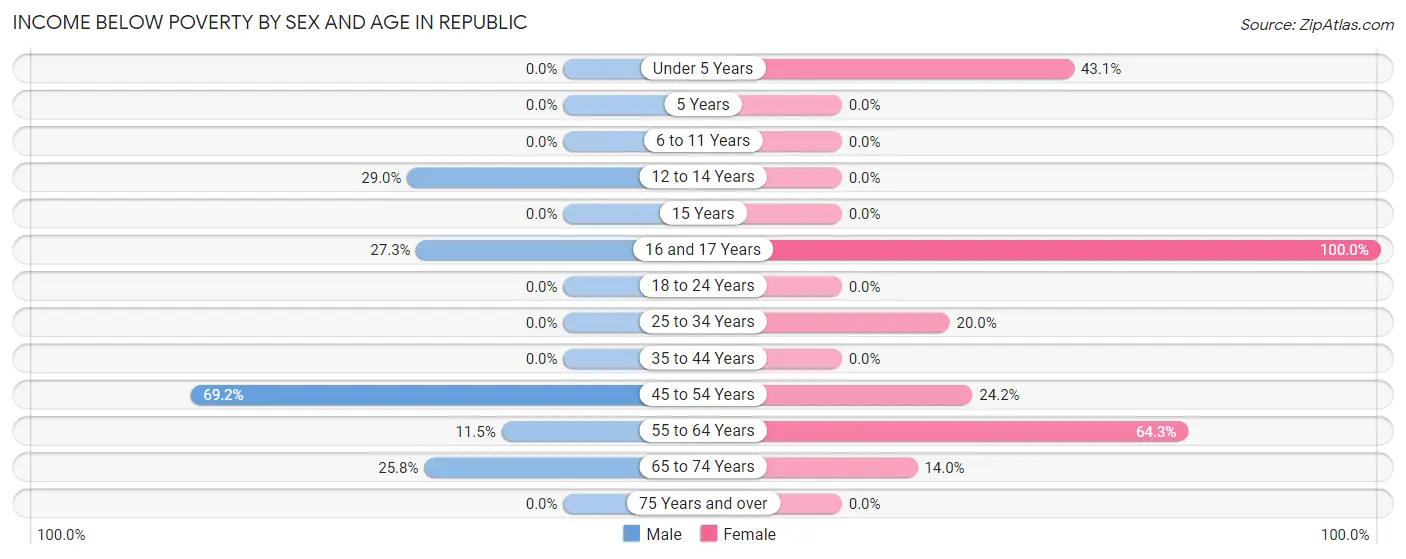
| Age Bracket | Male | Female |
| Under 5 Years | 0 (0.0%) | 25 (43.1%) |
| 5 Years | 0 (0.0%) | 0 (0.0%) |
| 6 to 11 Years | 0 (0.0%) | 0 (0.0%) |
| 12 to 14 Years | 11 (28.9%) | 0 (0.0%) |
| 15 Years | 0 (0.0%) | 0 (0.0%) |
| 16 and 17 Years | 12 (27.3%) | 18 (100.0%) |
| 18 to 24 Years | 0 (0.0%) | 0 (0.0%) |
| 25 to 34 Years | 0 (0.0%) | 15 (20.0%) |
| 35 to 44 Years | 0 (0.0%) | 0 (0.0%) |
| 45 to 54 Years | 18 (69.2%) | 16 (24.2%) |
| 55 to 64 Years | 7 (11.5%) | 45 (64.3%) |
| 65 to 74 Years | 24 (25.8%) | 16 (14.0%) |
| 75 Years and over | 0 (0.0%) | 0 (0.0%) |
| Total | 72 (10.4%) | 135 (21.4%) |
Income Above Poverty by Sex and Age in Republic
According to the poverty statistics in Republic, males aged under 5 years and females aged 6 to 11 years are the age groups that are most secure financially, with 100.0% of males and 100.0% of females in these age groups living above the poverty line.
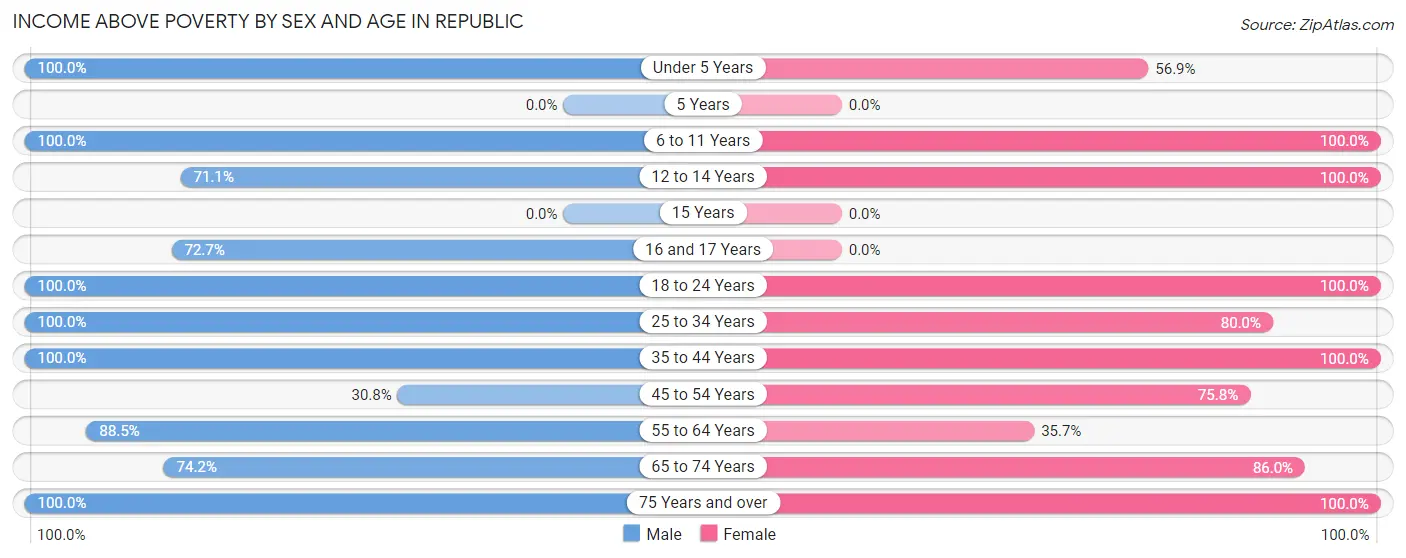
| Age Bracket | Male | Female |
| Under 5 Years | 47 (100.0%) | 33 (56.9%) |
| 5 Years | 0 (0.0%) | 0 (0.0%) |
| 6 to 11 Years | 47 (100.0%) | 37 (100.0%) |
| 12 to 14 Years | 27 (71.1%) | 12 (100.0%) |
| 15 Years | 0 (0.0%) | 0 (0.0%) |
| 16 and 17 Years | 32 (72.7%) | 0 (0.0%) |
| 18 to 24 Years | 158 (100.0%) | 65 (100.0%) |
| 25 to 34 Years | 92 (100.0%) | 60 (80.0%) |
| 35 to 44 Years | 62 (100.0%) | 58 (100.0%) |
| 45 to 54 Years | 8 (30.8%) | 50 (75.8%) |
| 55 to 64 Years | 54 (88.5%) | 25 (35.7%) |
| 65 to 74 Years | 69 (74.2%) | 98 (86.0%) |
| 75 Years and over | 25 (100.0%) | 58 (100.0%) |
| Total | 621 (89.6%) | 496 (78.6%) |
Income Below Poverty Among Married-Couple Families in Republic
The poverty statistics for married-couple families in Republic show that 13.2% or 33 of the total 251 families live below the poverty line. Families with no children have the highest poverty rate of 20.3%, comprising of 33 families. On the other hand, families with 1 or 2 children have the lowest poverty rate of 0.0%, which includes 0 families.
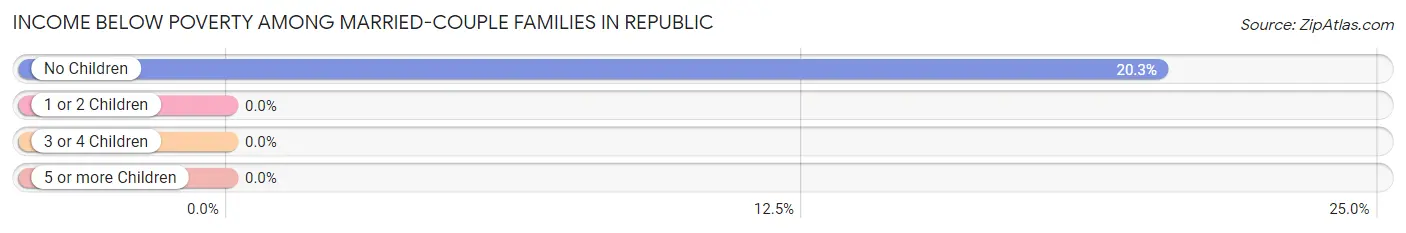
| Children | Above Poverty | Below Poverty |
| No Children | 130 (79.7%) | 33 (20.3%) |
| 1 or 2 Children | 32 (100.0%) | 0 (0.0%) |
| 3 or 4 Children | 56 (100.0%) | 0 (0.0%) |
| 5 or more Children | 0 (0.0%) | 0 (0.0%) |
| Total | 218 (86.9%) | 33 (13.2%) |
Income Below Poverty Among Single-Parent Households in Republic
According to the poverty data in Republic, 100.0% or 10 single-father households and 41.9% or 26 single-mother households are living below the poverty line. Among single-father households, those with 1 or 2 children have the highest poverty rate, with 10 households (100.0%) experiencing poverty. Likewise, among single-mother households, those with 1 or 2 children have the highest poverty rate, with 26 households (41.9%) falling below the poverty line.
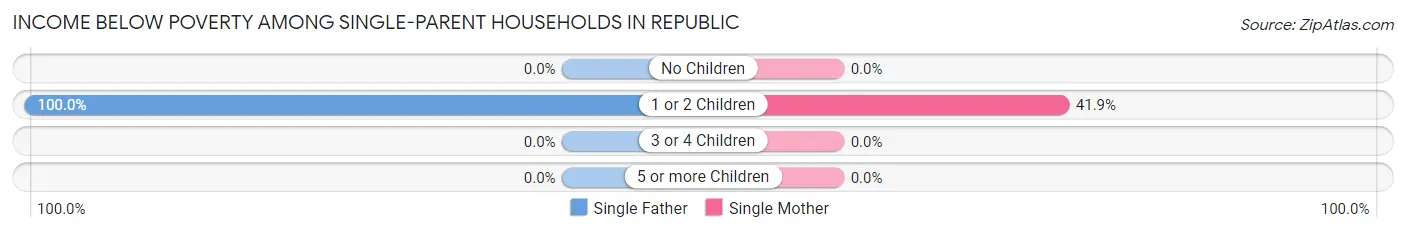
| Children | Single Father | Single Mother |
| No Children | 0 (0.0%) | 0 (0.0%) |
| 1 or 2 Children | 10 (100.0%) | 26 (41.9%) |
| 3 or 4 Children | 0 (0.0%) | 0 (0.0%) |
| 5 or more Children | 0 (0.0%) | 0 (0.0%) |
| Total | 10 (100.0%) | 26 (41.9%) |
Income Below Poverty Among Married-Couple vs Single-Parent Households in Republic
The poverty data for Republic shows that 33 of the married-couple family households (13.2%) and 36 of the single-parent households (50.0%) are living below the poverty level. Within the married-couple family households, those with no children have the highest poverty rate, with 33 households (20.3%) falling below the poverty line. Among the single-parent households, those with 1 or 2 children have the highest poverty rate, with 36 household (50.0%) living below poverty.
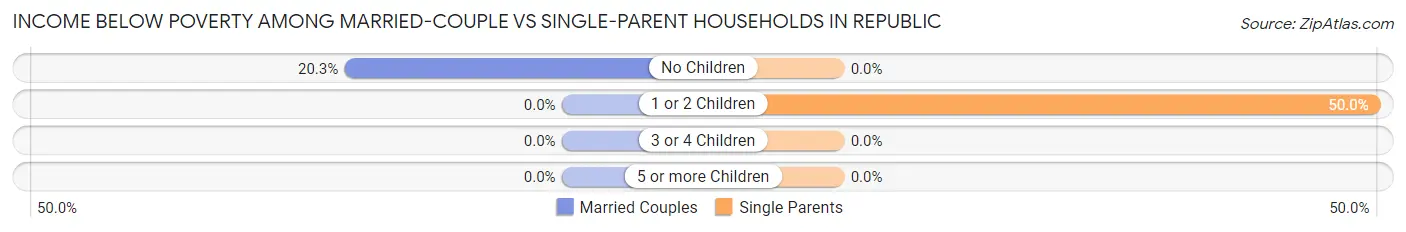
| Children | Married-Couple Families | Single-Parent Households |
| No Children | 33 (20.3%) | 0 (0.0%) |
| 1 or 2 Children | 0 (0.0%) | 36 (50.0%) |
| 3 or 4 Children | 0 (0.0%) | 0 (0.0%) |
| 5 or more Children | 0 (0.0%) | 0 (0.0%) |
| Total | 33 (13.2%) | 36 (50.0%) |
Race in Republic
The most populous races in Republic are White / Caucasian (1,129 | 85.3%), Two or more Races (132 | 10.0%), and Black / African American (53 | 4.0%).
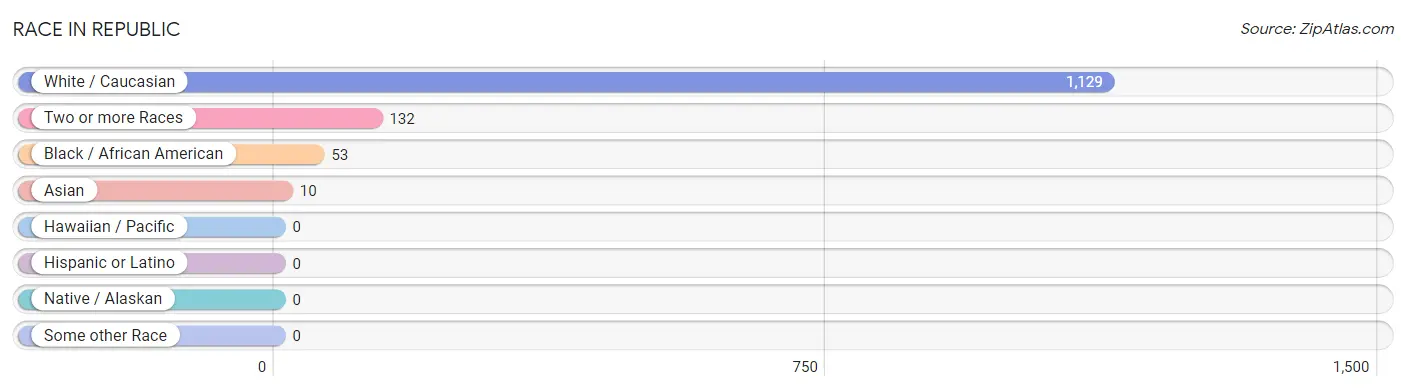
| Race | # Population | % Population |
| Asian | 10 | 0.8% |
| Black / African American | 53 | 4.0% |
| Hawaiian / Pacific | 0 | 0.0% |
| Hispanic or Latino | 0 | 0.0% |
| Native / Alaskan | 0 | 0.0% |
| White / Caucasian | 1,129 | 85.3% |
| Two or more Races | 132 | 10.0% |
| Some other Race | 0 | 0.0% |
| Total | 1,324 | 100.0% |
Ancestry in Republic
The most populous ancestries reported in Republic are Italian (318 | 24.0%), Irish (142 | 10.7%), German (133 | 10.1%), Hungarian (92 | 7.0%), and Slovak (90 | 6.8%), together accounting for 58.6% of all Republic residents.
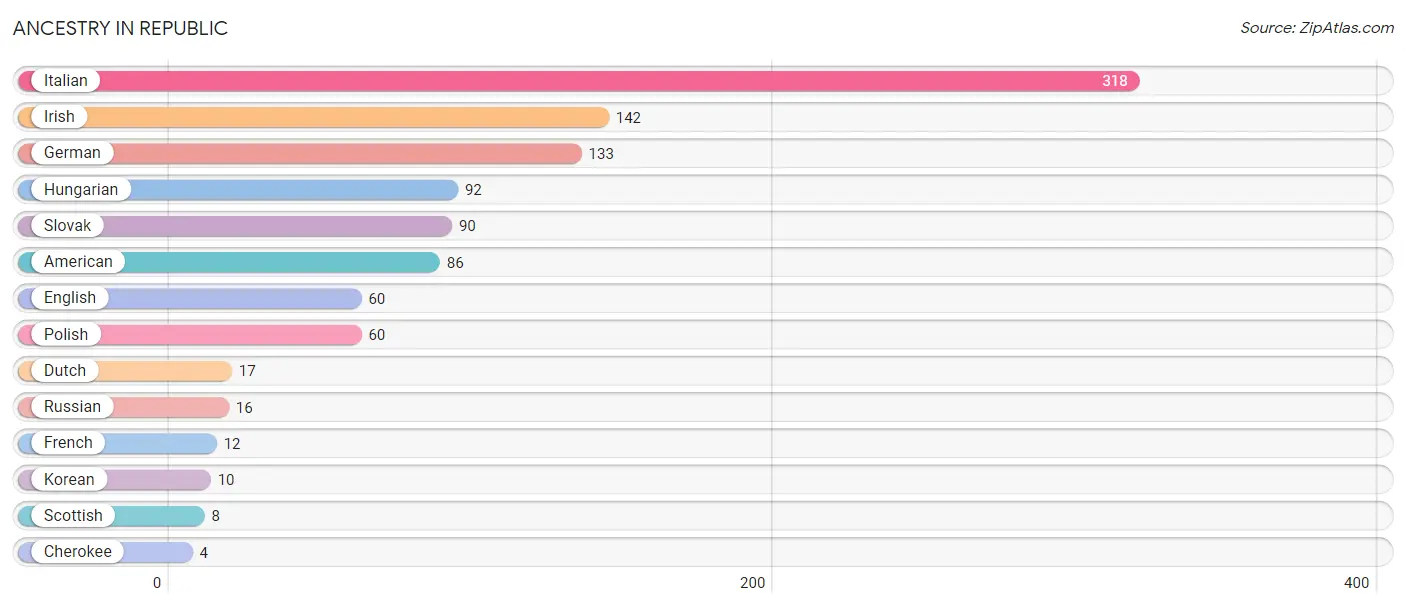
| Ancestry | # Population | % Population |
| American | 86 | 6.5% |
| Cherokee | 4 | 0.3% |
| Dutch | 17 | 1.3% |
| English | 60 | 4.5% |
| French | 12 | 0.9% |
| German | 133 | 10.1% |
| Hungarian | 92 | 7.0% |
| Irish | 142 | 10.7% |
| Italian | 318 | 24.0% |
| Korean | 10 | 0.8% |
| Polish | 60 | 4.5% |
| Russian | 16 | 1.2% |
| Scottish | 8 | 0.6% |
| Slovak | 90 | 6.8% | View All 14 Rows |
Immigrants in Republic
The most numerous immigrant groups reported in Republic came from Asia (10 | 0.8%), Eastern Asia (10 | 0.8%), and Korea (10 | 0.8%), together accounting for 2.3% of all Republic residents.
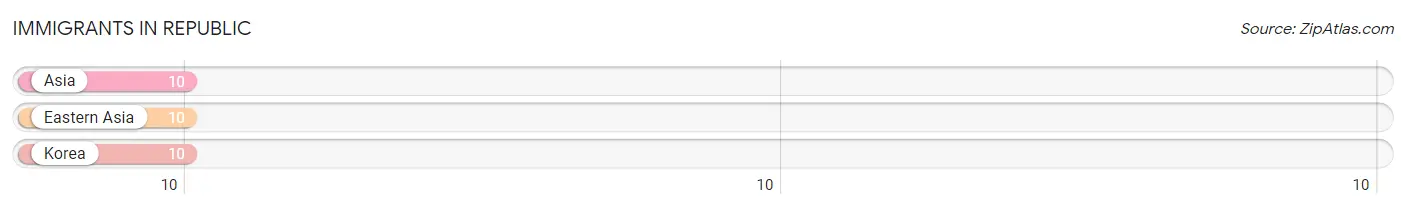
| Immigration Origin | # Population | % Population |
| Asia | 10 | 0.8% |
| Eastern Asia | 10 | 0.8% |
| Korea | 10 | 0.8% | View All 3 Rows |
Sex and Age in Republic
Sex and Age in Republic
The most populous age groups in Republic are 15 to 19 Years (116 | 16.7%) for men and 70 to 74 Years (73 | 11.6%) for women.
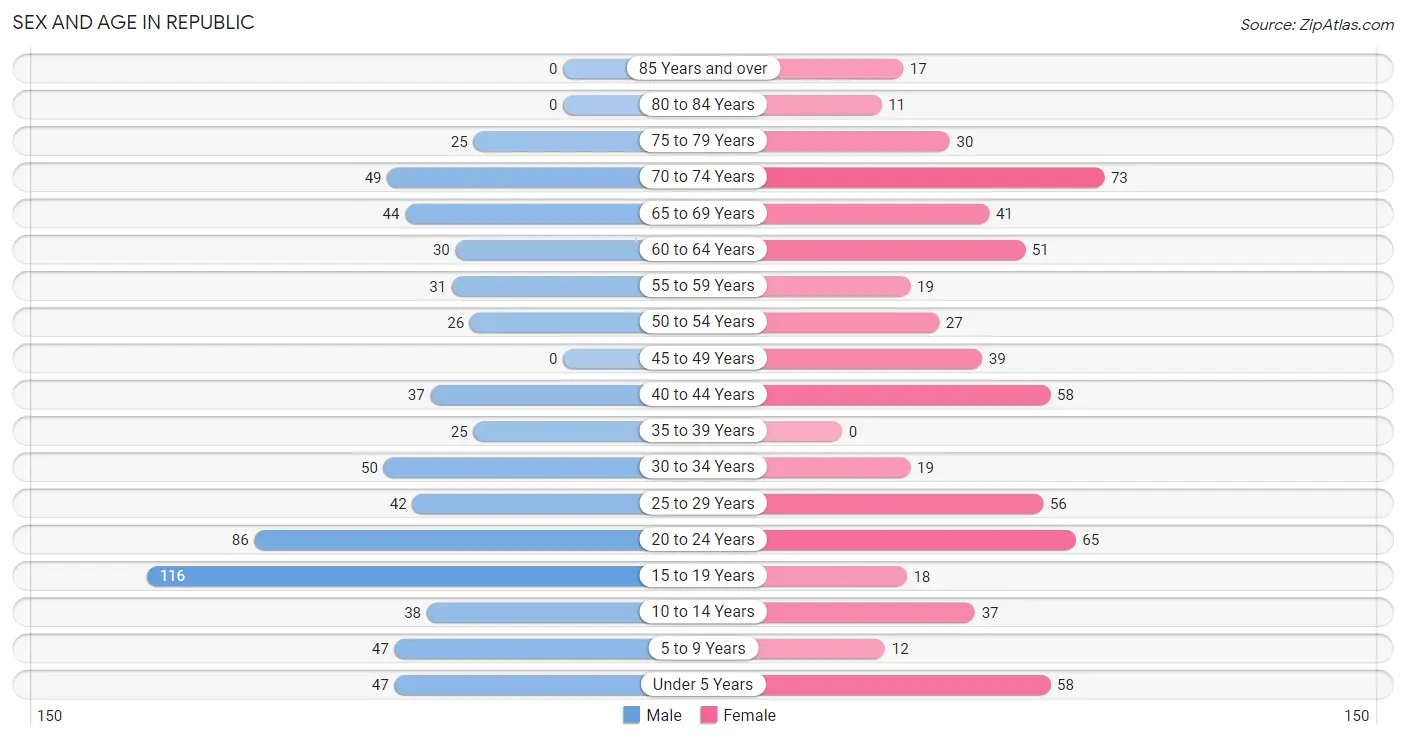
| Age Bracket | Male | Female |
| Under 5 Years | 47 (6.8%) | 58 (9.2%) |
| 5 to 9 Years | 47 (6.8%) | 12 (1.9%) |
| 10 to 14 Years | 38 (5.5%) | 37 (5.9%) |
| 15 to 19 Years | 116 (16.7%) | 18 (2.9%) |
| 20 to 24 Years | 86 (12.4%) | 65 (10.3%) |
| 25 to 29 Years | 42 (6.1%) | 56 (8.9%) |
| 30 to 34 Years | 50 (7.2%) | 19 (3.0%) |
| 35 to 39 Years | 25 (3.6%) | 0 (0.0%) |
| 40 to 44 Years | 37 (5.3%) | 58 (9.2%) |
| 45 to 49 Years | 0 (0.0%) | 39 (6.2%) |
| 50 to 54 Years | 26 (3.7%) | 27 (4.3%) |
| 55 to 59 Years | 31 (4.5%) | 19 (3.0%) |
| 60 to 64 Years | 30 (4.3%) | 51 (8.1%) |
| 65 to 69 Years | 44 (6.4%) | 41 (6.5%) |
| 70 to 74 Years | 49 (7.1%) | 73 (11.6%) |
| 75 to 79 Years | 25 (3.6%) | 30 (4.8%) |
| 80 to 84 Years | 0 (0.0%) | 11 (1.7%) |
| 85 Years and over | 0 (0.0%) | 17 (2.7%) |
| Total | 693 (100.0%) | 631 (100.0%) |
Families and Households in Republic
Median Family Size in Republic
The median family size in Republic is 3.08 persons per family, with single male/father families (10 | 3.1%) accounting for the largest median family size of 3.3 persons per family. On the other hand, single female/mother families (62 | 19.2%) represent the smallest median family size with 2.87 persons per family.
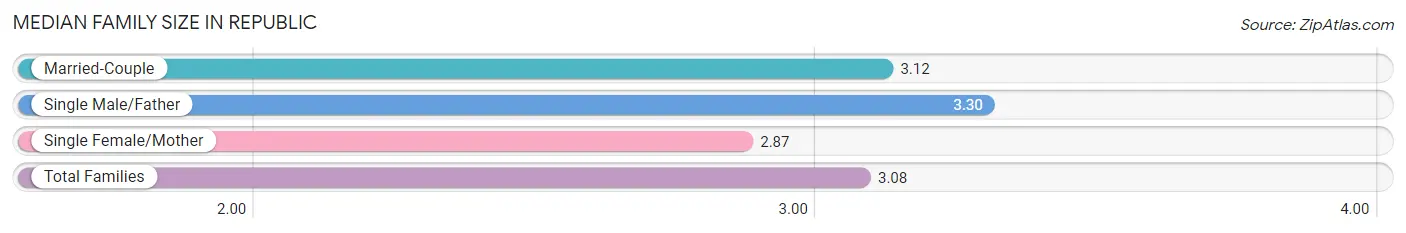
| Family Type | # Families | Family Size |
| Married-Couple | 251 (77.7%) | 3.12 |
| Single Male/Father | 10 (3.1%) | 3.30 |
| Single Female/Mother | 62 (19.2%) | 2.87 |
| Total Families | 323 (100.0%) | 3.08 |
Median Household Size in Republic
The median household size in Republic is 2.38 persons per household, with single male/father households (10 | 1.8%) accounting for the largest median household size of 3.3 persons per household. non-family households (234 | 42.0%) represent the smallest median household size with 1.35 persons per household.
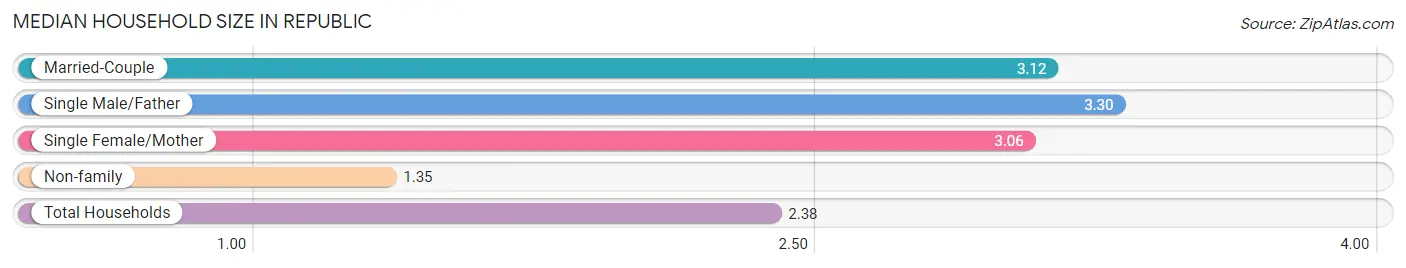
| Household Type | # Households | Household Size |
| Married-Couple | 251 (45.1%) | 3.12 |
| Single Male/Father | 10 (1.8%) | 3.30 |
| Single Female/Mother | 62 (11.1%) | 3.06 |
| Non-family | 234 (42.0%) | 1.35 |
| Total Households | 557 (100.0%) | 2.38 |
Household Size by Marriage Status in Republic
Out of a total of 557 households in Republic, 323 (58.0%) are family households, while 234 (42.0%) are nonfamily households. The most numerous type of family households are 2-person households, comprising 123, and the most common type of nonfamily households are 1-person households, comprising 182.
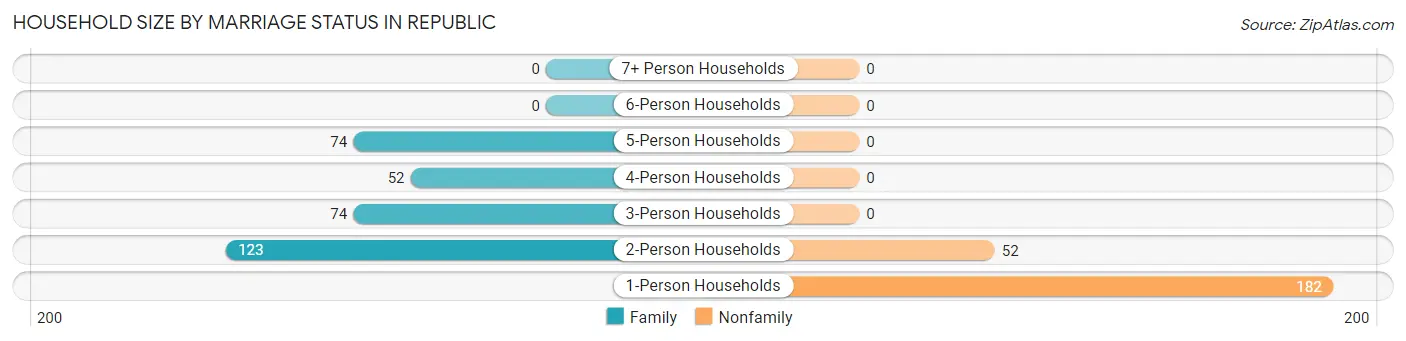
| Household Size | Family Households | Nonfamily Households |
| 1-Person Households | - | 182 (32.7%) |
| 2-Person Households | 123 (22.1%) | 52 (9.3%) |
| 3-Person Households | 74 (13.3%) | 0 (0.0%) |
| 4-Person Households | 52 (9.3%) | 0 (0.0%) |
| 5-Person Households | 74 (13.3%) | 0 (0.0%) |
| 6-Person Households | 0 (0.0%) | 0 (0.0%) |
| 7+ Person Households | 0 (0.0%) | 0 (0.0%) |
| Total | 323 (58.0%) | 234 (42.0%) |
Female Fertility in Republic
Fertility by Age in Republic
Average fertility rate in Republic is 68.0 births per 1,000 women. Women in the age bracket of 20 to 34 years have the highest fertility rate with 129.0 births per 1,000 women. Women in the age bracket of 20 to 34 years acount for 100.0% of all women with births.
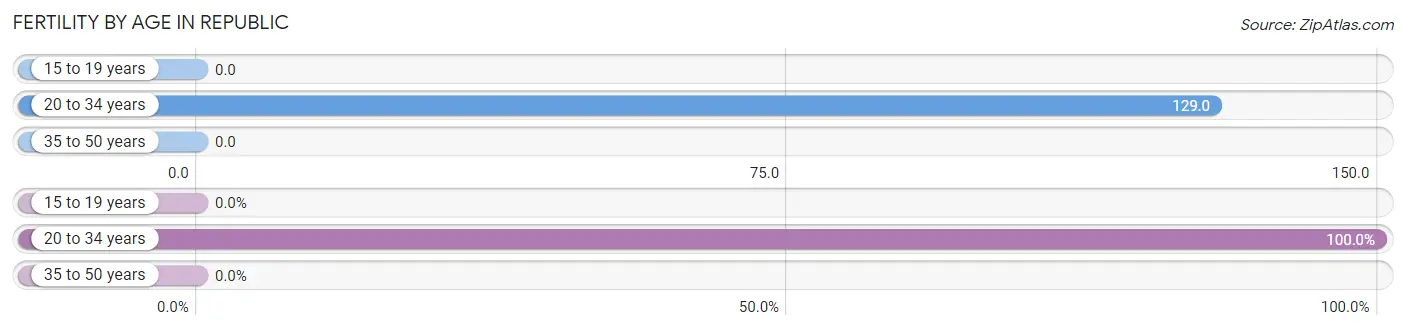
| Age Bracket | Women with Births | Births / 1,000 Women |
| 15 to 19 years | 0 (0.0%) | 0.0 |
| 20 to 34 years | 18 (100.0%) | 129.0 |
| 35 to 50 years | 0 (0.0%) | 0.0 |
| Total | 18 (100.0%) | 68.0 |
Fertility by Age by Marriage Status in Republic
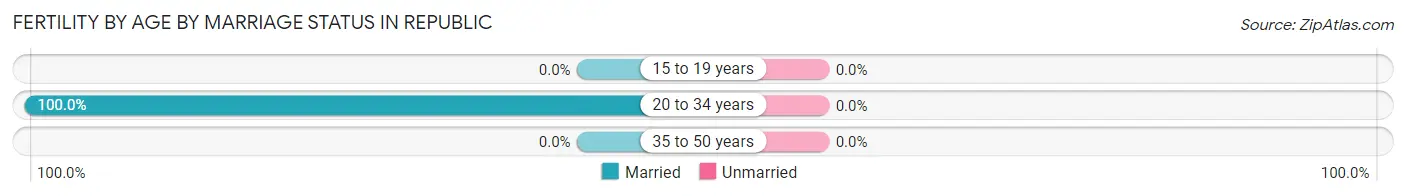
| Age Bracket | Married | Unmarried |
| 15 to 19 years | 0 (0.0%) | 0 (0.0%) |
| 20 to 34 years | 18 (100.0%) | 0 (0.0%) |
| 35 to 50 years | 0 (0.0%) | 0 (0.0%) |
| Total | 18 (100.0%) | 0 (0.0%) |
Fertility by Education in Republic
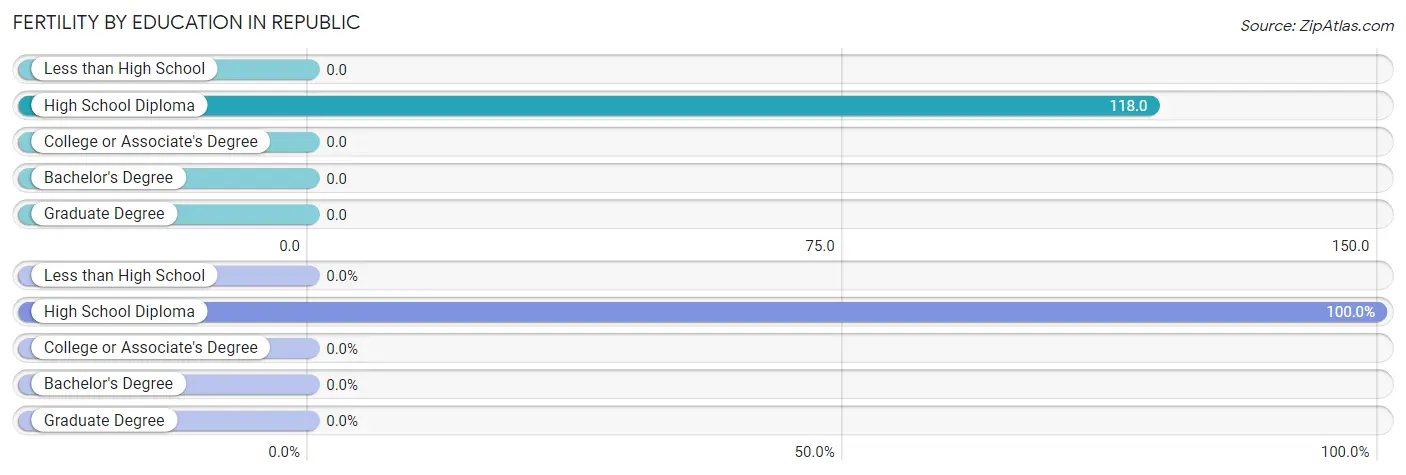
| Educational Attainment | Women with Births | Births / 1,000 Women |
| Less than High School | 0 (0.0%) | 0.0 |
| High School Diploma | 18 (100.0%) | 118.0 |
| College or Associate's Degree | 0 (0.0%) | 0.0 |
| Bachelor's Degree | 0 (0.0%) | 0.0 |
| Graduate Degree | 0 (0.0%) | 0.0 |
| Total | 18 (100.0%) | 68.0 |
Fertility by Education by Marriage Status in Republic
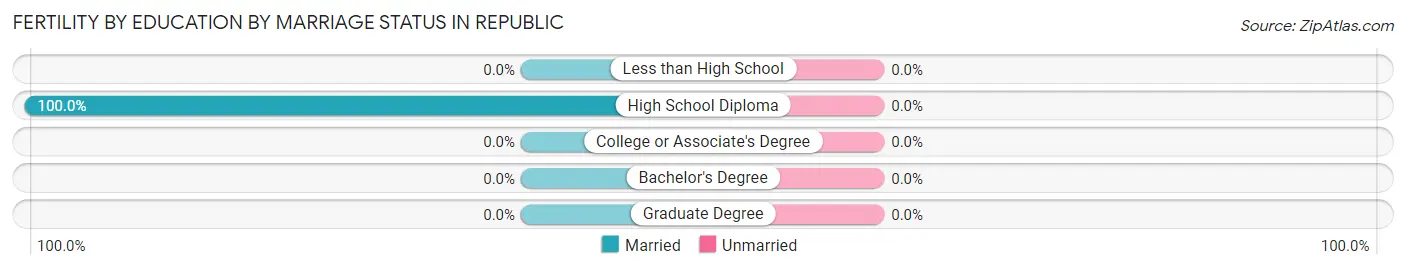
| Educational Attainment | Married | Unmarried |
| Less than High School | 0 (0.0%) | 0 (0.0%) |
| High School Diploma | 18 (100.0%) | 0 (0.0%) |
| College or Associate's Degree | 0 (0.0%) | 0 (0.0%) |
| Bachelor's Degree | 0 (0.0%) | 0 (0.0%) |
| Graduate Degree | 0 (0.0%) | 0 (0.0%) |
| Total | 18 (100.0%) | 0 (0.0%) |
Employment Characteristics in Republic
Employment by Class of Employer in Republic
Among the 480 employed individuals in Republic, private company employees (409 | 85.2%), not-for-profit organizations (35 | 7.3%), and local government employees (24 | 5.0%) make up the most common classes of employment.
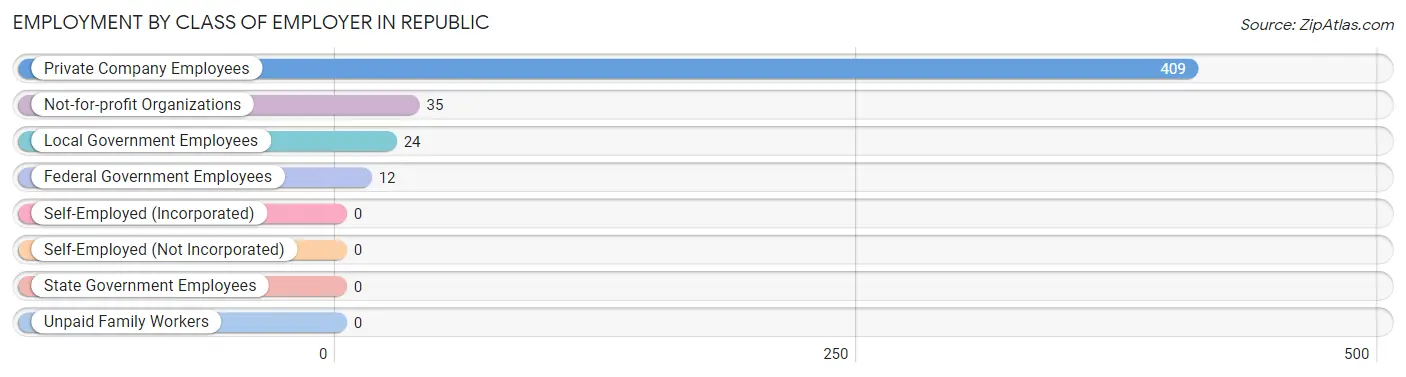
| Employer Class | # Employees | % Employees |
| Private Company Employees | 409 | 85.2% |
| Self-Employed (Incorporated) | 0 | 0.0% |
| Self-Employed (Not Incorporated) | 0 | 0.0% |
| Not-for-profit Organizations | 35 | 7.3% |
| Local Government Employees | 24 | 5.0% |
| State Government Employees | 0 | 0.0% |
| Federal Government Employees | 12 | 2.5% |
| Unpaid Family Workers | 0 | 0.0% |
| Total | 480 | 100.0% |
Employment Status by Age in Republic
According to the labor force statistics for Republic, out of the total population over 16 years of age (1,085), 55.5% or 602 individuals are in the labor force, with 14.5% or 87 of them unemployed. The age group with the highest labor force participation rate is 25 to 29 years, with 100.0% or 98 individuals in the labor force. Within the labor force, the 55 to 59 years age range has the highest percentage of unemployed individuals, with 54.8% or 17 of them being unemployed.
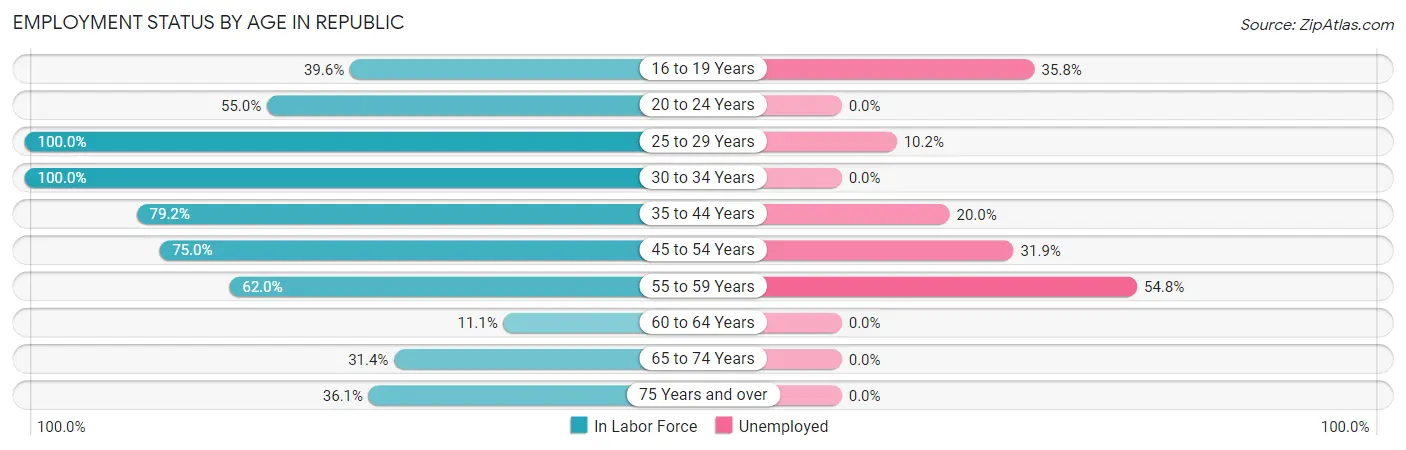
| Age Bracket | In Labor Force | Unemployed |
| 16 to 19 Years | 53 (39.6%) | 19 (35.8%) |
| 20 to 24 Years | 83 (55.0%) | 0 (0.0%) |
| 25 to 29 Years | 98 (100.0%) | 10 (10.2%) |
| 30 to 34 Years | 69 (100.0%) | 0 (0.0%) |
| 35 to 44 Years | 95 (79.2%) | 19 (20.0%) |
| 45 to 54 Years | 69 (75.0%) | 22 (31.9%) |
| 55 to 59 Years | 31 (62.0%) | 17 (54.8%) |
| 60 to 64 Years | 9 (11.1%) | 0 (0.0%) |
| 65 to 74 Years | 65 (31.4%) | 0 (0.0%) |
| 75 Years and over | 30 (36.1%) | 0 (0.0%) |
| Total | 602 (55.5%) | 87 (14.5%) |
Employment Status by Educational Attainment in Republic
According to labor force statistics for Republic, 72.7% of individuals (371) out of the total population between 25 and 64 years of age (510) are in the labor force, with 18.3% or 68 of them being unemployed. The group with the highest labor force participation rate are those with the educational attainment of less than high school, with 100.0% or 30 individuals in the labor force. Within the labor force, individuals with less than high school education have the highest percentage of unemployment, with 33.3% or 10 of them being unemployed.
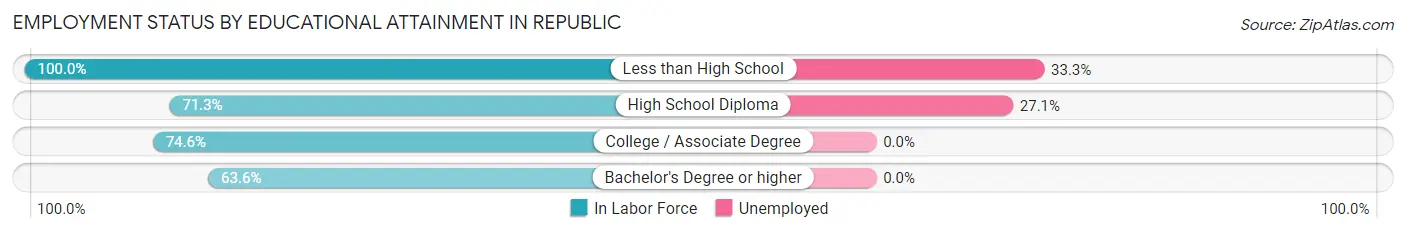
| Educational Attainment | In Labor Force | Unemployed |
| Less than High School | 30 (100.0%) | 10 (33.3%) |
| High School Diploma | 214 (71.3%) | 81 (27.1%) |
| College / Associate Degree | 85 (74.6%) | 0 (0.0%) |
| Bachelor's Degree or higher | 42 (63.6%) | 0 (0.0%) |
| Total | 371 (72.7%) | 93 (18.3%) |
Employment Occupations by Sex in Republic
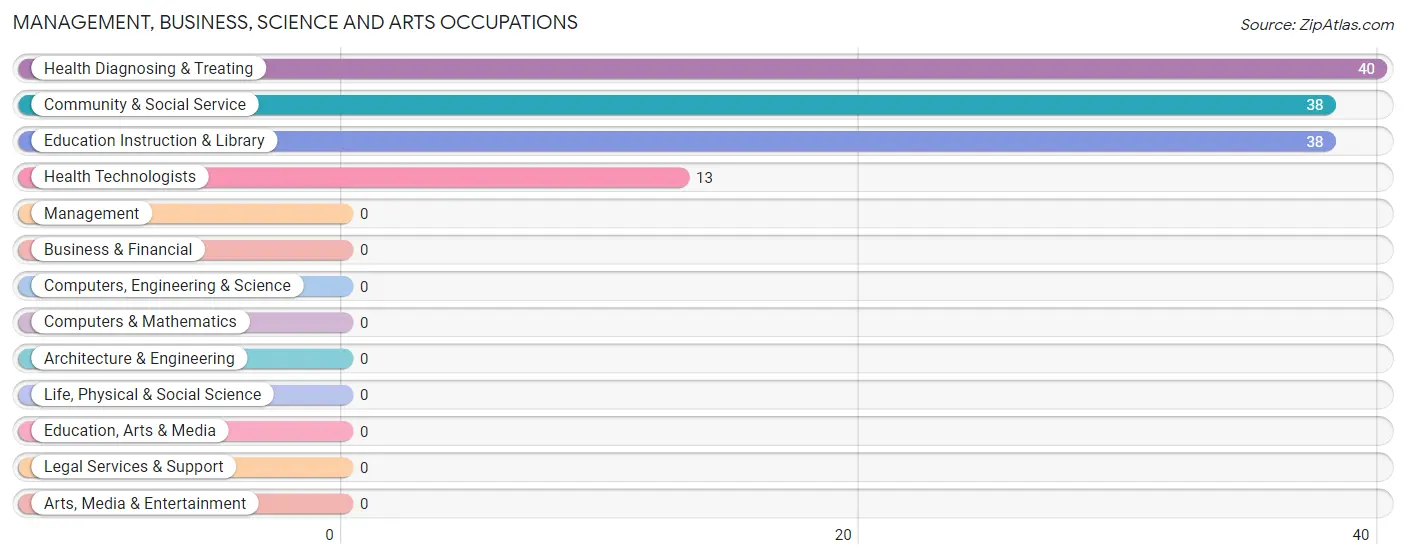
Management, Business, Science and Arts Occupations
The most common Management, Business, Science and Arts occupations in Republic are Health Diagnosing & Treating (40 | 7.8%), Community & Social Service (38 | 7.4%), Education Instruction & Library (38 | 7.4%), and Health Technologists (13 | 2.5%).
Management, Business, Science and Arts Occupations by Sex
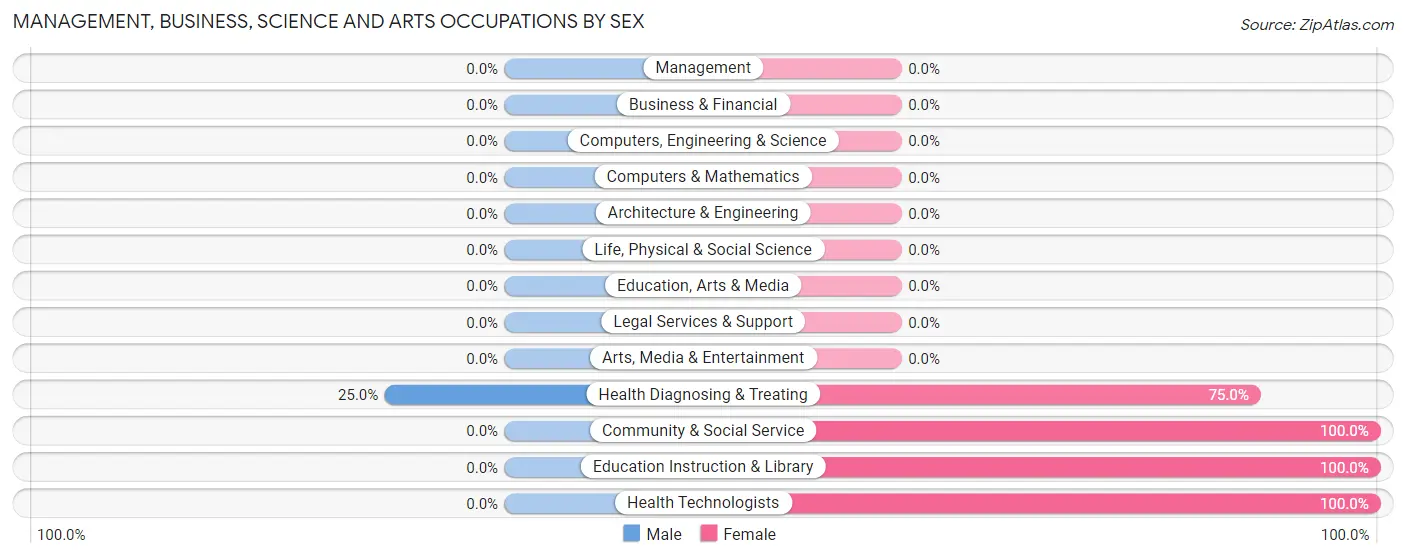
| Occupation | Male | Female |
| Management | 0 (0.0%) | 0 (0.0%) |
| Business & Financial | 0 (0.0%) | 0 (0.0%) |
| Computers, Engineering & Science | 0 (0.0%) | 0 (0.0%) |
| Computers & Mathematics | 0 (0.0%) | 0 (0.0%) |
| Architecture & Engineering | 0 (0.0%) | 0 (0.0%) |
| Life, Physical & Social Science | 0 (0.0%) | 0 (0.0%) |
| Community & Social Service | 0 (0.0%) | 38 (100.0%) |
| Education, Arts & Media | 0 (0.0%) | 0 (0.0%) |
| Legal Services & Support | 0 (0.0%) | 0 (0.0%) |
| Education Instruction & Library | 0 (0.0%) | 38 (100.0%) |
| Arts, Media & Entertainment | 0 (0.0%) | 0 (0.0%) |
| Health Diagnosing & Treating | 10 (25.0%) | 30 (75.0%) |
| Health Technologists | 0 (0.0%) | 13 (100.0%) |
| Total (Category) | 10 (12.8%) | 68 (87.2%) |
| Total (Overall) | 243 (47.2%) | 272 (52.8%) |
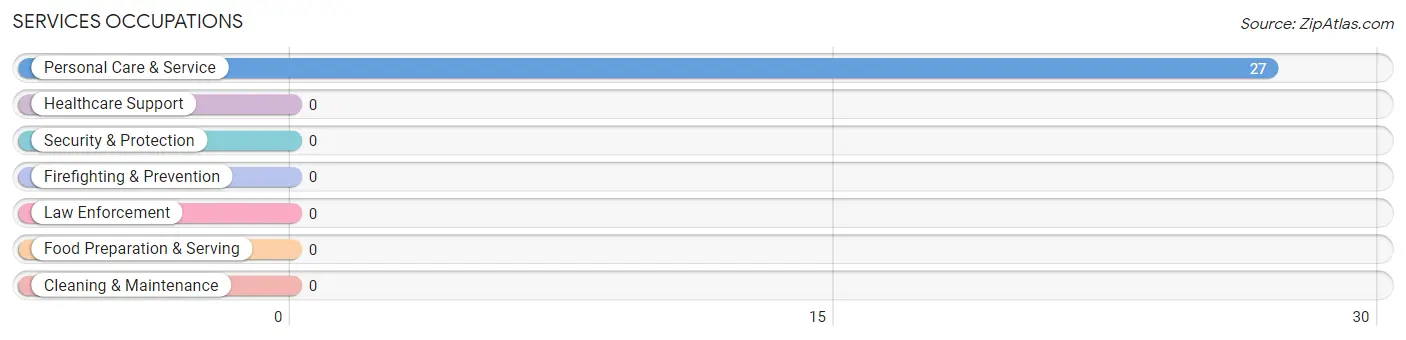
Services Occupations
The most common Services occupations in Republic are , and Personal Care & Service (27 | 5.2%).
Services Occupations by Sex
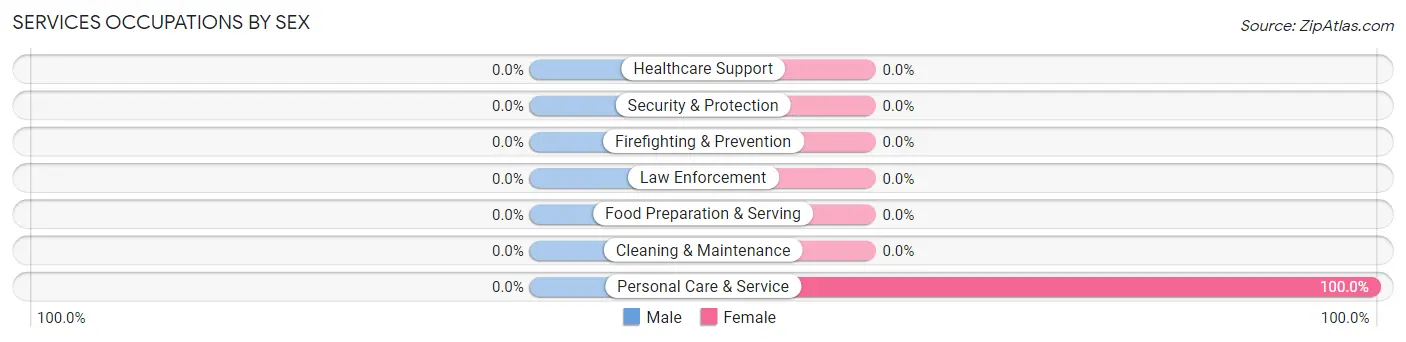
| Occupation | Male | Female |
| Healthcare Support | 0 (0.0%) | 0 (0.0%) |
| Security & Protection | 0 (0.0%) | 0 (0.0%) |
| Firefighting & Prevention | 0 (0.0%) | 0 (0.0%) |
| Law Enforcement | 0 (0.0%) | 0 (0.0%) |
| Food Preparation & Serving | 0 (0.0%) | 0 (0.0%) |
| Cleaning & Maintenance | 0 (0.0%) | 0 (0.0%) |
| Personal Care & Service | 0 (0.0%) | 27 (100.0%) |
| Total (Category) | 0 (0.0%) | 27 (100.0%) |
| Total (Overall) | 243 (47.2%) | 272 (52.8%) |
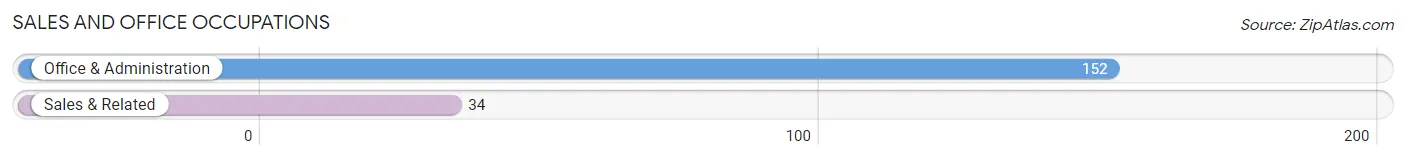
Sales and Office Occupations
The most common Sales and Office occupations in Republic are Office & Administration (152 | 29.5%), and Sales & Related (34 | 6.6%).
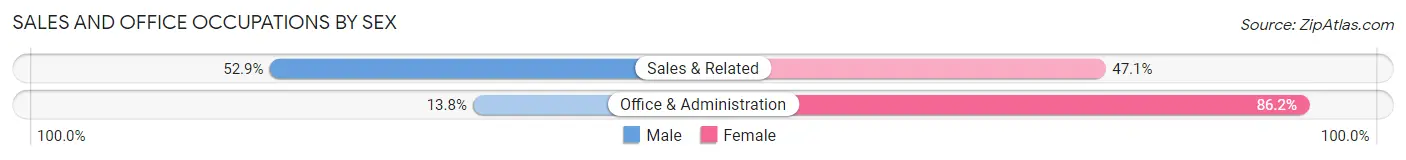
Sales and Office Occupations by Sex
| Occupation | Male | Female |
| Sales & Related | 18 (52.9%) | 16 (47.1%) |
| Office & Administration | 21 (13.8%) | 131 (86.2%) |
| Total (Category) | 39 (21.0%) | 147 (79.0%) |
| Total (Overall) | 243 (47.2%) | 272 (52.8%) |
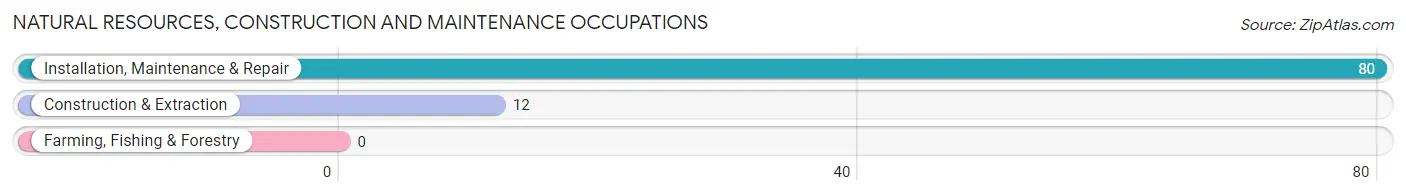
Natural Resources, Construction and Maintenance Occupations
The most common Natural Resources, Construction and Maintenance occupations in Republic are Installation, Maintenance & Repair (80 | 15.5%), and Construction & Extraction (12 | 2.3%).
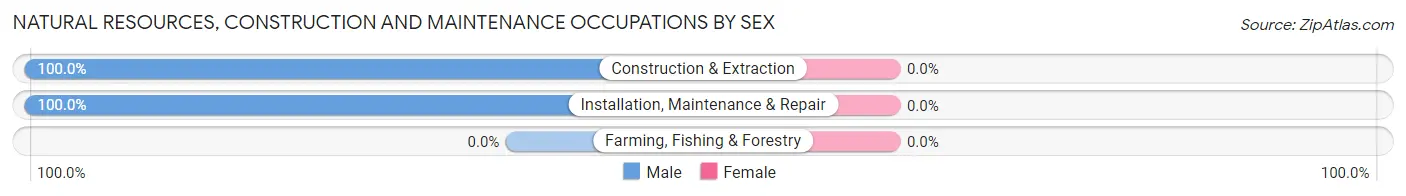
Natural Resources, Construction and Maintenance Occupations by Sex
| Occupation | Male | Female |
| Farming, Fishing & Forestry | 0 (0.0%) | 0 (0.0%) |
| Construction & Extraction | 12 (100.0%) | 0 (0.0%) |
| Installation, Maintenance & Repair | 80 (100.0%) | 0 (0.0%) |
| Total (Category) | 92 (100.0%) | 0 (0.0%) |
| Total (Overall) | 243 (47.2%) | 272 (52.8%) |
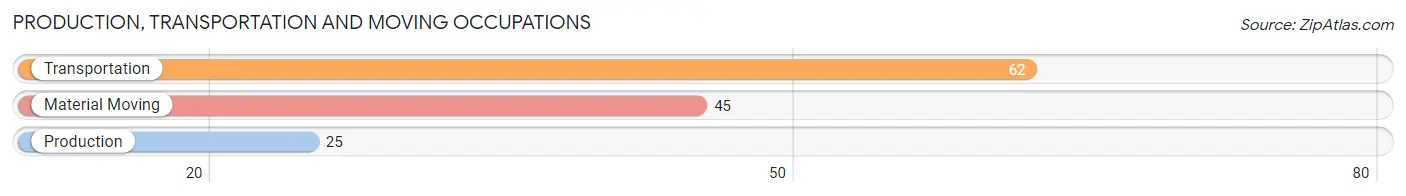
Production, Transportation and Moving Occupations
The most common Production, Transportation and Moving occupations in Republic are Transportation (62 | 12.0%), Material Moving (45 | 8.7%), and Production (25 | 4.9%).
Production, Transportation and Moving Occupations by Sex
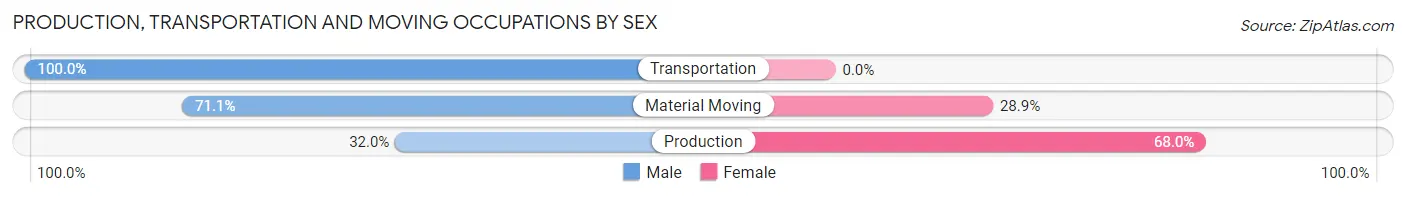
| Occupation | Male | Female |
| Production | 8 (32.0%) | 17 (68.0%) |
| Transportation | 62 (100.0%) | 0 (0.0%) |
| Material Moving | 32 (71.1%) | 13 (28.9%) |
| Total (Category) | 102 (77.3%) | 30 (22.7%) |
| Total (Overall) | 243 (47.2%) | 272 (52.8%) |
Employment Industries by Sex in Republic
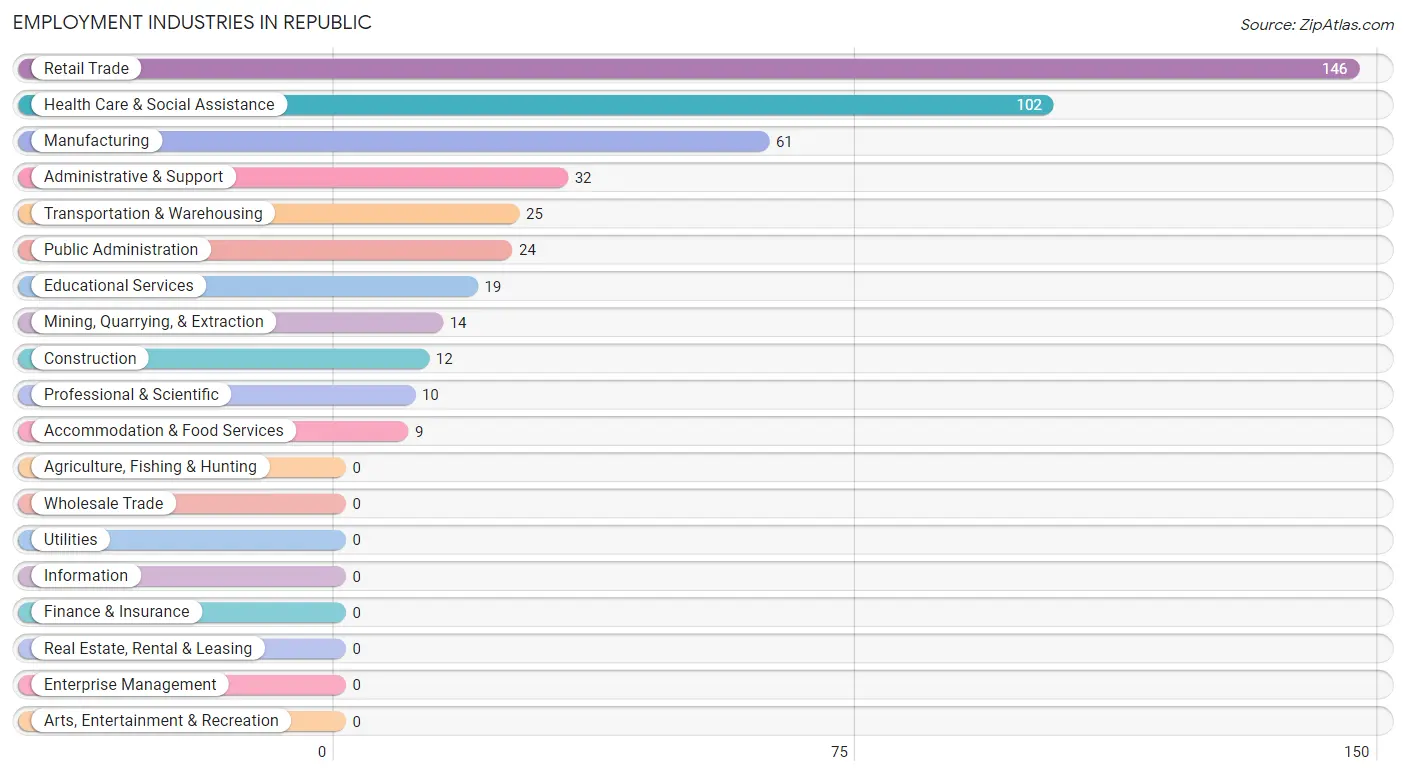
Employment Industries in Republic
The major employment industries in Republic include Retail Trade (146 | 28.3%), Health Care & Social Assistance (102 | 19.8%), Manufacturing (61 | 11.8%), Administrative & Support (32 | 6.2%), and Transportation & Warehousing (25 | 4.9%).
Employment Industries by Sex in Republic
The Republic industries that see more men than women are Mining, Quarrying, & Extraction (100.0%), Construction (100.0%), and Administrative & Support (100.0%), whereas the industries that tend to have a higher number of women are Transportation & Warehousing (100.0%), Professional & Scientific (100.0%), and Educational Services (100.0%).
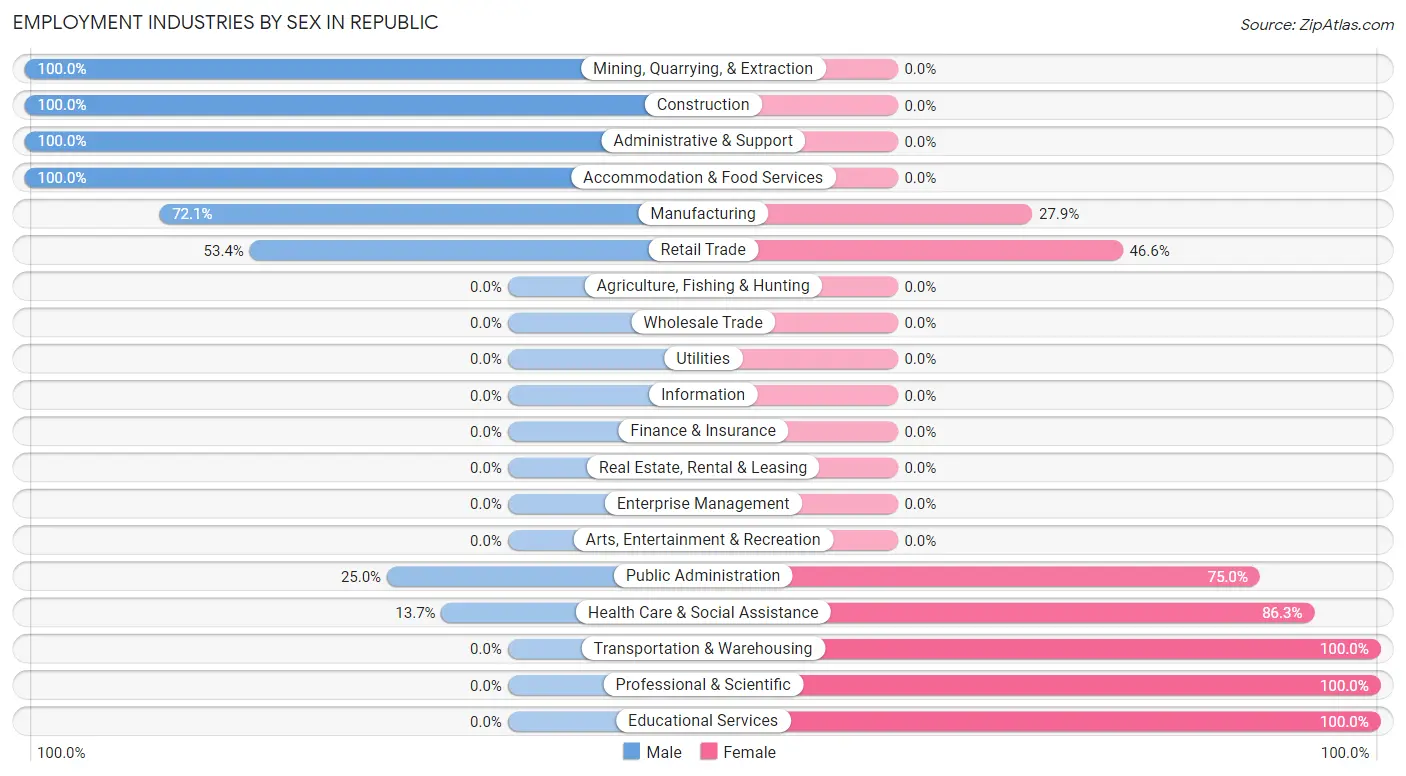
| Industry | Male | Female |
| Agriculture, Fishing & Hunting | 0 (0.0%) | 0 (0.0%) |
| Mining, Quarrying, & Extraction | 14 (100.0%) | 0 (0.0%) |
| Construction | 12 (100.0%) | 0 (0.0%) |
| Manufacturing | 44 (72.1%) | 17 (27.9%) |
| Wholesale Trade | 0 (0.0%) | 0 (0.0%) |
| Retail Trade | 78 (53.4%) | 68 (46.6%) |
| Transportation & Warehousing | 0 (0.0%) | 25 (100.0%) |
| Utilities | 0 (0.0%) | 0 (0.0%) |
| Information | 0 (0.0%) | 0 (0.0%) |
| Finance & Insurance | 0 (0.0%) | 0 (0.0%) |
| Real Estate, Rental & Leasing | 0 (0.0%) | 0 (0.0%) |
| Professional & Scientific | 0 (0.0%) | 10 (100.0%) |
| Enterprise Management | 0 (0.0%) | 0 (0.0%) |
| Administrative & Support | 32 (100.0%) | 0 (0.0%) |
| Educational Services | 0 (0.0%) | 19 (100.0%) |
| Health Care & Social Assistance | 14 (13.7%) | 88 (86.3%) |
| Arts, Entertainment & Recreation | 0 (0.0%) | 0 (0.0%) |
| Accommodation & Food Services | 9 (100.0%) | 0 (0.0%) |
| Public Administration | 6 (25.0%) | 18 (75.0%) |
| Total | 243 (47.2%) | 272 (52.8%) |
Education in Republic
School Enrollment in Republic
The most common levels of schooling among the 234 students in Republic are high school (85 | 36.3%), middle school (52 | 22.2%), and elementary school (43 | 18.4%).
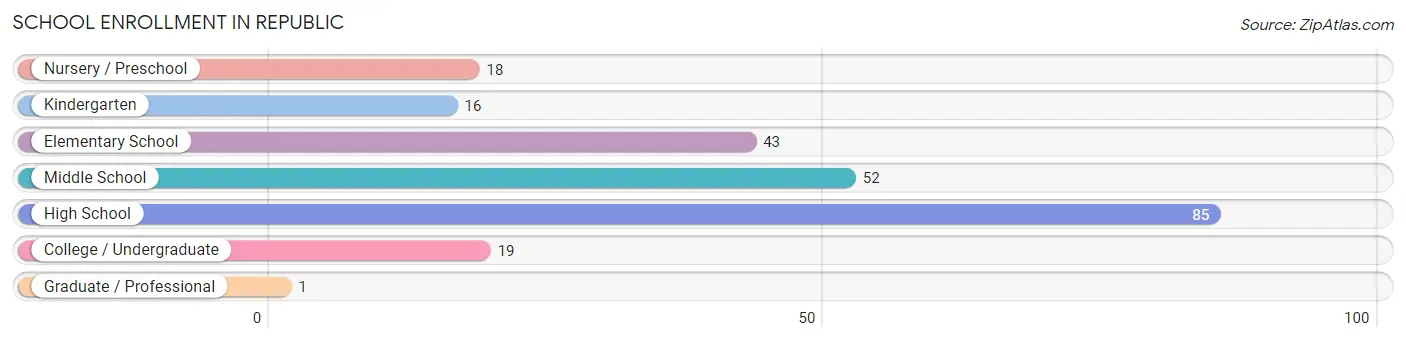
| School Level | # Students | % Students |
| Nursery / Preschool | 18 | 7.7% |
| Kindergarten | 16 | 6.8% |
| Elementary School | 43 | 18.4% |
| Middle School | 52 | 22.2% |
| High School | 85 | 36.3% |
| College / Undergraduate | 19 | 8.1% |
| Graduate / Professional | 1 | 0.4% |
| Total | 234 | 100.0% |
School Enrollment by Age by Funding Source in Republic
Out of a total of 234 students who are enrolled in schools in Republic, 34 (14.5%) attend a private institution, while the remaining 200 (85.5%) are enrolled in public schools. The age group of 5 to 9 year old has the highest likelihood of being enrolled in private schools, with 34 (57.6% in the age bracket) enrolled. Conversely, the age group of 3 to 4 year olds has the lowest likelihood of being enrolled in a private school, with 18 (100.0% in the age bracket) attending a public institution.
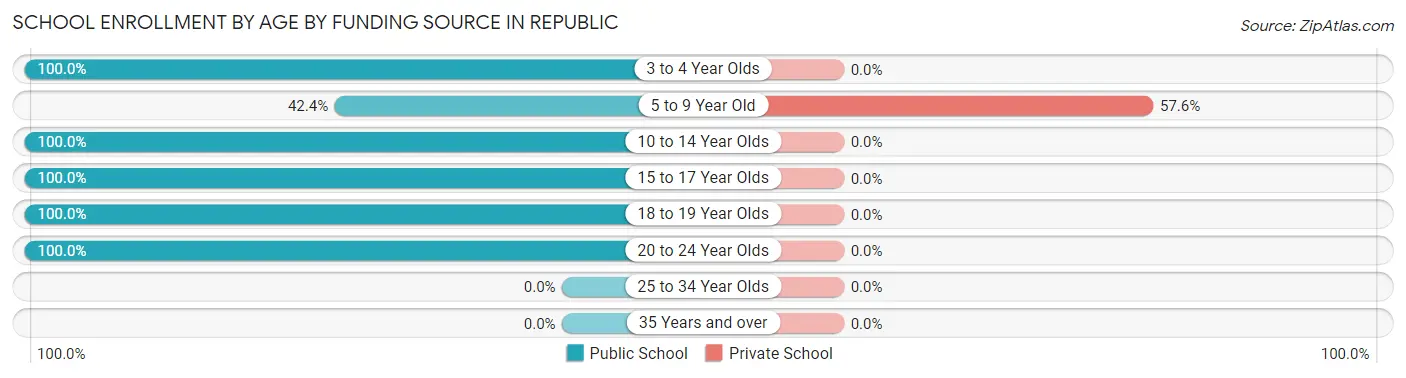
| Age Bracket | Public School | Private School |
| 3 to 4 Year Olds | 18 (100.0%) | 0 (0.0%) |
| 5 to 9 Year Old | 25 (42.4%) | 34 (57.6%) |
| 10 to 14 Year Olds | 75 (100.0%) | 0 (0.0%) |
| 15 to 17 Year Olds | 62 (100.0%) | 0 (0.0%) |
| 18 to 19 Year Olds | 19 (100.0%) | 0 (0.0%) |
| 20 to 24 Year Olds | 1 (100.0%) | 0 (0.0%) |
| 25 to 34 Year Olds | 0 (0.0%) | 0 (0.0%) |
| 35 Years and over | 0 (0.0%) | 0 (0.0%) |
| Total | 200 (85.5%) | 34 (14.5%) |
Educational Attainment by Field of Study in Republic
Liberal arts & history (60 | 41.1%), education (42 | 28.8%), physical & health sciences (19 | 13.0%), literature & languages (19 | 13.0%), and business (6 | 4.1%) are the most common fields of study among 146 individuals in Republic who have obtained a bachelor's degree or higher.
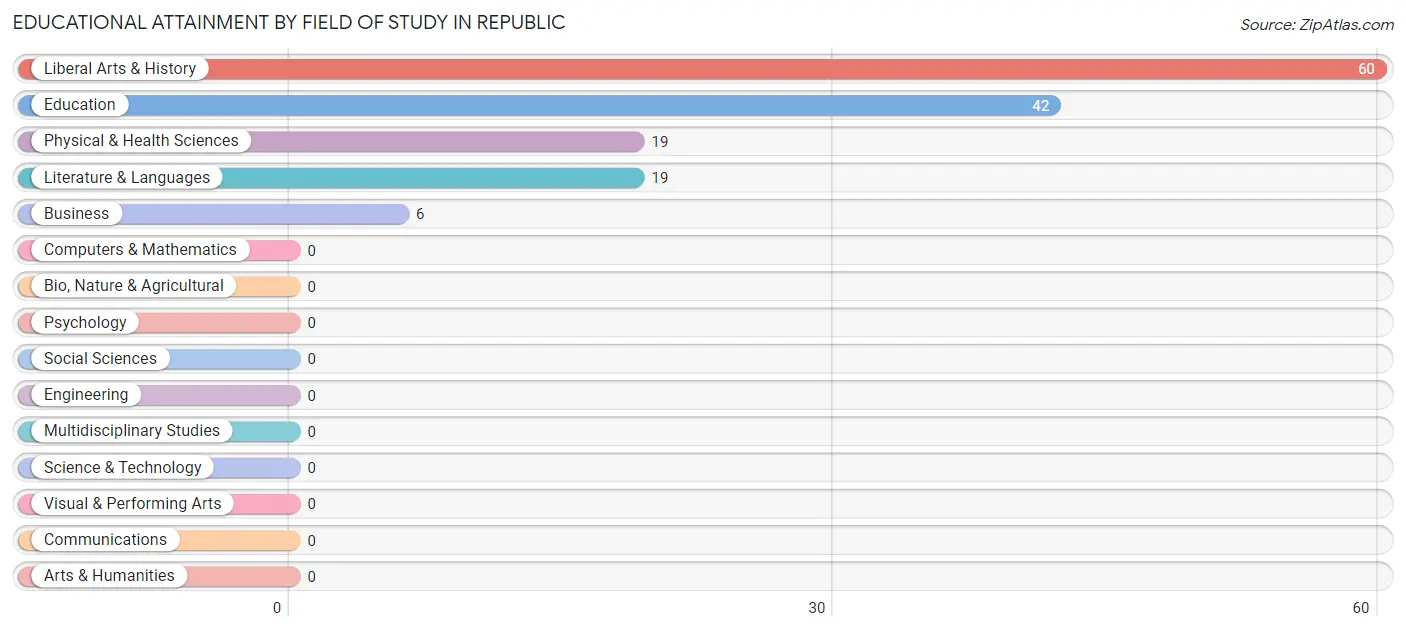
| Field of Study | # Graduates | % Graduates |
| Computers & Mathematics | 0 | 0.0% |
| Bio, Nature & Agricultural | 0 | 0.0% |
| Physical & Health Sciences | 19 | 13.0% |
| Psychology | 0 | 0.0% |
| Social Sciences | 0 | 0.0% |
| Engineering | 0 | 0.0% |
| Multidisciplinary Studies | 0 | 0.0% |
| Science & Technology | 0 | 0.0% |
| Business | 6 | 4.1% |
| Education | 42 | 28.8% |
| Literature & Languages | 19 | 13.0% |
| Liberal Arts & History | 60 | 41.1% |
| Visual & Performing Arts | 0 | 0.0% |
| Communications | 0 | 0.0% |
| Arts & Humanities | 0 | 0.0% |
| Total | 146 | 100.0% |
Transportation & Commute in Republic
Vehicle Availability by Sex in Republic
The most prevalent vehicle ownership categories in Republic are males with 2 vehicles (147, accounting for 61.0%) and females with 2 vehicles (57, making up 61.5%).
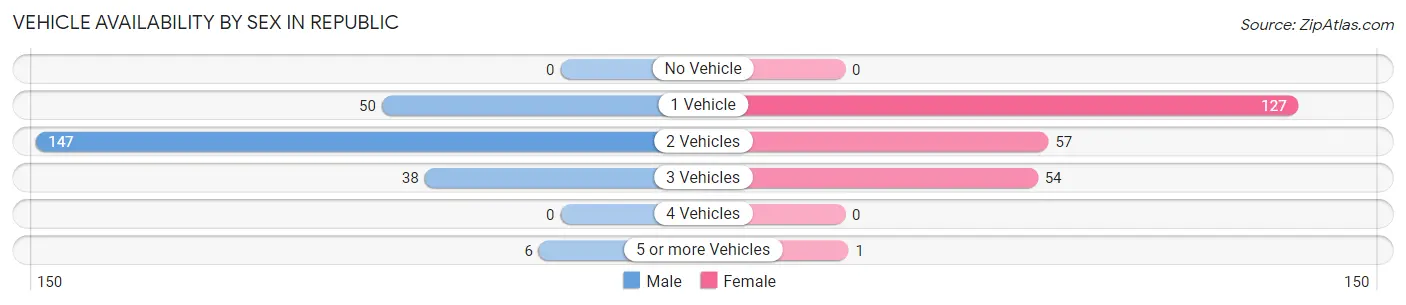
| Vehicles Available | Male | Female |
| No Vehicle | 0 (0.0%) | 0 (0.0%) |
| 1 Vehicle | 50 (20.7%) | 127 (53.1%) |
| 2 Vehicles | 147 (61.0%) | 57 (23.8%) |
| 3 Vehicles | 38 (15.8%) | 54 (22.6%) |
| 4 Vehicles | 0 (0.0%) | 0 (0.0%) |
| 5 or more Vehicles | 6 (2.5%) | 1 (0.4%) |
| Total | 241 (100.0%) | 239 (100.0%) |
Commute Time in Republic
The most frequently occuring commute durations in Republic are 5 to 9 minutes (90 commuters, 18.8%), 15 to 19 minutes (86 commuters, 17.9%), and 20 to 24 minutes (70 commuters, 14.6%).
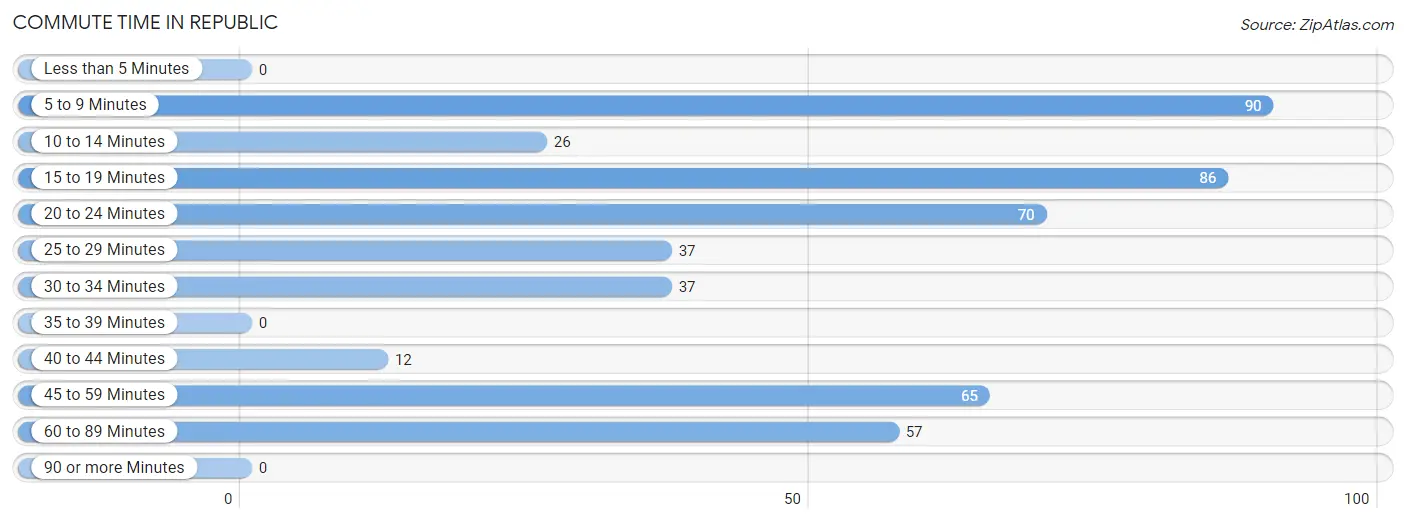
| Commute Time | # Commuters | % Commuters |
| Less than 5 Minutes | 0 | 0.0% |
| 5 to 9 Minutes | 90 | 18.8% |
| 10 to 14 Minutes | 26 | 5.4% |
| 15 to 19 Minutes | 86 | 17.9% |
| 20 to 24 Minutes | 70 | 14.6% |
| 25 to 29 Minutes | 37 | 7.7% |
| 30 to 34 Minutes | 37 | 7.7% |
| 35 to 39 Minutes | 0 | 0.0% |
| 40 to 44 Minutes | 12 | 2.5% |
| 45 to 59 Minutes | 65 | 13.5% |
| 60 to 89 Minutes | 57 | 11.9% |
| 90 or more Minutes | 0 | 0.0% |
Commute Time by Sex in Republic
The most common commute times in Republic are 15 to 19 minutes (68 commuters, 28.2%) for males and 5 to 9 minutes (75 commuters, 31.4%) for females.
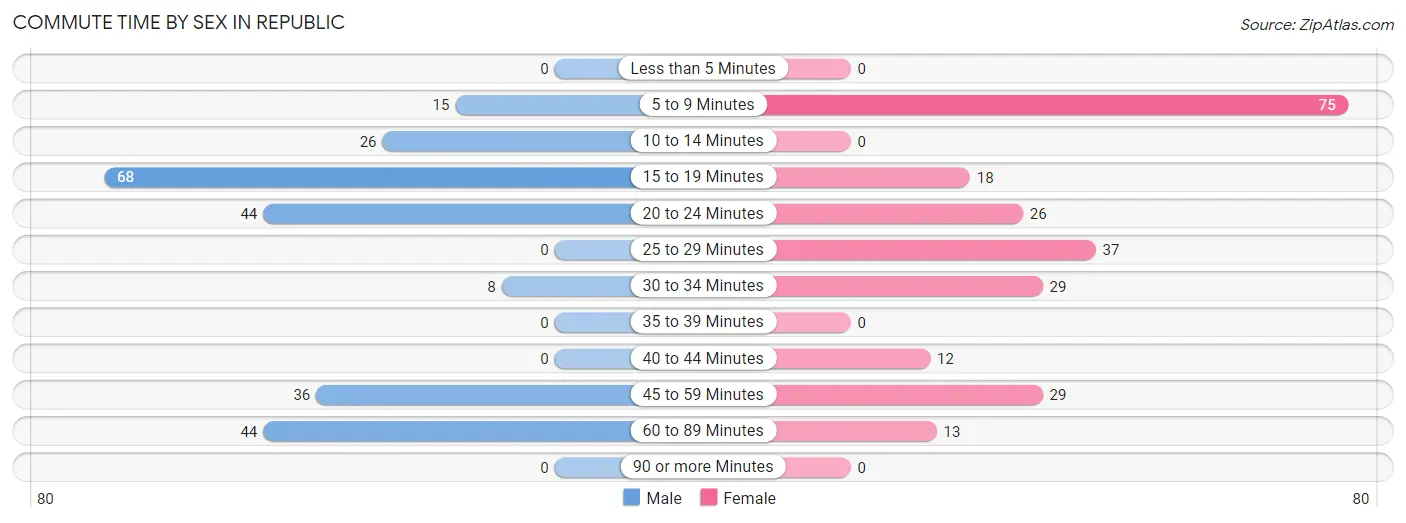
| Commute Time | Male | Female |
| Less than 5 Minutes | 0 (0.0%) | 0 (0.0%) |
| 5 to 9 Minutes | 15 (6.2%) | 75 (31.4%) |
| 10 to 14 Minutes | 26 (10.8%) | 0 (0.0%) |
| 15 to 19 Minutes | 68 (28.2%) | 18 (7.5%) |
| 20 to 24 Minutes | 44 (18.3%) | 26 (10.9%) |
| 25 to 29 Minutes | 0 (0.0%) | 37 (15.5%) |
| 30 to 34 Minutes | 8 (3.3%) | 29 (12.1%) |
| 35 to 39 Minutes | 0 (0.0%) | 0 (0.0%) |
| 40 to 44 Minutes | 0 (0.0%) | 12 (5.0%) |
| 45 to 59 Minutes | 36 (14.9%) | 29 (12.1%) |
| 60 to 89 Minutes | 44 (18.3%) | 13 (5.4%) |
| 90 or more Minutes | 0 (0.0%) | 0 (0.0%) |
Time of Departure to Work by Sex in Republic
The most frequent times of departure to work in Republic are 12:00 AM to 4:59 AM (57, 23.6%) for males and 7:00 AM to 7:29 AM (62, 25.9%) for females.
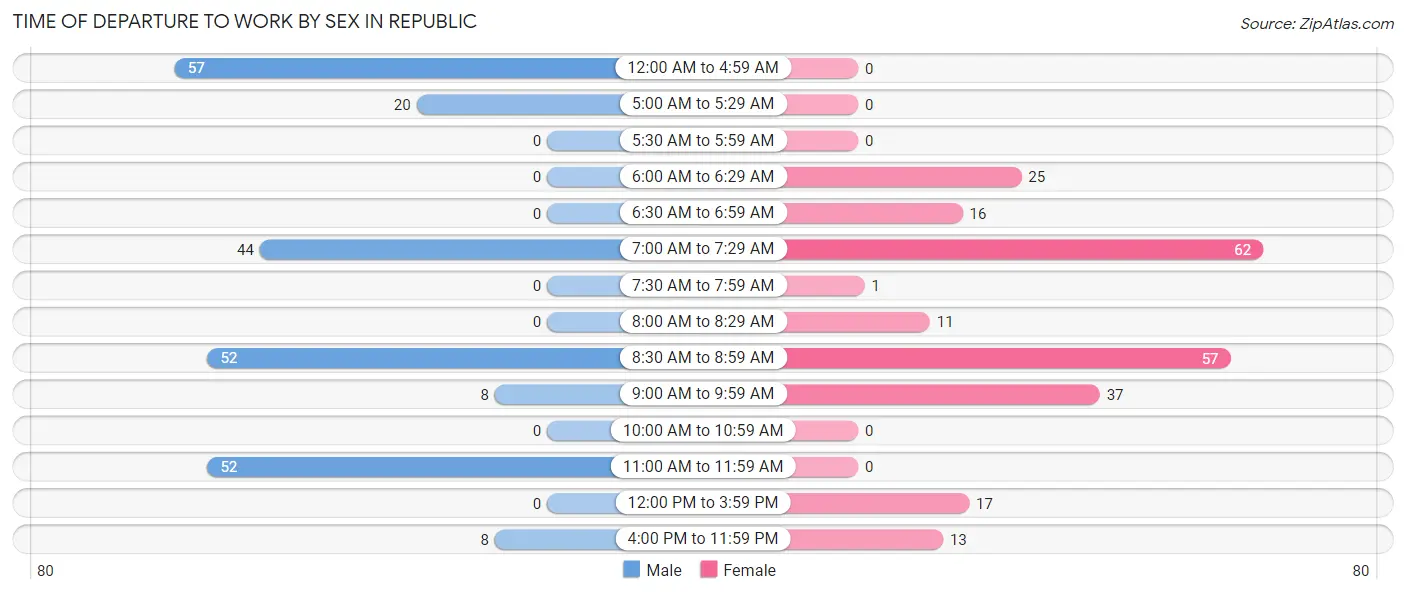
| Time of Departure | Male | Female |
| 12:00 AM to 4:59 AM | 57 (23.6%) | 0 (0.0%) |
| 5:00 AM to 5:29 AM | 20 (8.3%) | 0 (0.0%) |
| 5:30 AM to 5:59 AM | 0 (0.0%) | 0 (0.0%) |
| 6:00 AM to 6:29 AM | 0 (0.0%) | 25 (10.5%) |
| 6:30 AM to 6:59 AM | 0 (0.0%) | 16 (6.7%) |
| 7:00 AM to 7:29 AM | 44 (18.3%) | 62 (25.9%) |
| 7:30 AM to 7:59 AM | 0 (0.0%) | 1 (0.4%) |
| 8:00 AM to 8:29 AM | 0 (0.0%) | 11 (4.6%) |
| 8:30 AM to 8:59 AM | 52 (21.6%) | 57 (23.8%) |
| 9:00 AM to 9:59 AM | 8 (3.3%) | 37 (15.5%) |
| 10:00 AM to 10:59 AM | 0 (0.0%) | 0 (0.0%) |
| 11:00 AM to 11:59 AM | 52 (21.6%) | 0 (0.0%) |
| 12:00 PM to 3:59 PM | 0 (0.0%) | 17 (7.1%) |
| 4:00 PM to 11:59 PM | 8 (3.3%) | 13 (5.4%) |
| Total | 241 (100.0%) | 239 (100.0%) |
Housing Occupancy in Republic
Occupancy by Ownership in Republic
Of the total 557 dwellings in Republic, owner-occupied units account for 327 (58.7%), while renter-occupied units make up 230 (41.3%).
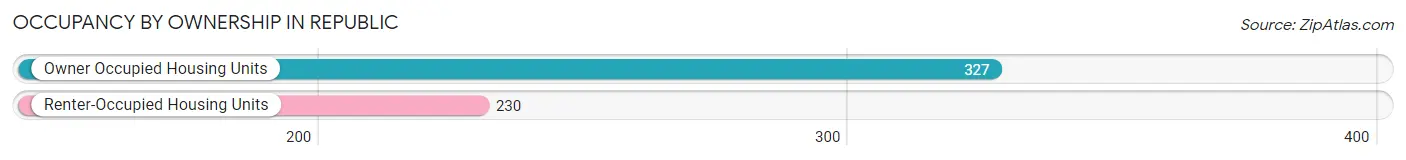
| Occupancy | # Housing Units | % Housing Units |
| Owner Occupied Housing Units | 327 | 58.7% |
| Renter-Occupied Housing Units | 230 | 41.3% |
| Total Occupied Housing Units | 557 | 100.0% |
Occupancy by Household Size in Republic
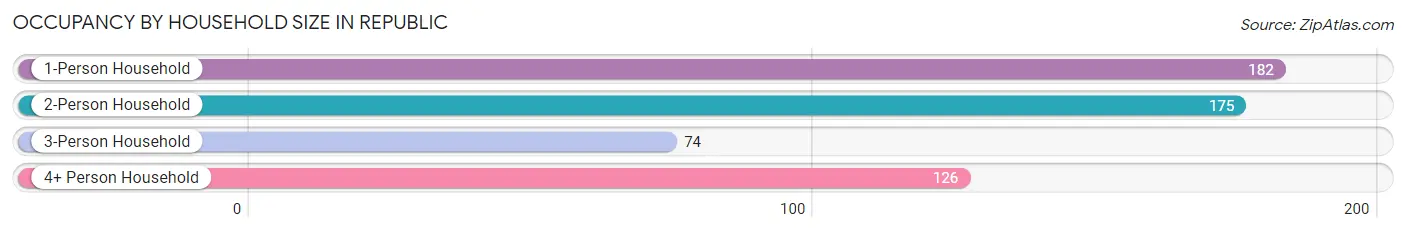
| Household Size | # Housing Units | % Housing Units |
| 1-Person Household | 182 | 32.7% |
| 2-Person Household | 175 | 31.4% |
| 3-Person Household | 74 | 13.3% |
| 4+ Person Household | 126 | 22.6% |
| Total Housing Units | 557 | 100.0% |
Occupancy by Ownership by Household Size in Republic
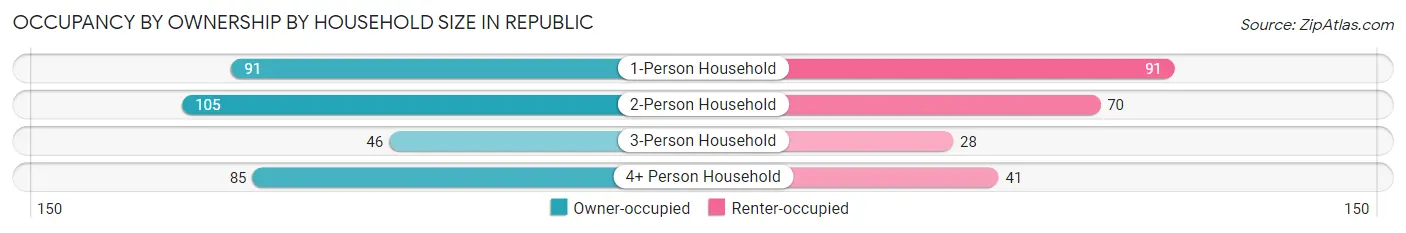
| Household Size | Owner-occupied | Renter-occupied |
| 1-Person Household | 91 (50.0%) | 91 (50.0%) |
| 2-Person Household | 105 (60.0%) | 70 (40.0%) |
| 3-Person Household | 46 (62.2%) | 28 (37.8%) |
| 4+ Person Household | 85 (67.5%) | 41 (32.5%) |
| Total Housing Units | 327 (58.7%) | 230 (41.3%) |
Occupancy by Educational Attainment in Republic
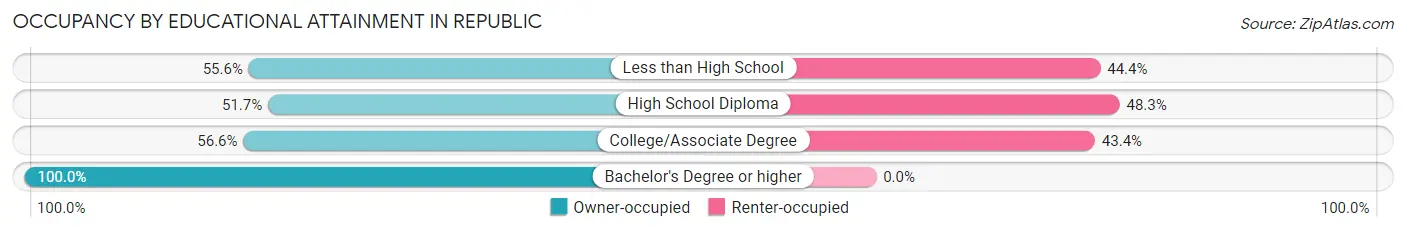
| Household Size | Owner-occupied | Renter-occupied |
| Less than High School | 35 (55.6%) | 28 (44.4%) |
| High School Diploma | 178 (51.7%) | 166 (48.3%) |
| College/Associate Degree | 47 (56.6%) | 36 (43.4%) |
| Bachelor's Degree or higher | 67 (100.0%) | 0 (0.0%) |
Occupancy by Age of Householder in Republic
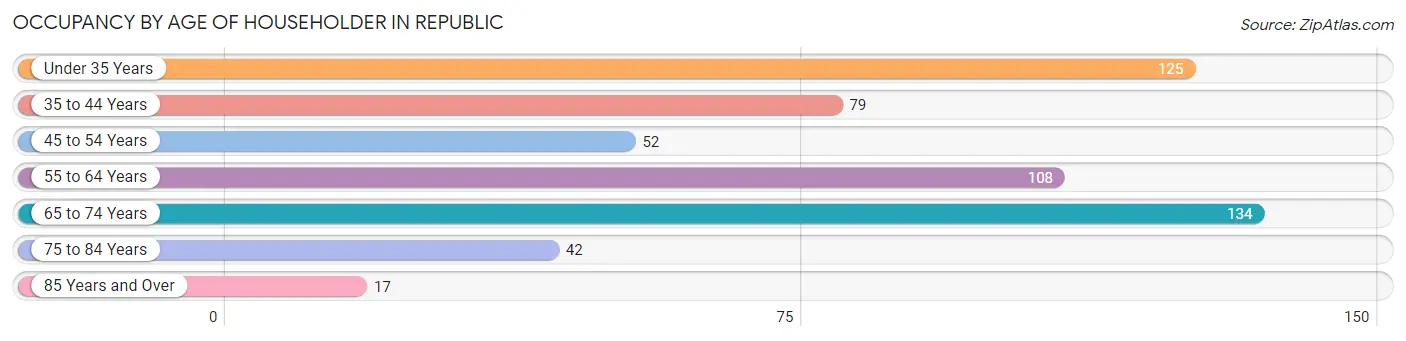
| Age Bracket | # Households | % Households |
| Under 35 Years | 125 | 22.4% |
| 35 to 44 Years | 79 | 14.2% |
| 45 to 54 Years | 52 | 9.3% |
| 55 to 64 Years | 108 | 19.4% |
| 65 to 74 Years | 134 | 24.1% |
| 75 to 84 Years | 42 | 7.5% |
| 85 Years and Over | 17 | 3.0% |
| Total | 557 | 100.0% |
Housing Finances in Republic
Median Income by Occupancy in Republic
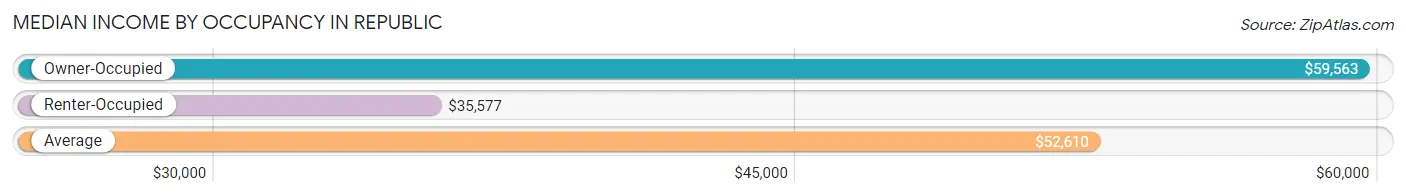
| Occupancy Type | # Households | Median Income |
| Owner-Occupied | 327 (58.7%) | $59,563 |
| Renter-Occupied | 230 (41.3%) | $35,577 |
| Average | 557 (100.0%) | $52,610 |
Occupancy by Householder Income Bracket in Republic
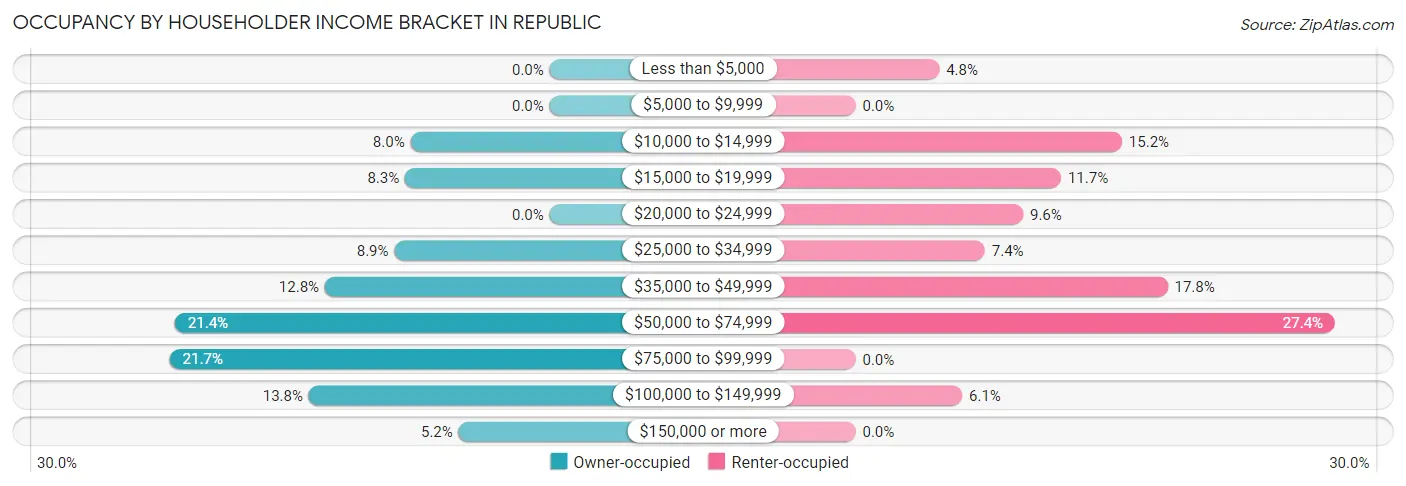
| Income Bracket | Owner-occupied | Renter-occupied |
| Less than $5,000 | 0 (0.0%) | 11 (4.8%) |
| $5,000 to $9,999 | 0 (0.0%) | 0 (0.0%) |
| $10,000 to $14,999 | 26 (8.0%) | 35 (15.2%) |
| $15,000 to $19,999 | 27 (8.3%) | 27 (11.7%) |
| $20,000 to $24,999 | 0 (0.0%) | 22 (9.6%) |
| $25,000 to $34,999 | 29 (8.9%) | 17 (7.4%) |
| $35,000 to $49,999 | 42 (12.8%) | 41 (17.8%) |
| $50,000 to $74,999 | 70 (21.4%) | 63 (27.4%) |
| $75,000 to $99,999 | 71 (21.7%) | 0 (0.0%) |
| $100,000 to $149,999 | 45 (13.8%) | 14 (6.1%) |
| $150,000 or more | 17 (5.2%) | 0 (0.0%) |
| Total | 327 (100.0%) | 230 (100.0%) |
Monthly Housing Cost Tiers in Republic
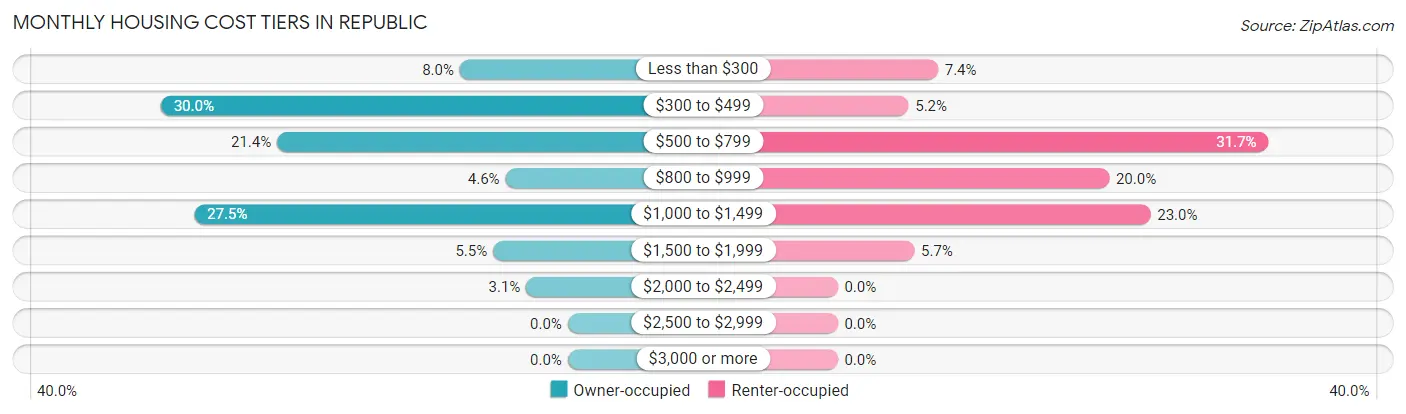
| Monthly Cost | Owner-occupied | Renter-occupied |
| Less than $300 | 26 (8.0%) | 17 (7.4%) |
| $300 to $499 | 98 (30.0%) | 12 (5.2%) |
| $500 to $799 | 70 (21.4%) | 73 (31.7%) |
| $800 to $999 | 15 (4.6%) | 46 (20.0%) |
| $1,000 to $1,499 | 90 (27.5%) | 53 (23.0%) |
| $1,500 to $1,999 | 18 (5.5%) | 13 (5.7%) |
| $2,000 to $2,499 | 10 (3.1%) | 0 (0.0%) |
| $2,500 to $2,999 | 0 (0.0%) | 0 (0.0%) |
| $3,000 or more | 0 (0.0%) | 0 (0.0%) |
| Total | 327 (100.0%) | 230 (100.0%) |
Physical Housing Characteristics in Republic
Housing Structures in Republic
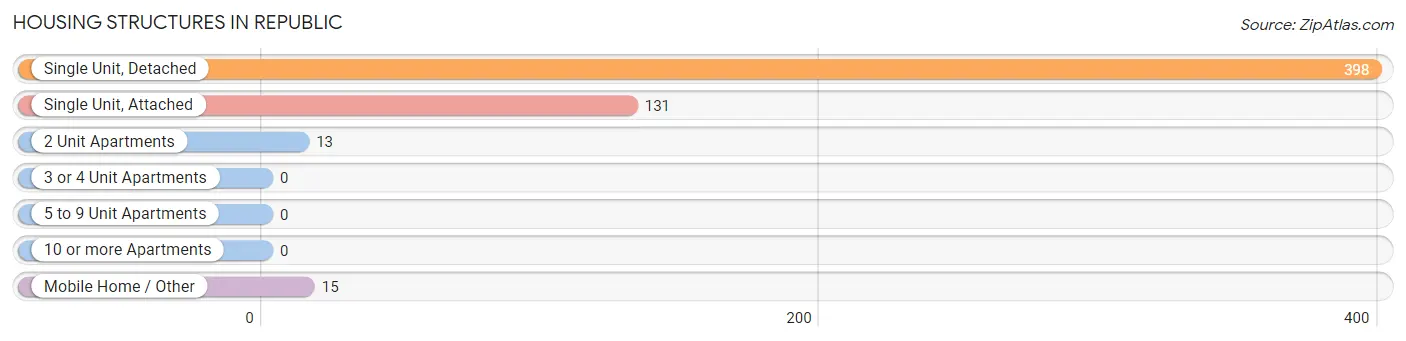
| Structure Type | # Housing Units | % Housing Units |
| Single Unit, Detached | 398 | 71.5% |
| Single Unit, Attached | 131 | 23.5% |
| 2 Unit Apartments | 13 | 2.3% |
| 3 or 4 Unit Apartments | 0 | 0.0% |
| 5 to 9 Unit Apartments | 0 | 0.0% |
| 10 or more Apartments | 0 | 0.0% |
| Mobile Home / Other | 15 | 2.7% |
| Total | 557 | 100.0% |
Housing Structures by Occupancy in Republic
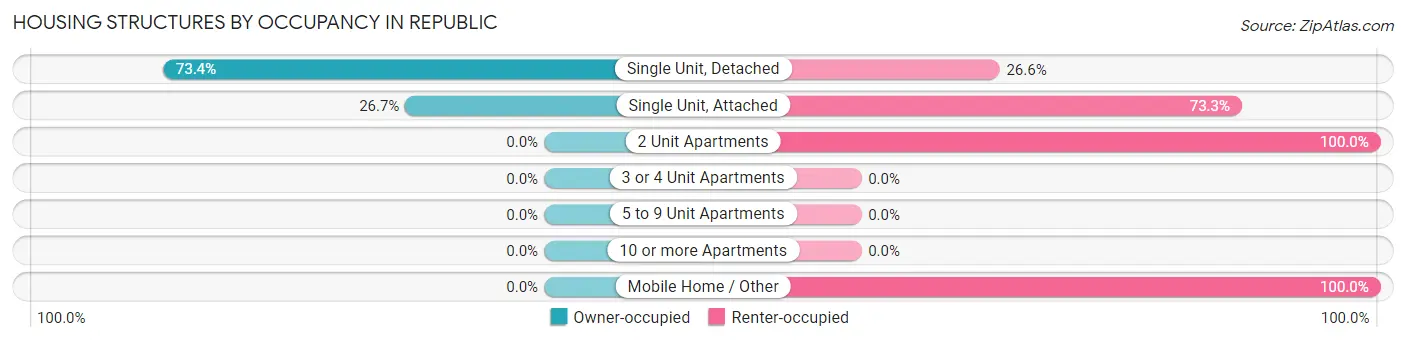
| Structure Type | Owner-occupied | Renter-occupied |
| Single Unit, Detached | 292 (73.4%) | 106 (26.6%) |
| Single Unit, Attached | 35 (26.7%) | 96 (73.3%) |
| 2 Unit Apartments | 0 (0.0%) | 13 (100.0%) |
| 3 or 4 Unit Apartments | 0 (0.0%) | 0 (0.0%) |
| 5 to 9 Unit Apartments | 0 (0.0%) | 0 (0.0%) |
| 10 or more Apartments | 0 (0.0%) | 0 (0.0%) |
| Mobile Home / Other | 0 (0.0%) | 15 (100.0%) |
| Total | 327 (58.7%) | 230 (41.3%) |
Housing Structures by Number of Rooms in Republic
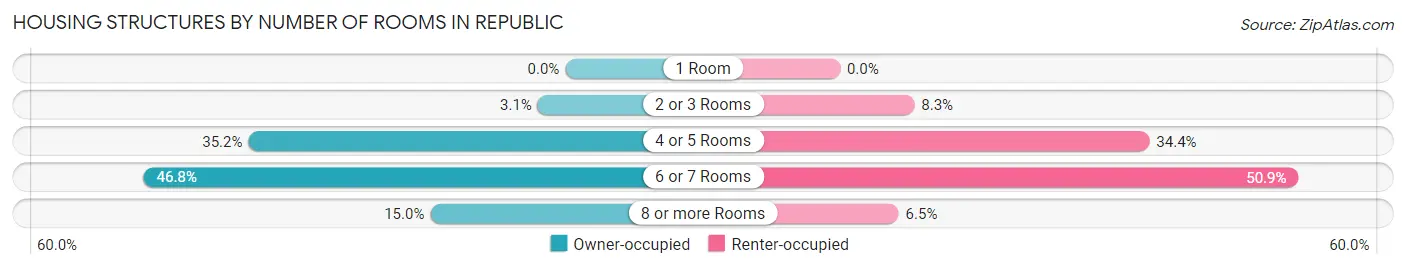
| Number of Rooms | Owner-occupied | Renter-occupied |
| 1 Room | 0 (0.0%) | 0 (0.0%) |
| 2 or 3 Rooms | 10 (3.1%) | 19 (8.3%) |
| 4 or 5 Rooms | 115 (35.2%) | 79 (34.4%) |
| 6 or 7 Rooms | 153 (46.8%) | 117 (50.9%) |
| 8 or more Rooms | 49 (15.0%) | 15 (6.5%) |
| Total | 327 (100.0%) | 230 (100.0%) |
Housing Structure by Heating Type in Republic
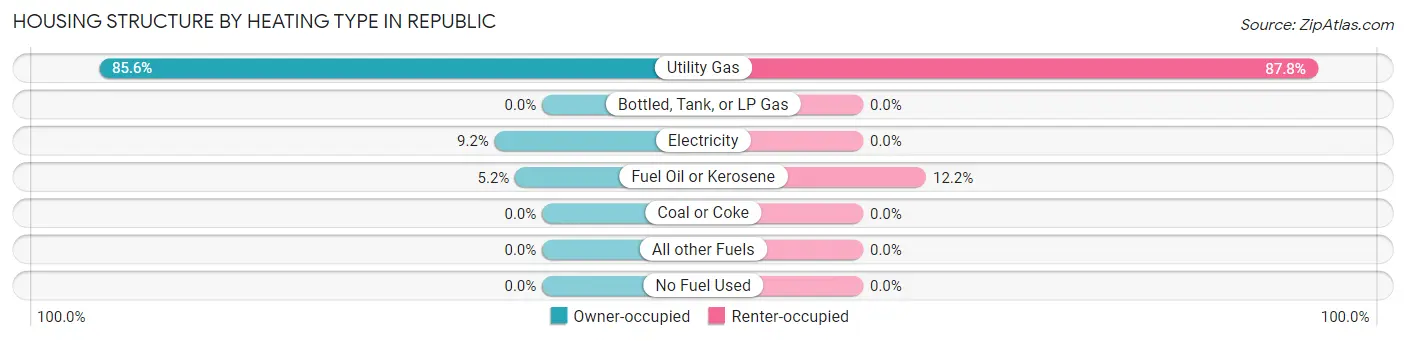
| Heating Type | Owner-occupied | Renter-occupied |
| Utility Gas | 280 (85.6%) | 202 (87.8%) |
| Bottled, Tank, or LP Gas | 0 (0.0%) | 0 (0.0%) |
| Electricity | 30 (9.2%) | 0 (0.0%) |
| Fuel Oil or Kerosene | 17 (5.2%) | 28 (12.2%) |
| Coal or Coke | 0 (0.0%) | 0 (0.0%) |
| All other Fuels | 0 (0.0%) | 0 (0.0%) |
| No Fuel Used | 0 (0.0%) | 0 (0.0%) |
| Total | 327 (100.0%) | 230 (100.0%) |
Household Vehicle Usage in Republic
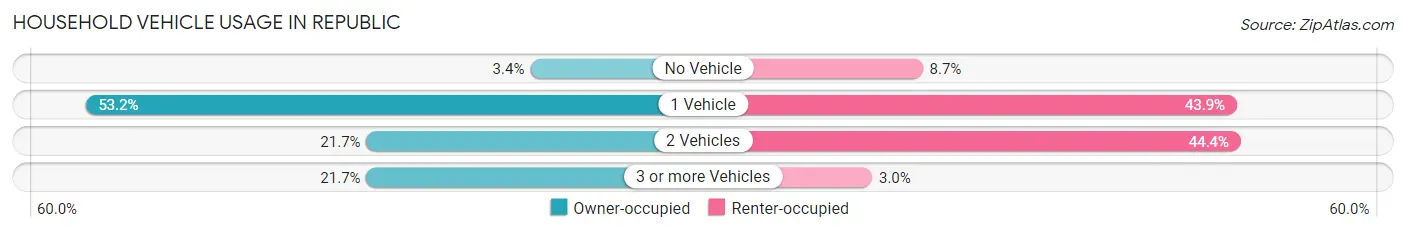
| Vehicles per Household | Owner-occupied | Renter-occupied |
| No Vehicle | 11 (3.4%) | 20 (8.7%) |
| 1 Vehicle | 174 (53.2%) | 101 (43.9%) |
| 2 Vehicles | 71 (21.7%) | 102 (44.4%) |
| 3 or more Vehicles | 71 (21.7%) | 7 (3.0%) |
| Total | 327 (100.0%) | 230 (100.0%) |
Real Estate & Mortgages in Republic
Real Estate and Mortgage Overview in Republic
| Characteristic | Without Mortgage | With Mortgage |
| Housing Units | 152 | 175 |
| Median Property Value | $54,300 | $138,900 |
| Median Household Income | $31,667 | $17 |
| Monthly Housing Costs | $372 | $0 |
| Real Estate Taxes | $933 | $20 |
Property Value by Mortgage Status in Republic
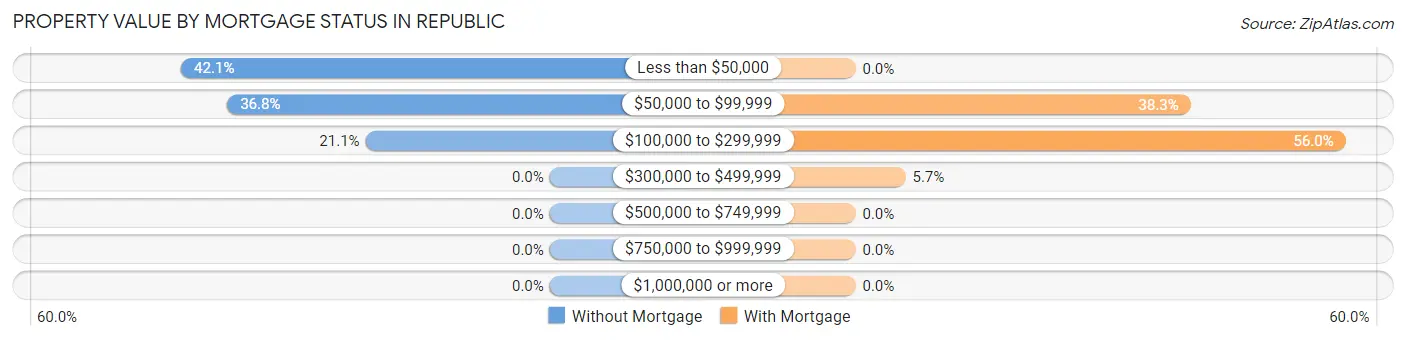
| Property Value | Without Mortgage | With Mortgage |
| Less than $50,000 | 64 (42.1%) | 0 (0.0%) |
| $50,000 to $99,999 | 56 (36.8%) | 67 (38.3%) |
| $100,000 to $299,999 | 32 (21.0%) | 98 (56.0%) |
| $300,000 to $499,999 | 0 (0.0%) | 10 (5.7%) |
| $500,000 to $749,999 | 0 (0.0%) | 0 (0.0%) |
| $750,000 to $999,999 | 0 (0.0%) | 0 (0.0%) |
| $1,000,000 or more | 0 (0.0%) | 0 (0.0%) |
| Total | 152 (100.0%) | 175 (100.0%) |
Household Income by Mortgage Status in Republic
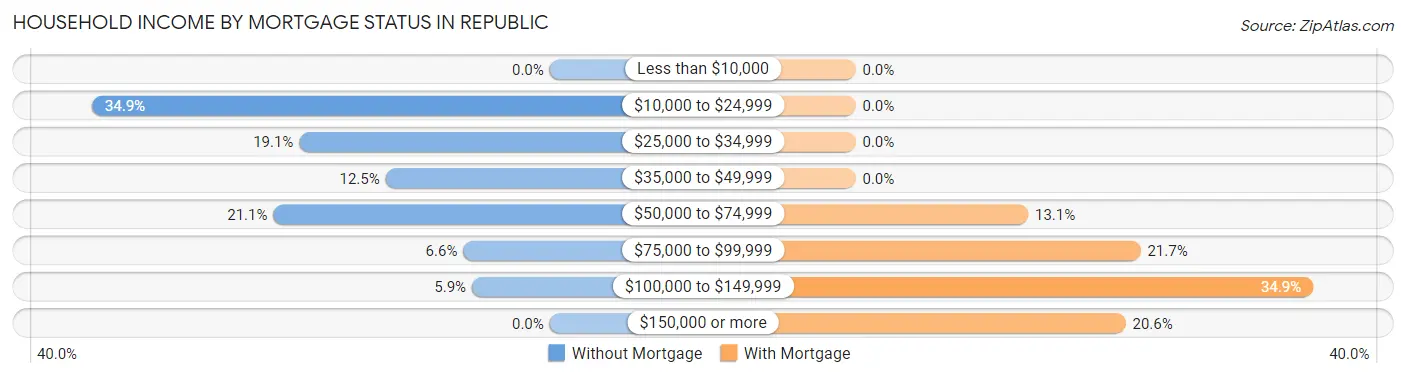
| Household Income | Without Mortgage | With Mortgage |
| Less than $10,000 | 0 (0.0%) | 0 (0.0%) |
| $10,000 to $24,999 | 53 (34.9%) | 0 (0.0%) |
| $25,000 to $34,999 | 29 (19.1%) | 0 (0.0%) |
| $35,000 to $49,999 | 19 (12.5%) | 0 (0.0%) |
| $50,000 to $74,999 | 32 (21.0%) | 23 (13.1%) |
| $75,000 to $99,999 | 10 (6.6%) | 38 (21.7%) |
| $100,000 to $149,999 | 9 (5.9%) | 61 (34.9%) |
| $150,000 or more | 0 (0.0%) | 36 (20.6%) |
| Total | 152 (100.0%) | 175 (100.0%) |
Property Value to Household Income Ratio in Republic
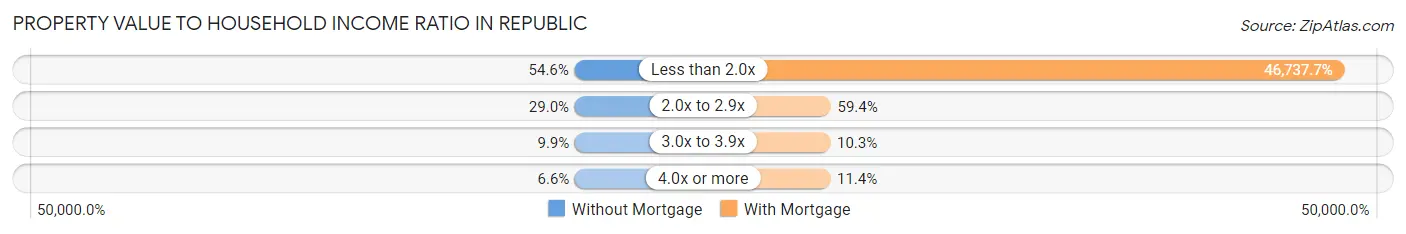
| Value-to-Income Ratio | Without Mortgage | With Mortgage |
| Less than 2.0x | 83 (54.6%) | 81,791 (46,737.7%) |
| 2.0x to 2.9x | 44 (28.9%) | 104 (59.4%) |
| 3.0x to 3.9x | 15 (9.9%) | 18 (10.3%) |
| 4.0x or more | 10 (6.6%) | 20 (11.4%) |
| Total | 152 (100.0%) | 175 (100.0%) |
Real Estate Taxes by Mortgage Status in Republic
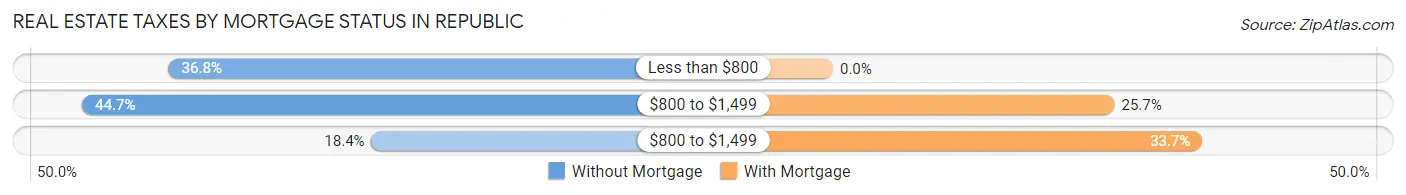
| Property Taxes | Without Mortgage | With Mortgage |
| Less than $800 | 56 (36.8%) | 0 (0.0%) |
| $800 to $1,499 | 68 (44.7%) | 45 (25.7%) |
| $800 to $1,499 | 28 (18.4%) | 59 (33.7%) |
| Total | 152 (100.0%) | 175 (100.0%) |
Health & Disability in Republic
Health Insurance Coverage by Age in Republic
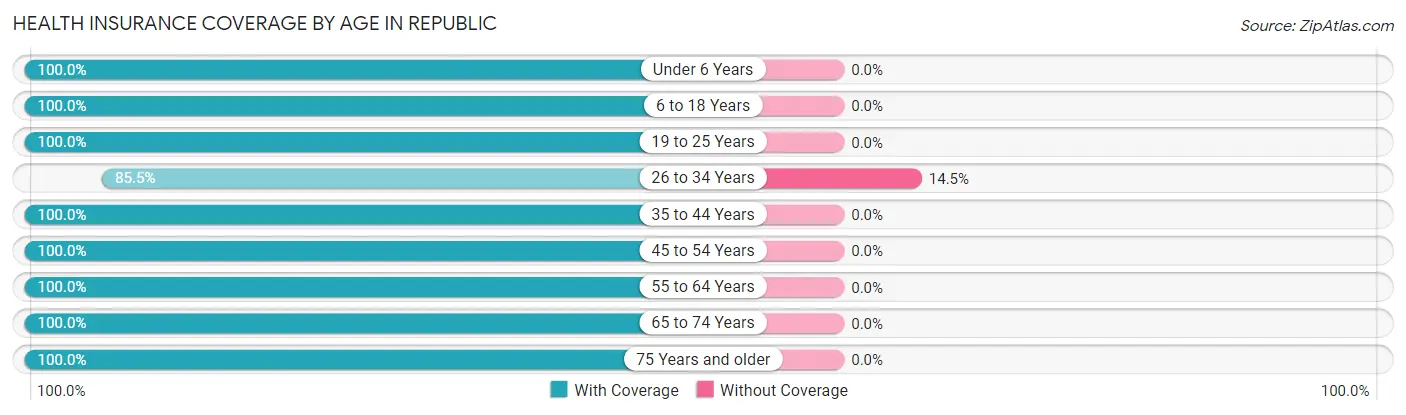
| Age Bracket | With Coverage | Without Coverage |
| Under 6 Years | 105 (100.0%) | 0 (0.0%) |
| 6 to 18 Years | 268 (100.0%) | 0 (0.0%) |
| 19 to 25 Years | 166 (100.0%) | 0 (0.0%) |
| 26 to 34 Years | 130 (85.5%) | 22 (14.5%) |
| 35 to 44 Years | 120 (100.0%) | 0 (0.0%) |
| 45 to 54 Years | 92 (100.0%) | 0 (0.0%) |
| 55 to 64 Years | 131 (100.0%) | 0 (0.0%) |
| 65 to 74 Years | 207 (100.0%) | 0 (0.0%) |
| 75 Years and older | 83 (100.0%) | 0 (0.0%) |
| Total | 1,302 (98.3%) | 22 (1.7%) |
Health Insurance Coverage by Citizenship Status in Republic
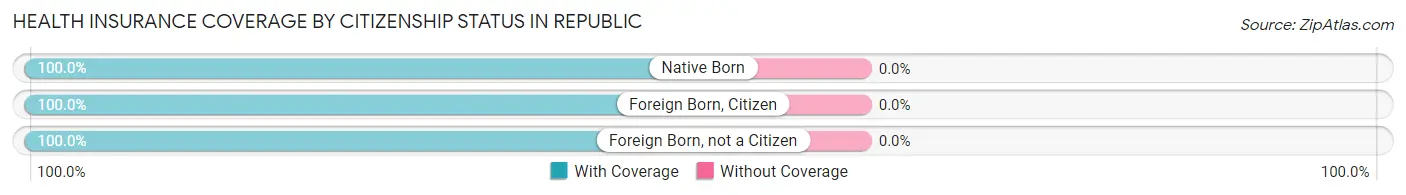
| Citizenship Status | With Coverage | Without Coverage |
| Native Born | 105 (100.0%) | 0 (0.0%) |
| Foreign Born, Citizen | 268 (100.0%) | 0 (0.0%) |
| Foreign Born, not a Citizen | 166 (100.0%) | 0 (0.0%) |
Health Insurance Coverage by Household Income in Republic
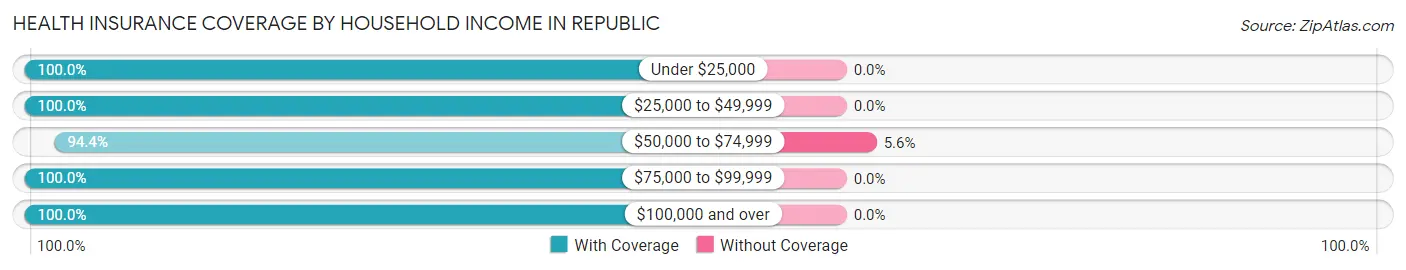
| Household Income | With Coverage | Without Coverage |
| Under $25,000 | 241 (100.0%) | 0 (0.0%) |
| $25,000 to $49,999 | 277 (100.0%) | 0 (0.0%) |
| $50,000 to $74,999 | 370 (94.4%) | 22 (5.6%) |
| $75,000 to $99,999 | 143 (100.0%) | 0 (0.0%) |
| $100,000 and over | 271 (100.0%) | 0 (0.0%) |
Public vs Private Health Insurance Coverage by Age in Republic
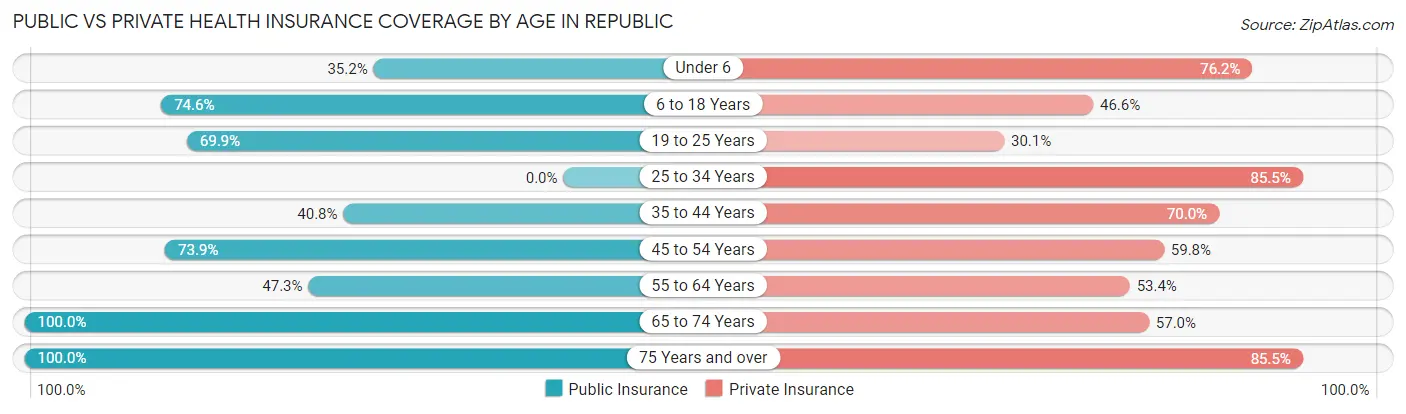
| Age Bracket | Public Insurance | Private Insurance |
| Under 6 | 37 (35.2%) | 80 (76.2%) |
| 6 to 18 Years | 200 (74.6%) | 125 (46.6%) |
| 19 to 25 Years | 116 (69.9%) | 50 (30.1%) |
| 25 to 34 Years | 0 (0.0%) | 130 (85.5%) |
| 35 to 44 Years | 49 (40.8%) | 84 (70.0%) |
| 45 to 54 Years | 68 (73.9%) | 55 (59.8%) |
| 55 to 64 Years | 62 (47.3%) | 70 (53.4%) |
| 65 to 74 Years | 207 (100.0%) | 118 (57.0%) |
| 75 Years and over | 83 (100.0%) | 71 (85.5%) |
| Total | 822 (62.1%) | 783 (59.1%) |
Disability Status by Sex by Age in Republic
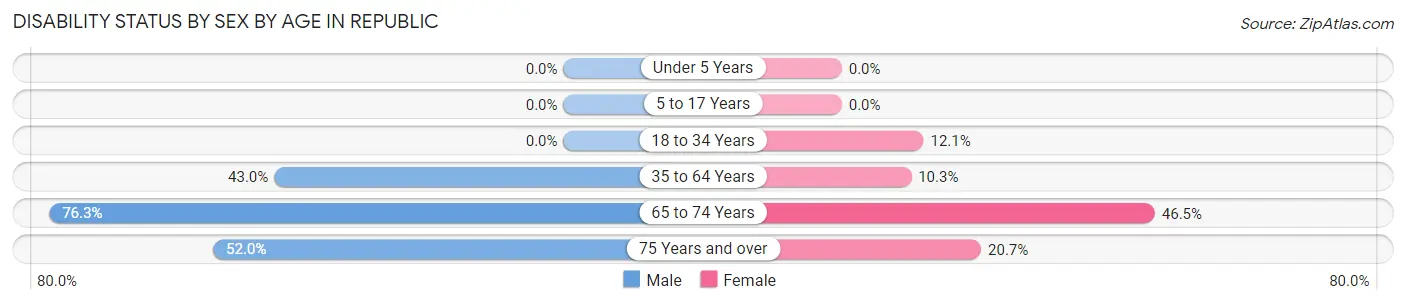
| Age Bracket | Male | Female |
| Under 5 Years | 0 (0.0%) | 0 (0.0%) |
| 5 to 17 Years | 0 (0.0%) | 0 (0.0%) |
| 18 to 34 Years | 0 (0.0%) | 17 (12.1%) |
| 35 to 64 Years | 64 (42.9%) | 20 (10.3%) |
| 65 to 74 Years | 71 (76.3%) | 53 (46.5%) |
| 75 Years and over | 13 (52.0%) | 12 (20.7%) |
Disability Class by Sex by Age in Republic
Disability Class: Hearing Difficulty
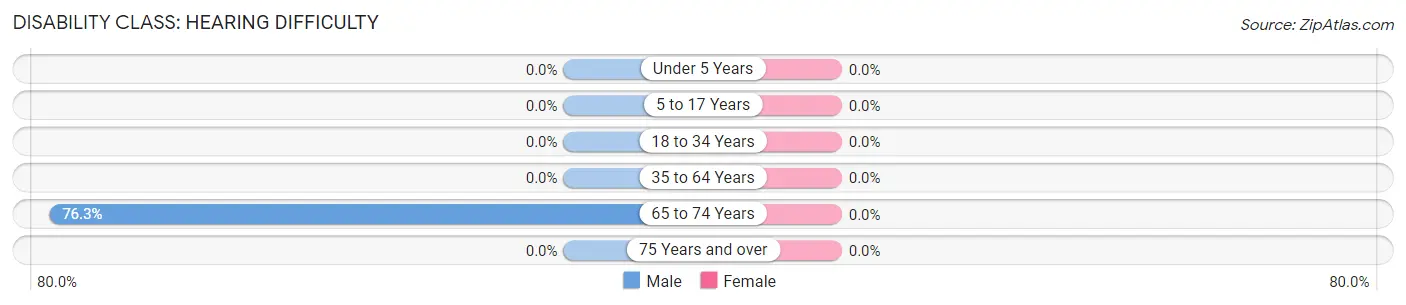
| Age Bracket | Male | Female |
| Under 5 Years | 0 (0.0%) | 0 (0.0%) |
| 5 to 17 Years | 0 (0.0%) | 0 (0.0%) |
| 18 to 34 Years | 0 (0.0%) | 0 (0.0%) |
| 35 to 64 Years | 0 (0.0%) | 0 (0.0%) |
| 65 to 74 Years | 71 (76.3%) | 0 (0.0%) |
| 75 Years and over | 0 (0.0%) | 0 (0.0%) |
Disability Class: Vision Difficulty
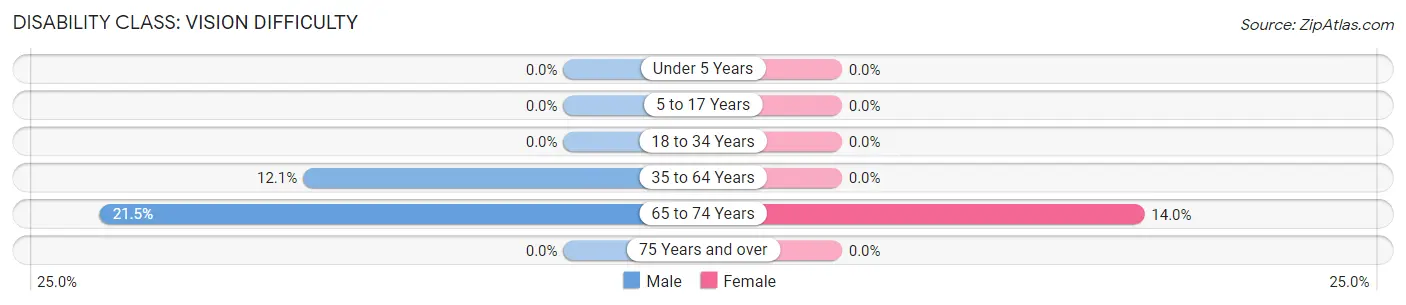
| Age Bracket | Male | Female |
| Under 5 Years | 0 (0.0%) | 0 (0.0%) |
| 5 to 17 Years | 0 (0.0%) | 0 (0.0%) |
| 18 to 34 Years | 0 (0.0%) | 0 (0.0%) |
| 35 to 64 Years | 18 (12.1%) | 0 (0.0%) |
| 65 to 74 Years | 20 (21.5%) | 16 (14.0%) |
| 75 Years and over | 0 (0.0%) | 0 (0.0%) |
Disability Class: Cognitive Difficulty
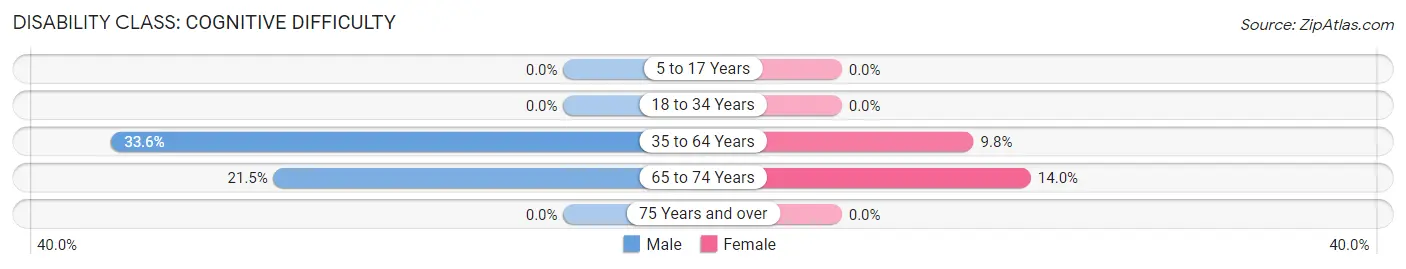
| Age Bracket | Male | Female |
| 5 to 17 Years | 0 (0.0%) | 0 (0.0%) |
| 18 to 34 Years | 0 (0.0%) | 0 (0.0%) |
| 35 to 64 Years | 50 (33.6%) | 19 (9.8%) |
| 65 to 74 Years | 20 (21.5%) | 16 (14.0%) |
| 75 Years and over | 0 (0.0%) | 0 (0.0%) |
Disability Class: Ambulatory Difficulty
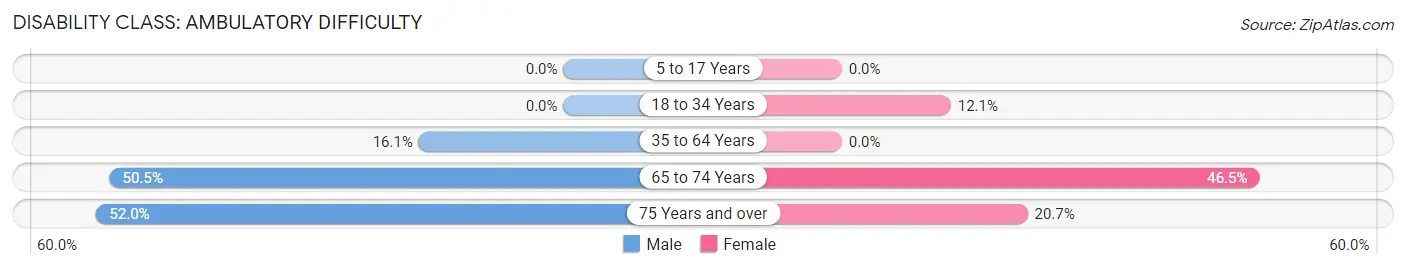
| Age Bracket | Male | Female |
| 5 to 17 Years | 0 (0.0%) | 0 (0.0%) |
| 18 to 34 Years | 0 (0.0%) | 17 (12.1%) |
| 35 to 64 Years | 24 (16.1%) | 0 (0.0%) |
| 65 to 74 Years | 47 (50.5%) | 53 (46.5%) |
| 75 Years and over | 13 (52.0%) | 12 (20.7%) |
Disability Class: Self-Care Difficulty
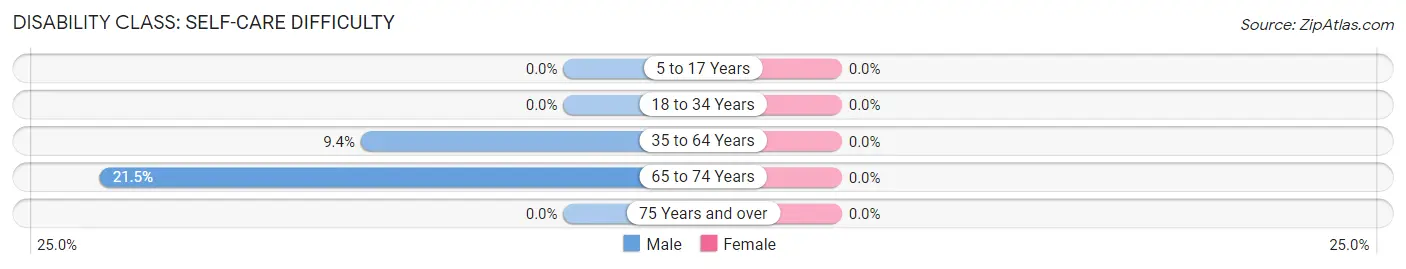
| Age Bracket | Male | Female |
| 5 to 17 Years | 0 (0.0%) | 0 (0.0%) |
| 18 to 34 Years | 0 (0.0%) | 0 (0.0%) |
| 35 to 64 Years | 14 (9.4%) | 0 (0.0%) |
| 65 to 74 Years | 20 (21.5%) | 0 (0.0%) |
| 75 Years and over | 0 (0.0%) | 0 (0.0%) |
Technology Access in Republic
Computing Device Access in Republic
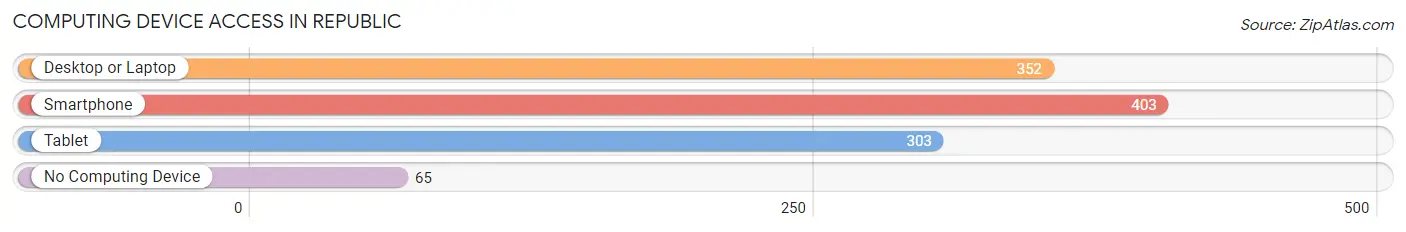
| Device Type | # Households | % Households |
| Desktop or Laptop | 352 | 63.2% |
| Smartphone | 403 | 72.4% |
| Tablet | 303 | 54.4% |
| No Computing Device | 65 | 11.7% |
| Total | 557 | 100.0% |
Internet Access in Republic
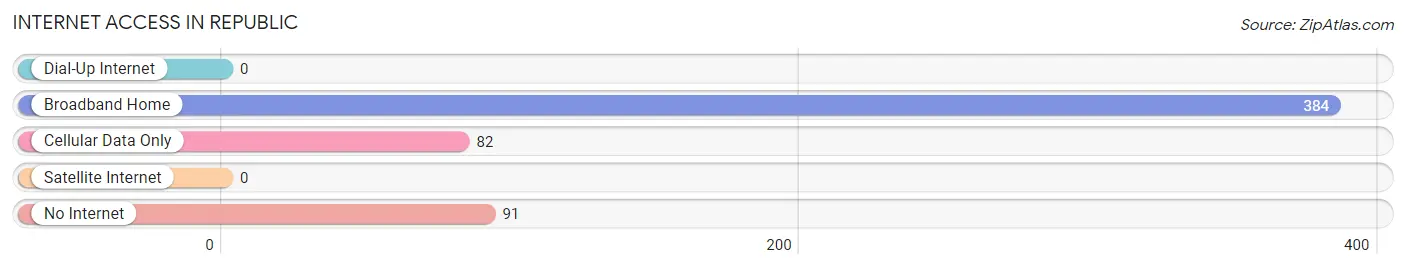
| Internet Type | # Households | % Households |
| Dial-Up Internet | 0 | 0.0% |
| Broadband Home | 384 | 68.9% |
| Cellular Data Only | 82 | 14.7% |
| Satellite Internet | 0 | 0.0% |
| No Internet | 91 | 16.3% |
| Total | 557 | 100.0% |
Republic Summary
Republic, Pennsylvania is a small borough located in the northwest corner of Fayette County, Pennsylvania. It is situated in the foothills of the Allegheny Mountains, approximately 40 miles south of Pittsburgh. The borough was founded in 1832 and is home to a population of approximately 1,000 people.
Geography
Republic is located in the northwest corner of Fayette County, Pennsylvania. It is situated in the foothills of the Allegheny Mountains, approximately 40 miles south of Pittsburgh. The borough is bordered by the townships of Redstone, Luzerne, and Bullskin. The borough is situated on a hillside, with the highest elevation being approximately 1,400 feet above sea level. The terrain is mostly hilly, with some flat areas. The borough is located in a rural area, with the nearest major city being Uniontown, which is approximately 10 miles away.
Climate
Republic has a humid continental climate, with hot summers and cold winters. The average annual temperature is approximately 50 degrees Fahrenheit. The average annual precipitation is approximately 40 inches.
Economy
The economy of Republic is largely based on agriculture and tourism. The borough is home to several small farms, which produce a variety of crops, including corn, soybeans, and hay. The borough is also home to several small businesses, including a grocery store, a hardware store, and a restaurant. The borough is also home to a small winery, which produces a variety of wines.
Demographics
As of the 2010 census, the population of Republic was 1,000 people. The racial makeup of the borough was 97.2% White, 0.7% African American, 0.2% Native American, 0.2% Asian, 0.2% from other races, and 1.7% from two or more races. Hispanic or Latino of any race were 0.7% of the population.
The median income for a household in the borough was $37,500, and the median income for a family was $41,250. The per capita income for the borough was $17,845. About 11.2% of families and 13.2% of the population were below the poverty line, including 16.7% of those under age 18 and 8.3% of those age 65 or over.
Education
The borough is served by the Uniontown Area School District. The district operates two elementary schools, one middle school, and one high school. The district also operates a vocational-technical school.
Conclusion
Republic, Pennsylvania is a small borough located in the northwest corner of Fayette County, Pennsylvania. It is situated in the foothills of the Allegheny Mountains, approximately 40 miles south of Pittsburgh. The borough was founded in 1832 and is home to a population of approximately 1,000 people. The economy of Republic is largely based on agriculture and tourism. The borough is served by the Uniontown Area School District. The racial makeup of the borough is 97.2% White, 0.7% African American, 0.2% Native American, 0.2% Asian, 0.2% from other races, and 1.7% from two or more races. The median income for a household in the borough was $37,500, and the median income for a family was $41,250. Republic is a small, rural borough with a rich history and a bright future.
Common Questions
What is Per Capita Income in Republic?
Per Capita income in Republic is $25,437.
What is the Median Family Income in Republic?
Median Family Income in Republic is $52,583.
What is the Median Household income in Republic?
Median Household Income in Republic is $52,610.
What is Income or Wage Gap in Republic?
Income or Wage Gap in Republic is 10.5%.
Women in Republic earn 89.5 cents for every dollar earned by a man.
What is Inequality or Gini Index in Republic?
Inequality or Gini Index in Republic is 0.42.
What is the Total Population of Republic?
Total Population of Republic is 1,324.
What is the Total Male Population of Republic?
Total Male Population of Republic is 693.
What is the Total Female Population of Republic?
Total Female Population of Republic is 631.
What is the Ratio of Males per 100 Females in Republic?
There are 109.83 Males per 100 Females in Republic.
What is the Ratio of Females per 100 Males in Republic?
There are 91.05 Females per 100 Males in Republic.
What is the Median Population Age in Republic?
Median Population Age in Republic is 34.3 Years.
What is the Average Family Size in Republic
Average Family Size in Republic is 3.1 People.
What is the Average Household Size in Republic
Average Household Size in Republic is 2.4 People.
How Large is the Labor Force in Republic?
There are 602 People in the Labor Forcein in Republic.
What is the Percentage of People in the Labor Force in Republic?
55.5% of People are in the Labor Force in Republic.
What is the Unemployment Rate in Republic?
Unemployment Rate in Republic is 14.5%.