Zip Codes with the Highest Percentage of Population Employed in Community & Social Service in Illinois
RELATED REPORTS & OPTIONS
Community & Social Service
Illinois
Compare Zip Codes
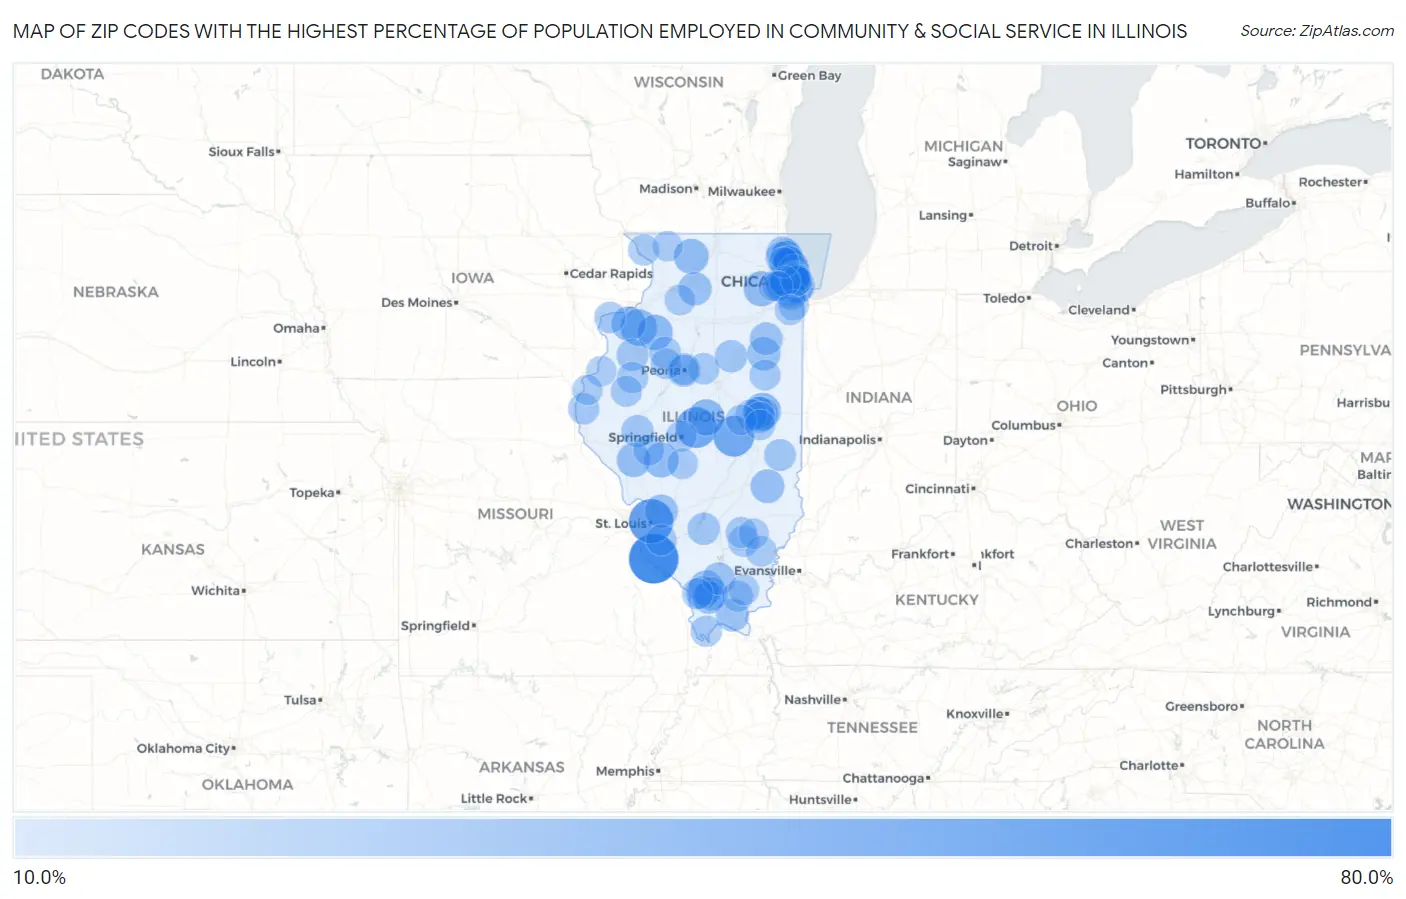
Map of Zip Codes with the Highest Percentage of Population Employed in Community & Social Service in Illinois
10.0%
80.0%
Zip Codes with the Highest Percentage of Population Employed in Community & Social Service in Illinois
| Zip Code | % Employed | vs State | vs National | |
| 1. | 62279 | 64.7% | 11.3%(+53.4)#1 | 11.2%(+53.5)#69 |
| 2. | 62059 | 51.5% | 11.3%(+40.2)#2 | 11.2%(+40.3)#143 |
| 3. | 62519 | 42.5% | 11.3%(+31.2)#3 | 11.2%(+31.3)#255 |
| 4. | 61936 | 42.3% | 11.3%(+31.0)#4 | 11.2%(+31.1)#258 |
| 5. | 61801 | 32.0% | 11.3%(+20.8)#5 | 11.2%(+20.8)#482 |
| 6. | 61468 | 31.5% | 11.3%(+20.2)#6 | 11.2%(+20.2)#513 |
| 7. | 62518 | 31.4% | 11.3%(+20.1)#7 | 11.2%(+20.2)#518 |
| 8. | 61419 | 29.5% | 11.3%(+18.2)#8 | 11.2%(+18.3)#612 |
| 9. | 60519 | 28.6% | 11.3%(+17.3)#9 | 11.2%(+17.4)#661 |
| 10. | 61039 | 28.0% | 11.3%(+16.7)#10 | 11.2%(+16.8)#689 |
| 11. | 62667 | 28.0% | 11.3%(+16.7)#11 | 11.2%(+16.8)#690 |
| 12. | 60615 | 27.0% | 11.3%(+15.7)#12 | 11.2%(+15.8)#773 |
| 13. | 61276 | 26.9% | 11.3%(+15.6)#13 | 11.2%(+15.7)#786 |
| 14. | 61820 | 26.7% | 11.3%(+15.4)#14 | 11.2%(+15.5)#805 |
| 15. | 60203 | 26.6% | 11.3%(+15.3)#15 | 11.2%(+15.4)#816 |
| 16. | 62901 | 26.2% | 11.3%(+14.9)#16 | 11.2%(+15.0)#846 |
| 17. | 62078 | 26.0% | 11.3%(+14.7)#17 | 11.2%(+14.8)#868 |
| 18. | 60201 | 25.5% | 11.3%(+14.2)#18 | 11.2%(+14.3)#916 |
| 19. | 60302 | 25.4% | 11.3%(+14.2)#19 | 11.2%(+14.2)#923 |
| 20. | 62432 | 25.4% | 11.3%(+14.1)#20 | 11.2%(+14.2)#925 |
| 21. | 60305 | 25.1% | 11.3%(+13.8)#21 | 11.2%(+13.9)#963 |
| 22. | 61625 | 24.5% | 11.3%(+13.2)#22 | 11.2%(+13.3)#1,040 |
| 23. | 60304 | 24.3% | 11.3%(+13.0)#23 | 11.2%(+13.1)#1,067 |
| 24. | 61324 | 24.1% | 11.3%(+12.9)#24 | 11.2%(+12.9)#1,085 |
| 25. | 62026 | 24.1% | 11.3%(+12.8)#25 | 11.2%(+12.9)#1,096 |
| 26. | 60946 | 24.0% | 11.3%(+12.7)#26 | 11.2%(+12.7)#1,116 |
| 27. | 62943 | 23.7% | 11.3%(+12.4)#27 | 11.2%(+12.5)#1,153 |
| 28. | 62902 | 23.6% | 11.3%(+12.3)#28 | 11.2%(+12.4)#1,169 |
| 29. | 60969 | 22.9% | 11.3%(+11.6)#29 | 11.2%(+11.6)#1,297 |
| 30. | 62903 | 22.6% | 11.3%(+11.3)#30 | 11.2%(+11.4)#1,340 |
| 31. | 62958 | 22.4% | 11.3%(+11.1)#31 | 11.2%(+11.2)#1,388 |
| 32. | 62841 | 22.2% | 11.3%(+10.9)#32 | 11.2%(+11.0)#1,426 |
| 33. | 60043 | 21.7% | 11.3%(+10.4)#33 | 11.2%(+10.5)#1,542 |
| 34. | 61743 | 21.6% | 11.3%(+10.4)#34 | 11.2%(+10.4)#1,555 |
| 35. | 62250 | 21.6% | 11.3%(+10.3)#35 | 11.2%(+10.4)#1,563 |
| 36. | 62611 | 21.6% | 11.3%(+10.3)#36 | 11.2%(+10.4)#1,565 |
| 37. | 60202 | 21.6% | 11.3%(+10.3)#37 | 11.2%(+10.3)#1,578 |
| 38. | 60040 | 21.5% | 11.3%(+10.2)#38 | 11.2%(+10.3)#1,590 |
| 39. | 60029 | 20.8% | 11.3%(+9.55)#39 | 11.2%(+9.62)#1,764 |
| 40. | 60091 | 20.7% | 11.3%(+9.46)#40 | 11.2%(+9.53)#1,795 |
| 41. | 60045 | 20.6% | 11.3%(+9.37)#41 | 11.2%(+9.43)#1,826 |
| 42. | 61423 | 20.5% | 11.3%(+9.22)#42 | 11.2%(+9.29)#1,866 |
| 43. | 61933 | 20.5% | 11.3%(+9.22)#43 | 11.2%(+9.28)#1,870 |
| 44. | 61822 | 20.1% | 11.3%(+8.79)#44 | 11.2%(+8.85)#1,994 |
| 45. | 60093 | 20.0% | 11.3%(+8.74)#45 | 11.2%(+8.81)#2,005 |
| 46. | 61451 | 20.0% | 11.3%(+8.72)#46 | 11.2%(+8.79)#2,018 |
| 47. | 60640 | 19.7% | 11.3%(+8.37)#47 | 11.2%(+8.44)#2,145 |
| 48. | 60456 | 19.6% | 11.3%(+8.33)#48 | 11.2%(+8.39)#2,160 |
| 49. | 60660 | 19.5% | 11.3%(+8.25)#49 | 11.2%(+8.32)#2,188 |
| 50. | 61875 | 19.4% | 11.3%(+8.09)#50 | 11.2%(+8.16)#2,249 |
| 51. | 61259 | 19.3% | 11.3%(+8.00)#51 | 11.2%(+8.06)#2,284 |
| 52. | 62348 | 19.2% | 11.3%(+7.95)#52 | 11.2%(+8.02)#2,297 |
| 53. | 60015 | 19.2% | 11.3%(+7.92)#53 | 11.2%(+7.98)#2,309 |
| 54. | 60035 | 19.2% | 11.3%(+7.90)#54 | 11.2%(+7.97)#2,317 |
| 55. | 62886 | 19.1% | 11.3%(+7.81)#55 | 11.2%(+7.88)#2,354 |
| 56. | 61530 | 19.1% | 11.3%(+7.79)#56 | 11.2%(+7.86)#2,366 |
| 57. | 61470 | 19.0% | 11.3%(+7.75)#57 | 11.2%(+7.82)#2,387 |
| 58. | 62964 | 19.0% | 11.3%(+7.71)#58 | 11.2%(+7.77)#2,401 |
| 59. | 61041 | 18.9% | 11.3%(+7.66)#59 | 11.2%(+7.72)#2,417 |
| 60. | 60613 | 18.8% | 11.3%(+7.56)#60 | 11.2%(+7.63)#2,454 |
| 61. | 60526 | 18.8% | 11.3%(+7.54)#61 | 11.2%(+7.61)#2,460 |
| 62. | 60022 | 18.8% | 11.3%(+7.53)#62 | 11.2%(+7.60)#2,462 |
| 63. | 60604 | 18.8% | 11.3%(+7.47)#63 | 11.2%(+7.54)#2,491 |
| 64. | 60637 | 18.7% | 11.3%(+7.40)#64 | 11.2%(+7.46)#2,520 |
| 65. | 61874 | 18.6% | 11.3%(+7.37)#65 | 11.2%(+7.43)#2,533 |
| 66. | 60626 | 18.6% | 11.3%(+7.36)#66 | 11.2%(+7.43)#2,538 |
| 67. | 62850 | 18.6% | 11.3%(+7.34)#67 | 11.2%(+7.40)#2,546 |
| 68. | 62975 | 18.6% | 11.3%(+7.32)#68 | 11.2%(+7.39)#2,551 |
| 69. | 61455 | 18.6% | 11.3%(+7.29)#69 | 11.2%(+7.36)#2,570 |
| 70. | 62695 | 18.5% | 11.3%(+7.25)#70 | 11.2%(+7.32)#2,585 |
| 71. | 62987 | 18.4% | 11.3%(+7.14)#71 | 11.2%(+7.21)#2,623 |
| 72. | 60962 | 18.3% | 11.3%(+6.98)#72 | 11.2%(+7.04)#2,693 |
| 73. | 61529 | 18.2% | 11.3%(+6.90)#73 | 11.2%(+6.97)#2,725 |
| 74. | 60657 | 18.2% | 11.3%(+6.87)#74 | 11.2%(+6.94)#2,744 |
| 75. | 62285 | 18.1% | 11.3%(+6.86)#75 | 11.2%(+6.93)#2,751 |
| 76. | 60546 | 18.0% | 11.3%(+6.71)#76 | 11.2%(+6.77)#2,819 |
| 77. | 62701 | 17.9% | 11.3%(+6.63)#77 | 11.2%(+6.70)#2,860 |
| 78. | 62533 | 17.8% | 11.3%(+6.56)#78 | 11.2%(+6.62)#2,905 |
| 79. | 62946 | 17.8% | 11.3%(+6.50)#79 | 11.2%(+6.57)#2,924 |
| 80. | 61243 | 17.8% | 11.3%(+6.50)#80 | 11.2%(+6.56)#2,929 |
| 81. | 61856 | 17.5% | 11.3%(+6.24)#81 | 11.2%(+6.31)#3,054 |
| 82. | 60558 | 17.5% | 11.3%(+6.23)#82 | 11.2%(+6.30)#3,057 |
| 83. | 62820 | 17.5% | 11.3%(+6.18)#83 | 11.2%(+6.25)#3,080 |
| 84. | 60614 | 17.4% | 11.3%(+6.15)#84 | 11.2%(+6.22)#3,094 |
| 85. | 60655 | 17.4% | 11.3%(+6.11)#85 | 11.2%(+6.17)#3,130 |
| 86. | 60515 | 17.2% | 11.3%(+5.92)#86 | 11.2%(+5.99)#3,248 |
| 87. | 60611 | 17.1% | 11.3%(+5.87)#87 | 11.2%(+5.93)#3,282 |
| 88. | 61880 | 17.1% | 11.3%(+5.85)#88 | 11.2%(+5.92)#3,299 |
| 89. | 60642 | 17.1% | 11.3%(+5.84)#89 | 11.2%(+5.90)#3,308 |
| 90. | 60430 | 17.1% | 11.3%(+5.77)#90 | 11.2%(+5.84)#3,342 |
| 91. | 60605 | 17.0% | 11.3%(+5.75)#91 | 11.2%(+5.82)#3,359 |
| 92. | 60130 | 17.0% | 11.3%(+5.73)#92 | 11.2%(+5.79)#3,374 |
| 93. | 61606 | 17.0% | 11.3%(+5.72)#93 | 11.2%(+5.79)#3,379 |
| 94. | 60062 | 17.0% | 11.3%(+5.69)#94 | 11.2%(+5.76)#3,398 |
| 95. | 60514 | 17.0% | 11.3%(+5.68)#95 | 11.2%(+5.75)#3,403 |
| 96. | 61454 | 16.9% | 11.3%(+5.66)#96 | 11.2%(+5.73)#3,422 |
| 97. | 62842 | 16.8% | 11.3%(+5.56)#97 | 11.2%(+5.63)#3,482 |
| 98. | 61044 | 16.8% | 11.3%(+5.51)#98 | 11.2%(+5.58)#3,519 |
| 99. | 60443 | 16.8% | 11.3%(+5.51)#99 | 11.2%(+5.57)#3,523 |
| 100. | 62341 | 16.7% | 11.3%(+5.42)#100 | 11.2%(+5.48)#3,569 |
Common Questions
What are the Top 10 Zip Codes with the Highest Percentage of Population Employed in Community & Social Service in Illinois?
Top 10 Zip Codes with the Highest Percentage of Population Employed in Community & Social Service in Illinois are:
What zip code has the Highest Percentage of Population Employed in Community & Social Service in Illinois?
62279 has the Highest Percentage of Population Employed in Community & Social Service in Illinois with 64.7%.
What is the Percentage of Population Employed in Community & Social Service in the State of Illinois?
Percentage of Population Employed in Community & Social Service in Illinois is 11.3%.
What is the Percentage of Population Employed in Community & Social Service in the United States?
Percentage of Population Employed in Community & Social Service in the United States is 11.2%.