Zip Codes with the Highest Percentage of Population Employed in Community & Social Service in Beaverton, OR

RELATED REPORTS & OPTIONS

Community & Social Service
Population
Families and Households
Female Fertility
Female Fertility (Unmarried)
Race (Community Size)
Race (Percentage)
Ancestry (Community Size)
AfghanAfricanAmericanApacheArabArgentineanArmenianAssyrian / Chaldean / SyriacAustralianAustrianBangladeshiBasqueBelgianBhutaneseBlackfeetBrazilianBritishBulgarianBurmeseCanadianCentral AmericanCentral American IndianCherokeeChileanChineseChippewaChoctawColombianCosta RicanCroatianCubanCzechCzechoslovakianDanishDominicanDutchEastern EuropeanEcuadorianEgyptianEnglishEthiopianEuropeanFilipinoFinnishFrenchFrench CanadianGermanGhanaianGreekGuamanian / ChamorroGuatemalanHaitianHonduranHungarianIcelanderIndian (Asian)IranianIraqiIrishIsraeliItalianJamaicanJapaneseKenyanKoreanLaotianLebaneseLithuanianLuxembourgerMacedonianMalaysianMexicanMexican American IndianMongolianMoroccanNative HawaiianNavajoNew ZealanderNicaraguanNigerianNorthern EuropeanNorwegianOkinawanPakistaniPalestinianPanamanianPeruvianPolishPortuguesePuerto RicanRomanianRussianSalvadoranSamoanScandinavianScotch-IrishScottishSerbianSiouxSlavicSlovakSloveneSomaliSouth AfricanSouth AmericanSouth American IndianSpaniardSpanishSri LankanSubsaharan AfricanSwedishSwissSyrianThaiTlingit-HaidaTurkishUkrainianUruguayanVenezuelanWelshWest IndianYaquiYugoslavian
Ancestry (Percentage)
AfghanAfricanAmericanApacheArabArgentineanArmenianAssyrian / Chaldean / SyriacAustralianAustrianBangladeshiBasqueBelgianBhutaneseBlackfeetBrazilianBritishBulgarianBurmeseCanadianCentral AmericanCentral American IndianCherokeeChileanChineseChippewaChoctawColombianCosta RicanCroatianCubanCzechCzechoslovakianDanishDominicanDutchEastern EuropeanEcuadorianEgyptianEnglishEthiopianEuropeanFilipinoFinnishFrenchFrench CanadianGermanGhanaianGreekGuamanian / ChamorroGuatemalanHaitianHonduranHungarianIcelanderIndian (Asian)IranianIraqiIrishIsraeliItalianJamaicanJapaneseKenyanKoreanLaotianLebaneseLithuanianLuxembourgerMacedonianMalaysianMexicanMexican American IndianMongolianMoroccanNative HawaiianNavajoNew ZealanderNicaraguanNigerianNorthern EuropeanNorwegianOkinawanPakistaniPalestinianPanamanianPeruvianPolishPortuguesePuerto RicanRomanianRussianSalvadoranSamoanScandinavianScotch-IrishScottishSerbianSiouxSlavicSlovakSloveneSomaliSouth AfricanSouth AmericanSouth American IndianSpaniardSpanishSri LankanSubsaharan AfricanSwedishSwissSyrianThaiTlingit-HaidaTurkishUkrainianUruguayanVenezuelanWelshWest IndianYaquiYugoslavian
Immigrant Origin (Total)
AfghanistanAfricaArgentinaArmeniaAsiaAustraliaBelgiumBosnia and HerzegovinaBrazilBulgariaCambodiaCanadaCaribbeanCentral AmericaChileChinaColombiaCroatiaCubaCzechoslovakiaDenmarkEastern AfricaEastern AsiaEastern EuropeEcuadorEgyptEl SalvadorEnglandEthiopiaEuropeFijiFranceGermanyGhanaGuatemalaHaitiHong KongHungaryIndiaIndonesiaIranIraqIrelandIsraelItalyJapanKazakhstanKenyaKoreaKuwaitLaosLatin AmericaLebanonMalaysiaMexicoMiddle AfricaMoroccoNepalNetherlandsNicaraguaNigeriaNorth MacedoniaNorthern AfricaNorthern EuropeOceaniaPakistanPanamaPeruPhilippinesRomaniaRussiaSaudi ArabiaSingaporeSomaliaSouth AfricaSouth AmericaSouth Central AsiaSouth Eastern AsiaSouthern EuropeSpainSri LankaSwedenSyriaTaiwanThailandTurkeyUkraineUruguayUzbekistanVenezuelaVietnamWestern AfricaWestern AsiaWestern EuropeZaire
Immigrant Origin (Percentage)
AfghanistanAfricaArgentinaArmeniaAsiaAustraliaBelgiumBosnia and HerzegovinaBrazilBulgariaCambodiaCanadaCaribbeanCentral AmericaChileChinaColombiaCroatiaCubaCzechoslovakiaDenmarkEastern AfricaEastern AsiaEastern EuropeEcuadorEgyptEl SalvadorEnglandEthiopiaEuropeFijiFranceGermanyGhanaGuatemalaHaitiHong KongHungaryIndiaIndonesiaIranIraqIrelandIsraelItalyJapanKazakhstanKenyaKoreaKuwaitLaosLatin AmericaLebanonMalaysiaMexicoMiddle AfricaMoroccoNepalNetherlandsNicaraguaNigeriaNorth MacedoniaNorthern AfricaNorthern EuropeOceaniaPakistanPanamaPeruPhilippinesRomaniaRussiaSaudi ArabiaSingaporeSomaliaSouth AfricaSouth AmericaSouth Central AsiaSouth Eastern AsiaSouthern EuropeSpainSri LankaSwedenSyriaTaiwanThailandTurkeyUkraineUruguayUzbekistanVenezuelaVietnamWestern AfricaWestern AsiaWestern EuropeZaire
Income
Income (Families)
Income (Households)
Poverty
Poverty (Families)
Unemployment
Employment Occupations
Employment Industries
Employer Class
Commute Time
Commute Means
School Enrollment
Education by Degree Field
Occupancy
Finances
Physical Characteristics
Beaverton
Compare Zip Codes
Comparison Subject

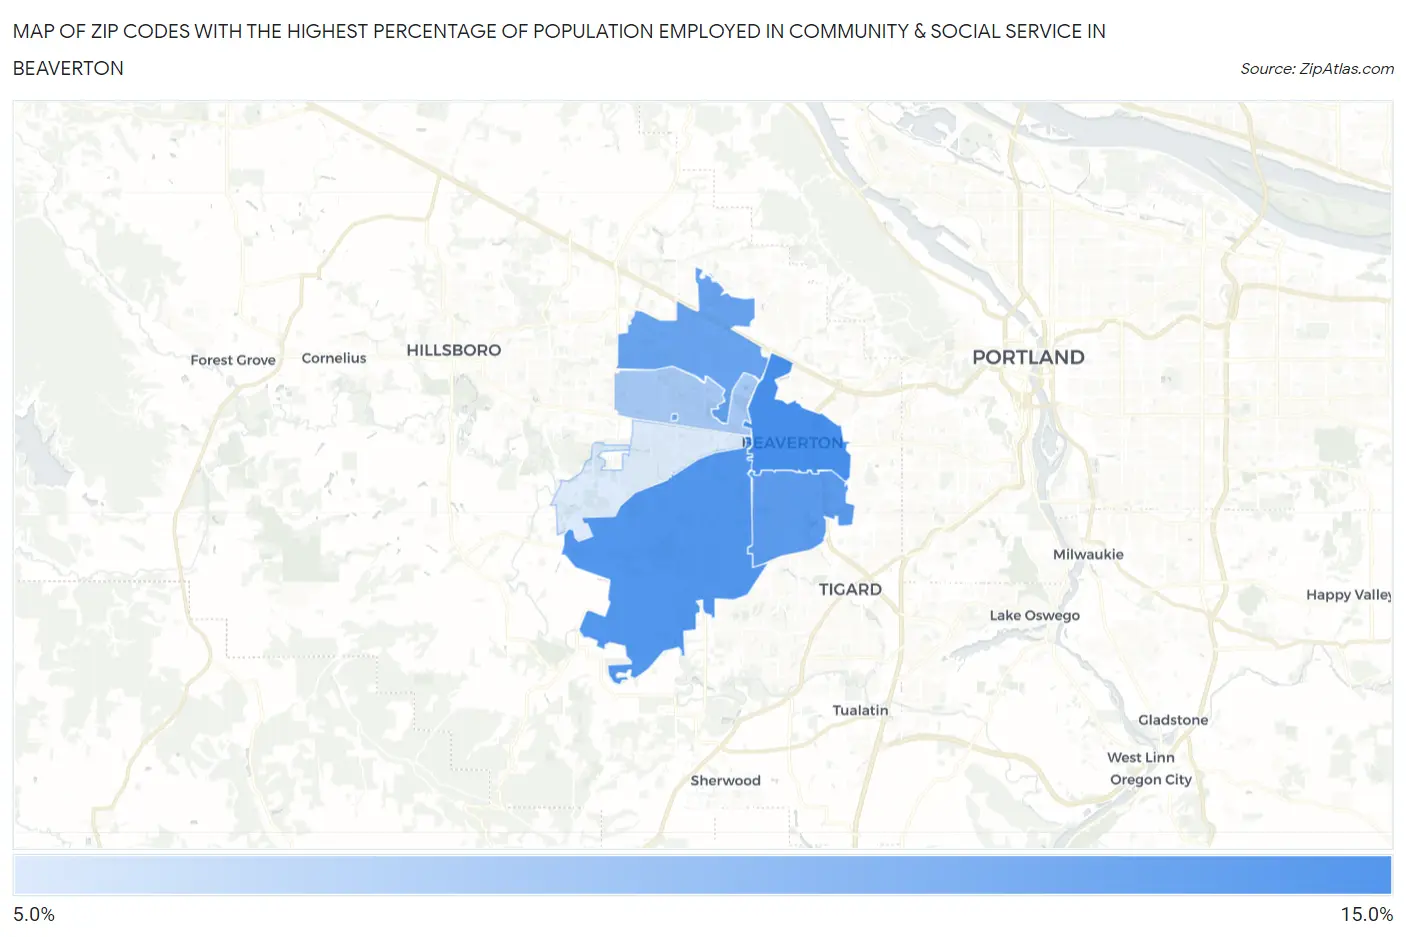
Map of Zip Codes with the Highest Percentage of Population Employed in Community & Social Service in Beaverton

0.0%
15.0%
Zip Codes with the Highest Percentage of Population Employed in Community & Social Service  in Beaverton Map

Zip Codes with the Highest Percentage of Population Employed in Community & Social Service in Beaverton, OR

Zip Code % Employed vs State vs National
1.9700511.3%11.4%(-0.086)#13011.2%(+0.081)#10,895
2.9700710.8%11.4%(-0.534)#14511.2%(-0.367)#12,019
3.9700810.6%11.4%(-0.756)#15011.2%(-0.588)#12,575
4.9700610.1%11.4%(-1.32)#16711.2%(-1.16)#13,983
5.970037.9%11.4%(-3.44)#24411.2%(-3.27)#19,743
6.970786.0%11.4%(-5.34)#29811.2%(-5.17)#24,280

Common Questions

What are the Top 5 Zip Codes with the Highest Percentage of Population Employed in Community & Social Service in Beaverton, OR?
Top 5 Zip Codes with the Highest Percentage of Population Employed in Community & Social Service in Beaverton, OR are:
#1
11.3%
#2
10.8%
#3
10.6%
#4
10.1%
#5
7.9%
What zip code has the Highest Percentage of Population Employed in Community & Social Service in Beaverton, OR?
97005 has the Highest Percentage of Population Employed in Community & Social Service in Beaverton, OR with 11.3%.
What is the Percentage of Population Employed in Community & Social Service in Beaverton, OR?
Percentage of Population Employed in Community & Social Service in Beaverton is 10.5%.
What is the Percentage of Population Employed in Community & Social Service in Oregon?
Percentage of Population Employed in Community & Social Service in Oregon is 11.4%.
What is the Percentage of Population Employed in Community & Social Service in the United States?
Percentage of Population Employed in Community & Social Service in the United States is 11.2%.