Zip Codes with the Highest Percentage of Households with Income Below $10,000 in Oklahoma City, OK
RELATED REPORTS & OPTIONS
Household Income | $0-10k
Oklahoma City
Compare Zip Codes
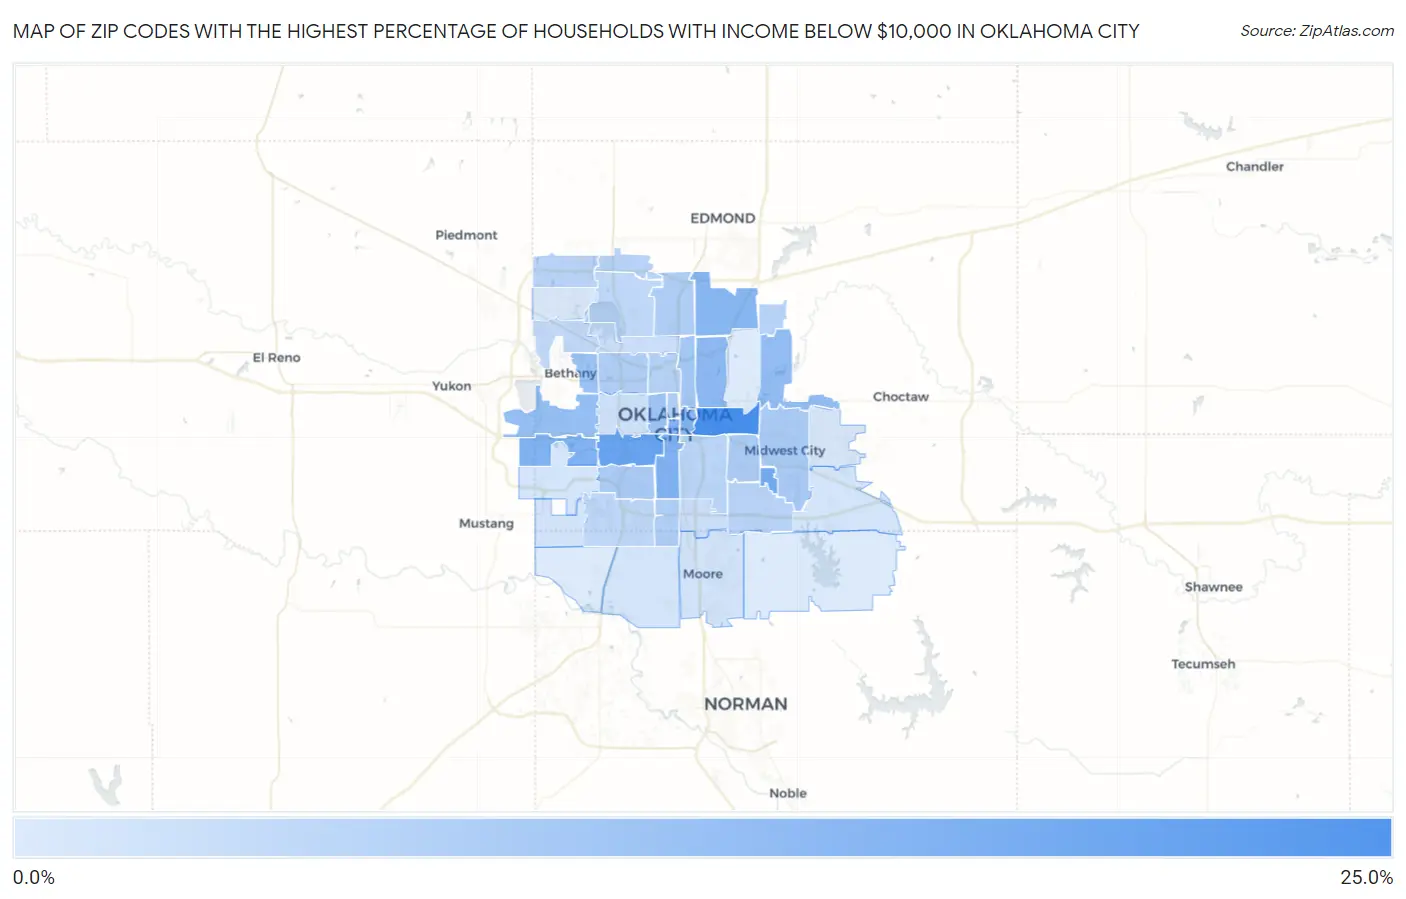
Map of Zip Codes with the Highest Percentage of Households with Income Below $10,000 in Oklahoma City
1.9%
20.5%
Zip Codes with the Highest Percentage of Households with Income Below $10,000 in Oklahoma City, OK
| Zip Code | Households with Income < $10k | vs State | vs National | |
| 1. | 73117 | 20.5% | 5.6%(+14.9)#13 | 4.9%(+15.6)#745 |
| 2. | 73108 | 15.8% | 5.6%(+10.2)#22 | 4.9%(+10.9)#1,376 |
| 3. | 73145 | 14.8% | 5.6%(+9.20)#27 | 4.9%(+9.90)#1,570 |
| 4. | 73128 | 13.1% | 5.6%(+7.50)#34 | 4.9%(+8.20)#2,037 |
| 5. | 73109 | 12.9% | 5.6%(+7.30)#35 | 4.9%(+8.00)#2,113 |
| 6. | 73102 | 12.7% | 5.6%(+7.10)#38 | 4.9%(+7.80)#2,204 |
| 7. | 73104 | 12.1% | 5.6%(+6.50)#43 | 4.9%(+7.20)#2,425 |
| 8. | 73131 | 12.1% | 5.6%(+6.50)#44 | 4.9%(+7.20)#2,426 |
| 9. | 73111 | 11.5% | 5.6%(+5.90)#48 | 4.9%(+6.60)#2,678 |
| 10. | 73141 | 10.6% | 5.6%(+5.00)#63 | 4.9%(+5.70)#3,196 |
| 11. | 73127 | 10.4% | 5.6%(+4.80)#66 | 4.9%(+5.50)#3,292 |
| 12. | 73122 | 9.7% | 5.6%(+4.10)#87 | 4.9%(+4.80)#3,817 |
| 13. | 73106 | 9.3% | 5.6%(+3.70)#94 | 4.9%(+4.40)#4,112 |
| 14. | 73105 | 8.6% | 5.6%(+3.00)#116 | 4.9%(+3.70)#4,856 |
| 15. | 73110 | 7.9% | 5.6%(+2.30)#141 | 4.9%(+3.00)#5,675 |
| 16. | 73119 | 7.8% | 5.6%(+2.20)#145 | 4.9%(+2.90)#5,809 |
| 17. | 73115 | 7.5% | 5.6%(+1.90)#155 | 4.9%(+2.60)#6,222 |
| 18. | 73114 | 7.4% | 5.6%(+1.80)#161 | 4.9%(+2.50)#6,364 |
| 19. | 73112 | 7.2% | 5.6%(+1.60)#168 | 4.9%(+2.30)#6,632 |
| 20. | 73103 | 7.2% | 5.6%(+1.60)#171 | 4.9%(+2.30)#6,695 |
| 21. | 73139 | 6.9% | 5.6%(+1.30)#183 | 4.9%(+2.00)#7,129 |
| 22. | 73118 | 6.4% | 5.6%(+0.800)#209 | 4.9%(+1.50)#8,145 |
| 23. | 73151 | 6.4% | 5.6%(+0.800)#212 | 4.9%(+1.50)#8,228 |
| 24. | 73142 | 6.2% | 5.6%(+0.600)#219 | 4.9%(+1.30)#8,571 |
| 25. | 73135 | 6.1% | 5.6%(+0.500)#223 | 4.9%(+1.20)#8,774 |
| 26. | 73134 | 6.1% | 5.6%(+0.500)#225 | 4.9%(+1.20)#8,830 |
| 27. | 73129 | 6.0% | 5.6%(+0.400)#231 | 4.9%(+1.10)#9,016 |
| 28. | 73159 | 5.4% | 5.6%(-0.200)#276 | 4.9%(+0.500)#10,463 |
| 29. | 73120 | 5.3% | 5.6%(-0.300)#285 | 4.9%(+0.400)#10,744 |
| 30. | 73132 | 5.0% | 5.6%(-0.600)#310 | 4.9%(+0.100)#11,695 |
| 31. | 73116 | 4.0% | 5.6%(-1.60)#392 | 4.9%(-0.900)#15,355 |
| 32. | 73149 | 3.9% | 5.6%(-1.70)#402 | 4.9%(-1.00)#15,771 |
| 33. | 73107 | 3.8% | 5.6%(-1.80)#407 | 4.9%(-1.10)#16,048 |
| 34. | 73169 | 3.3% | 5.6%(-2.30)#445 | 4.9%(-1.60)#18,281 |
| 35. | 73160 | 3.1% | 5.6%(-2.50)#458 | 4.9%(-1.80)#18,858 |
| 36. | 73170 | 3.0% | 5.6%(-2.60)#465 | 4.9%(-1.90)#19,314 |
| 37. | 73179 | 2.9% | 5.6%(-2.70)#480 | 4.9%(-2.00)#19,991 |
| 38. | 73150 | 2.9% | 5.6%(-2.70)#481 | 4.9%(-2.00)#20,004 |
| 39. | 73130 | 2.5% | 5.6%(-3.10)#510 | 4.9%(-2.40)#21,611 |
| 40. | 73162 | 2.2% | 5.6%(-3.40)#530 | 4.9%(-2.70)#22,867 |
| 41. | 73173 | 2.0% | 5.6%(-3.60)#542 | 4.9%(-2.90)#23,765 |
| 42. | 73121 | 2.0% | 5.6%(-3.60)#543 | 4.9%(-2.90)#23,788 |
| 43. | 73165 | 1.9% | 5.6%(-3.70)#547 | 4.9%(-3.00)#24,097 |
1
Common Questions
What are the Top 10 Zip Codes with the Highest Percentage of Households with Income Below $10,000 in Oklahoma City, OK?
Top 10 Zip Codes with the Highest Percentage of Households with Income Below $10,000 in Oklahoma City, OK are:
What zip code has the Highest Percentage of Households with Income Below $10,000 in Oklahoma City, OK?
73117 has the Highest Percentage of Households with Income Below $10,000 in Oklahoma City, OK with 20.5%.
What is the Percentage of Households with Income Below $10,000 in Oklahoma City, OK?
Percentage of Households with Income Below $10,000 in Oklahoma City is 5.8%.
What is the Percentage of Households with Income Below $10,000 in Oklahoma?
Percentage of Households with Income Below $10,000 in Oklahoma is 5.6%.
What is the Percentage of Households with Income Below $10,000 in the United States?
Percentage of Households with Income Below $10,000 in the United States is 4.9%.