Zip Codes with the Highest Poverty Level Among Females Between Ages 25 and 34 in Oklahoma City, OK

RELATED REPORTS & OPTIONS

Highest Poverty | Female 25-34
Population
Families and Households
Female Fertility
Female Fertility (Unmarried)
Race (Community Size)
Race (Percentage)
Ancestry (Community Size)
AfricanAlaska NativeAlbanianAmericanApacheArabArapahoArgentineanArmenianAustralianAustrianBahamianBangladeshiBarbadianBasqueBelgianBhutaneseBlackfeetBolivianBrazilianBritishBritish West IndianBulgarianBurmeseCajunCambodianCanadianCelticCentral AmericanCentral American IndianCherokeeCheyenneChickasawChileanChippewaChoctawColombianComancheCreeCreekCroatianCubanCzechCzechoslovakianDanishDelawareDominicanDutchDutch West IndianEastern EuropeanEcuadorianEgyptianEnglishEstonianEthiopianEuropeanFijianFilipinoFinnishFrenchFrench American IndianFrench CanadianGermanGerman RussianGhanaianGreekGuamanian / ChamorroGuatemalanGuyaneseHaitianHonduranHopiHungarianIcelanderIndian (Asian)IndonesianInupiatIranianIraqiIrishIroquoisIsraeliItalianJamaicanJapaneseJordanianKenyanKiowaKoreanLaotianLatvianLebaneseLiberianLithuanianLuxembourgerMalaysianMexicanMexican American IndianMongolianMoroccanNative HawaiianNavajoNew ZealanderNicaraguanNigerianNorthern EuropeanNorwegianOkinawanOsagePakistaniPalestinianPanamanianPennsylvania GermanPeruvianPimaPolishPortuguesePotawatomiPuebloPuerto RicanRomanianRussianSalvadoranSamoanScandinavianScotch-IrishScottishSeminoleSerbianSiouxSlavicSlovakSloveneSouth AfricanSouth AmericanSouth American IndianSpaniardSpanishSpanish American IndianSri LankanSubsaharan AfricanSudaneseSwedishSwissSyrianThaiTlingit-HaidaTonganTrinidadian and TobagonianTurkishU.S. Virgin IslanderUkrainianUruguayanVenezuelanVietnameseWelshWest IndianYugoslavianZimbabwean
Ancestry (Percentage)
AfricanAlaska NativeAlbanianAmericanApacheArabArapahoArgentineanArmenianAustralianAustrianBahamianBangladeshiBarbadianBasqueBelgianBhutaneseBlackfeetBolivianBrazilianBritishBritish West IndianBulgarianBurmeseCajunCambodianCanadianCelticCentral AmericanCentral American IndianCherokeeCheyenneChickasawChileanChippewaChoctawColombianComancheCreeCreekCroatianCubanCzechCzechoslovakianDanishDelawareDominicanDutchDutch West IndianEastern EuropeanEcuadorianEgyptianEnglishEstonianEthiopianEuropeanFijianFilipinoFinnishFrenchFrench American IndianFrench CanadianGermanGerman RussianGhanaianGreekGuamanian / ChamorroGuatemalanGuyaneseHaitianHonduranHopiHungarianIcelanderIndian (Asian)IndonesianInupiatIranianIraqiIrishIroquoisIsraeliItalianJamaicanJapaneseJordanianKenyanKiowaKoreanLaotianLatvianLebaneseLiberianLithuanianLuxembourgerMalaysianMexicanMexican American IndianMongolianMoroccanNative HawaiianNavajoNew ZealanderNicaraguanNigerianNorthern EuropeanNorwegianOkinawanOsagePakistaniPalestinianPanamanianPennsylvania GermanPeruvianPimaPolishPortuguesePotawatomiPuebloPuerto RicanRomanianRussianSalvadoranSamoanScandinavianScotch-IrishScottishSeminoleSerbianSiouxSlavicSlovakSloveneSouth AfricanSouth AmericanSouth American IndianSpaniardSpanishSpanish American IndianSri LankanSubsaharan AfricanSudaneseSwedishSwissSyrianThaiTlingit-HaidaTonganTrinidadian and TobagonianTurkishU.S. Virgin IslanderUkrainianUruguayanVenezuelanVietnameseWelshWest IndianYugoslavianZimbabwean
Immigrant Origin (Total)
AfricaArgentinaAsiaAustraliaAustriaBahamasBangladeshBosnia and HerzegovinaBrazilBulgariaBurma / MyanmarCambodiaCameroonCanadaCaribbeanCentral AmericaChileChinaColombiaCubaDominican RepublicEastern AfricaEastern AsiaEastern EuropeEcuadorEgyptEl SalvadorEnglandEritreaEthiopiaEuropeFranceGermanyGhanaGreeceGuatemalaHondurasHong KongIndiaIndonesiaIranIraqIrelandItalyJamaicaJapanJordanKazakhstanKenyaKoreaKuwaitLaosLatin AmericaLebanonLiberiaMalaysiaMexicoMiddle AfricaMoroccoNepalNetherlandsNicaraguaNigeriaNorthern AfricaNorthern EuropeNorwayOceaniaPakistanPanamaPeruPhilippinesPolandPortugalRussiaSaudi ArabiaScotlandSingaporeSouth AfricaSouth AmericaSouth Central AsiaSouth Eastern AsiaSouthern EuropeSpainSudanSyriaTaiwanThailandTrinidad and TobagoTurkeyUkraineVenezuelaVietnamWestern AfricaWestern AsiaWestern EuropeZaireZimbabwe
Immigrant Origin (Percentage)
AfricaArgentinaAsiaAustraliaAustriaBahamasBangladeshBosnia and HerzegovinaBrazilBulgariaBurma / MyanmarCambodiaCameroonCanadaCaribbeanCentral AmericaChileChinaColombiaCubaDominican RepublicEastern AfricaEastern AsiaEastern EuropeEcuadorEgyptEl SalvadorEnglandEritreaEthiopiaEuropeFranceGermanyGhanaGreeceGuatemalaHondurasHong KongIndiaIndonesiaIranIraqIrelandItalyJamaicaJapanJordanKazakhstanKenyaKoreaKuwaitLaosLatin AmericaLebanonLiberiaMalaysiaMexicoMiddle AfricaMoroccoNepalNetherlandsNicaraguaNigeriaNorthern AfricaNorthern EuropeNorwayOceaniaPakistanPanamaPeruPhilippinesPolandPortugalRussiaSaudi ArabiaScotlandSingaporeSouth AfricaSouth AmericaSouth Central AsiaSouth Eastern AsiaSouthern EuropeSpainSudanSyriaTaiwanThailandTrinidad and TobagoTurkeyUkraineVenezuelaVietnamWestern AfricaWestern AsiaWestern EuropeZaireZimbabwe
Income
Income (Families)
Income (Households)
Poverty
Poverty (Families)
Unemployment
Employment Occupations
Employment Industries
Employer Class
Commute Time
Commute Means
School Enrollment
Education by Degree Field
Occupancy
Finances
Physical Characteristics
Oklahoma City
Compare Zip Codes
Comparison Subject

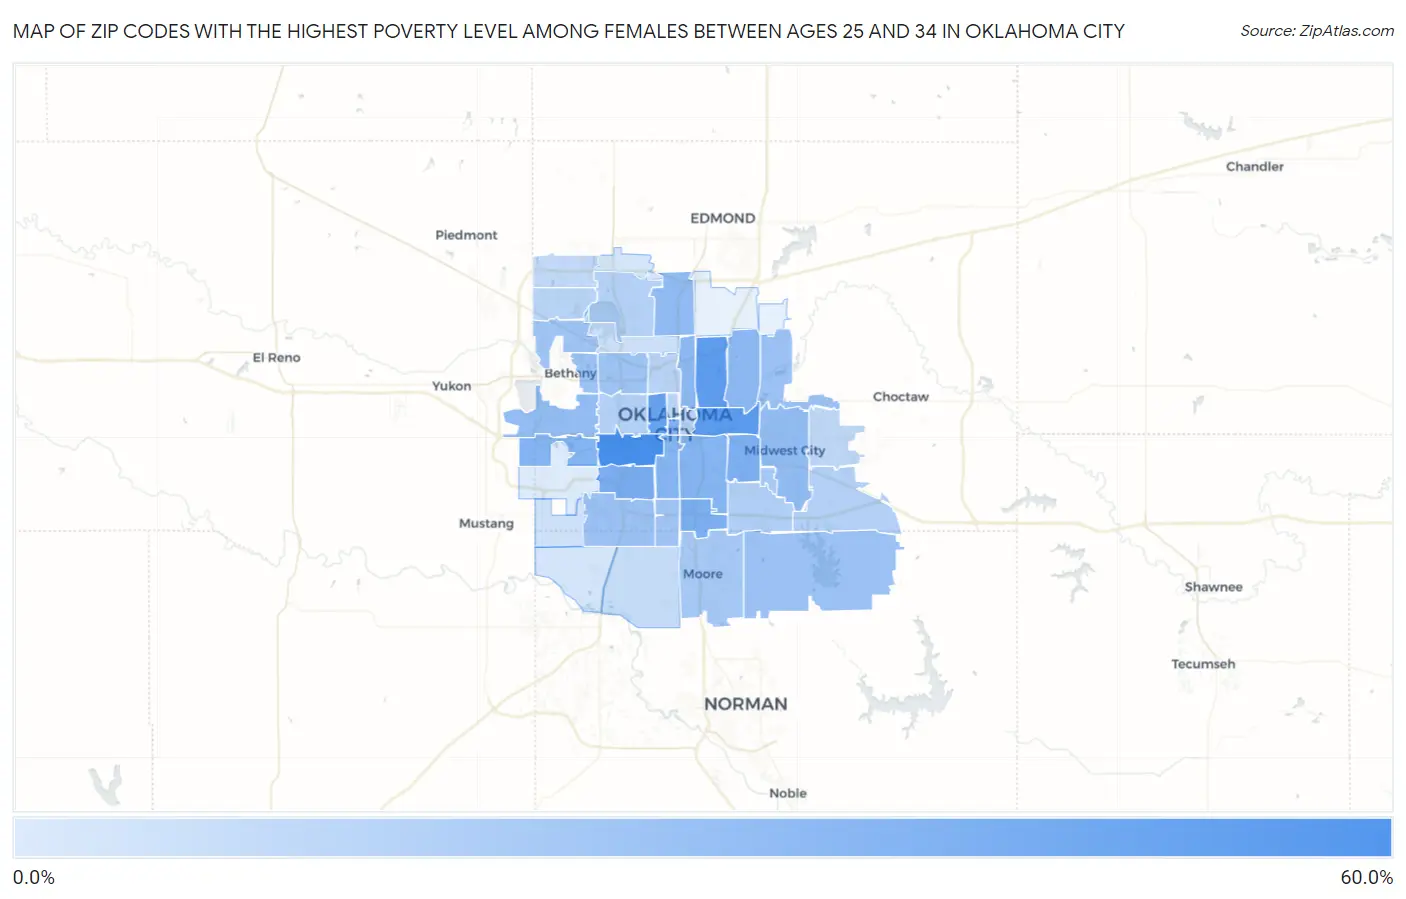
Map of Zip Codes with the Highest Poverty Level Among Females Between Ages 25 and 34 in Oklahoma City

0.0%
60.0%
Zip Codes with the Highest Poverty Level Among Females Between Ages 25 and 34 in Oklahoma City Map

Zip Codes with the Highest Poverty Level Among Females Between Ages 25 and 34 in Oklahoma City, OK

Zip Code Female Poverty vs State vs National
1.7310856.9%18.6%(+38.3)#2014.5%(+42.4)#1,250
2.7311748.9%18.6%(+30.3)#3514.5%(+34.4)#1,755
3.7311146.0%18.6%(+27.4)#4214.5%(+31.5)#1,994
4.7310642.3%18.6%(+23.7)#5314.5%(+27.8)#2,396
5.7311934.8%18.6%(+16.2)#9114.5%(+20.3)#3,585
6.7314933.7%18.6%(+15.1)#9714.5%(+19.2)#3,777
7.7310233.5%18.6%(+14.9)#9914.5%(+19.0)#3,810
8.7311533.2%18.6%(+14.6)#10514.5%(+18.7)#3,962
9.7312830.7%18.6%(+12.1)#12414.5%(+16.2)#4,525
10.7312930.4%18.6%(+11.8)#12714.5%(+15.9)#4,595
11.7310929.9%18.6%(+11.4)#13214.5%(+15.5)#4,722
12.7310527.7%18.6%(+9.13)#17114.5%(+13.2)#5,425
13.7312127.6%18.6%(+8.99)#17314.5%(+13.1)#5,474
14.7311426.4%18.6%(+7.79)#18714.5%(+11.9)#5,896
15.7311025.1%18.6%(+6.48)#20214.5%(+10.6)#6,337
16.7312724.7%18.6%(+6.15)#21114.5%(+10.3)#6,518
17.7314122.1%18.6%(+3.51)#25314.5%(+7.61)#7,677
18.7316521.7%18.6%(+3.07)#25914.5%(+7.17)#7,870
19.7312221.4%18.6%(+2.81)#26314.5%(+6.91)#7,998
20.7315921.3%18.6%(+2.75)#26414.5%(+6.85)#8,016
21.7311220.5%18.6%(+1.92)#27914.5%(+6.02)#8,474
22.7313220.5%18.6%(+1.86)#28014.5%(+5.96)#8,488
23.7313920.2%18.6%(+1.64)#28614.5%(+5.74)#8,618
24.7316018.7%18.6%(+0.150)#31214.5%(+4.25)#9,524
25.7314518.2%18.6%(-0.383)#31514.5%(+3.72)#9,835
26.7313514.4%18.6%(-4.16)#35314.5%(-0.063)#12,383
27.7310413.9%18.6%(-4.70)#36914.5%(-0.599)#12,810
28.7310713.6%18.6%(-4.97)#37514.5%(-0.870)#12,994
29.7312013.6%18.6%(-4.98)#37614.5%(-0.881)#12,998
30.7315013.5%18.6%(-5.10)#37914.5%(-0.997)#13,104
31.7311812.3%18.6%(-6.30)#40014.5%(-2.20)#14,034
32.7310311.5%18.6%(-7.14)#41014.5%(-3.04)#14,711
33.7316211.3%18.6%(-7.28)#41414.5%(-3.18)#14,838
34.7313010.1%18.6%(-8.47)#43114.5%(-4.37)#15,882
35.731429.4%18.6%(-9.17)#44614.5%(-5.07)#16,535
36.731707.7%18.6%(-10.9)#46814.5%(-6.80)#18,129
37.731165.5%18.6%(-13.1)#49014.5%(-8.96)#20,123
38.731695.0%18.6%(-13.6)#50114.5%(-9.53)#20,631
39.731733.2%18.6%(-15.4)#51514.5%(-11.3)#22,066
40.731342.5%18.6%(-16.1)#52314.5%(-12.0)#22,504
41.731790.51%18.6%(-18.1)#52814.5%(-14.0)#23,491

Common Questions

What are the Top 10 Zip Codes with the Highest Poverty Level Among Females Between Ages 25 and 34 in Oklahoma City, OK?
Top 10 Zip Codes with the Highest Poverty Level Among Females Between Ages 25 and 34 in Oklahoma City, OK are:
#1
56.9%
#2
48.9%
#3
46.0%
#4
42.3%
#5
34.8%
#6
33.7%
#7
33.5%
#8
33.2%
#9
30.7%
#10
30.4%
What zip code has the Highest Poverty Level Among Females Between Ages 25 and 34 in Oklahoma City, OK?
73108 has the Highest Poverty Level Among Females Between Ages 25 and 34 in Oklahoma City, OK with 56.9%.
What is the Poverty Level Among Females Between Ages 25 and 34 in Oklahoma City, OK?
Poverty Level Among Females Between Ages 25 and 34 in Oklahoma City is 18.1%.
What is the Poverty Level Among Females Between Ages 25 and 34 in Oklahoma?
Poverty Level Among Females Between Ages 25 and 34 in Oklahoma is 18.6%.
What is the Poverty Level Among Females Between Ages 25 and 34 in the United States?
Poverty Level Among Females Between Ages 25 and 34 in the United States is 14.5%.