Zip Codes with the Highest Male Poverty Level in Oklahoma City, OK

RELATED REPORTS & OPTIONS

Highest Poverty | Male
Population
Families and Households
Female Fertility
Female Fertility (Unmarried)
Race (Community Size)
Race (Percentage)
Ancestry (Community Size)
AfricanAlaska NativeAlbanianAmericanApacheArabArapahoArgentineanArmenianAustralianAustrianBahamianBangladeshiBarbadianBasqueBelgianBhutaneseBlackfeetBolivianBrazilianBritishBritish West IndianBulgarianBurmeseCajunCambodianCanadianCelticCentral AmericanCentral American IndianCherokeeCheyenneChickasawChileanChippewaChoctawColombianComancheCreeCreekCroatianCubanCzechCzechoslovakianDanishDelawareDominicanDutchDutch West IndianEastern EuropeanEcuadorianEgyptianEnglishEstonianEthiopianEuropeanFijianFilipinoFinnishFrenchFrench American IndianFrench CanadianGermanGerman RussianGhanaianGreekGuamanian / ChamorroGuatemalanGuyaneseHaitianHonduranHopiHungarianIcelanderIndian (Asian)IndonesianInupiatIranianIraqiIrishIroquoisIsraeliItalianJamaicanJapaneseJordanianKenyanKiowaKoreanLaotianLatvianLebaneseLiberianLithuanianLuxembourgerMalaysianMexicanMexican American IndianMongolianMoroccanNative HawaiianNavajoNew ZealanderNicaraguanNigerianNorthern EuropeanNorwegianOkinawanOsagePakistaniPalestinianPanamanianPennsylvania GermanPeruvianPimaPolishPortuguesePotawatomiPuebloPuerto RicanRomanianRussianSalvadoranSamoanScandinavianScotch-IrishScottishSeminoleSerbianSiouxSlavicSlovakSloveneSouth AfricanSouth AmericanSouth American IndianSpaniardSpanishSpanish American IndianSri LankanSubsaharan AfricanSudaneseSwedishSwissSyrianThaiTlingit-HaidaTonganTrinidadian and TobagonianTurkishU.S. Virgin IslanderUkrainianUruguayanVenezuelanVietnameseWelshWest IndianYugoslavianZimbabwean
Ancestry (Percentage)
AfricanAlaska NativeAlbanianAmericanApacheArabArapahoArgentineanArmenianAustralianAustrianBahamianBangladeshiBarbadianBasqueBelgianBhutaneseBlackfeetBolivianBrazilianBritishBritish West IndianBulgarianBurmeseCajunCambodianCanadianCelticCentral AmericanCentral American IndianCherokeeCheyenneChickasawChileanChippewaChoctawColombianComancheCreeCreekCroatianCubanCzechCzechoslovakianDanishDelawareDominicanDutchDutch West IndianEastern EuropeanEcuadorianEgyptianEnglishEstonianEthiopianEuropeanFijianFilipinoFinnishFrenchFrench American IndianFrench CanadianGermanGerman RussianGhanaianGreekGuamanian / ChamorroGuatemalanGuyaneseHaitianHonduranHopiHungarianIcelanderIndian (Asian)IndonesianInupiatIranianIraqiIrishIroquoisIsraeliItalianJamaicanJapaneseJordanianKenyanKiowaKoreanLaotianLatvianLebaneseLiberianLithuanianLuxembourgerMalaysianMexicanMexican American IndianMongolianMoroccanNative HawaiianNavajoNew ZealanderNicaraguanNigerianNorthern EuropeanNorwegianOkinawanOsagePakistaniPalestinianPanamanianPennsylvania GermanPeruvianPimaPolishPortuguesePotawatomiPuebloPuerto RicanRomanianRussianSalvadoranSamoanScandinavianScotch-IrishScottishSeminoleSerbianSiouxSlavicSlovakSloveneSouth AfricanSouth AmericanSouth American IndianSpaniardSpanishSpanish American IndianSri LankanSubsaharan AfricanSudaneseSwedishSwissSyrianThaiTlingit-HaidaTonganTrinidadian and TobagonianTurkishU.S. Virgin IslanderUkrainianUruguayanVenezuelanVietnameseWelshWest IndianYugoslavianZimbabwean
Immigrant Origin (Total)
AfricaArgentinaAsiaAustraliaAustriaBahamasBangladeshBosnia and HerzegovinaBrazilBulgariaBurma / MyanmarCambodiaCameroonCanadaCaribbeanCentral AmericaChileChinaColombiaCubaDominican RepublicEastern AfricaEastern AsiaEastern EuropeEcuadorEgyptEl SalvadorEnglandEritreaEthiopiaEuropeFranceGermanyGhanaGreeceGuatemalaHondurasHong KongIndiaIndonesiaIranIraqIrelandItalyJamaicaJapanJordanKazakhstanKenyaKoreaKuwaitLaosLatin AmericaLebanonLiberiaMalaysiaMexicoMiddle AfricaMoroccoNepalNetherlandsNicaraguaNigeriaNorthern AfricaNorthern EuropeNorwayOceaniaPakistanPanamaPeruPhilippinesPolandPortugalRussiaSaudi ArabiaScotlandSingaporeSouth AfricaSouth AmericaSouth Central AsiaSouth Eastern AsiaSouthern EuropeSpainSudanSyriaTaiwanThailandTrinidad and TobagoTurkeyUkraineVenezuelaVietnamWestern AfricaWestern AsiaWestern EuropeZaireZimbabwe
Immigrant Origin (Percentage)
AfricaArgentinaAsiaAustraliaAustriaBahamasBangladeshBosnia and HerzegovinaBrazilBulgariaBurma / MyanmarCambodiaCameroonCanadaCaribbeanCentral AmericaChileChinaColombiaCubaDominican RepublicEastern AfricaEastern AsiaEastern EuropeEcuadorEgyptEl SalvadorEnglandEritreaEthiopiaEuropeFranceGermanyGhanaGreeceGuatemalaHondurasHong KongIndiaIndonesiaIranIraqIrelandItalyJamaicaJapanJordanKazakhstanKenyaKoreaKuwaitLaosLatin AmericaLebanonLiberiaMalaysiaMexicoMiddle AfricaMoroccoNepalNetherlandsNicaraguaNigeriaNorthern AfricaNorthern EuropeNorwayOceaniaPakistanPanamaPeruPhilippinesPolandPortugalRussiaSaudi ArabiaScotlandSingaporeSouth AfricaSouth AmericaSouth Central AsiaSouth Eastern AsiaSouthern EuropeSpainSudanSyriaTaiwanThailandTrinidad and TobagoTurkeyUkraineVenezuelaVietnamWestern AfricaWestern AsiaWestern EuropeZaireZimbabwe
Income
Income (Families)
Income (Households)
Poverty
Poverty (Families)
Unemployment
Employment Occupations
Employment Industries
Employer Class
Commute Time
Commute Means
School Enrollment
Education by Degree Field
Occupancy
Finances
Physical Characteristics
Oklahoma City
Compare Zip Codes
Comparison Subject

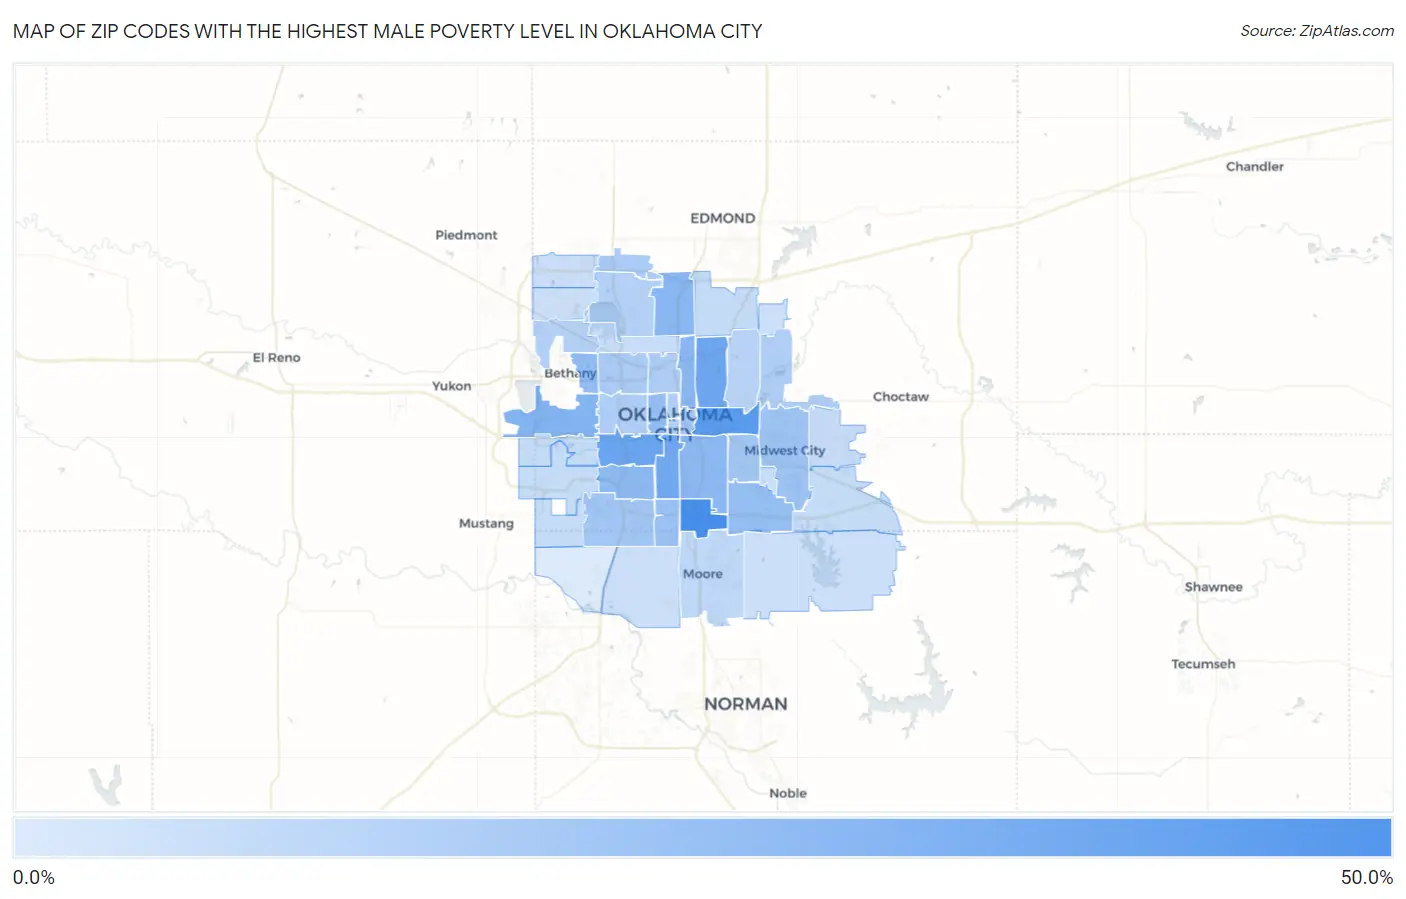
Map of Zip Codes with the Highest Male Poverty Level in Oklahoma City

0.0%
50.0%
Zip Codes with the Highest Male Poverty Level in Oklahoma City Map

Zip Codes with the Highest Male Poverty Level in Oklahoma City, OK

Zip Code Male Poverty vs State vs National
1.7314945.9%13.9%(+31.9)#811.3%(+34.5)#683
2.7311738.7%13.9%(+24.8)#1611.3%(+27.4)#1,067
3.7310833.0%13.9%(+19.1)#2311.3%(+21.7)#1,632
4.7311132.4%13.9%(+18.4)#2511.3%(+21.0)#1,722
5.7310931.0%13.9%(+17.1)#3011.3%(+19.6)#1,920
6.7312725.6%13.9%(+11.7)#6111.3%(+14.3)#3,074
7.7310523.9%13.9%(+9.92)#7711.3%(+12.5)#3,596
8.7311423.5%13.9%(+9.61)#8211.3%(+12.2)#3,692
9.7312922.9%13.9%(+9.00)#9211.3%(+11.6)#3,905
10.7311922.6%13.9%(+8.62)#9411.3%(+11.2)#4,051
11.7312221.2%13.9%(+7.31)#11611.3%(+9.90)#4,628
12.7310620.5%13.9%(+6.59)#12411.3%(+9.19)#4,942
13.7313520.3%13.9%(+6.37)#12911.3%(+8.96)#5,053
14.7313917.9%13.9%(+3.94)#20011.3%(+6.53)#6,519
15.7311017.5%13.9%(+3.58)#20711.3%(+6.17)#6,786
16.7311516.0%13.9%(+2.04)#25511.3%(+4.64)#7,983
17.7310415.9%13.9%(+1.93)#26311.3%(+4.53)#8,079
18.7315915.8%13.9%(+1.90)#26411.3%(+4.49)#8,110
19.7313414.5%13.9%(+0.536)#30811.3%(+3.13)#9,458
20.7311214.0%13.9%(+0.103)#32111.3%(+2.70)#9,900
21.7314113.1%13.9%(-0.870)#36011.3%(+1.72)#11,025
22.7311812.8%13.9%(-1.15)#36811.3%(+1.45)#11,352
23.7310712.4%13.9%(-1.49)#37811.3%(+1.11)#11,793
24.7310212.1%13.9%(-1.79)#39111.3%(+0.808)#12,167
25.7310312.0%13.9%(-1.93)#39511.3%(+0.661)#12,345
26.7312011.7%13.9%(-2.24)#39911.3%(+0.358)#12,732
27.7313211.0%13.9%(-2.93)#42111.3%(-0.340)#13,737
28.7312110.3%13.9%(-3.61)#44311.3%(-1.02)#14,782
29.731608.6%13.9%(-5.38)#48711.3%(-2.78)#17,753
30.731796.8%13.9%(-7.09)#52711.3%(-4.49)#20,799
31.731286.8%13.9%(-7.13)#52911.3%(-4.54)#20,875
32.731696.5%13.9%(-7.42)#53911.3%(-4.82)#21,427
33.731506.5%13.9%(-7.48)#54011.3%(-4.89)#21,539
34.731316.3%13.9%(-7.59)#54411.3%(-5.00)#21,746
35.731166.3%13.9%(-7.65)#54511.3%(-5.06)#21,848
36.731306.0%13.9%(-7.91)#55311.3%(-5.32)#22,324
37.731455.7%13.9%(-8.25)#56311.3%(-5.65)#22,999
38.731425.3%13.9%(-8.68)#57311.3%(-6.09)#23,818
39.731705.1%13.9%(-8.87)#57711.3%(-6.28)#24,173
40.731655.0%13.9%(-8.91)#57811.3%(-6.32)#24,230
41.731514.9%13.9%(-9.02)#58211.3%(-6.42)#24,431
42.731624.7%13.9%(-9.19)#58611.3%(-6.60)#24,781
43.731730.74%13.9%(-13.2)#62711.3%(-10.6)#30,097

Common Questions

What are the Top 10 Zip Codes with the Highest Male Poverty Level in Oklahoma City, OK?
Top 10 Zip Codes with the Highest Male Poverty Level in Oklahoma City, OK are:
#1
45.9%
#2
38.7%
#3
33.0%
#4
32.4%
#5
31.0%
#6
25.6%
#7
23.9%
#8
23.5%
#9
22.9%
#10
22.6%
What zip code has the Highest Male Poverty Level in Oklahoma City, OK?
73149 has the Highest Male Poverty Level in Oklahoma City, OK with 45.9%.
What is the Poverty Level Among Males in Oklahoma City, OK?
Poverty Level Among Males in Oklahoma City is 13.5%.
What is the Poverty Level Among Males in Oklahoma?
Poverty Level Among Males in Oklahoma is 13.9%.
What is the Poverty Level Among Males in the United States?
Poverty Level Among Males in the United States is 11.3%.