Zip Codes with the Highest Poverty Level Among Children Under the Age of 5 in Oklahoma City, OK

RELATED REPORTS & OPTIONS

Highest Poverty | Child 0-5
Population
Families and Households
Female Fertility
Female Fertility (Unmarried)
Race (Community Size)
Race (Percentage)
Ancestry (Community Size)
AfricanAlaska NativeAlbanianAmericanApacheArabArapahoArgentineanArmenianAustralianAustrianBahamianBangladeshiBarbadianBasqueBelgianBhutaneseBlackfeetBolivianBrazilianBritishBritish West IndianBulgarianBurmeseCajunCambodianCanadianCelticCentral AmericanCentral American IndianCherokeeCheyenneChickasawChileanChippewaChoctawColombianComancheCreeCreekCroatianCubanCzechCzechoslovakianDanishDelawareDominicanDutchDutch West IndianEastern EuropeanEcuadorianEgyptianEnglishEstonianEthiopianEuropeanFijianFilipinoFinnishFrenchFrench American IndianFrench CanadianGermanGerman RussianGhanaianGreekGuamanian / ChamorroGuatemalanGuyaneseHaitianHonduranHopiHungarianIcelanderIndian (Asian)IndonesianInupiatIranianIraqiIrishIroquoisIsraeliItalianJamaicanJapaneseJordanianKenyanKiowaKoreanLaotianLatvianLebaneseLiberianLithuanianLuxembourgerMalaysianMexicanMexican American IndianMongolianMoroccanNative HawaiianNavajoNew ZealanderNicaraguanNigerianNorthern EuropeanNorwegianOkinawanOsagePakistaniPalestinianPanamanianPennsylvania GermanPeruvianPimaPolishPortuguesePotawatomiPuebloPuerto RicanRomanianRussianSalvadoranSamoanScandinavianScotch-IrishScottishSeminoleSerbianSiouxSlavicSlovakSloveneSouth AfricanSouth AmericanSouth American IndianSpaniardSpanishSpanish American IndianSri LankanSubsaharan AfricanSudaneseSwedishSwissSyrianThaiTlingit-HaidaTonganTrinidadian and TobagonianTurkishU.S. Virgin IslanderUkrainianUruguayanVenezuelanVietnameseWelshWest IndianYugoslavianZimbabwean
Ancestry (Percentage)
AfricanAlaska NativeAlbanianAmericanApacheArabArapahoArgentineanArmenianAustralianAustrianBahamianBangladeshiBarbadianBasqueBelgianBhutaneseBlackfeetBolivianBrazilianBritishBritish West IndianBulgarianBurmeseCajunCambodianCanadianCelticCentral AmericanCentral American IndianCherokeeCheyenneChickasawChileanChippewaChoctawColombianComancheCreeCreekCroatianCubanCzechCzechoslovakianDanishDelawareDominicanDutchDutch West IndianEastern EuropeanEcuadorianEgyptianEnglishEstonianEthiopianEuropeanFijianFilipinoFinnishFrenchFrench American IndianFrench CanadianGermanGerman RussianGhanaianGreekGuamanian / ChamorroGuatemalanGuyaneseHaitianHonduranHopiHungarianIcelanderIndian (Asian)IndonesianInupiatIranianIraqiIrishIroquoisIsraeliItalianJamaicanJapaneseJordanianKenyanKiowaKoreanLaotianLatvianLebaneseLiberianLithuanianLuxembourgerMalaysianMexicanMexican American IndianMongolianMoroccanNative HawaiianNavajoNew ZealanderNicaraguanNigerianNorthern EuropeanNorwegianOkinawanOsagePakistaniPalestinianPanamanianPennsylvania GermanPeruvianPimaPolishPortuguesePotawatomiPuebloPuerto RicanRomanianRussianSalvadoranSamoanScandinavianScotch-IrishScottishSeminoleSerbianSiouxSlavicSlovakSloveneSouth AfricanSouth AmericanSouth American IndianSpaniardSpanishSpanish American IndianSri LankanSubsaharan AfricanSudaneseSwedishSwissSyrianThaiTlingit-HaidaTonganTrinidadian and TobagonianTurkishU.S. Virgin IslanderUkrainianUruguayanVenezuelanVietnameseWelshWest IndianYugoslavianZimbabwean
Immigrant Origin (Total)
AfricaArgentinaAsiaAustraliaAustriaBahamasBangladeshBosnia and HerzegovinaBrazilBulgariaBurma / MyanmarCambodiaCameroonCanadaCaribbeanCentral AmericaChileChinaColombiaCubaDominican RepublicEastern AfricaEastern AsiaEastern EuropeEcuadorEgyptEl SalvadorEnglandEritreaEthiopiaEuropeFranceGermanyGhanaGreeceGuatemalaHondurasHong KongIndiaIndonesiaIranIraqIrelandItalyJamaicaJapanJordanKazakhstanKenyaKoreaKuwaitLaosLatin AmericaLebanonLiberiaMalaysiaMexicoMiddle AfricaMoroccoNepalNetherlandsNicaraguaNigeriaNorthern AfricaNorthern EuropeNorwayOceaniaPakistanPanamaPeruPhilippinesPolandPortugalRussiaSaudi ArabiaScotlandSingaporeSouth AfricaSouth AmericaSouth Central AsiaSouth Eastern AsiaSouthern EuropeSpainSudanSyriaTaiwanThailandTrinidad and TobagoTurkeyUkraineVenezuelaVietnamWestern AfricaWestern AsiaWestern EuropeZaireZimbabwe
Immigrant Origin (Percentage)
AfricaArgentinaAsiaAustraliaAustriaBahamasBangladeshBosnia and HerzegovinaBrazilBulgariaBurma / MyanmarCambodiaCameroonCanadaCaribbeanCentral AmericaChileChinaColombiaCubaDominican RepublicEastern AfricaEastern AsiaEastern EuropeEcuadorEgyptEl SalvadorEnglandEritreaEthiopiaEuropeFranceGermanyGhanaGreeceGuatemalaHondurasHong KongIndiaIndonesiaIranIraqIrelandItalyJamaicaJapanJordanKazakhstanKenyaKoreaKuwaitLaosLatin AmericaLebanonLiberiaMalaysiaMexicoMiddle AfricaMoroccoNepalNetherlandsNicaraguaNigeriaNorthern AfricaNorthern EuropeNorwayOceaniaPakistanPanamaPeruPhilippinesPolandPortugalRussiaSaudi ArabiaScotlandSingaporeSouth AfricaSouth AmericaSouth Central AsiaSouth Eastern AsiaSouthern EuropeSpainSudanSyriaTaiwanThailandTrinidad and TobagoTurkeyUkraineVenezuelaVietnamWestern AfricaWestern AsiaWestern EuropeZaireZimbabwe
Income
Income (Families)
Income (Households)
Poverty
Poverty (Families)
Unemployment
Employment Occupations
Employment Industries
Employer Class
Commute Time
Commute Means
School Enrollment
Education by Degree Field
Occupancy
Finances
Physical Characteristics
Oklahoma City
Compare Zip Codes
Comparison Subject

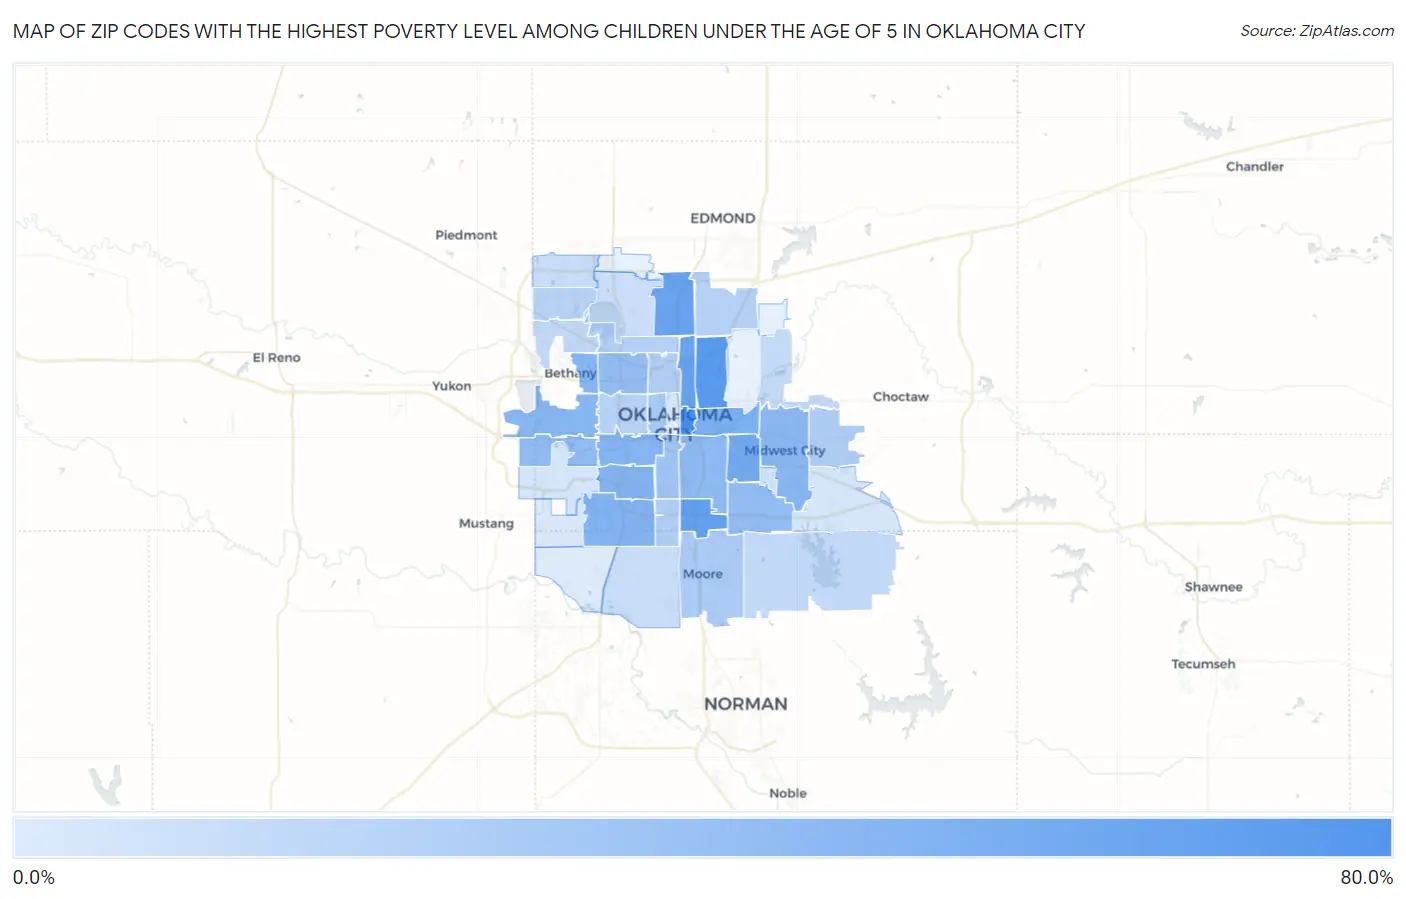
Map of Zip Codes with the Highest Poverty Level Among Children Under the Age of 5 in Oklahoma City

0.0%
80.0%
Zip Codes with the Highest Poverty Level Among Children Under the Age of 5 in Oklahoma City Map

Zip Codes with the Highest Poverty Level Among Children Under the Age of 5 in Oklahoma City, OK

Zip Code Child Poverty vs State vs National
1.7310473.7%23.3%(+50.3)#2218.1%(+55.6)#1,019
2.7311163.6%23.3%(+40.2)#3118.1%(+45.5)#1,475
3.7314958.1%23.3%(+34.7)#4218.1%(+40.0)#1,818
4.7311454.8%23.3%(+31.5)#5218.1%(+36.8)#2,080
5.7310554.6%23.3%(+31.2)#5318.1%(+36.5)#2,096
6.7311548.9%23.3%(+25.6)#7218.1%(+30.8)#2,705
7.7311744.1%23.3%(+20.7)#9818.1%(+26.0)#3,326
8.7311940.8%23.3%(+17.4)#11218.1%(+22.7)#3,877
9.7315940.0%23.3%(+16.6)#11918.1%(+21.9)#4,042
10.7310839.6%23.3%(+16.3)#12218.1%(+21.6)#4,095
11.7312738.1%23.3%(+14.8)#13218.1%(+20.1)#4,381
12.7312237.6%23.3%(+14.3)#13618.1%(+19.6)#4,470
13.7311037.5%23.3%(+14.2)#13818.1%(+19.5)#4,484
14.7312934.3%23.3%(+10.9)#16018.1%(+16.2)#5,225
15.7312833.9%23.3%(+10.6)#16418.1%(+15.9)#5,313
16.7313533.1%23.3%(+9.74)#17718.1%(+15.0)#5,571
17.7311232.9%23.3%(+9.60)#18018.1%(+14.9)#5,601
18.7310926.7%23.3%(+3.38)#23918.1%(+8.66)#7,391
19.7310623.7%23.3%(+0.359)#27418.1%(+5.64)#8,488
20.7316022.1%23.3%(-1.23)#29418.1%(+4.05)#9,141
21.7313020.3%23.3%(-3.03)#31118.1%(+2.25)#9,884
22.7311819.5%23.3%(-3.85)#33018.1%(+1.43)#10,268
23.7313919.2%23.3%(-4.18)#33518.1%(+1.10)#10,431
24.7311618.7%23.3%(-4.60)#33918.1%(+0.679)#10,622
25.7313118.4%23.3%(-4.95)#34018.1%(+0.337)#10,767
26.7310716.6%23.3%(-6.72)#35418.1%(-1.44)#11,588
27.7316216.4%23.3%(-6.93)#35618.1%(-1.65)#11,687
28.7316513.0%23.3%(-10.4)#40118.1%(-5.09)#13,646
29.7313212.2%23.3%(-11.1)#40818.1%(-5.87)#14,097
30.7314111.4%23.3%(-12.0)#41218.1%(-6.67)#14,586
31.7314210.0%23.3%(-13.3)#42618.1%(-8.05)#15,386
32.731709.9%23.3%(-13.4)#42918.1%(-8.13)#15,466
33.731208.6%23.3%(-14.7)#45018.1%(-9.46)#16,336
34.731456.6%23.3%(-16.8)#47418.1%(-11.5)#17,686
35.731795.5%23.3%(-17.8)#48418.1%(-12.5)#18,421
36.731034.3%23.3%(-19.1)#49518.1%(-13.8)#19,288
37.731504.3%23.3%(-19.1)#49618.1%(-13.8)#19,290
38.731694.2%23.3%(-19.2)#49718.1%(-13.9)#19,361
39.731732.1%23.3%(-21.3)#51018.1%(-16.0)#20,778

Common Questions

What are the Top 10 Zip Codes with the Highest Poverty Level Among Children Under the Age of 5 in Oklahoma City, OK?
Top 10 Zip Codes with the Highest Poverty Level Among Children Under the Age of 5 in Oklahoma City, OK are:
#1
73.7%
#2
63.6%
#3
58.1%
#4
54.8%
#5
54.6%
#6
48.9%
#7
44.1%
#8
40.8%
#9
40.0%
#10
39.6%
What zip code has the Highest Poverty Level Among Children Under the Age of 5 in Oklahoma City, OK?
73104 has the Highest Poverty Level Among Children Under the Age of 5 in Oklahoma City, OK with 73.7%.
What is the Poverty Level Among Children Under the Age of 5 in Oklahoma City, OK?
Poverty Level Among Children Under the Age of 5 in Oklahoma City is 22.5%.
What is the Poverty Level Among Children Under the Age of 5 in Oklahoma?
Poverty Level Among Children Under the Age of 5 in Oklahoma is 23.3%.
What is the Poverty Level Among Children Under the Age of 5 in the United States?
Poverty Level Among Children Under the Age of 5 in the United States is 18.1%.