Zip Codes with the Highest Percentage of Households With Two or more Vehicles in Oklahoma City, OK
RELATED REPORTS & OPTIONS
Households with 2 or more Cars
Oklahoma City
Compare Zip Codes
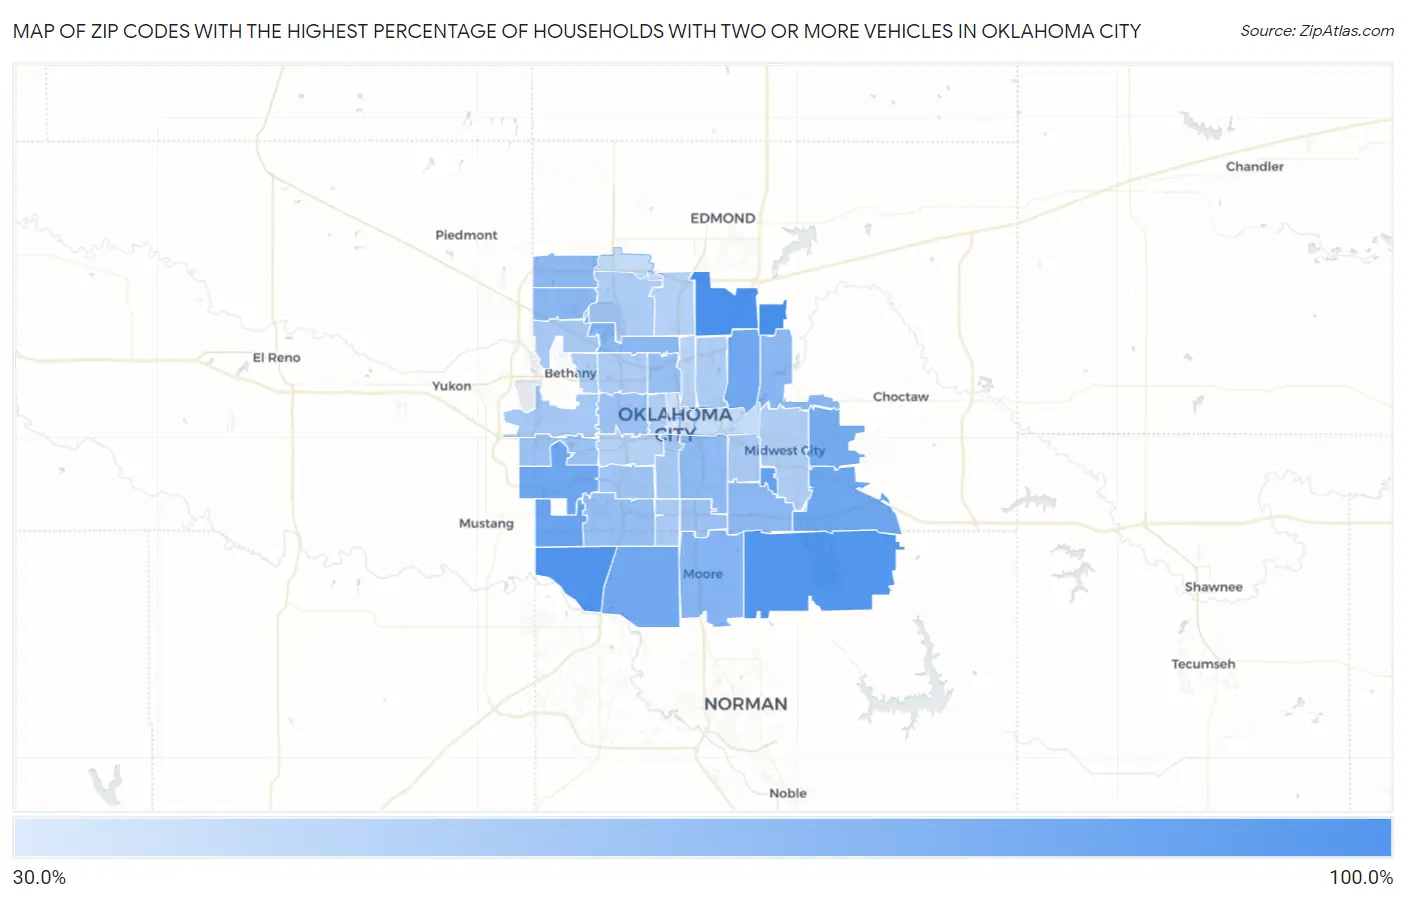
Map of Zip Codes with the Highest Percentage of Households With Two or more Vehicles in Oklahoma City
31.0%
92.6%
Zip Codes with the Highest Percentage of Households With Two or more Vehicles in Oklahoma City, OK
| Zip Code | Housholds With 2+ Cars | vs State | vs National | |
| 1. | 73151 | 92.6% | 62.3%(+30.3)#14 | 59.1%(+33.5)#1,202 |
| 2. | 73131 | 91.0% | 62.3%(+28.7)#16 | 59.1%(+31.9)#1,394 |
| 3. | 73173 | 88.3% | 62.3%(+26.0)#29 | 59.1%(+29.2)#1,947 |
| 4. | 73165 | 86.6% | 62.3%(+24.3)#36 | 59.1%(+27.5)#2,362 |
| 5. | 73145 | 78.0% | 62.3%(+15.7)#108 | 59.1%(+18.9)#6,571 |
| 6. | 73169 | 77.3% | 62.3%(+15.0)#124 | 59.1%(+18.2)#7,077 |
| 7. | 73179 | 74.4% | 62.3%(+12.1)#177 | 59.1%(+15.3)#9,498 |
| 8. | 73150 | 74.4% | 62.3%(+12.1)#178 | 59.1%(+15.3)#9,501 |
| 9. | 73170 | 72.9% | 62.3%(+10.6)#207 | 59.1%(+13.8)#10,844 |
| 10. | 73121 | 72.6% | 62.3%(+10.3)#217 | 59.1%(+13.5)#11,157 |
| 11. | 73130 | 71.3% | 62.3%(+9.00)#249 | 59.1%(+12.2)#12,379 |
| 12. | 73160 | 64.4% | 62.3%(+2.10)#389 | 59.1%(+5.30)#18,963 |
| 13. | 73162 | 62.6% | 62.3%(+0.300)#430 | 59.1%(+3.50)#20,580 |
| 14. | 73116 | 62.2% | 62.3%(-0.100)#440 | 59.1%(+3.10)#20,950 |
| 15. | 73141 | 61.7% | 62.3%(-0.600)#449 | 59.1%(+2.60)#21,369 |
| 16. | 73135 | 61.0% | 62.3%(-1.30)#464 | 59.1%(+1.90)#21,888 |
| 17. | 73142 | 60.9% | 62.3%(-1.40)#467 | 59.1%(+1.80)#21,966 |
| 18. | 73129 | 60.1% | 62.3%(-2.20)#489 | 59.1%(+1.00)#22,596 |
| 19. | 73159 | 57.1% | 62.3%(-5.20)#542 | 59.1%(-2.00)#24,702 |
| 20. | 73118 | 56.6% | 62.3%(-5.70)#550 | 59.1%(-2.50)#25,013 |
| 21. | 73107 | 55.6% | 62.3%(-6.70)#558 | 59.1%(-3.50)#25,564 |
| 22. | 73149 | 55.2% | 62.3%(-7.10)#564 | 59.1%(-3.90)#25,789 |
| 23. | 73128 | 54.7% | 62.3%(-7.60)#569 | 59.1%(-4.40)#26,041 |
| 24. | 73119 | 53.1% | 62.3%(-9.20)#586 | 59.1%(-6.00)#26,771 |
| 25. | 73109 | 51.0% | 62.3%(-11.3)#600 | 59.1%(-8.10)#27,675 |
| 26. | 73127 | 50.6% | 62.3%(-11.7)#602 | 59.1%(-8.50)#27,825 |
| 27. | 73132 | 50.0% | 62.3%(-12.3)#605 | 59.1%(-9.10)#28,030 |
| 28. | 73115 | 49.2% | 62.3%(-13.1)#609 | 59.1%(-9.90)#28,313 |
| 29. | 73139 | 49.0% | 62.3%(-13.3)#613 | 59.1%(-10.1)#28,384 |
| 30. | 73120 | 48.0% | 62.3%(-14.3)#616 | 59.1%(-11.1)#28,726 |
| 31. | 73112 | 48.0% | 62.3%(-14.3)#617 | 59.1%(-11.1)#28,728 |
| 32. | 73111 | 48.0% | 62.3%(-14.3)#618 | 59.1%(-11.1)#28,737 |
| 33. | 73122 | 47.7% | 62.3%(-14.6)#619 | 59.1%(-11.4)#28,817 |
| 34. | 73110 | 46.7% | 62.3%(-15.6)#624 | 59.1%(-12.4)#29,102 |
| 35. | 73106 | 46.3% | 62.3%(-16.0)#625 | 59.1%(-12.8)#29,213 |
| 36. | 73114 | 45.0% | 62.3%(-17.3)#628 | 59.1%(-14.1)#29,524 |
| 37. | 73108 | 44.9% | 62.3%(-17.4)#629 | 59.1%(-14.2)#29,548 |
| 38. | 73105 | 44.4% | 62.3%(-17.9)#630 | 59.1%(-14.7)#29,665 |
| 39. | 73134 | 39.0% | 62.3%(-23.3)#637 | 59.1%(-20.1)#30,564 |
| 40. | 73117 | 38.9% | 62.3%(-23.4)#638 | 59.1%(-20.2)#30,580 |
| 41. | 73103 | 36.0% | 62.3%(-26.3)#642 | 59.1%(-23.1)#30,950 |
| 42. | 73104 | 35.8% | 62.3%(-26.5)#644 | 59.1%(-23.3)#30,972 |
| 43. | 73102 | 31.0% | 62.3%(-31.3)#649 | 59.1%(-28.1)#31,406 |
1
Common Questions
What are the Top 10 Zip Codes with the Highest Percentage of Households With Two or more Vehicles in Oklahoma City, OK?
Top 10 Zip Codes with the Highest Percentage of Households With Two or more Vehicles in Oklahoma City, OK are:
What zip code has the Highest Percentage of Households With Two or more Vehicles in Oklahoma City, OK?
73151 has the Highest Percentage of Households With Two or more Vehicles in Oklahoma City, OK with 92.6%.
What is the Percentage of Households With Two or more Vehicles in Oklahoma City, OK?
Percentage of Households With Two or more Vehicles in Oklahoma City is 58.5%.
What is the Percentage of Households With Two or more Vehicles in Oklahoma?
Percentage of Households With Two or more Vehicles in Oklahoma is 62.3%.
What is the Percentage of Households With Two or more Vehicles in the United States?
Percentage of Households With Two or more Vehicles in the United States is 59.1%.