Zip Codes with the Highest Percentage of Population with a Degree in Psychology in Oklahoma City, OK

RELATED REPORTS & OPTIONS

Psychology
Population
Families and Households
Female Fertility
Female Fertility (Unmarried)
Race (Community Size)
Race (Percentage)
Ancestry (Community Size)
AfricanAlaska NativeAlbanianAmericanApacheArabArapahoArgentineanArmenianAustralianAustrianBahamianBangladeshiBarbadianBasqueBelgianBhutaneseBlackfeetBolivianBrazilianBritishBritish West IndianBulgarianBurmeseCajunCambodianCanadianCelticCentral AmericanCentral American IndianCherokeeCheyenneChickasawChileanChippewaChoctawColombianComancheCreeCreekCroatianCubanCzechCzechoslovakianDanishDelawareDominicanDutchDutch West IndianEastern EuropeanEcuadorianEgyptianEnglishEstonianEthiopianEuropeanFijianFilipinoFinnishFrenchFrench American IndianFrench CanadianGermanGerman RussianGhanaianGreekGuamanian / ChamorroGuatemalanGuyaneseHaitianHonduranHopiHungarianIcelanderIndian (Asian)IndonesianInupiatIranianIraqiIrishIroquoisIsraeliItalianJamaicanJapaneseJordanianKenyanKiowaKoreanLaotianLatvianLebaneseLiberianLithuanianLuxembourgerMalaysianMexicanMexican American IndianMongolianMoroccanNative HawaiianNavajoNew ZealanderNicaraguanNigerianNorthern EuropeanNorwegianOkinawanOsagePakistaniPalestinianPanamanianPennsylvania GermanPeruvianPimaPolishPortuguesePotawatomiPuebloPuerto RicanRomanianRussianSalvadoranSamoanScandinavianScotch-IrishScottishSeminoleSerbianSiouxSlavicSlovakSloveneSouth AfricanSouth AmericanSouth American IndianSpaniardSpanishSpanish American IndianSri LankanSubsaharan AfricanSudaneseSwedishSwissSyrianThaiTlingit-HaidaTonganTrinidadian and TobagonianTurkishU.S. Virgin IslanderUkrainianUruguayanVenezuelanVietnameseWelshWest IndianYugoslavianZimbabwean
Ancestry (Percentage)
AfricanAlaska NativeAlbanianAmericanApacheArabArapahoArgentineanArmenianAustralianAustrianBahamianBangladeshiBarbadianBasqueBelgianBhutaneseBlackfeetBolivianBrazilianBritishBritish West IndianBulgarianBurmeseCajunCambodianCanadianCelticCentral AmericanCentral American IndianCherokeeCheyenneChickasawChileanChippewaChoctawColombianComancheCreeCreekCroatianCubanCzechCzechoslovakianDanishDelawareDominicanDutchDutch West IndianEastern EuropeanEcuadorianEgyptianEnglishEstonianEthiopianEuropeanFijianFilipinoFinnishFrenchFrench American IndianFrench CanadianGermanGerman RussianGhanaianGreekGuamanian / ChamorroGuatemalanGuyaneseHaitianHonduranHopiHungarianIcelanderIndian (Asian)IndonesianInupiatIranianIraqiIrishIroquoisIsraeliItalianJamaicanJapaneseJordanianKenyanKiowaKoreanLaotianLatvianLebaneseLiberianLithuanianLuxembourgerMalaysianMexicanMexican American IndianMongolianMoroccanNative HawaiianNavajoNew ZealanderNicaraguanNigerianNorthern EuropeanNorwegianOkinawanOsagePakistaniPalestinianPanamanianPennsylvania GermanPeruvianPimaPolishPortuguesePotawatomiPuebloPuerto RicanRomanianRussianSalvadoranSamoanScandinavianScotch-IrishScottishSeminoleSerbianSiouxSlavicSlovakSloveneSouth AfricanSouth AmericanSouth American IndianSpaniardSpanishSpanish American IndianSri LankanSubsaharan AfricanSudaneseSwedishSwissSyrianThaiTlingit-HaidaTonganTrinidadian and TobagonianTurkishU.S. Virgin IslanderUkrainianUruguayanVenezuelanVietnameseWelshWest IndianYugoslavianZimbabwean
Immigrant Origin (Total)
AfricaArgentinaAsiaAustraliaAustriaBahamasBangladeshBosnia and HerzegovinaBrazilBulgariaBurma / MyanmarCambodiaCameroonCanadaCaribbeanCentral AmericaChileChinaColombiaCubaDominican RepublicEastern AfricaEastern AsiaEastern EuropeEcuadorEgyptEl SalvadorEnglandEritreaEthiopiaEuropeFranceGermanyGhanaGreeceGuatemalaHondurasHong KongIndiaIndonesiaIranIraqIrelandItalyJamaicaJapanJordanKazakhstanKenyaKoreaKuwaitLaosLatin AmericaLebanonLiberiaMalaysiaMexicoMiddle AfricaMoroccoNepalNetherlandsNicaraguaNigeriaNorthern AfricaNorthern EuropeNorwayOceaniaPakistanPanamaPeruPhilippinesPolandPortugalRussiaSaudi ArabiaScotlandSingaporeSouth AfricaSouth AmericaSouth Central AsiaSouth Eastern AsiaSouthern EuropeSpainSudanSyriaTaiwanThailandTrinidad and TobagoTurkeyUkraineVenezuelaVietnamWestern AfricaWestern AsiaWestern EuropeZaireZimbabwe
Immigrant Origin (Percentage)
AfricaArgentinaAsiaAustraliaAustriaBahamasBangladeshBosnia and HerzegovinaBrazilBulgariaBurma / MyanmarCambodiaCameroonCanadaCaribbeanCentral AmericaChileChinaColombiaCubaDominican RepublicEastern AfricaEastern AsiaEastern EuropeEcuadorEgyptEl SalvadorEnglandEritreaEthiopiaEuropeFranceGermanyGhanaGreeceGuatemalaHondurasHong KongIndiaIndonesiaIranIraqIrelandItalyJamaicaJapanJordanKazakhstanKenyaKoreaKuwaitLaosLatin AmericaLebanonLiberiaMalaysiaMexicoMiddle AfricaMoroccoNepalNetherlandsNicaraguaNigeriaNorthern AfricaNorthern EuropeNorwayOceaniaPakistanPanamaPeruPhilippinesPolandPortugalRussiaSaudi ArabiaScotlandSingaporeSouth AfricaSouth AmericaSouth Central AsiaSouth Eastern AsiaSouthern EuropeSpainSudanSyriaTaiwanThailandTrinidad and TobagoTurkeyUkraineVenezuelaVietnamWestern AfricaWestern AsiaWestern EuropeZaireZimbabwe
Income
Income (Families)
Income (Households)
Poverty
Poverty (Families)
Unemployment
Employment Occupations
Employment Industries
Employer Class
Commute Time
Commute Means
School Enrollment
Education by Degree Field
Occupancy
Finances
Physical Characteristics
Oklahoma City
Compare Zip Codes
Comparison Subject

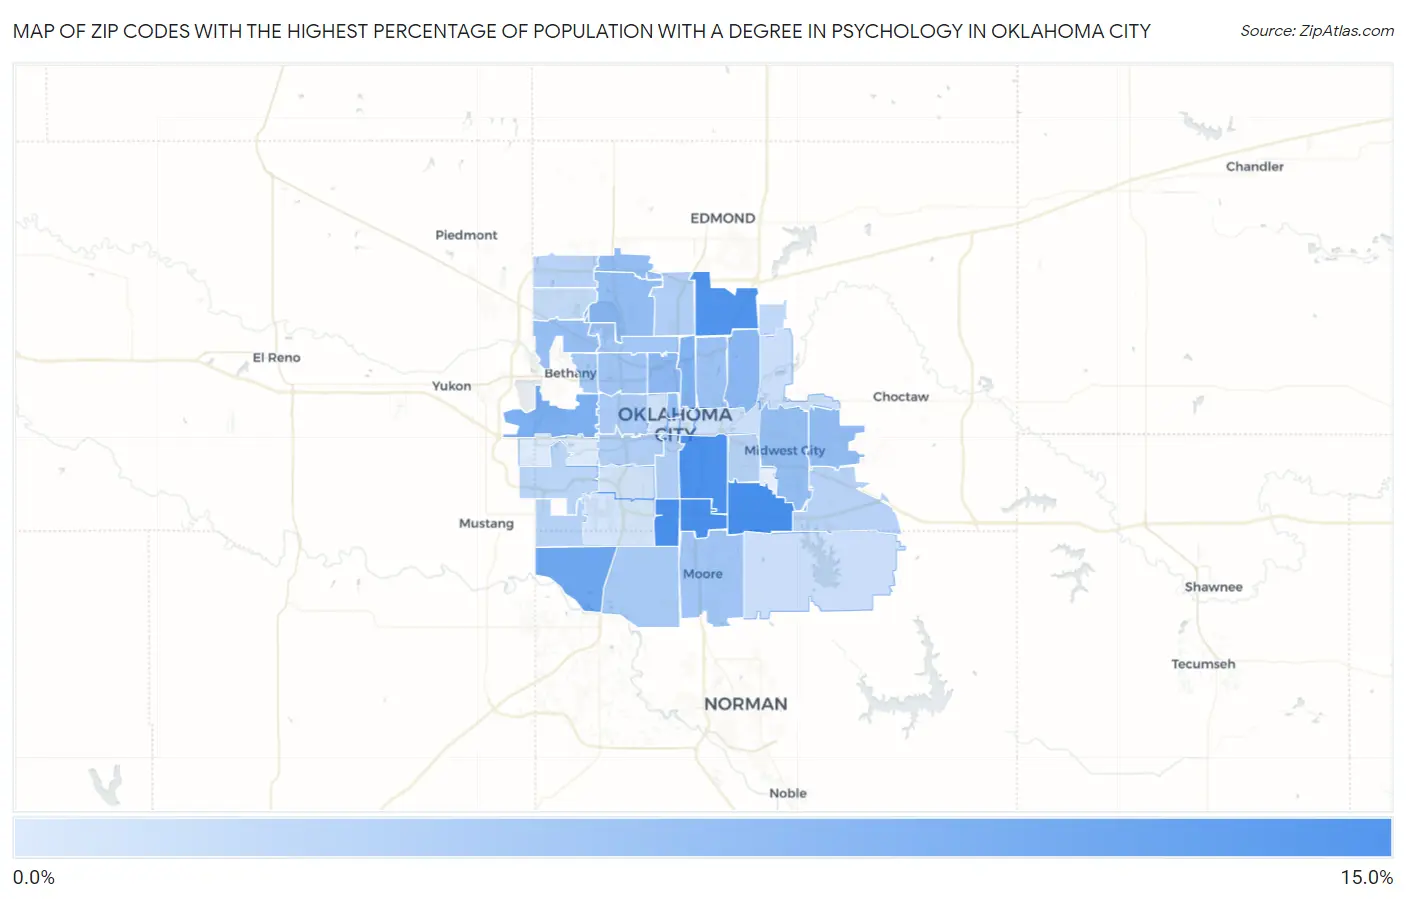
Map of Zip Codes with the Highest Percentage of Population with a Degree in Psychology in Oklahoma City

0.0%
15.0%
Zip Codes with the Highest Percentage of Population with a Degree in Psychology in Oklahoma City Map

Zip Codes with the Highest Percentage of Population with a Degree in Psychology in Oklahoma City, OK

Zip Code % Graduates vs State vs National
1.7313511.0%4.5%(+6.50)#525.1%(+5.93)#2,068
2.7313910.8%4.5%(+6.35)#555.1%(+5.77)#2,127
3.7314910.8%4.5%(+6.32)#565.1%(+5.74)#2,141
4.7312910.6%4.5%(+6.15)#595.1%(+5.57)#2,205
5.7313110.5%4.5%(+6.02)#625.1%(+5.44)#2,260
6.731738.2%4.5%(+3.71)#925.1%(+3.13)#3,922
7.731277.2%4.5%(+2.71)#1155.1%(+2.13)#5,305
8.731057.0%4.5%(+2.52)#1225.1%(+1.94)#5,641
9.731216.3%4.5%(+1.85)#1435.1%(+1.27)#7,085
10.731186.1%4.5%(+1.64)#1515.1%(+1.07)#7,617
11.731345.7%4.5%(+1.27)#1665.1%(+0.687)#8,771
12.731205.7%4.5%(+1.19)#1685.1%(+0.607)#9,006
13.731305.6%4.5%(+1.14)#1715.1%(+0.561)#9,145
14.731105.4%4.5%(+0.973)#1825.1%(+0.394)#9,700
15.731035.3%4.5%(+0.870)#1895.1%(+0.291)#10,025
16.731325.3%4.5%(+0.824)#1905.1%(+0.245)#10,160
17.731115.1%4.5%(+0.595)#2045.1%(+0.016)#11,014
18.731604.7%4.5%(+0.235)#2265.1%(-0.345)#12,288
19.731124.7%4.5%(+0.221)#2295.1%(-0.358)#12,348
20.731164.5%4.5%(+0.051)#2465.1%(-0.528)#13,021
21.731704.2%4.5%(-0.234)#2605.1%(-0.813)#14,089
22.731224.2%4.5%(-0.264)#2615.1%(-0.843)#14,190
23.731074.1%4.5%(-0.383)#2705.1%(-0.963)#14,615
24.731093.8%4.5%(-0.642)#2905.1%(-1.22)#15,516
25.731083.7%4.5%(-0.813)#3025.1%(-1.39)#16,109
26.731143.6%4.5%(-0.878)#3075.1%(-1.46)#16,356
27.731153.4%4.5%(-1.06)#3205.1%(-1.64)#16,967
28.731693.4%4.5%(-1.07)#3215.1%(-1.65)#17,010
29.731423.2%4.5%(-1.23)#3305.1%(-1.80)#17,468
30.731503.2%4.5%(-1.24)#3315.1%(-1.81)#17,498
31.731793.0%4.5%(-1.42)#3405.1%(-2.00)#18,088
32.731512.7%4.5%(-1.76)#3575.1%(-2.34)#19,044
33.731622.4%4.5%(-2.11)#3775.1%(-2.69)#19,970
34.731412.0%4.5%(-2.44)#3885.1%(-3.02)#20,739
35.731652.0%4.5%(-2.45)#3915.1%(-3.02)#20,752
36.731171.8%4.5%(-2.66)#4065.1%(-3.24)#21,209
37.731061.7%4.5%(-2.76)#4115.1%(-3.34)#21,406
38.731191.6%4.5%(-2.91)#4185.1%(-3.49)#21,678
39.731591.4%4.5%(-3.12)#4305.1%(-3.70)#22,056
40.731041.3%4.5%(-3.20)#4335.1%(-3.78)#22,195
41.731021.2%4.5%(-3.24)#4345.1%(-3.82)#22,263
42.731280.77%4.5%(-3.70)#4505.1%(-4.28)#22,973

Common Questions

What are the Top 10 Zip Codes with the Highest Percentage of Population with a Degree in Psychology in Oklahoma City, OK?
Top 10 Zip Codes with the Highest Percentage of Population with a Degree in Psychology in Oklahoma City, OK are:
#1
11.0%
#2
10.8%
#3
10.8%
#4
10.6%
#5
10.5%
#6
8.2%
#7
7.2%
#8
7.0%
#9
6.3%
#10
6.1%
What zip code has the Highest Percentage of Population with a Degree in Psychology in Oklahoma City, OK?
73135 has the Highest Percentage of Population with a Degree in Psychology in Oklahoma City, OK with 11.0%.
What is the Percentage of Population with a Degree in Psychology in Oklahoma City, OK?
Percentage of Population with a Degree in Psychology in Oklahoma City is 4.4%.
What is the Percentage of Population with a Degree in Psychology in Oklahoma?
Percentage of Population with a Degree in Psychology in Oklahoma is 4.5%.
What is the Percentage of Population with a Degree in Psychology in the United States?
Percentage of Population with a Degree in Psychology in the United States is 5.1%.