Zip Codes with the Highest Percentage of Population Employed in Installation, Maintenance & Repair in Oklahoma City, OK

RELATED REPORTS & OPTIONS

Installation, Maintenance & Repair
Population
Families and Households
Female Fertility
Female Fertility (Unmarried)
Race (Community Size)
Race (Percentage)
Ancestry (Community Size)
AfricanAlaska NativeAlbanianAmericanApacheArabArapahoArgentineanArmenianAustralianAustrianBahamianBangladeshiBarbadianBasqueBelgianBhutaneseBlackfeetBolivianBrazilianBritishBritish West IndianBulgarianBurmeseCajunCambodianCanadianCelticCentral AmericanCentral American IndianCherokeeCheyenneChickasawChileanChippewaChoctawColombianComancheCreeCreekCroatianCubanCzechCzechoslovakianDanishDelawareDominicanDutchDutch West IndianEastern EuropeanEcuadorianEgyptianEnglishEstonianEthiopianEuropeanFijianFilipinoFinnishFrenchFrench American IndianFrench CanadianGermanGerman RussianGhanaianGreekGuamanian / ChamorroGuatemalanGuyaneseHaitianHonduranHopiHungarianIcelanderIndian (Asian)IndonesianInupiatIranianIraqiIrishIroquoisIsraeliItalianJamaicanJapaneseJordanianKenyanKiowaKoreanLaotianLatvianLebaneseLiberianLithuanianLuxembourgerMalaysianMexicanMexican American IndianMongolianMoroccanNative HawaiianNavajoNew ZealanderNicaraguanNigerianNorthern EuropeanNorwegianOkinawanOsagePakistaniPalestinianPanamanianPennsylvania GermanPeruvianPimaPolishPortuguesePotawatomiPuebloPuerto RicanRomanianRussianSalvadoranSamoanScandinavianScotch-IrishScottishSeminoleSerbianSiouxSlavicSlovakSloveneSouth AfricanSouth AmericanSouth American IndianSpaniardSpanishSpanish American IndianSri LankanSubsaharan AfricanSudaneseSwedishSwissSyrianThaiTlingit-HaidaTonganTrinidadian and TobagonianTurkishU.S. Virgin IslanderUkrainianUruguayanVenezuelanVietnameseWelshWest IndianYugoslavianZimbabwean
Ancestry (Percentage)
AfricanAlaska NativeAlbanianAmericanApacheArabArapahoArgentineanArmenianAustralianAustrianBahamianBangladeshiBarbadianBasqueBelgianBhutaneseBlackfeetBolivianBrazilianBritishBritish West IndianBulgarianBurmeseCajunCambodianCanadianCelticCentral AmericanCentral American IndianCherokeeCheyenneChickasawChileanChippewaChoctawColombianComancheCreeCreekCroatianCubanCzechCzechoslovakianDanishDelawareDominicanDutchDutch West IndianEastern EuropeanEcuadorianEgyptianEnglishEstonianEthiopianEuropeanFijianFilipinoFinnishFrenchFrench American IndianFrench CanadianGermanGerman RussianGhanaianGreekGuamanian / ChamorroGuatemalanGuyaneseHaitianHonduranHopiHungarianIcelanderIndian (Asian)IndonesianInupiatIranianIraqiIrishIroquoisIsraeliItalianJamaicanJapaneseJordanianKenyanKiowaKoreanLaotianLatvianLebaneseLiberianLithuanianLuxembourgerMalaysianMexicanMexican American IndianMongolianMoroccanNative HawaiianNavajoNew ZealanderNicaraguanNigerianNorthern EuropeanNorwegianOkinawanOsagePakistaniPalestinianPanamanianPennsylvania GermanPeruvianPimaPolishPortuguesePotawatomiPuebloPuerto RicanRomanianRussianSalvadoranSamoanScandinavianScotch-IrishScottishSeminoleSerbianSiouxSlavicSlovakSloveneSouth AfricanSouth AmericanSouth American IndianSpaniardSpanishSpanish American IndianSri LankanSubsaharan AfricanSudaneseSwedishSwissSyrianThaiTlingit-HaidaTonganTrinidadian and TobagonianTurkishU.S. Virgin IslanderUkrainianUruguayanVenezuelanVietnameseWelshWest IndianYugoslavianZimbabwean
Immigrant Origin (Total)
AfricaArgentinaAsiaAustraliaAustriaBahamasBangladeshBosnia and HerzegovinaBrazilBulgariaBurma / MyanmarCambodiaCameroonCanadaCaribbeanCentral AmericaChileChinaColombiaCubaDominican RepublicEastern AfricaEastern AsiaEastern EuropeEcuadorEgyptEl SalvadorEnglandEritreaEthiopiaEuropeFranceGermanyGhanaGreeceGuatemalaHondurasHong KongIndiaIndonesiaIranIraqIrelandItalyJamaicaJapanJordanKazakhstanKenyaKoreaKuwaitLaosLatin AmericaLebanonLiberiaMalaysiaMexicoMiddle AfricaMoroccoNepalNetherlandsNicaraguaNigeriaNorthern AfricaNorthern EuropeNorwayOceaniaPakistanPanamaPeruPhilippinesPolandPortugalRussiaSaudi ArabiaScotlandSingaporeSouth AfricaSouth AmericaSouth Central AsiaSouth Eastern AsiaSouthern EuropeSpainSudanSyriaTaiwanThailandTrinidad and TobagoTurkeyUkraineVenezuelaVietnamWestern AfricaWestern AsiaWestern EuropeZaireZimbabwe
Immigrant Origin (Percentage)
AfricaArgentinaAsiaAustraliaAustriaBahamasBangladeshBosnia and HerzegovinaBrazilBulgariaBurma / MyanmarCambodiaCameroonCanadaCaribbeanCentral AmericaChileChinaColombiaCubaDominican RepublicEastern AfricaEastern AsiaEastern EuropeEcuadorEgyptEl SalvadorEnglandEritreaEthiopiaEuropeFranceGermanyGhanaGreeceGuatemalaHondurasHong KongIndiaIndonesiaIranIraqIrelandItalyJamaicaJapanJordanKazakhstanKenyaKoreaKuwaitLaosLatin AmericaLebanonLiberiaMalaysiaMexicoMiddle AfricaMoroccoNepalNetherlandsNicaraguaNigeriaNorthern AfricaNorthern EuropeNorwayOceaniaPakistanPanamaPeruPhilippinesPolandPortugalRussiaSaudi ArabiaScotlandSingaporeSouth AfricaSouth AmericaSouth Central AsiaSouth Eastern AsiaSouthern EuropeSpainSudanSyriaTaiwanThailandTrinidad and TobagoTurkeyUkraineVenezuelaVietnamWestern AfricaWestern AsiaWestern EuropeZaireZimbabwe
Income
Income (Families)
Income (Households)
Poverty
Poverty (Families)
Unemployment
Employment Occupations
Employment Industries
Employer Class
Commute Time
Commute Means
School Enrollment
Education by Degree Field
Occupancy
Finances
Physical Characteristics
Oklahoma City
Compare Zip Codes
Comparison Subject

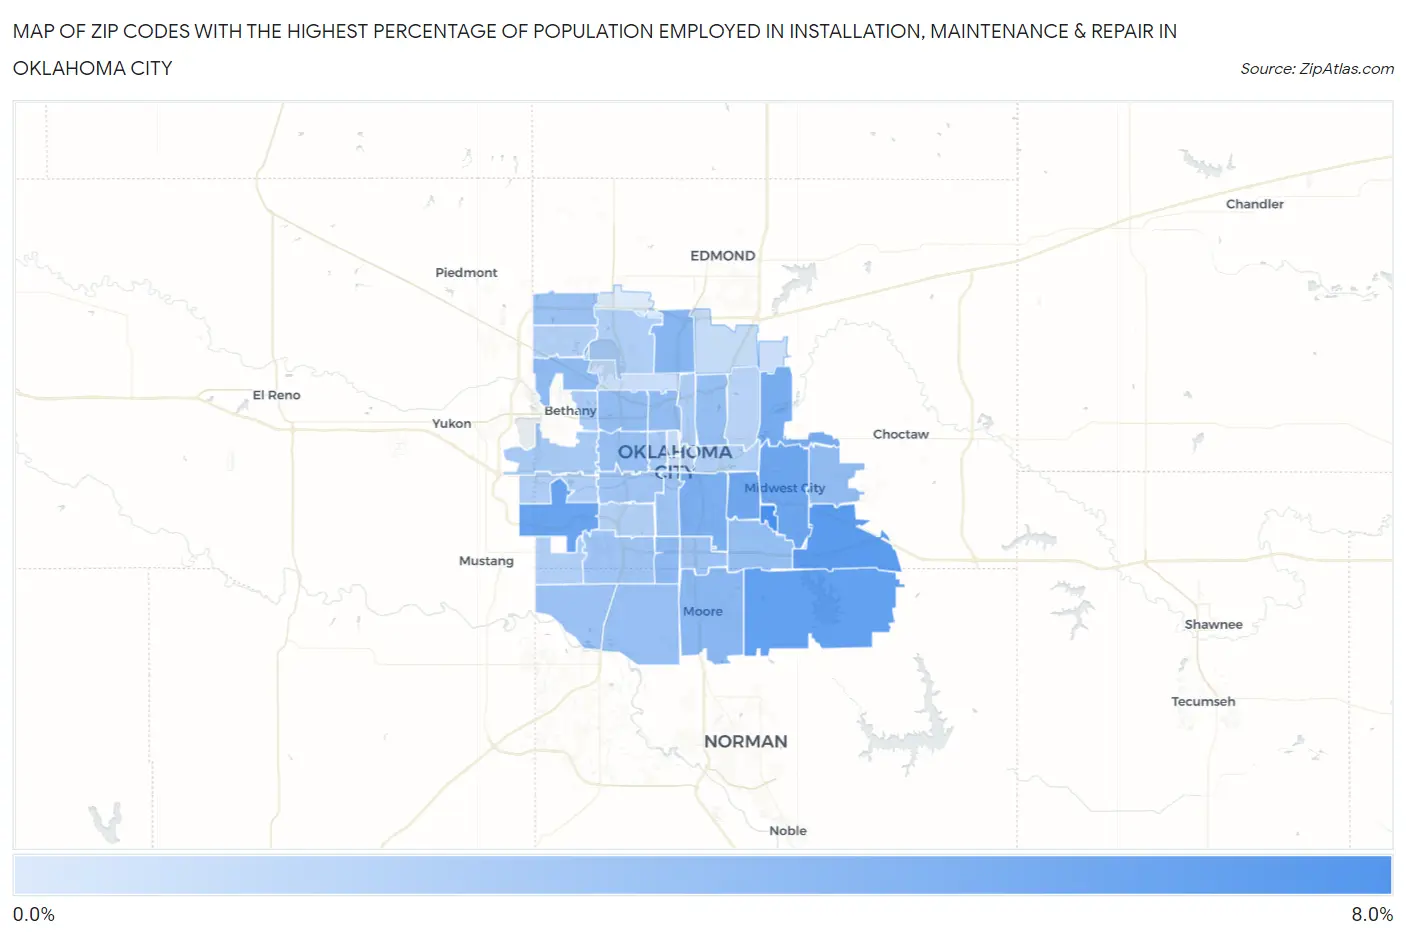
Map of Zip Codes with the Highest Percentage of Population Employed in Installation, Maintenance & Repair in Oklahoma City

0.0%
8.0%
Zip Codes with the Highest Percentage of Population Employed in Installation, Maintenance & Repair in Oklahoma City Map

Zip Codes with the Highest Percentage of Population Employed in Installation, Maintenance & Repair in Oklahoma City, OK

Zip Code % Employed vs State vs National
1.731457.8%4.2%(+3.66)#933.1%(+4.76)#3,483
2.731506.9%4.2%(+2.75)#1273.1%(+3.85)#4,553
3.731656.4%4.2%(+2.27)#1473.1%(+3.38)#5,295
4.731796.0%4.2%(+1.86)#1783.1%(+2.97)#6,049
5.731105.8%4.2%(+1.68)#1853.1%(+2.78)#6,451
6.731155.6%4.2%(+1.48)#1983.1%(+2.58)#6,908
7.731415.4%4.2%(+1.20)#2213.1%(+2.30)#7,608
8.731295.1%4.2%(+0.892)#2463.1%(+1.99)#8,528
9.731144.5%4.2%(+0.325)#2953.1%(+1.43)#10,442
10.731604.4%4.2%(+0.244)#3023.1%(+1.35)#10,717
11.731394.2%4.2%(-0.006)#3283.1%(+1.10)#11,672
12.731324.1%4.2%(-0.078)#3383.1%(+1.02)#11,955
13.731303.9%4.2%(-0.232)#3553.1%(+0.870)#12,637
14.731123.9%4.2%(-0.275)#3603.1%(+0.827)#12,830
15.731183.9%4.2%(-0.296)#3633.1%(+0.806)#12,926
16.731353.8%4.2%(-0.340)#3693.1%(+0.762)#13,116
17.731113.8%4.2%(-0.419)#3773.1%(+0.683)#13,457
18.731073.7%4.2%(-0.425)#3793.1%(+0.677)#13,489
19.731703.7%4.2%(-0.512)#3853.1%(+0.590)#13,887
20.731493.6%4.2%(-0.601)#3973.1%(+0.501)#14,290
21.731423.5%4.2%(-0.638)#4033.1%(+0.464)#14,482
22.731733.4%4.2%(-0.743)#4133.1%(+0.359)#14,968
23.731093.3%4.2%(-0.866)#4213.1%(+0.236)#15,534
24.731083.3%4.2%(-0.891)#4253.1%(+0.211)#15,656
25.731593.2%4.2%(-0.968)#4313.1%(+0.134)#16,021
26.731062.9%4.2%(-1.26)#4633.1%(-0.162)#17,460
27.731272.9%4.2%(-1.28)#4653.1%(-0.181)#17,565
28.731222.8%4.2%(-1.37)#4713.1%(-0.267)#18,002
29.731052.7%4.2%(-1.49)#4833.1%(-0.383)#18,638
30.731282.6%4.2%(-1.59)#4923.1%(-0.491)#19,196
31.731692.4%4.2%(-1.72)#5033.1%(-0.621)#19,808
32.731172.4%4.2%(-1.73)#5043.1%(-0.631)#19,879
33.731202.4%4.2%(-1.80)#5083.1%(-0.694)#20,201
34.731192.3%4.2%(-1.85)#5123.1%(-0.749)#20,486
35.731622.3%4.2%(-1.85)#5143.1%(-0.749)#20,488
36.731212.1%4.2%(-2.05)#5253.1%(-0.951)#21,468
37.731042.1%4.2%(-2.08)#5263.1%(-0.975)#21,569
38.731021.7%4.2%(-2.50)#5493.1%(-1.40)#23,493
39.731031.5%4.2%(-2.63)#5523.1%(-1.53)#24,014
40.731311.4%4.2%(-2.73)#5573.1%(-1.63)#24,425
41.731511.2%4.2%(-2.97)#5683.1%(-1.87)#25,279
42.731161.2%4.2%(-3.01)#5703.1%(-1.91)#25,403
43.731340.27%4.2%(-3.90)#5873.1%(-2.79)#27,596

Common Questions

What are the Top 10 Zip Codes with the Highest Percentage of Population Employed in Installation, Maintenance & Repair in Oklahoma City, OK?
Top 10 Zip Codes with the Highest Percentage of Population Employed in Installation, Maintenance & Repair in Oklahoma City, OK are:
#1
7.8%
#2
6.9%
#3
6.4%
#4
6.0%
#5
5.8%
#6
5.6%
#7
5.4%
#8
5.1%
#9
4.5%
#10
4.4%
What zip code has the Highest Percentage of Population Employed in Installation, Maintenance & Repair in Oklahoma City, OK?
73145 has the Highest Percentage of Population Employed in Installation, Maintenance & Repair in Oklahoma City, OK with 7.8%.
What is the Percentage of Population Employed in Installation, Maintenance & Repair in Oklahoma City, OK?
Percentage of Population Employed in Installation, Maintenance & Repair in Oklahoma City is 3.5%.
What is the Percentage of Population Employed in Installation, Maintenance & Repair in Oklahoma?
Percentage of Population Employed in Installation, Maintenance & Repair in Oklahoma is 4.2%.
What is the Percentage of Population Employed in Installation, Maintenance & Repair in the United States?
Percentage of Population Employed in Installation, Maintenance & Repair in the United States is 3.1%.