Zip Codes with the Highest Percentage of Households with Income Below $10,000 in Stillwater, OK
RELATED REPORTS & OPTIONS
Household Income | $0-10k
Stillwater
Compare Zip Codes
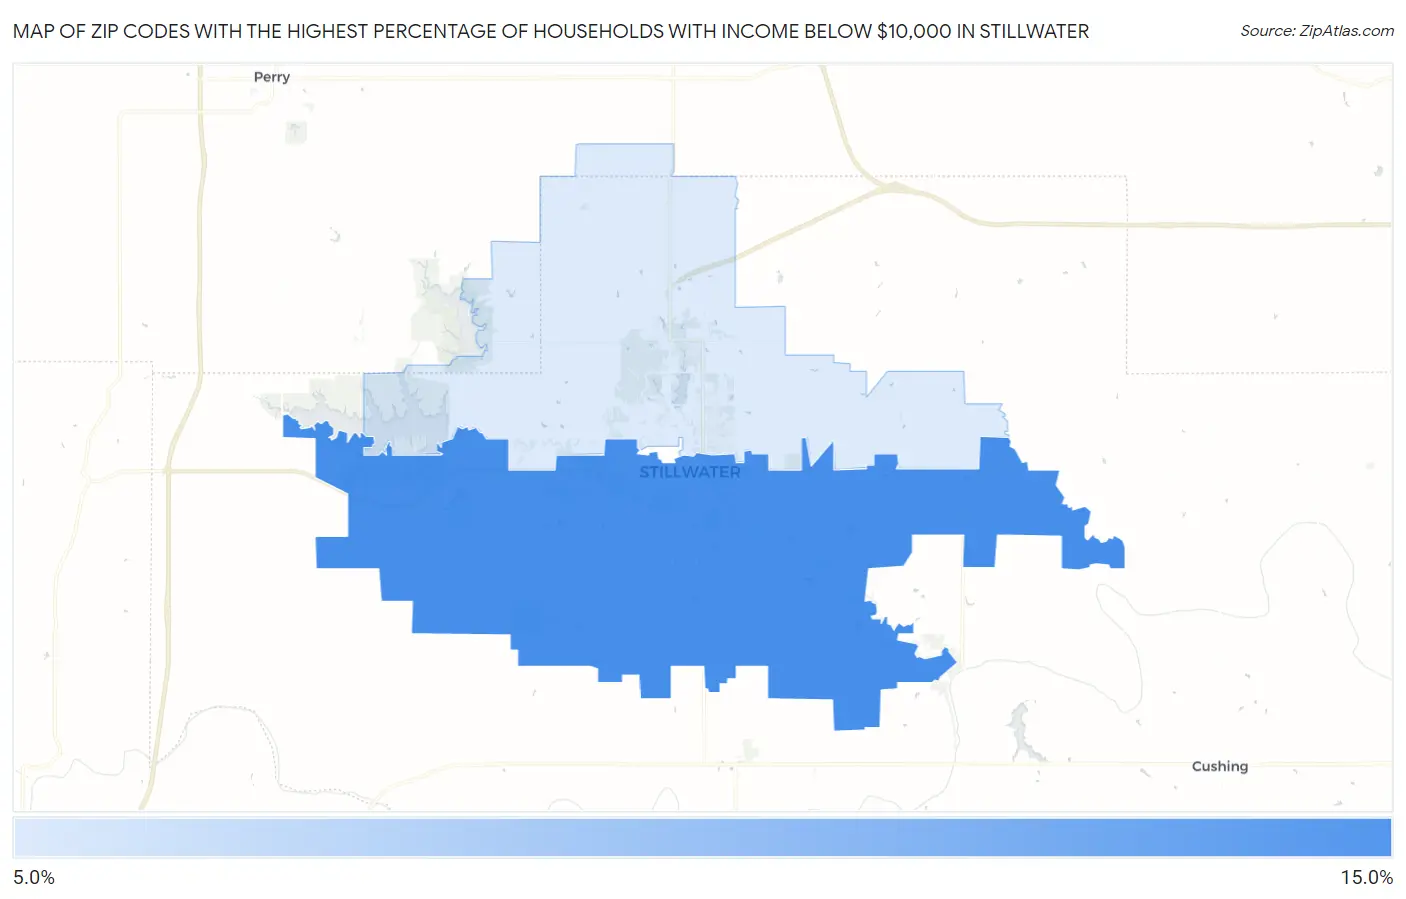
Map of Zip Codes with the Highest Percentage of Households with Income Below $10,000 in Stillwater
12.3%
14.9%
Zip Codes with the Highest Percentage of Households with Income Below $10,000 in Stillwater, OK
| Zip Code | Households with Income < $10k | vs State | vs National | |
| 1. | 74074 | 14.9% | 5.6%(+9.30)#25 | 4.9%(+10.00)#1,539 |
| 2. | 74075 | 12.3% | 5.6%(+6.70)#39 | 4.9%(+7.40)#2,328 |
1
Common Questions
What are the Top Zip Codes with the Highest Percentage of Households with Income Below $10,000 in Stillwater, OK?
Top Zip Codes with the Highest Percentage of Households with Income Below $10,000 in Stillwater, OK are:
What zip code has the Highest Percentage of Households with Income Below $10,000 in Stillwater, OK?
74074 has the Highest Percentage of Households with Income Below $10,000 in Stillwater, OK with 14.9%.
What is the Percentage of Households with Income Below $10,000 in Stillwater, OK?
Percentage of Households with Income Below $10,000 in Stillwater is 15.2%.
What is the Percentage of Households with Income Below $10,000 in Oklahoma?
Percentage of Households with Income Below $10,000 in Oklahoma is 5.6%.
What is the Percentage of Households with Income Below $10,000 in the United States?
Percentage of Households with Income Below $10,000 in the United States is 4.9%.