Zip Codes with the Highest Percentage of Scotch-Irish Population in Oklahoma City, OK

RELATED REPORTS & OPTIONS

Scotch-Irish
Population
Families and Households
Female Fertility
Female Fertility (Unmarried)
Race (Community Size)
Race (Percentage)
Ancestry (Community Size)
AfricanAlaska NativeAlbanianAmericanApacheArabArapahoArgentineanArmenianAustralianAustrianBahamianBangladeshiBarbadianBasqueBelgianBhutaneseBlackfeetBolivianBrazilianBritishBritish West IndianBulgarianBurmeseCajunCambodianCanadianCelticCentral AmericanCentral American IndianCherokeeCheyenneChickasawChileanChippewaChoctawColombianComancheCreeCreekCroatianCubanCzechCzechoslovakianDanishDelawareDominicanDutchDutch West IndianEastern EuropeanEcuadorianEgyptianEnglishEstonianEthiopianEuropeanFijianFilipinoFinnishFrenchFrench American IndianFrench CanadianGermanGerman RussianGhanaianGreekGuamanian / ChamorroGuatemalanGuyaneseHaitianHonduranHopiHungarianIcelanderIndian (Asian)IndonesianInupiatIranianIraqiIrishIroquoisIsraeliItalianJamaicanJapaneseJordanianKenyanKiowaKoreanLaotianLatvianLebaneseLiberianLithuanianLuxembourgerMalaysianMexicanMexican American IndianMongolianMoroccanNative HawaiianNavajoNew ZealanderNicaraguanNigerianNorthern EuropeanNorwegianOkinawanOsagePakistaniPalestinianPanamanianPennsylvania GermanPeruvianPimaPolishPortuguesePotawatomiPuebloPuerto RicanRomanianRussianSalvadoranSamoanScandinavianScotch-IrishScottishSeminoleSerbianSiouxSlavicSlovakSloveneSouth AfricanSouth AmericanSouth American IndianSpaniardSpanishSpanish American IndianSri LankanSubsaharan AfricanSudaneseSwedishSwissSyrianThaiTlingit-HaidaTonganTrinidadian and TobagonianTurkishU.S. Virgin IslanderUkrainianUruguayanVenezuelanVietnameseWelshWest IndianYugoslavianZimbabwean
Ancestry (Percentage)
AfricanAlaska NativeAlbanianAmericanApacheArabArapahoArgentineanArmenianAustralianAustrianBahamianBangladeshiBarbadianBasqueBelgianBhutaneseBlackfeetBolivianBrazilianBritishBritish West IndianBulgarianBurmeseCajunCambodianCanadianCelticCentral AmericanCentral American IndianCherokeeCheyenneChickasawChileanChippewaChoctawColombianComancheCreeCreekCroatianCubanCzechCzechoslovakianDanishDelawareDominicanDutchDutch West IndianEastern EuropeanEcuadorianEgyptianEnglishEstonianEthiopianEuropeanFijianFilipinoFinnishFrenchFrench American IndianFrench CanadianGermanGerman RussianGhanaianGreekGuamanian / ChamorroGuatemalanGuyaneseHaitianHonduranHopiHungarianIcelanderIndian (Asian)IndonesianInupiatIranianIraqiIrishIroquoisIsraeliItalianJamaicanJapaneseJordanianKenyanKiowaKoreanLaotianLatvianLebaneseLiberianLithuanianLuxembourgerMalaysianMexicanMexican American IndianMongolianMoroccanNative HawaiianNavajoNew ZealanderNicaraguanNigerianNorthern EuropeanNorwegianOkinawanOsagePakistaniPalestinianPanamanianPennsylvania GermanPeruvianPimaPolishPortuguesePotawatomiPuebloPuerto RicanRomanianRussianSalvadoranSamoanScandinavianScotch-IrishScottishSeminoleSerbianSiouxSlavicSlovakSloveneSouth AfricanSouth AmericanSouth American IndianSpaniardSpanishSpanish American IndianSri LankanSubsaharan AfricanSudaneseSwedishSwissSyrianThaiTlingit-HaidaTonganTrinidadian and TobagonianTurkishU.S. Virgin IslanderUkrainianUruguayanVenezuelanVietnameseWelshWest IndianYugoslavianZimbabwean
Immigrant Origin (Total)
AfricaArgentinaAsiaAustraliaAustriaBahamasBangladeshBosnia and HerzegovinaBrazilBulgariaBurma / MyanmarCambodiaCameroonCanadaCaribbeanCentral AmericaChileChinaColombiaCubaDominican RepublicEastern AfricaEastern AsiaEastern EuropeEcuadorEgyptEl SalvadorEnglandEritreaEthiopiaEuropeFranceGermanyGhanaGreeceGuatemalaHondurasHong KongIndiaIndonesiaIranIraqIrelandItalyJamaicaJapanJordanKazakhstanKenyaKoreaKuwaitLaosLatin AmericaLebanonLiberiaMalaysiaMexicoMiddle AfricaMoroccoNepalNetherlandsNicaraguaNigeriaNorthern AfricaNorthern EuropeNorwayOceaniaPakistanPanamaPeruPhilippinesPolandPortugalRussiaSaudi ArabiaScotlandSingaporeSouth AfricaSouth AmericaSouth Central AsiaSouth Eastern AsiaSouthern EuropeSpainSudanSyriaTaiwanThailandTrinidad and TobagoTurkeyUkraineVenezuelaVietnamWestern AfricaWestern AsiaWestern EuropeZaireZimbabwe
Immigrant Origin (Percentage)
AfricaArgentinaAsiaAustraliaAustriaBahamasBangladeshBosnia and HerzegovinaBrazilBulgariaBurma / MyanmarCambodiaCameroonCanadaCaribbeanCentral AmericaChileChinaColombiaCubaDominican RepublicEastern AfricaEastern AsiaEastern EuropeEcuadorEgyptEl SalvadorEnglandEritreaEthiopiaEuropeFranceGermanyGhanaGreeceGuatemalaHondurasHong KongIndiaIndonesiaIranIraqIrelandItalyJamaicaJapanJordanKazakhstanKenyaKoreaKuwaitLaosLatin AmericaLebanonLiberiaMalaysiaMexicoMiddle AfricaMoroccoNepalNetherlandsNicaraguaNigeriaNorthern AfricaNorthern EuropeNorwayOceaniaPakistanPanamaPeruPhilippinesPolandPortugalRussiaSaudi ArabiaScotlandSingaporeSouth AfricaSouth AmericaSouth Central AsiaSouth Eastern AsiaSouthern EuropeSpainSudanSyriaTaiwanThailandTrinidad and TobagoTurkeyUkraineVenezuelaVietnamWestern AfricaWestern AsiaWestern EuropeZaireZimbabwe
Income
Income (Families)
Income (Households)
Poverty
Poverty (Families)
Unemployment
Employment Occupations
Employment Industries
Employer Class
Commute Time
Commute Means
School Enrollment
Education by Degree Field
Occupancy
Finances
Physical Characteristics
Oklahoma City
Compare Zip Codes
Comparison Subject

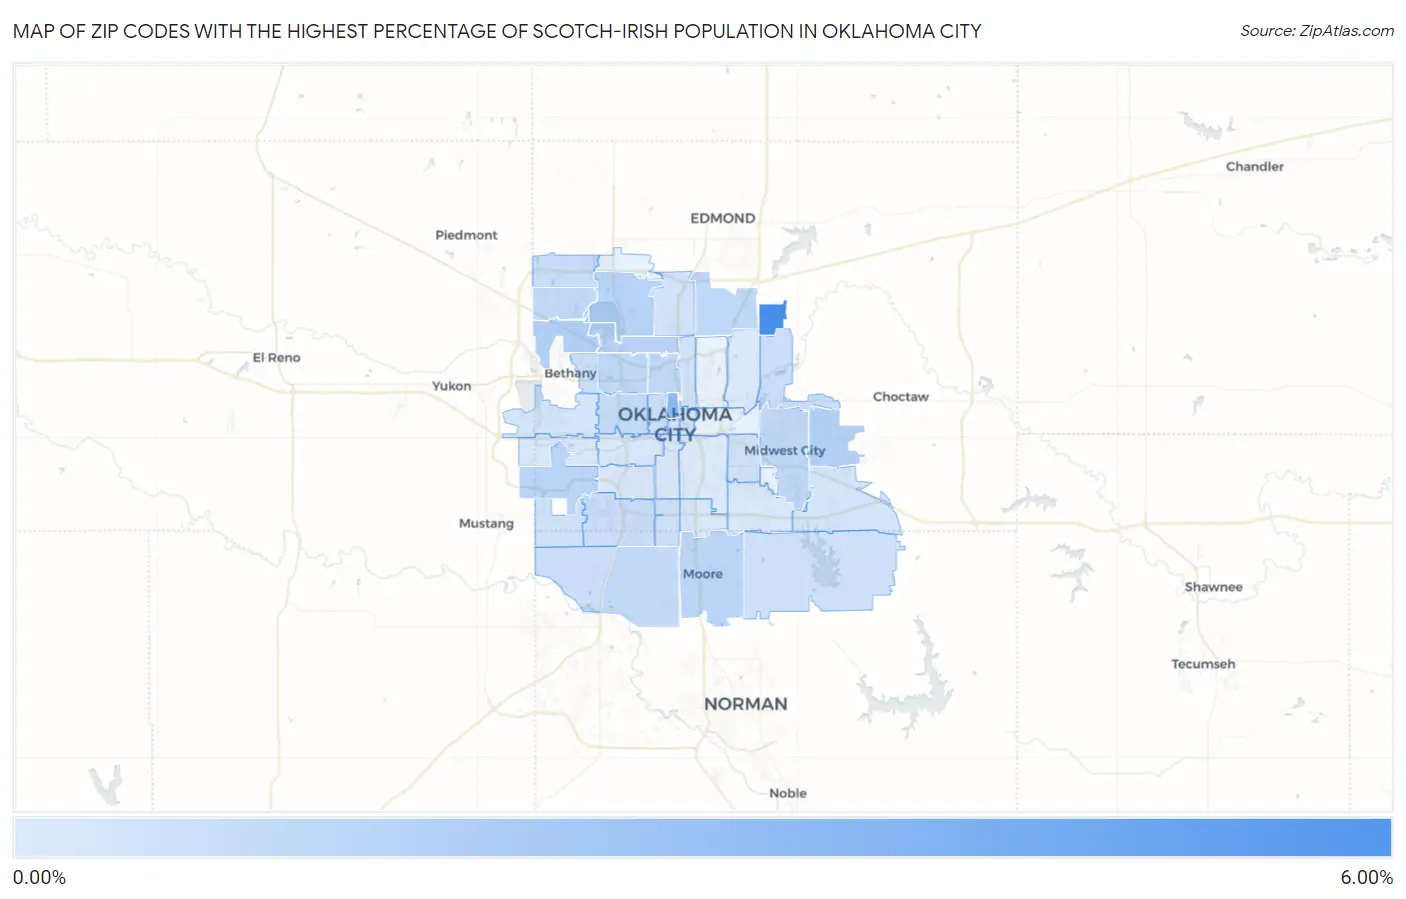
Map of Zip Codes with the Highest Percentage of Scotch-Irish Population in Oklahoma City

0.00%
6.00%
Zip Codes with the Highest Percentage of Scotch-Irish Population in Oklahoma City Map

Zip Codes with the Highest Percentage of Scotch-Irish Population in Oklahoma City, OK

Zip Code Scotch-Irish vs State vs National
1.731515.91%0.97%(+4.94)#100.82%(+5.10)#563
2.731033.19%0.97%(+2.21)#210.82%(+2.37)#1,742
3.731321.58%0.97%(+0.602)#1040.82%(+0.758)#5,499
4.731301.48%0.97%(+0.507)#1190.82%(+0.663)#6,040
5.731161.42%0.97%(+0.446)#1300.82%(+0.602)#6,398
6.731201.42%0.97%(+0.443)#1310.82%(+0.599)#6,412
7.731791.30%0.97%(+0.322)#1460.82%(+0.478)#7,243
8.731601.24%0.97%(+0.264)#1590.82%(+0.419)#7,660
9.731121.18%0.97%(+0.208)#1680.82%(+0.364)#8,055
10.731311.12%0.97%(+0.147)#1730.82%(+0.302)#8,582
11.731101.08%0.97%(+0.111)#1810.82%(+0.266)#8,884
12.731181.04%0.97%(+0.066)#1960.82%(+0.222)#9,320
13.731620.98%0.97%(+0.009)#2130.82%(+0.164)#9,934
14.731700.98%0.97%(+0.008)#2140.82%(+0.164)#9,937
15.731070.89%0.97%(-0.079)#2380.82%(+0.077)#10,893
16.731420.81%0.97%(-0.165)#2670.82%(-0.009)#11,951
17.731410.76%0.97%(-0.216)#2820.82%(-0.060)#12,605
18.731730.75%0.97%(-0.219)#2840.82%(-0.063)#12,647
19.731590.69%0.97%(-0.285)#3050.82%(-0.129)#13,556
20.731220.61%0.97%(-0.367)#3280.82%(-0.211)#14,738
21.731060.60%0.97%(-0.374)#3310.82%(-0.218)#14,833
22.731690.54%0.97%(-0.429)#3560.82%(-0.273)#15,683
23.731650.53%0.97%(-0.441)#3570.82%(-0.285)#15,884
24.731390.53%0.97%(-0.445)#3590.82%(-0.289)#15,943
25.731150.47%0.97%(-0.500)#3770.82%(-0.344)#16,832
26.731050.45%0.97%(-0.519)#3870.82%(-0.363)#17,150
27.731040.45%0.97%(-0.524)#3880.82%(-0.368)#17,228
28.731140.44%0.97%(-0.538)#3960.82%(-0.383)#17,456
29.731020.40%0.97%(-0.569)#4060.82%(-0.413)#18,016
30.731500.40%0.97%(-0.574)#4080.82%(-0.418)#18,075
31.731270.32%0.97%(-0.655)#4350.82%(-0.499)#19,426
32.731490.16%0.97%(-0.816)#4830.82%(-0.660)#22,157
33.731190.12%0.97%(-0.852)#4930.82%(-0.696)#22,729
34.731080.11%0.97%(-0.865)#4960.82%(-0.709)#22,932
35.731280.11%0.97%(-0.866)#4970.82%(-0.710)#22,938
36.731210.096%0.97%(-0.878)#4990.82%(-0.722)#23,101
37.731350.086%0.97%(-0.887)#5020.82%(-0.732)#23,219
38.731090.051%0.97%(-0.923)#5060.82%(-0.767)#23,638
39.731290.0049%0.97%(-0.969)#5070.82%(-0.813)#23,991

Common Questions

What are the Top 10 Zip Codes with the Highest Percentage of Scotch-Irish Population in Oklahoma City, OK?
Top 10 Zip Codes with the Highest Percentage of Scotch-Irish Population in Oklahoma City, OK are:
#1
5.91%
#2
3.19%
#3
1.58%
#4
1.48%
#5
1.42%
#6
1.42%
#7
1.30%
#8
1.24%
#9
1.18%
#10
1.12%
What zip code has the Highest Percentage of Scotch-Irish Population in Oklahoma City, OK?
73151 has the Highest Percentage of Scotch-Irish Population in Oklahoma City, OK with 5.91%.
What is the Percentage of Scotch-Irish Population in Oklahoma City, OK?
Percentage of Scotch-Irish Population in Oklahoma City is 0.71%.
What is the Percentage of Scotch-Irish Population in Oklahoma?
Percentage of Scotch-Irish Population in Oklahoma is 0.97%.
What is the Percentage of Scotch-Irish Population in the United States?
Percentage of Scotch-Irish Population in the United States is 0.82%.