Zip Codes with the Highest Percentage of Population Employed in Real Estate, Rental & Leasing in Oklahoma City, OK
RELATED REPORTS & OPTIONS
Real Estate, Rental & Leasing
Oklahoma City
Compare Zip Codes
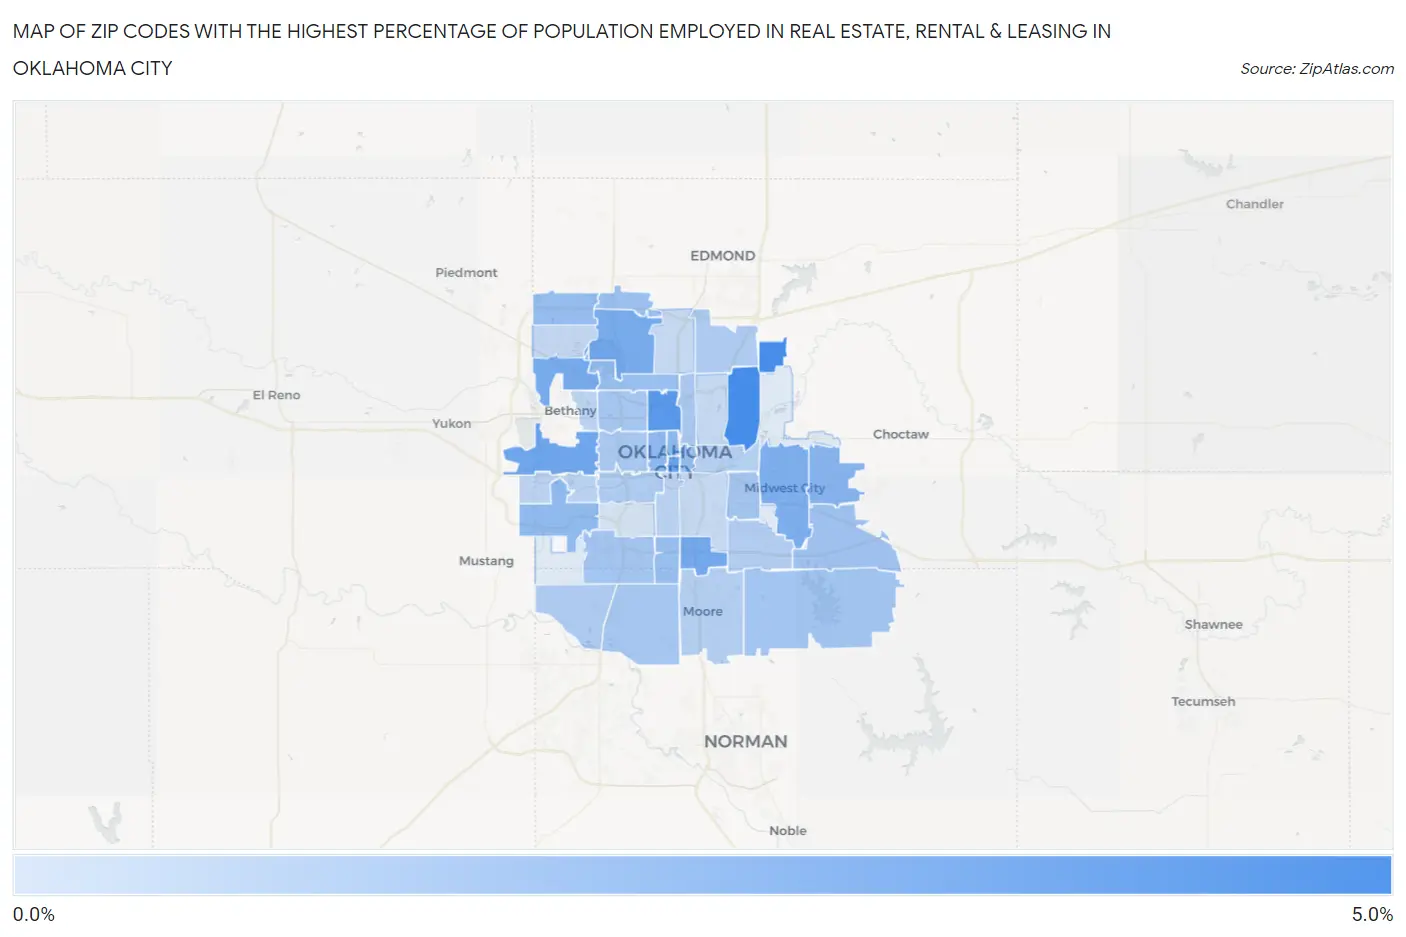
Map of Zip Codes with the Highest Percentage of Population Employed in Real Estate, Rental & Leasing in Oklahoma City
0.17%
4.2%
Zip Codes with the Highest Percentage of Population Employed in Real Estate, Rental & Leasing in Oklahoma City, OK
| Zip Code | % Employed | vs State | vs National | |
| 1. | 73121 | 4.2% | 1.6%(+2.57)#27 | 1.9%(+2.27)#1,991 |
| 2. | 73151 | 4.1% | 1.6%(+2.54)#28 | 1.9%(+2.24)#2,029 |
| 3. | 73118 | 3.7% | 1.6%(+2.09)#38 | 1.9%(+1.79)#2,549 |
| 4. | 73102 | 3.2% | 1.6%(+1.57)#47 | 1.9%(+1.27)#3,487 |
| 5. | 73127 | 3.0% | 1.6%(+1.37)#52 | 1.9%(+1.07)#3,999 |
| 6. | 73149 | 2.9% | 1.6%(+1.26)#61 | 1.9%(+0.963)#4,293 |
| 7. | 73120 | 2.7% | 1.6%(+1.14)#68 | 1.9%(+0.839)#4,647 |
| 8. | 73132 | 2.7% | 1.6%(+1.12)#70 | 1.9%(+0.822)#4,704 |
| 9. | 73110 | 2.5% | 1.6%(+0.943)#84 | 1.9%(+0.644)#5,356 |
| 10. | 73130 | 2.3% | 1.6%(+0.737)#97 | 1.9%(+0.438)#6,181 |
| 11. | 73103 | 2.2% | 1.6%(+0.613)#105 | 1.9%(+0.314)#6,787 |
| 12. | 73106 | 2.1% | 1.6%(+0.497)#117 | 1.9%(+0.198)#7,372 |
| 13. | 73179 | 2.1% | 1.6%(+0.469)#120 | 1.9%(+0.170)#7,526 |
| 14. | 73104 | 1.9% | 1.6%(+0.357)#131 | 1.9%(+0.058)#8,126 |
| 15. | 73142 | 1.9% | 1.6%(+0.323)#134 | 1.9%(+0.024)#8,370 |
| 16. | 73139 | 1.8% | 1.6%(+0.198)#153 | 1.9%(-0.101)#9,195 |
| 17. | 73116 | 1.8% | 1.6%(+0.194)#155 | 1.9%(-0.106)#9,222 |
| 18. | 73134 | 1.7% | 1.6%(+0.144)#160 | 1.9%(-0.156)#9,517 |
| 19. | 73150 | 1.6% | 1.6%(+0.031)#173 | 1.9%(-0.268)#10,283 |
| 20. | 73159 | 1.5% | 1.6%(-0.062)#186 | 1.9%(-0.362)#10,937 |
| 21. | 73115 | 1.5% | 1.6%(-0.083)#190 | 1.9%(-0.383)#11,083 |
| 22. | 73165 | 1.5% | 1.6%(-0.111)#195 | 1.9%(-0.410)#11,290 |
| 23. | 73170 | 1.4% | 1.6%(-0.160)#206 | 1.9%(-0.459)#11,732 |
| 24. | 73112 | 1.4% | 1.6%(-0.162)#207 | 1.9%(-0.461)#11,749 |
| 25. | 73105 | 1.4% | 1.6%(-0.235)#216 | 1.9%(-0.534)#12,285 |
| 26. | 73107 | 1.4% | 1.6%(-0.238)#218 | 1.9%(-0.537)#12,315 |
| 27. | 73131 | 1.3% | 1.6%(-0.317)#231 | 1.9%(-0.616)#12,907 |
| 28. | 73173 | 1.2% | 1.6%(-0.346)#239 | 1.9%(-0.646)#13,117 |
| 29. | 73108 | 1.2% | 1.6%(-0.378)#247 | 1.9%(-0.677)#13,384 |
| 30. | 73135 | 1.1% | 1.6%(-0.455)#260 | 1.9%(-0.754)#13,974 |
| 31. | 73160 | 1.1% | 1.6%(-0.542)#278 | 1.9%(-0.841)#14,709 |
| 32. | 73117 | 0.99% | 1.6%(-0.598)#285 | 1.9%(-0.897)#15,207 |
| 33. | 73109 | 0.90% | 1.6%(-0.695)#302 | 1.9%(-0.994)#15,978 |
| 34. | 73128 | 0.88% | 1.6%(-0.715)#307 | 1.9%(-1.01)#16,132 |
| 35. | 73122 | 0.85% | 1.6%(-0.742)#314 | 1.9%(-1.04)#16,347 |
| 36. | 73162 | 0.66% | 1.6%(-0.928)#341 | 1.9%(-1.23)#17,753 |
| 37. | 73114 | 0.60% | 1.6%(-0.995)#353 | 1.9%(-1.29)#18,305 |
| 38. | 73129 | 0.58% | 1.6%(-1.02)#357 | 1.9%(-1.32)#18,462 |
| 39. | 73111 | 0.57% | 1.6%(-1.02)#363 | 1.9%(-1.32)#18,533 |
| 40. | 73119 | 0.17% | 1.6%(-1.42)#423 | 1.9%(-1.72)#21,173 |
1
Common Questions
What are the Top 10 Zip Codes with the Highest Percentage of Population Employed in Real Estate, Rental & Leasing in Oklahoma City, OK?
Top 10 Zip Codes with the Highest Percentage of Population Employed in Real Estate, Rental & Leasing in Oklahoma City, OK are:
What zip code has the Highest Percentage of Population Employed in Real Estate, Rental & Leasing in Oklahoma City, OK?
73121 has the Highest Percentage of Population Employed in Real Estate, Rental & Leasing in Oklahoma City, OK with 4.2%.
What is the Percentage of Population Employed in Real Estate, Rental & Leasing in Oklahoma City, OK?
Percentage of Population Employed in Real Estate, Rental & Leasing in Oklahoma City is 1.6%.
What is the Percentage of Population Employed in Real Estate, Rental & Leasing in Oklahoma?
Percentage of Population Employed in Real Estate, Rental & Leasing in Oklahoma is 1.6%.
What is the Percentage of Population Employed in Real Estate, Rental & Leasing in the United States?
Percentage of Population Employed in Real Estate, Rental & Leasing in the United States is 1.9%.