Zip Codes with the Highest Percentage of Households with Income Above $200,000 in Oklahoma City, OK
RELATED REPORTS & OPTIONS
Household Income | $200k+
Oklahoma City
Compare Zip Codes
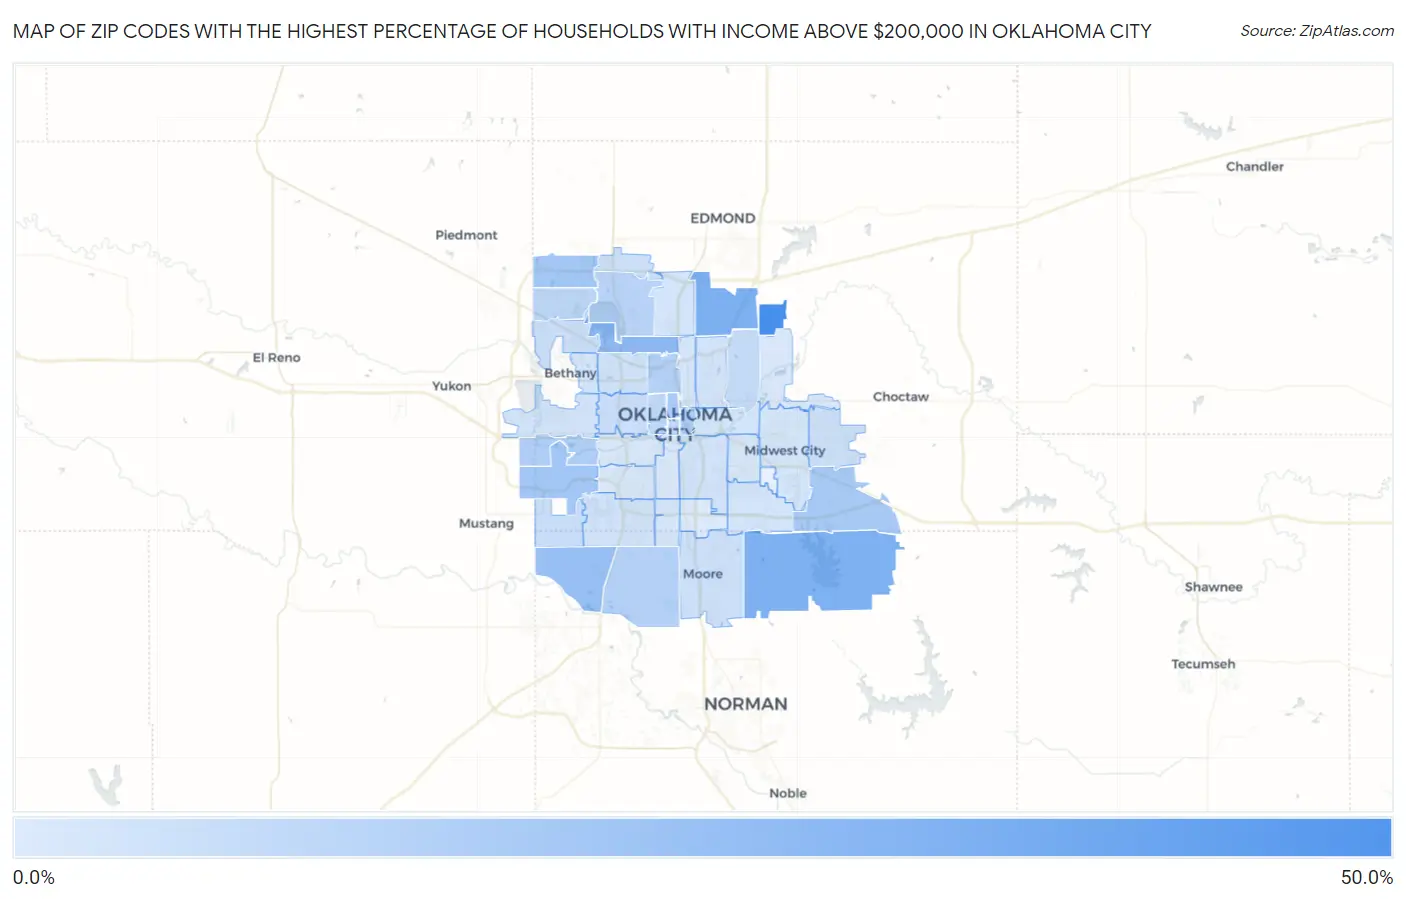
Map of Zip Codes with the Highest Percentage of Households with Income Above $200,000 in Oklahoma City
0.20%
42.5%
Zip Codes with the Highest Percentage of Households with Income Above $200,000 in Oklahoma City, OK
| Zip Code | Households with Income > $200k | vs State | vs National | |
| 1. | 73151 | 42.5% | 6.3%(+36.2)#1 | 11.4%(+31.1)#527 |
| 2. | 73131 | 26.1% | 6.3%(+19.8)#6 | 11.4%(+14.7)#2,021 |
| 3. | 73165 | 25.0% | 6.3%(+18.7)#8 | 11.4%(+13.6)#2,192 |
| 4. | 73116 | 21.4% | 6.3%(+15.1)#13 | 11.4%(+10.00)#2,909 |
| 5. | 73173 | 17.7% | 6.3%(+11.4)#21 | 11.4%(+6.30)#3,943 |
| 6. | 73142 | 15.0% | 6.3%(+8.70)#25 | 11.4%(+3.60)#4,985 |
| 7. | 73179 | 14.6% | 6.3%(+8.30)#26 | 11.4%(+3.20)#5,193 |
| 8. | 73150 | 13.5% | 6.3%(+7.20)#30 | 11.4%(+2.10)#5,753 |
| 9. | 73103 | 12.7% | 6.3%(+6.40)#34 | 11.4%(+1.30)#6,220 |
| 10. | 73104 | 12.4% | 6.3%(+6.10)#38 | 11.4%(+1.000)#6,432 |
| 11. | 73128 | 11.0% | 6.3%(+4.70)#48 | 11.4%(-0.400)#7,431 |
| 12. | 73170 | 10.7% | 6.3%(+4.40)#52 | 11.4%(-0.700)#7,610 |
| 13. | 73118 | 10.5% | 6.3%(+4.20)#54 | 11.4%(-0.900)#7,794 |
| 14. | 73120 | 9.2% | 6.3%(+2.90)#74 | 11.4%(-2.20)#9,035 |
| 15. | 73162 | 8.3% | 6.3%(+2.00)#89 | 11.4%(-3.10)#10,001 |
| 16. | 73106 | 7.2% | 6.3%(+0.900)#108 | 11.4%(-4.20)#11,516 |
| 17. | 73102 | 7.0% | 6.3%(+0.700)#114 | 11.4%(-4.40)#11,820 |
| 18. | 73121 | 6.6% | 6.3%(+0.300)#128 | 11.4%(-4.80)#12,476 |
| 19. | 73169 | 5.0% | 6.3%(-1.30)#195 | 11.4%(-6.40)#15,689 |
| 20. | 73132 | 4.9% | 6.3%(-1.40)#204 | 11.4%(-6.50)#15,835 |
| 21. | 73107 | 4.7% | 6.3%(-1.60)#216 | 11.4%(-6.70)#16,288 |
| 22. | 73130 | 4.3% | 6.3%(-2.00)#242 | 11.4%(-7.10)#17,280 |
| 23. | 73160 | 4.1% | 6.3%(-2.20)#258 | 11.4%(-7.30)#17,791 |
| 24. | 73134 | 4.0% | 6.3%(-2.30)#269 | 11.4%(-7.40)#18,178 |
| 25. | 73112 | 3.5% | 6.3%(-2.80)#294 | 11.4%(-7.90)#19,437 |
| 26. | 73159 | 2.7% | 6.3%(-3.60)#360 | 11.4%(-8.70)#21,725 |
| 27. | 73127 | 2.7% | 6.3%(-3.60)#361 | 11.4%(-8.70)#21,737 |
| 28. | 73129 | 2.7% | 6.3%(-3.60)#362 | 11.4%(-8.70)#21,747 |
| 29. | 73111 | 2.7% | 6.3%(-3.60)#364 | 11.4%(-8.70)#21,771 |
| 30. | 73135 | 2.4% | 6.3%(-3.90)#392 | 11.4%(-9.00)#22,642 |
| 31. | 73122 | 2.3% | 6.3%(-4.00)#402 | 11.4%(-9.10)#22,941 |
| 32. | 73105 | 2.3% | 6.3%(-4.00)#405 | 11.4%(-9.10)#22,980 |
| 33. | 73117 | 2.3% | 6.3%(-4.00)#406 | 11.4%(-9.10)#22,981 |
| 34. | 73114 | 2.2% | 6.3%(-4.10)#411 | 11.4%(-9.20)#23,192 |
| 35. | 73139 | 2.1% | 6.3%(-4.20)#420 | 11.4%(-9.30)#23,477 |
| 36. | 73110 | 1.6% | 6.3%(-4.70)#462 | 11.4%(-9.80)#24,805 |
| 37. | 73108 | 1.3% | 6.3%(-5.00)#486 | 11.4%(-10.1)#25,543 |
| 38. | 73141 | 1.3% | 6.3%(-5.00)#489 | 11.4%(-10.1)#25,617 |
| 39. | 73119 | 1.2% | 6.3%(-5.10)#496 | 11.4%(-10.2)#25,743 |
| 40. | 73115 | 1.2% | 6.3%(-5.10)#497 | 11.4%(-10.2)#25,756 |
| 41. | 73109 | 0.90% | 6.3%(-5.40)#519 | 11.4%(-10.5)#26,376 |
| 42. | 73149 | 0.20% | 6.3%(-6.10)#556 | 11.4%(-11.2)#27,484 |
1
Common Questions
What are the Top 10 Zip Codes with the Highest Percentage of Households with Income Above $200,000 in Oklahoma City, OK?
Top 10 Zip Codes with the Highest Percentage of Households with Income Above $200,000 in Oklahoma City, OK are:
What zip code has the Highest Percentage of Households with Income Above $200,000 in Oklahoma City, OK?
73151 has the Highest Percentage of Households with Income Above $200,000 in Oklahoma City, OK with 42.5%.
What is the Percentage of Households with Income Above $200,000 in Oklahoma City, OK?
Percentage of Households with Income Above $200,000 in Oklahoma City is 7.6%.
What is the Percentage of Households with Income Above $200,000 in Oklahoma?
Percentage of Households with Income Above $200,000 in Oklahoma is 6.3%.
What is the Percentage of Households with Income Above $200,000 in the United States?
Percentage of Households with Income Above $200,000 in the United States is 11.4%.