Zip Codes with the Highest Percentage of Population with a Degree in Liberal Arts and History in Springfield, OH
RELATED REPORTS & OPTIONS
Liberal Arts and History
Springfield
Compare Zip Codes
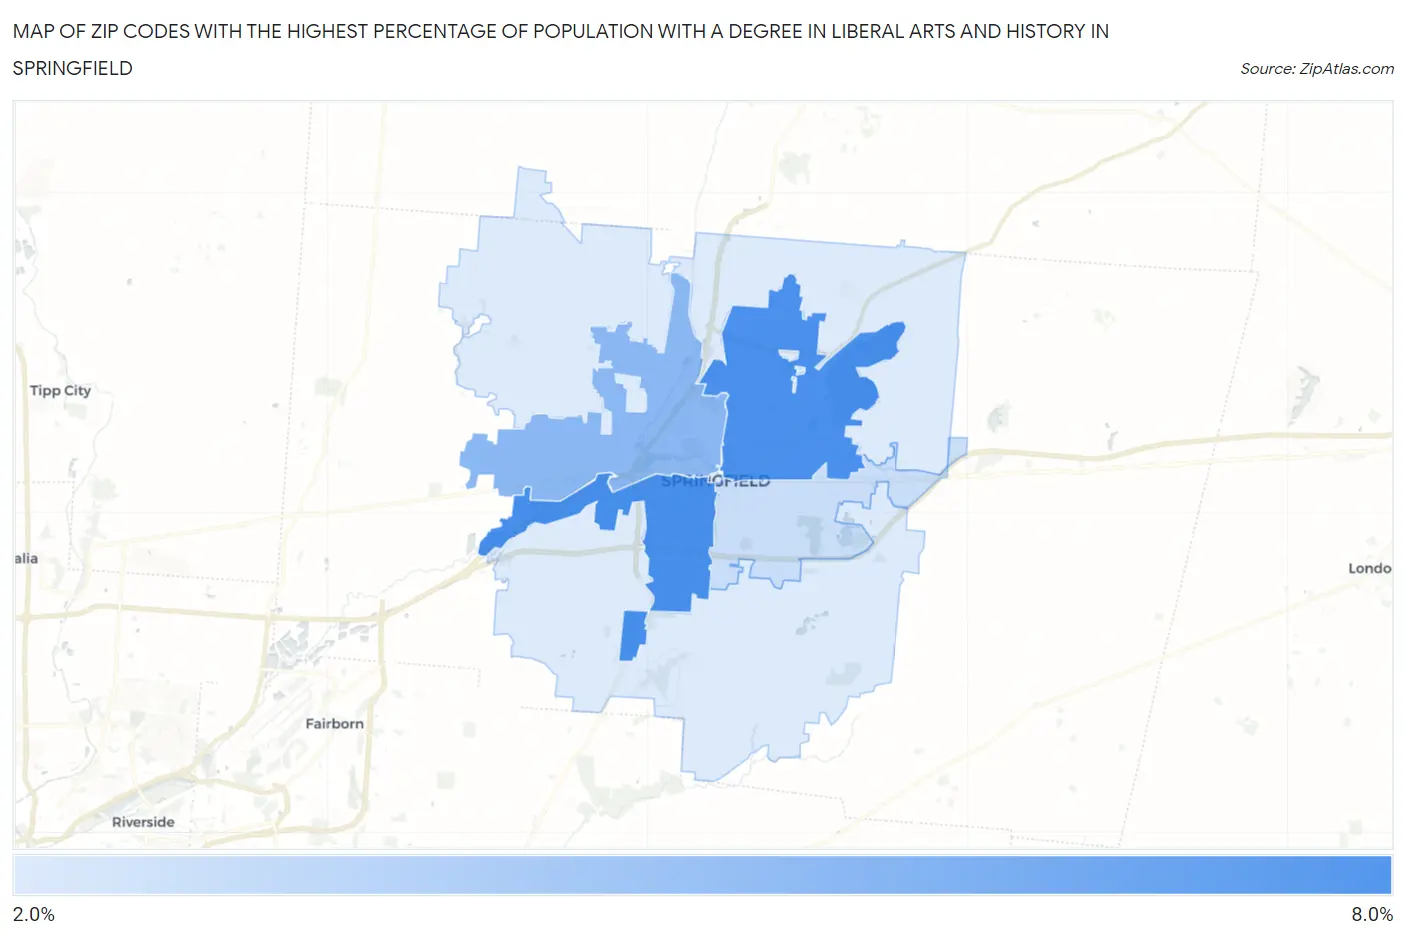
Map of Zip Codes with the Highest Percentage of Population with a Degree in Liberal Arts and History in Springfield
2.0%
7.2%
Zip Codes with the Highest Percentage of Population with a Degree in Liberal Arts and History in Springfield, OH
| Zip Code | % Graduates | vs State | vs National | |
| 1. | 45506 | 7.2% | 4.2%(+2.97)#172 | 4.9%(+2.29)#6,111 |
| 2. | 45503 | 7.0% | 4.2%(+2.85)#178 | 4.9%(+2.18)#6,309 |
| 3. | 45504 | 4.8% | 4.2%(+0.645)#357 | 4.9%(-0.030)#11,842 |
| 4. | 45505 | 2.7% | 4.2%(-1.46)#640 | 4.9%(-2.14)#19,215 |
| 5. | 45502 | 2.0% | 4.2%(-2.16)#741 | 4.9%(-2.84)#21,285 |
1
Common Questions
What are the Top 3 Zip Codes with the Highest Percentage of Population with a Degree in Liberal Arts and History in Springfield, OH?
Top 3 Zip Codes with the Highest Percentage of Population with a Degree in Liberal Arts and History in Springfield, OH are:
What zip code has the Highest Percentage of Population with a Degree in Liberal Arts and History in Springfield, OH?
45506 has the Highest Percentage of Population with a Degree in Liberal Arts and History in Springfield, OH with 7.2%.
What is the Percentage of Population with a Degree in Liberal Arts and History in Springfield, OH?
Percentage of Population with a Degree in Liberal Arts and History in Springfield is 6.6%.
What is the Percentage of Population with a Degree in Liberal Arts and History in Ohio?
Percentage of Population with a Degree in Liberal Arts and History in Ohio is 4.2%.
What is the Percentage of Population with a Degree in Liberal Arts and History in the United States?
Percentage of Population with a Degree in Liberal Arts and History in the United States is 4.9%.