Zip Codes with the Highest Percentage of Population Employed in Accommodation & Food Services in Springfield, OH
RELATED REPORTS & OPTIONS
Accommodation & Food Services
Springfield
Compare Zip Codes
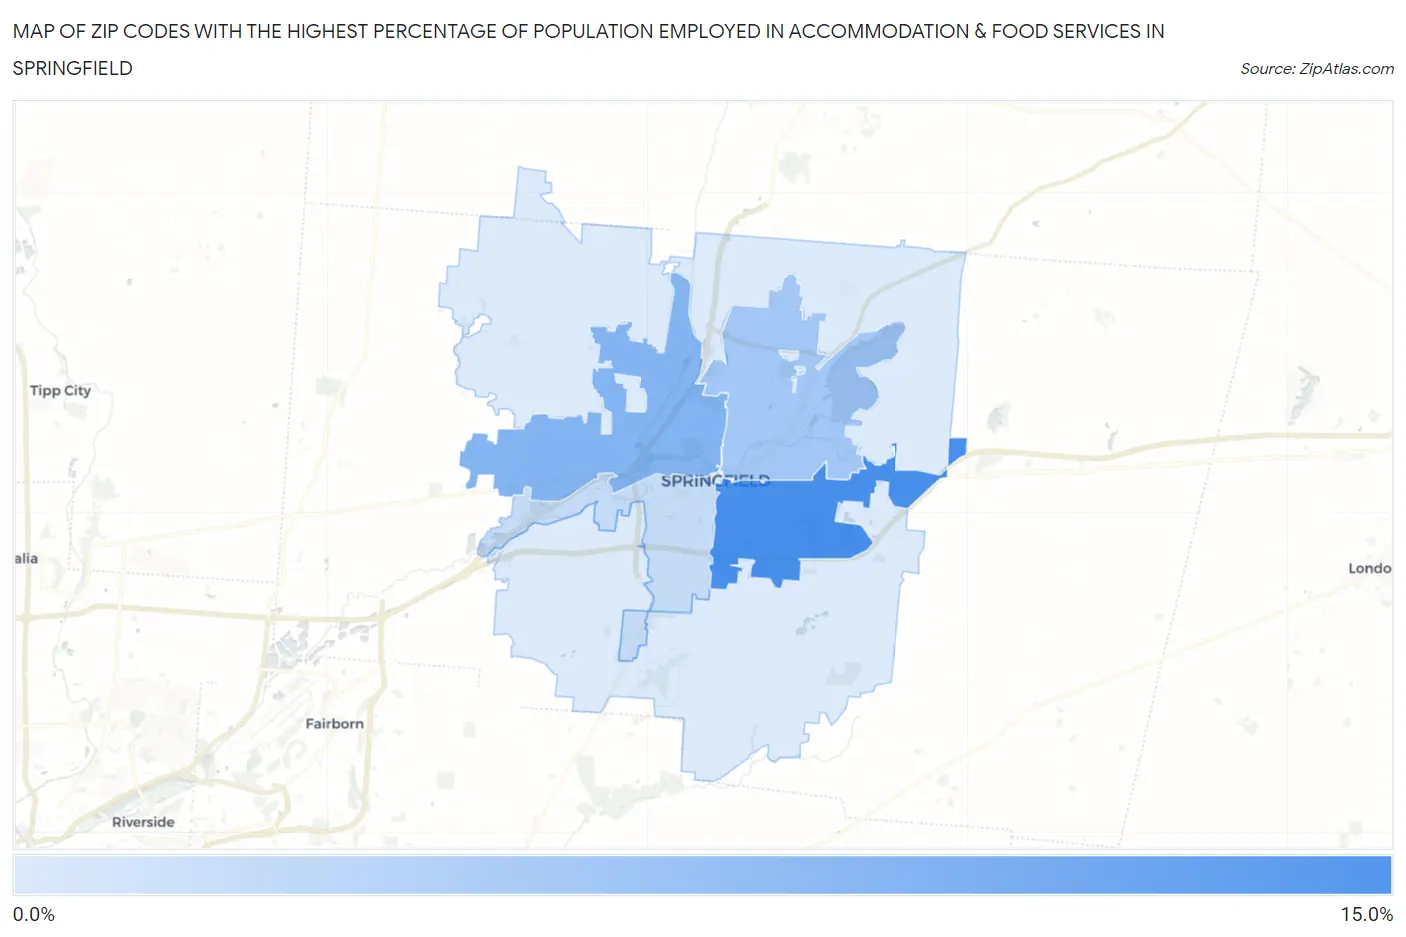
Map of Zip Codes with the Highest Percentage of Population Employed in Accommodation & Food Services in Springfield
4.4%
13.1%
Zip Codes with the Highest Percentage of Population Employed in Accommodation & Food Services in Springfield, OH
| Zip Code | % Employed | vs State | vs National | |
| 1. | 45505 | 13.1% | 7.0%(+6.06)#91 | 6.9%(+6.19)#2,317 |
| 2. | 45504 | 9.5% | 7.0%(+2.46)#231 | 6.9%(+2.59)#5,256 |
| 3. | 45503 | 7.6% | 7.0%(+0.605)#393 | 6.9%(+0.732)#8,716 |
| 4. | 45506 | 5.7% | 7.0%(-1.32)#639 | 6.9%(-1.19)#14,438 |
| 5. | 45502 | 4.4% | 7.0%(-2.62)#806 | 6.9%(-2.49)#18,859 |
1
Common Questions
What are the Top 3 Zip Codes with the Highest Percentage of Population Employed in Accommodation & Food Services in Springfield, OH?
Top 3 Zip Codes with the Highest Percentage of Population Employed in Accommodation & Food Services in Springfield, OH are:
What zip code has the Highest Percentage of Population Employed in Accommodation & Food Services in Springfield, OH?
45505 has the Highest Percentage of Population Employed in Accommodation & Food Services in Springfield, OH with 13.1%.
What is the Percentage of Population Employed in Accommodation & Food Services in Springfield, OH?
Percentage of Population Employed in Accommodation & Food Services in Springfield is 11.2%.
What is the Percentage of Population Employed in Accommodation & Food Services in Ohio?
Percentage of Population Employed in Accommodation & Food Services in Ohio is 7.0%.
What is the Percentage of Population Employed in Accommodation & Food Services in the United States?
Percentage of Population Employed in Accommodation & Food Services in the United States is 6.9%.