Zip Codes with the Highest Percentage of Population Employed in Health Diagnosing & Treating in Springfield, OH
RELATED REPORTS & OPTIONS
Health Diagnosing & Treating
Springfield
Compare Zip Codes
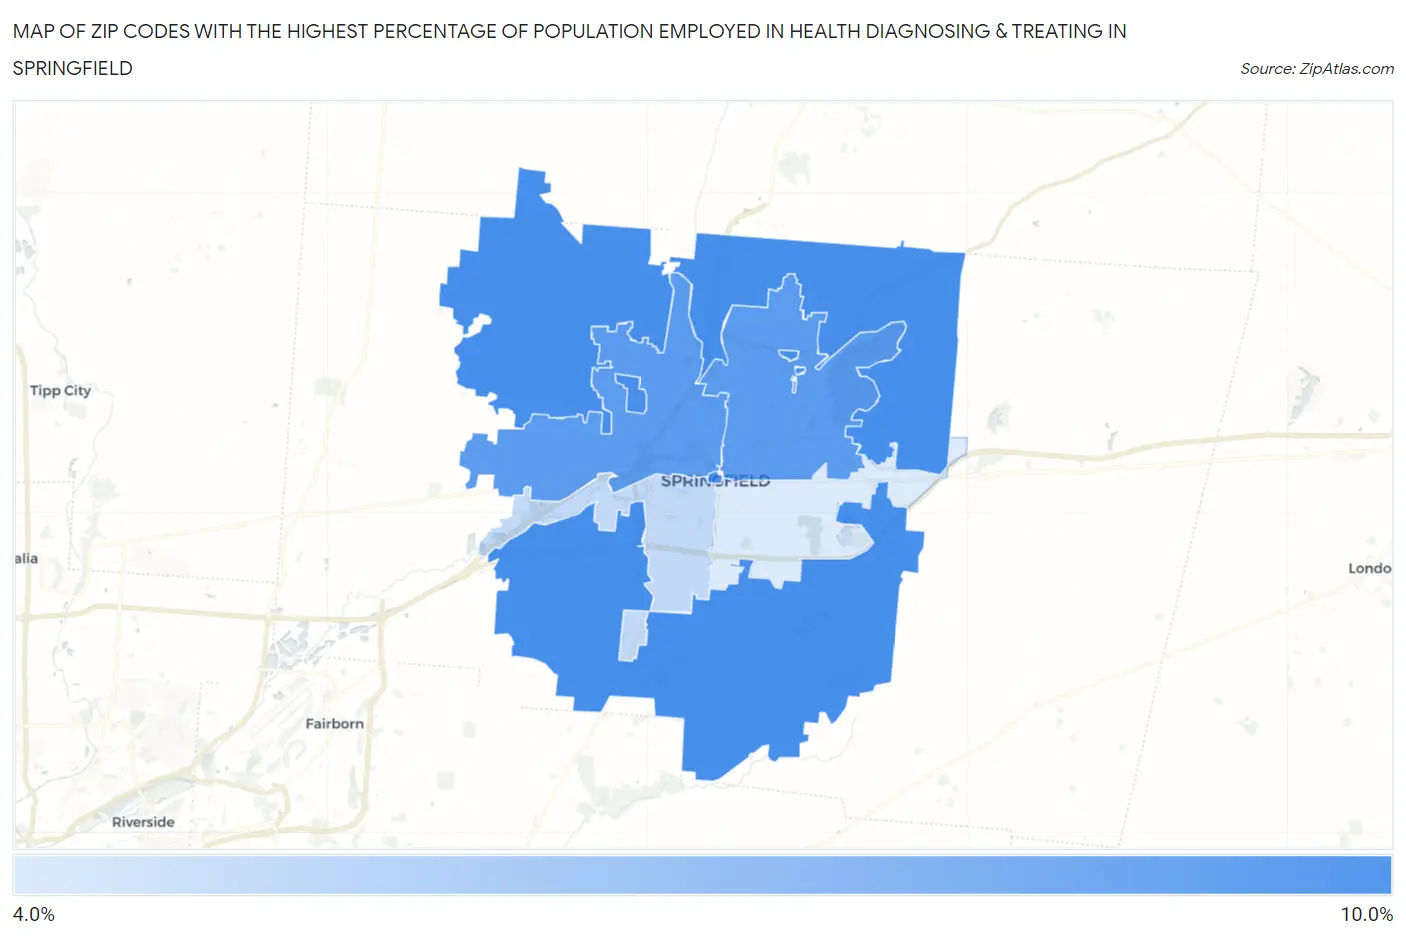
Map of Zip Codes with the Highest Percentage of Population Employed in Health Diagnosing & Treating in Springfield
4.6%
8.8%
Zip Codes with the Highest Percentage of Population Employed in Health Diagnosing & Treating in Springfield, OH
| Zip Code | % Employed | vs State | vs National | |
| 1. | 45502 | 8.8% | 7.2%(+1.62)#259 | 6.2%(+2.53)#5,784 |
| 2. | 45504 | 8.2% | 7.2%(+1.06)#323 | 6.2%(+1.96)#6,996 |
| 3. | 45503 | 8.2% | 7.2%(+1.04)#325 | 6.2%(+1.95)#7,026 |
| 4. | 45506 | 5.3% | 7.2%(-1.81)#701 | 6.2%(-0.899)#16,379 |
| 5. | 45505 | 4.6% | 7.2%(-2.55)#806 | 6.2%(-1.64)#19,234 |
1
Common Questions
What are the Top 3 Zip Codes with the Highest Percentage of Population Employed in Health Diagnosing & Treating in Springfield, OH?
Top 3 Zip Codes with the Highest Percentage of Population Employed in Health Diagnosing & Treating in Springfield, OH are:
What zip code has the Highest Percentage of Population Employed in Health Diagnosing & Treating in Springfield, OH?
45502 has the Highest Percentage of Population Employed in Health Diagnosing & Treating in Springfield, OH with 8.8%.
What is the Percentage of Population Employed in Health Diagnosing & Treating in Springfield, OH?
Percentage of Population Employed in Health Diagnosing & Treating in Springfield is 5.6%.
What is the Percentage of Population Employed in Health Diagnosing & Treating in Ohio?
Percentage of Population Employed in Health Diagnosing & Treating in Ohio is 7.2%.
What is the Percentage of Population Employed in Health Diagnosing & Treating in the United States?
Percentage of Population Employed in Health Diagnosing & Treating in the United States is 6.2%.