Zip Codes with the Highest Percentage of Population Employed in Office & Administration in Springfield, OH
RELATED REPORTS & OPTIONS
Office & Administration
Springfield
Compare Zip Codes
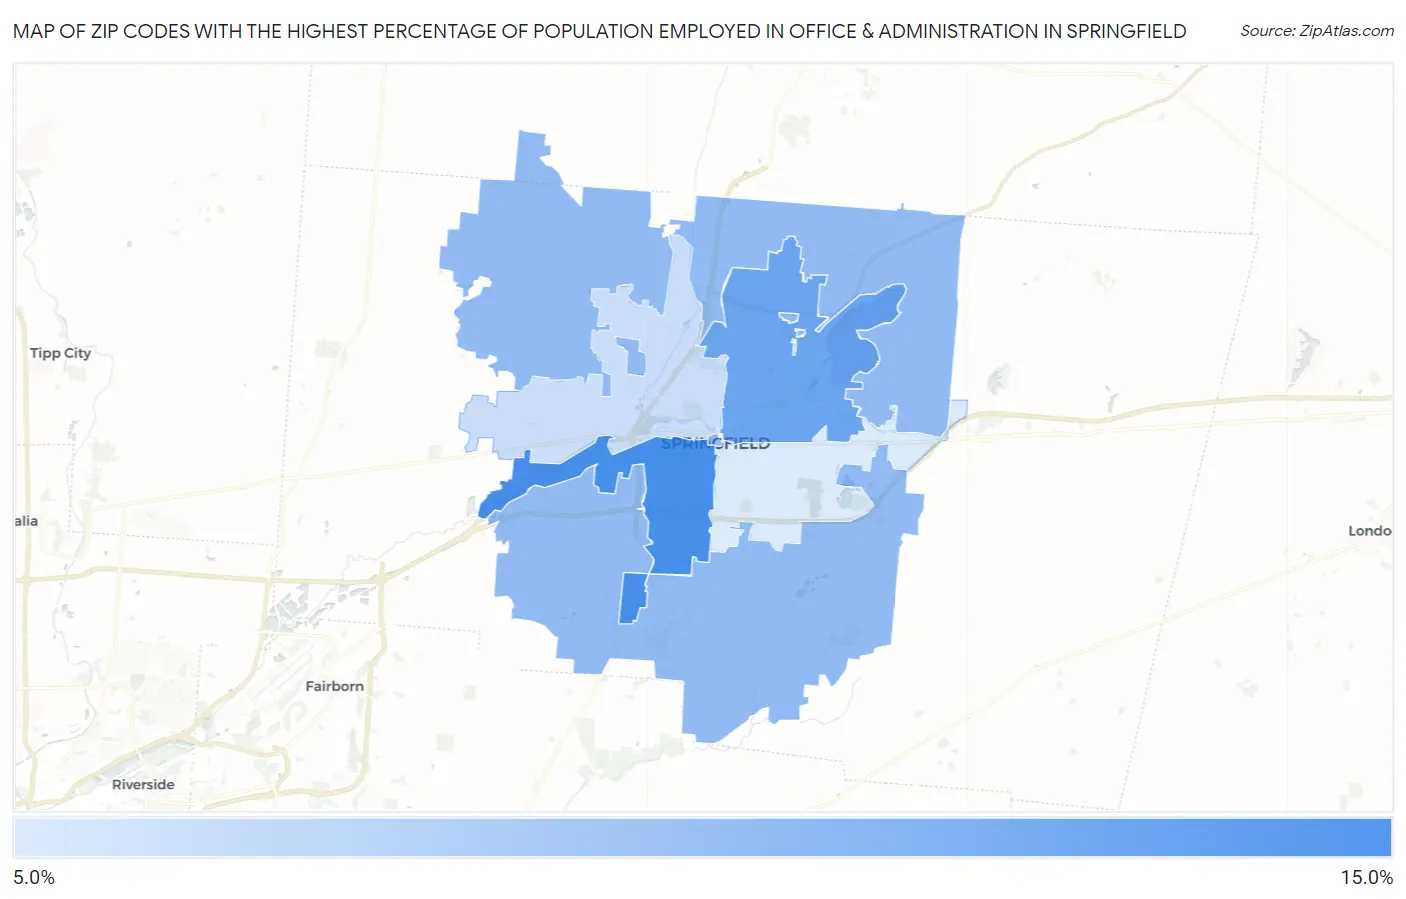
Map of Zip Codes with the Highest Percentage of Population Employed in Office & Administration in Springfield
9.4%
13.5%
Zip Codes with the Highest Percentage of Population Employed in Office & Administration in Springfield, OH
| Zip Code | % Employed | vs State | vs National | |
| 1. | 45506 | 13.5% | 11.3%(+2.28)#278 | 10.9%(+2.68)#6,850 |
| 2. | 45503 | 12.5% | 11.3%(+1.23)#357 | 10.9%(+1.63)#9,334 |
| 3. | 45502 | 11.5% | 11.3%(+0.268)#478 | 10.9%(+0.668)#12,191 |
| 4. | 45504 | 9.9% | 11.3%(-1.33)#699 | 10.9%(-0.932)#17,362 |
| 5. | 45505 | 9.4% | 11.3%(-1.82)#752 | 10.9%(-1.42)#18,967 |
1
Common Questions
What are the Top 3 Zip Codes with the Highest Percentage of Population Employed in Office & Administration in Springfield, OH?
Top 3 Zip Codes with the Highest Percentage of Population Employed in Office & Administration in Springfield, OH are:
What zip code has the Highest Percentage of Population Employed in Office & Administration in Springfield, OH?
45506 has the Highest Percentage of Population Employed in Office & Administration in Springfield, OH with 13.5%.
What is the Percentage of Population Employed in Office & Administration in Springfield, OH?
Percentage of Population Employed in Office & Administration in Springfield is 11.5%.
What is the Percentage of Population Employed in Office & Administration in Ohio?
Percentage of Population Employed in Office & Administration in Ohio is 11.3%.
What is the Percentage of Population Employed in Office & Administration in the United States?
Percentage of Population Employed in Office & Administration in the United States is 10.9%.