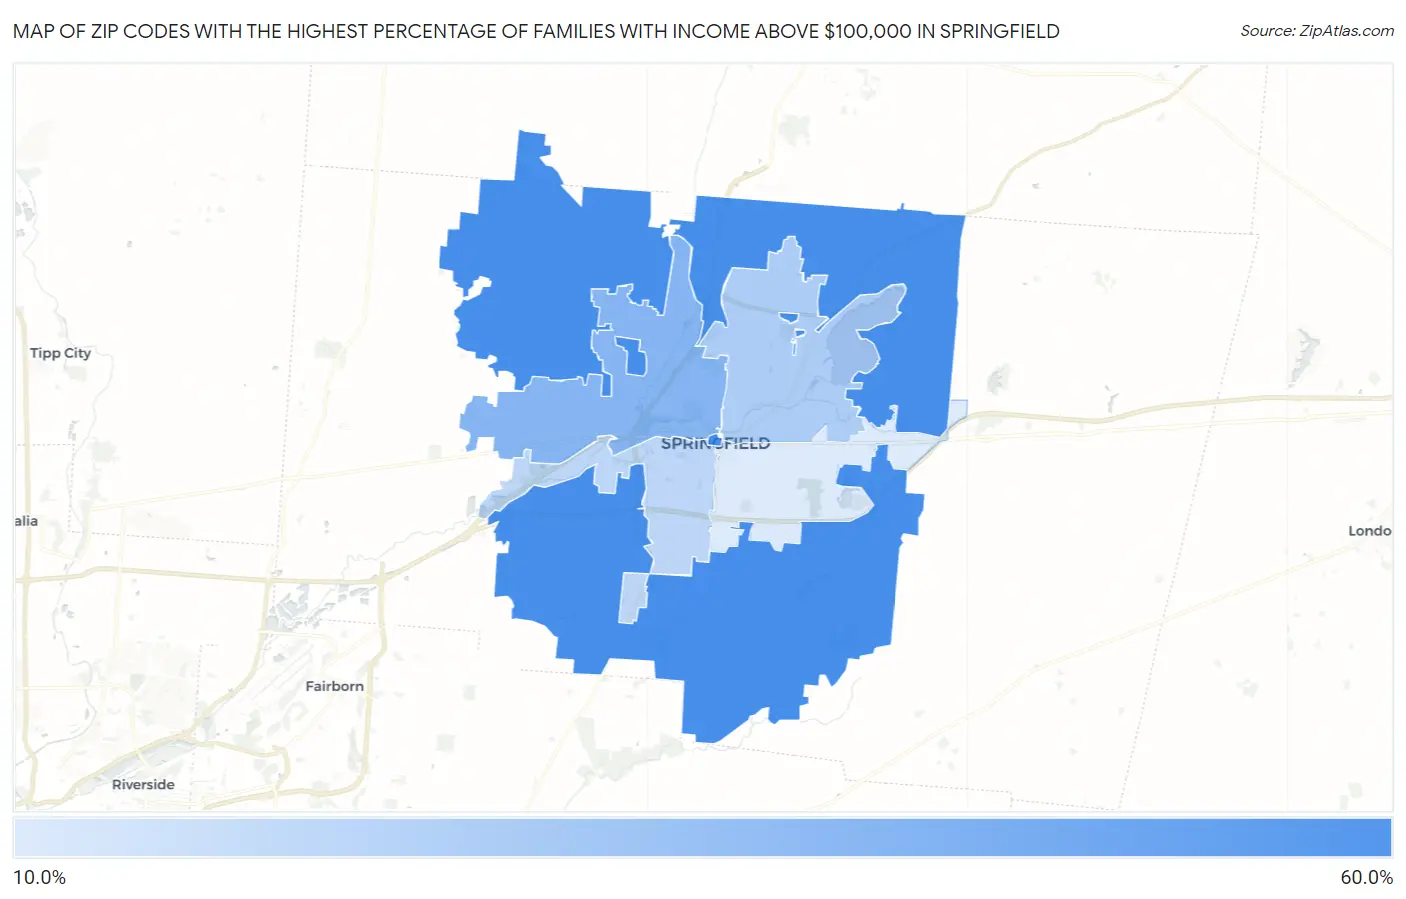
Zip Codes with the Highest Percentage of Families with Income Above $100,000 in Springfield, OH
RELATED REPORTS & OPTIONS
Family Income | $100k+
Springfield
Compare Zip Codes
Map of Zip Codes with the Highest Percentage of Families with Income Above $100,000 in Springfield
19.4%
50.4%
Zip Codes with the Highest Percentage of Families with Income Above $100,000 in Springfield, OH
| Zip Code | Families with Income > $100k | vs State | vs National | |
| 1. | 45502 | 50.4% | 42.3%(+8.10)#251 | 46.1%(+4.30)#8,654 |
| 2. | 45504 | 36.6% | 42.3%(-5.70)#578 | 46.1%(-9.50)#16,754 |
| 3. | 45503 | 28.5% | 42.3%(-13.8)#817 | 46.1%(-17.6)#22,442 |
| 4. | 45506 | 25.5% | 42.3%(-16.8)#898 | 46.1%(-20.6)#24,421 |
| 5. | 45505 | 19.4% | 42.3%(-22.9)#1,020 | 46.1%(-26.7)#27,511 |
1
Common Questions
What are the Top 3 Zip Codes with the Highest Percentage of Families with Income Above $100,000 in Springfield, OH?
Top 3 Zip Codes with the Highest Percentage of Families with Income Above $100,000 in Springfield, OH are:
What zip code has the Highest Percentage of Families with Income Above $100,000 in Springfield, OH?
45502 has the Highest Percentage of Families with Income Above $100,000 in Springfield, OH with 50.4%.
What is the Percentage of Families with Income Above $100,000 in Springfield, OH?
Percentage of Families with Income Above $100,000 in Springfield is 21.0%.
What is the Percentage of Families with Income Above $100,000 in Ohio?
Percentage of Families with Income Above $100,000 in Ohio is 42.3%.
What is the Percentage of Families with Income Above $100,000 in the United States?
Percentage of Families with Income Above $100,000 in the United States is 46.1%.