Zip Codes with the Highest Percentage of Households with Income Above $200,000 in Springfield, OH
RELATED REPORTS & OPTIONS
Household Income | $200k+
Springfield
Compare Zip Codes
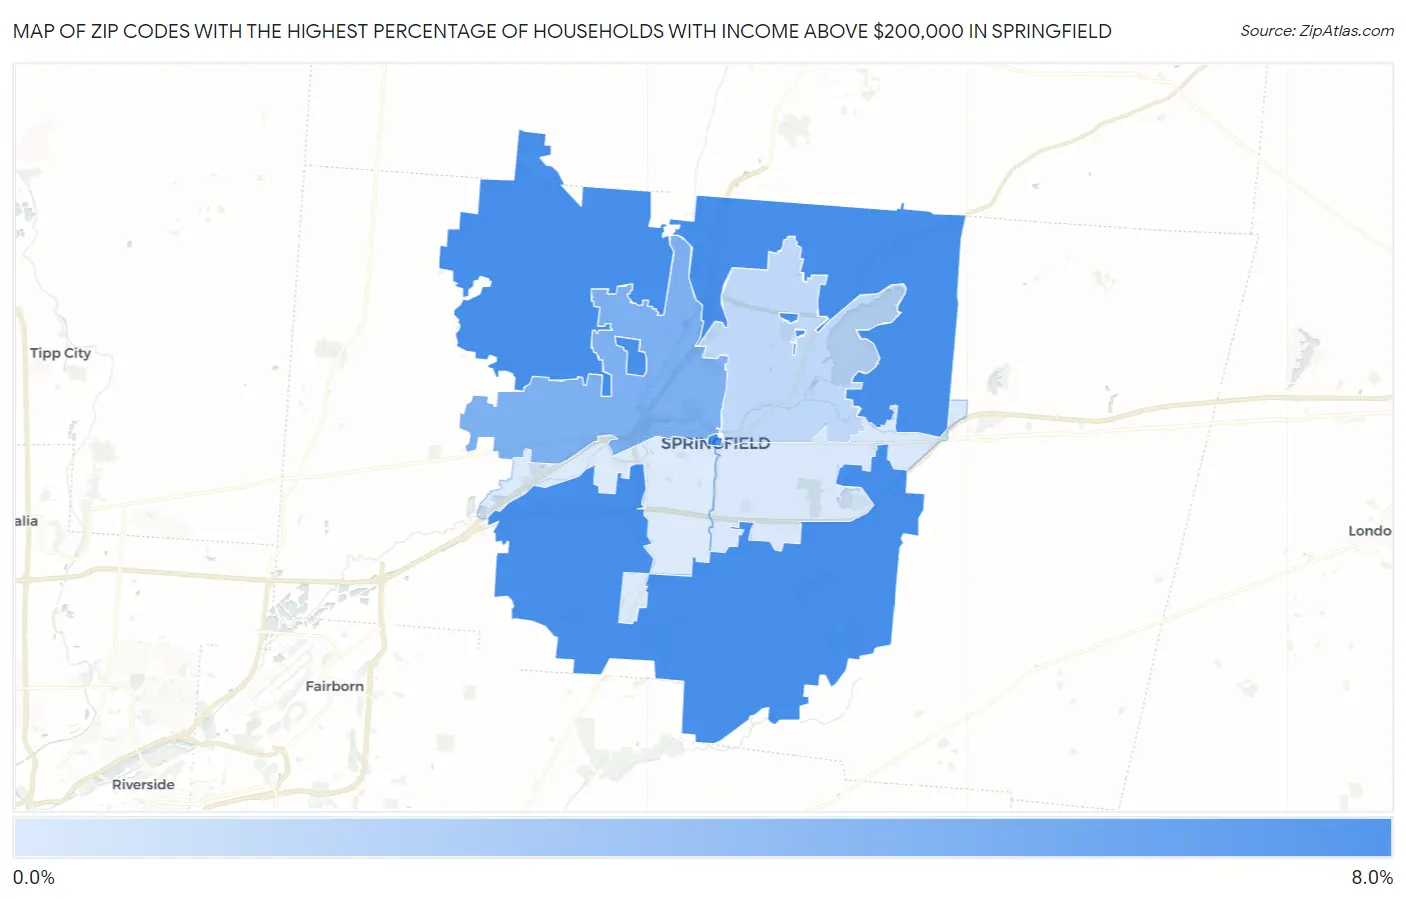
Map of Zip Codes with the Highest Percentage of Households with Income Above $200,000 in Springfield
1.2%
7.3%
Zip Codes with the Highest Percentage of Households with Income Above $200,000 in Springfield, OH
| Zip Code | Households with Income > $200k | vs State | vs National | |
| 1. | 45502 | 7.3% | 7.6%(-0.300)#285 | 11.4%(-4.10)#11,359 |
| 2. | 45504 | 5.1% | 7.6%(-2.50)#447 | 11.4%(-6.30)#15,346 |
| 3. | 45503 | 2.4% | 7.6%(-5.20)#774 | 11.4%(-9.00)#22,623 |
| 4. | 45505 | 1.3% | 7.6%(-6.30)#899 | 11.4%(-10.1)#25,534 |
| 5. | 45506 | 1.2% | 7.6%(-6.40)#908 | 11.4%(-10.2)#25,768 |
1
Common Questions
What are the Top 3 Zip Codes with the Highest Percentage of Households with Income Above $200,000 in Springfield, OH?
Top 3 Zip Codes with the Highest Percentage of Households with Income Above $200,000 in Springfield, OH are:
What zip code has the Highest Percentage of Households with Income Above $200,000 in Springfield, OH?
45502 has the Highest Percentage of Households with Income Above $200,000 in Springfield, OH with 7.3%.
What is the Percentage of Households with Income Above $200,000 in Springfield, OH?
Percentage of Households with Income Above $200,000 in Springfield is 1.8%.
What is the Percentage of Households with Income Above $200,000 in Ohio?
Percentage of Households with Income Above $200,000 in Ohio is 7.6%.
What is the Percentage of Households with Income Above $200,000 in the United States?
Percentage of Households with Income Above $200,000 in the United States is 11.4%.